workshop preprints quasoq2015 - swc · workshop preprints quasoq2015. 3. rd. ... himanshu singh,...
TRANSCRIPT

Workshop Preprints
QuASoQ 20153rd International Workshop on Quantitative Approaches to Software Quality
co-located with APSEC 2015New Delhi, December 1st, 2015
Editors:
Horst Lichter, RWTH Aachen University, GermanyToni Anwar, UTM Johor Bahru, MalaysiaThanwadee Sunetnanta, Mahidol University, ThailandMatthias Vianden, Aspera GmbH, Aachen, Germany

Table of Contents
An Industrial Case Study on Improving Quality in Integrated Software Product using defect dependency
3
Sai Anirudh Karre and Y. Raghu Reddy
Automatic Recommendation of Software Design Patterns Using Anti-patterns in the Design Phase: A Case Study on Abstract Factory
11
Nadia Nahar and Kazi Sakib
Correctness of Semantic Code Smell Detection Tools 19 Neeraj Mathur and Y. Raghu Reddy
A Decision Support Platform for Guiding a Bug Triage for Resolver Recommendation Using Textual and Non-Textual Features
25
Ashish Sureka, Himanshu Singh, Manjunat Bagewadi, Abhishek Mitra and Rohit Karanth
The Way Ahead for Bug-fix time Prediction 33 Meera Sharma, Madhu Kumari and V B Singh
Organization
Horst Lichter (Chair), RWTH Aachen University, Germany Toni Anwar (Co-Chair), UTM Johor Bahru, Malaysia Thanwadee Sunetnanta (Co-Chair), Mahidol University, Thailand Matthias Vianden (Co-Chair), Aspera GmbH, Aachen, Germany Wan M.N. Wan Kadir, UTM Johor Bahru, Malaysia Chumpol Krootkaew, NECTEC, Thailand Taratip Suwannasart, Chulalongkorn Univiversity, Thailand Tachanun Kangwantrakool, ISEM, Thailand Jinhua Li, Qingdao University, China Apinporn Methawachananont, NECTEC, Thailand Jarernsri L. Mitrpanont, Mahidol University, Thailand Nasir Mehmood Minhas, PMAS - AAUR Rawalpindi Pakistan Chayakorn Piyabunditkul, NSTDA, Thailand Sansiri Tanachutiwat, Thai German Graduate School of Engineering, TGGS, Thailand Hironori Washizaki, Waseda University, Japan Hongyu Zhang, Tsinghua University, China
QuASoQ 2015 Workshop Preprints
1

2
An Industrial Case Study on Improving Quality in
Integrated Software Product using defect dependency
Sai Anirudh Karre
Software Engineering Research Center
IIIT Hyderabad, India
Y. Raghu Reddy
Software Engineering Research Center
IIIT Hyderabad, India
Abstract – Product based organizations have diverse product
offerings that meet various business needs. The products are in
turn integrated to create integrated product suites. Rigorous
product engineering is a must for creation of high quality
integrated software products. Adequate measures must be taken
to improve quality of the integrated product before every release
of its module or sub-product. It is hard to imagine upgrading an
integrated software product with unidentified defects prior to its
release. In this paper, we share our observations on implementing
a defect dependency metric to identify the dependency of a defect
over a real-time industry defect dataset of an integrated software
product. This defect dependency metric was captured and
analyzed during release cycle(s) to avoid surprise issues post
product launch.
Keywords—integrated software products; software quality;
defect; defect dependency; software metric; product development;
rough-set theory; defect widespread
I. INTRODUCTION
Academic research in areas such as software architecture, automation frameworks and implementation methods has seen a tremendous growth in recent years and it has been observed that software industries apply them in real-time business to achieve better results [1][2]. Many software practitioners are currently trying to use methods and technologies proposed by academia to create products to the best of their abilities. There were many lessons learnt from industrial case studies over the past decade [3].
All new products are created with the intent of delivering better functional and quality objectives that meet or exceed end user expectations. Most software firms are now deliberately framing their mission statements with a ‘grow fast or die fast’ strategy before they hit the market with a high quality product. As per Gartner’s 2015 Magic Quadrant for Enterprise Integration Platform as a Service survey [4] most of the software industries that work on developing integrated software products still follow traditional approaches to develop and maintain quality standards of their existing products. As per their study, most of the new start-ups are concentrating on new trends in research for a better product(s) of similar class.
In most cases, it is easier for start-ups or new development projects to implement new trends in research on to software production. However it is a challenge for well-established and equipped products to adhere to these changes as it requires massive planning and human effort. Especially in integrated software, individual sub-products which are commonly referred
as product pillars are bound together loosely for various functional and business reasons. Integrated software products become vulnerable if its sub-products are bounded with too many integration defects. For example, let’s consider an integrated software product consisting of the following two sub-products: Supply-Chain product and Revenue Reporter product. Supply-chain sub-product generally tracks product billing while revenue reporter reports revenue. A common defect in the integrated product is rounding-off of the product price. As an end result, from an integrated product perspective, the revenue reports incorrect data. If the results are taken separately, rounding-off defect can be insignificant for chain-supply but critical for product billing. In such scenarios, the defect may be logged in different ways based on the product development team. The same defect may be considered as a severe defect for revenue reporter where as it may not even be logged in supply-chain [5]. Hence measuring the impact of such dependencies can be critical to the defect fix cycle and the release cycle.
Various methods have been proposed on detection of current defects and occurrence of defects, spanning the development life cycle. However, most of the methods revolve around defects in product rather than dependency of a defect over an entire product suite. Such a dependency measure can help quality teams to stabilize the product and avoid surprise defects post deployment. In this paper, we present a quantitative evaluation of the defect dependency metric introduced in our previous work. We realize the metric over a real-time industrial defect dataset of a large-scale integrated software product [5]. We discuss the consequences of the results that lead to creation of new practices and processes to improve development and testing methodologies of the integrated software product within the organization.
The primary author of this paper has been working in this domain for many years and has contributed to the integration of the integrated product suite in various roles. The primary author is also pursuing graduate studies on a part-time basis. Hence the authors could gain access to all the artifacts and the original data. Due to non-disclosure clauses, the name of the integrated product suite, its product pillars and the organization is being withheld. The product information shown in Table 1 makes use of alternate names to the existing (real) names. However the defect dataset presented in table II shows exactly the same numbers as present in the defect database for the various products and versions of the integrated software product.
The rest of the paper is organized as follows: Section II provides details of industrial examples of software quality
QuASoQ 2015 Workshop Preprints
3
related to our work, section III explains the background of defect dependency with an example along with study design of our work, and section IV details the implementation setup of defect dependency metric on an industry defect dataset. Section V talks about results of our implementation and observations identified during every new release of our integrated software product. Finally in section VI we discuss the threats to validity and present some insights about future work.
II. RELATED WORK
Software Quality Assurance (SQA) in integrated software products is a major activity during software production cycle. Advanced SQA practices were proposed by various researchers over past decade that became standard approaches in today’s software production release cycle. Functional integration approaches, strategies and methodologies to integrate software by its features were initially proposed [7]. Cost based effort estimation method [8] for integrated software architecture model-COTS was proposed and deduced quality measures to choose right resource for right task. Fedrik et al. proposed quality based methods to improve software integration [9]. In [10], new methods were proposed on software product integration by analyzing build statistics with real time products as applied examples. In contrast to the existing work, a quality based dependency model [13] capable of supporting software architecture as an evolution to software production was proposed. Improvements to integration methods in requirement analysis phase using a model based object oriented approach was proposed in [11].
Researchers have presented interesting methods on implementation of integration in global software projects and veracious trends in integration [12][15][20]. Zeng et al. discuss about an interesting integration framework that includes product design concepts as a collaborative feature during development in their work [14]. Software quality based integration challenges during design and implementation phases, and its consequences were listed out through an industrial case study of enterprise software product by Rognerud et al. [16]. Quality related observations on heterogeneous architectural model for efficient integration among software modules were proposed in [17]. Optimization methods in software integration with testing efforts and test complexity were analyzed [18]. Most significant work on integration bugs specific to dependency on requirements [19] are defined during project inception were recorded. Latest work on successful integration process [21] for large scale software was proposed along with quality improvements and between development and quality teams. In parallel there was significant amount of work on software defect prediction by Chengnian et al. [22] that can help industry understand future defects with prediction methods. Overall, there is a lot work on software quality, but specific research pertinent to defect widespread and dependency of a defect over a product is limited. There aren’t many practical implementations that provide examples of applying the defect dependency methods to case studies in industry. In this paper, we are trying to address this specific gap by producing our implementation results on an industry dataset.
III. STUDY DESIGN
In this section we provide an overview of the defect dependency metric and the real time industry dataset.
A. Defect Dependency Metric
Large-scale software products are complex and as such are prone to defects. Software quality teams have to perform rigorous checks before releasing a fix to a defect. This includes ensuring that the fix will not cascade new defect(s) into the product. The setup can be simple in case of small products but not for complex software products or an integrated product suite. Quality teams mostly face integration issues with incorrect control flow and data flow between the sub-products or sub-modules with in entire integrated product. It is also tough to detect and track the source of a defect in a complex integrated system as this involves various other quality teams from different sub-products. Firms that integrate products due mergers and acquisitions have different set of challenges as these products may have evolved independently but not in an integrated fashion. In such a scenario, it is essential for product owners to understand the impact the defect so as to mitigate possible surprise defects from other modules of the integrated product. We introduced defect dependency metric to address this specific concern in our previous paper [5]. We proposed a Defect dependency metric (D*) to calculate defect dependency by demonstrating the application of Generalized Dependency degree (Г) using rough set theory [6].
Defect dependency can be defined as a metric to study the widespread of a defect with unknown impact and unknown risk over a module(s) or component(s) or sub-product(s) of a software product(s). Defect dependency can be calculated for any software of any size, however heuristically it is more applicable for complex systems as it is difficult to comment on widespread of a defect without any evidence. Generalized Dependency degree (Г) is a mathematical approach to calculate the dependency between the equivalent classes generated by equivalence relation using disjoint sets. Initial study using this approach was proposed in Rough Set theory and was later studied by Halxuan et al [23].
Consider a rough set over an information system, it can be
defined as an approximation space as a pair as S= (U, A)
where U is a non-empty finite set called universal set and A
is a equivalence relation defined on a U which is a nonempty
finite set of attributes i.e., a: U → Va for a ϵ A, where Va is
called the domain of a.
Here X be a subset of U, then the lower approximation of X
by A in S is defined as RX= {e ϵ U | [e] ⊆ A}, similarly the
upper approximation of X by A in S is defined as RX= {e ϵ
U | [e] ∩ A ≠ ∅} where [e] denotes the equivalence class
containing ‘e’.
If we redefine above definition in terms of a defect dependency approach, consider a defect dataset (D) of a large scale complex software product (L). Then:
QuASoQ 2015 Workshop Preprints
4
If P1, P2, P3, P4 …… PN are sub products of L, then consider
DP1, DP2, DP3, DP4…DPN are defect subsets of respective sub-
products of a universal defect dataset D.
S = (D, De) is an approximation space, where D is a non-
empty finite defect set and De is a equivalence relation
defined over all defect subsets DPi where {i ϵ 1,2,3….n}
To calculate the dependency of a defect subset attributes over another subset, we will evaluate the value for Г (Generalized dependency degree) which is defined as
D* = Г(O, H) = 1
|D|∑
|O(x) ∩ H(x)|
|H(x)| (1)
Here O & H are two equivalent classes generated over an equivalence relation framed from some disjoint sets of universal set D. We have utilized this method to find dependency of a defect on our industrial defect dataset. It is a simple mathematical approach to understand the dependency of a one set over another. Each data point in the dataset contains collection of attributes that are pre-processed such that it can be applied over dependency metric. If we map this method to our real time dataset, D is the total defect dataset of our enterprise software product, O and H are two equivalent classes of equivalent sets which constitutes defects of two different sub-products O and H. In case there are more than two sub-products, we need to generate equivalent sets of all the defect product sub-sets, constructs equivalence class and apply this formula. There is no definite scale to the defect dependency metric, however the value varies between 0 and 10.
B. About Industry Dataset
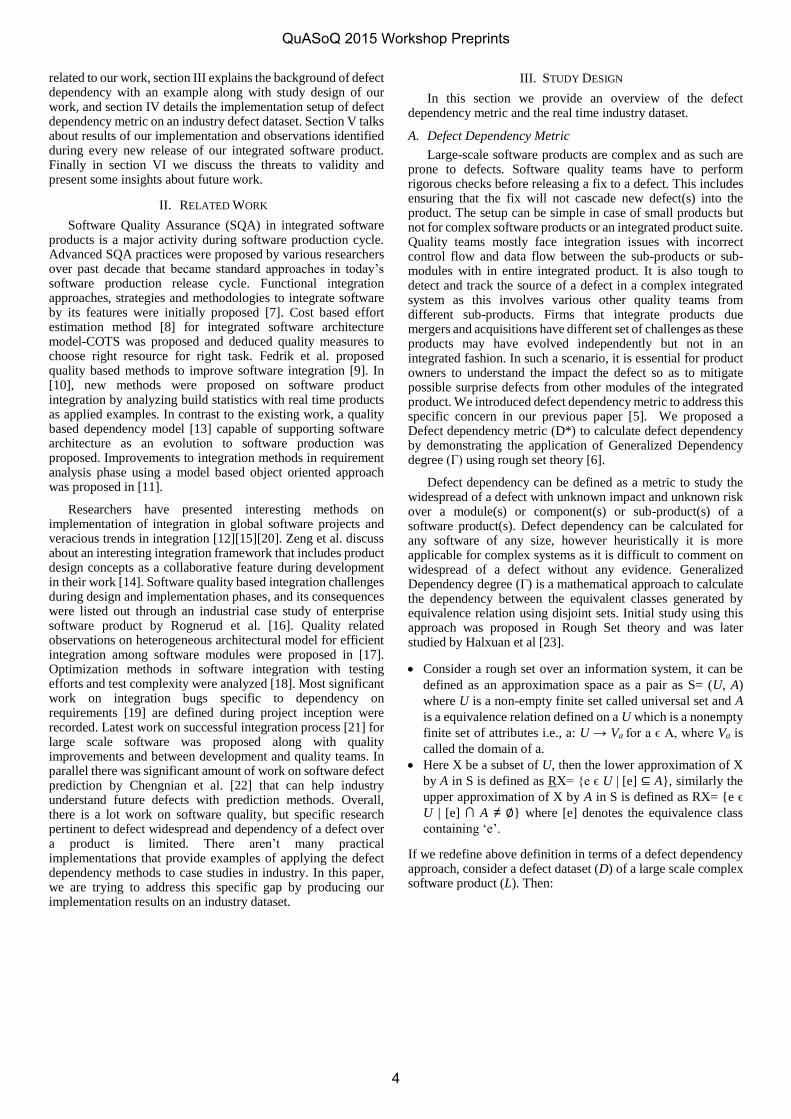
Our industry defect dataset contains defects of an Integrated Human Resource Integrated System (IHRIS) product with 5 primary product pillars (as shown in Table I) that are integrated as a single product suite. Each product pillar has sub-products that are implemented in an integrated mode. As stated earlier, due to non-disclosure clause, we are use the common derived names of product and their sub-products instead of the original product names.
This integrated product is deployed as Software-as-Service, Stand-alone Hosted and On-premise subscription for most of the fortune 500 companies. New service pack is released and deployed (includes feature changes or major fixes to the defects) once every 2 months in a calendar year to all the customer instances. Also a maintenance pack is released twice a month in a calendar year that includes minor fixes for the defects reported between the release timeline. All the above products once cross-sold and deployed as individual products are now deployed as an integrated suite, i.e. all users accessing the integrated suite will be able to access respective product(s) or sub-product(s) as per their role permissions defined by the global administrator of the product suite.
The defect dataset constitutes defects from all the products and sub-products of the integrated suite that are extracted from the defect database of a defect tracking tool called JIRA™. Dataset contains defects raised by QA teams every sprint cycle along with defects reported by customers post product
deployment. The authors worked with quality assurance teams and customers to extract the defects from the sprint cycles and evaluated the data using product managers’ inputs.
TABLE I. PRODUCT INFORMATION
S. No Product Sub-product
1 Learning Management
System (LMS)
Admin Mgmt.
Learner mode
Manager mode
2 Human Resource
System (HRS)
Hire Mgmt.
Compensation Mgmt.
Succession Mgmt.
Performance Mgmt.
3 Business Intelligence
System (BIS)
BI Dashboards
Data Downloader
Data Uploader
4 Work force Manager
(WFM)
Attendance Mgmt.
Payroll Mgmt.
Reimbursement Mgmt.
5 Web Services Manager
(WSM)
Export Mgmt.
Integration Mgmt.
Web Service Admin mode
C. Real Time example for Defect Dependency
To understand the need of studying defect dependency, we provide a real time industry scenario consisting of three defects reported in three different sub-products of IHRIS software:
Scenario: A manager uses the performance managementsub-product to perform an employee’s year-end performance assessment. The Manager rates employee’s performance (between 0-5) along with comments. As per the manager rating, a pre-defined compensation hike shall be added to the employer salary in compensation sub-product along with relevant tax calculations as per policy in payroll sub-product.
Defects: The sensitiveness of appraisal data necessitatesencryption while storage. So, decryption was necessary to view the data in other modules. Defect #191 is raised, as the decryption method is not honored by the numeric data in manager comments. Later defect #278 and #286 were recorded due to defect #191 but were practically difficult to trace within a complex product without performing a defect dependency study.
Observations: These three defects appear to be linked,however software quality teams normally would not have proactively identified defect #278 and #286 unless customers reported them. Defect#191 caused malfunction to compensation and payroll calculation. In cases like these, defect dependency study helps in detecting such defect spread and help product managers to prioritize defects accordingly.
QuASoQ 2015 Workshop Preprints
5
Defect#191 Incorrect Decryption of Manager and Employee comments
in Employee Performance Cycle
Module
(Product) Performance Mgmt. (HRS)
Cause Decryption algorithm incorrectly converts NUMERIC data
causing incorrect Manager ratings and comment
Fix Decryption logic updated to honour NUMERIC data in
Manager rating and comments during Performance Cycle.
Defect#278 Invalid hike % was imported to multiple users and
corrupted existing user hike information
Module
(Product) Compensation Mgmt. (HRS)
Cause Decryption logic in Performance Mgmt. caused issue.
Fix Exception handling is improved to handle Invalid data in
Compensation process cycle.
Defect#286 Unable to deduct monthly tax for Employees due to
mismatch in YTD employee payment in Payroll
Module
(Product) Payroll Mgmt. (WFM)
Cause Lack Exception handling in Performance Mgmt. caused
corruption in tax calculation.
Fix Created exception to deduct default monthly tax in case of
data corruption for Employee monthly payroll payments
D. Study Workflow
Below are the details of study workflow and teams involved.
The study was conducted over three service packs alongwith five maintenance packs of the above providedintegrated software suite. The study was done over aperiod of 9 months between September 2014 and July2015.
The entire defect dataset of integrated product has beenchosen and equivalence classes have been generated forall the sub-products and products.
Defect dependency metric is applied over theequivalence classes and the metric value is calculated forall the defects identified by quality assurance (QA) teamduring every weekly sprint cycle.
These defects include defects recorded during sprintcycle and defects raised by customers together. Themetric results are combination of two sources (QA teamand customers).
QA team will evaluate the results of the metric over postrelease defects and compare them with the currentdefects recorded during sprint cycle for regression.Primary aim of this exercise is to avoid the possiblespread of defects in upcoming release version.
The value of defect dependency metric is the indicatorfor improvement study. QA teams progressivelycompare the metric values every release and sprint cycle.
It has to be noted that there is no specific scale for thismetric as it always depends on size of the defects andattributes (products chosen to evaluate) from dataset.
QA Team shall present the results to productmanagement team so that defects can be prioritized andan executive decision can be taken on implementing aplan for a new feature for a stable product(s) or sub-product(s) in upcoming service packs.
E. Study Design
This section describes the steps involved on calculating the metric using the industry dataset with specific.
Each defect in this dataset is a data point. All sub-products are considered as subset i.e., there are 16 sub-products spread across 5 product pillars (shown in TableI). For example, if Web Services Manager is a pillarproduct, Export Mgmt., Integration Mgmt., and WebService Admin mode are its subsets.
Each set contains defects of its sub-product and they areentitled to be calculated together. Let D superset whichcontains defects of all sub-products i.e.
D = {p1 U p2 U p3 U…………….. U p16}
pi represents 16 sub-products from the enterprise product suite under union of D the superset.
Equivalence relation is constructed using all the pi setsconsidering all the entities of the individual sets
Equivalence classes are created for each pi setgenerating the classes of values that are common to allthe pi sets.
All equivalent classes of pi sets are now passed tocalculate Г(p1, p2,…, p16) to generate overall defectdependency metric D*
D* is now the metric standard for all the input pi set ofdefect for a specific release. This activity needs to becontinued for every release to understand thedependency of a defect over pi sets used to calculate D*
Post every release (including service pack andmaintenance pack), D* values are compared andreviewed to identify the improvement.
All the above steps are programmatically implemented using .NET 4.0 and SQL. Additional details in this regard are provided in the next section.
IV. IMPLEMENTATION SETUP
In addition to the standard testing process, QA team and product managers executed the below implementation and evaluation plan for of the defect dependency metric. Fig. 1 shows the implementation flow of the study setup. JIRATM is hosted against Microsoft SQL Server 2008 R2 at database level. Below ‘D’ is the JIRA defect database which stores defects raised by customers post product release and QA team during sprint cycle.
QuASoQ 2015 Workshop Preprints
6
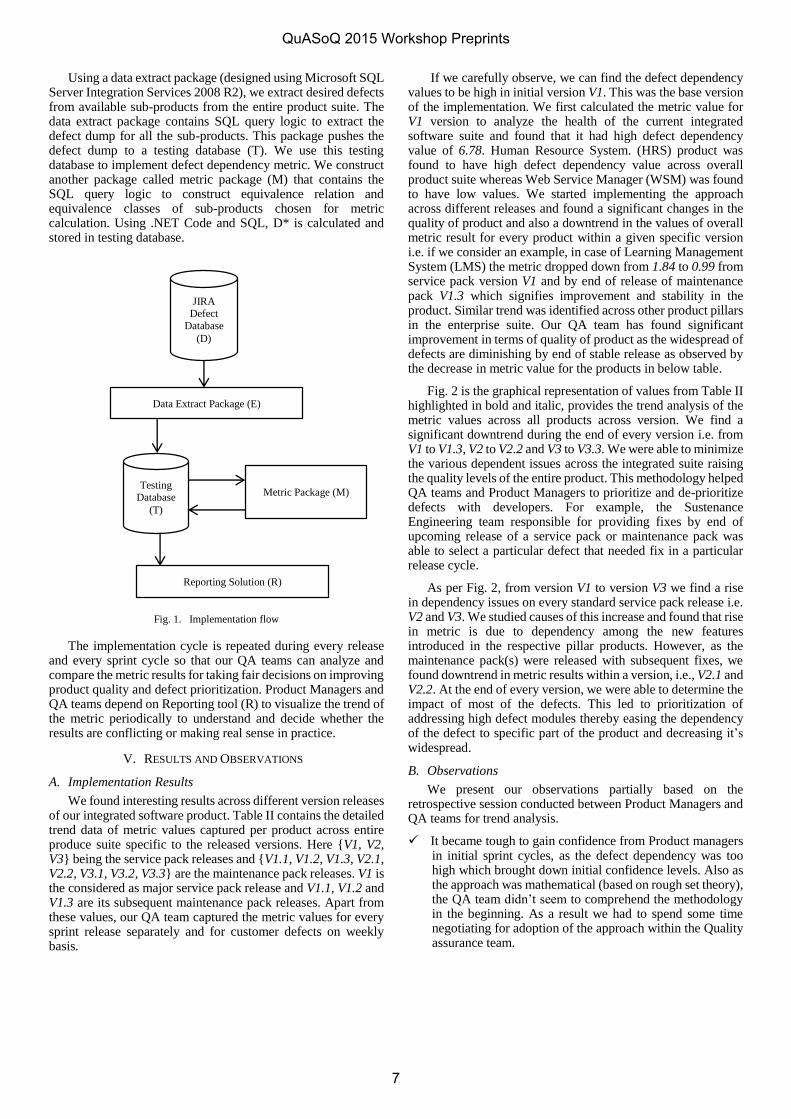
Using a data extract package (designed using Microsoft SQL Server Integration Services 2008 R2), we extract desired defects from available sub-products from the entire product suite. The data extract package contains SQL query logic to extract the defect dump for all the sub-products. This package pushes the defect dump to a testing database (T). We use this testing database to implement defect dependency metric. We construct another package called metric package (M) that contains the SQL query logic to construct equivalence relation and equivalence classes of sub-products chosen for metric calculation. Using .NET Code and SQL, D* is calculated and stored in testing database.
Fig. 1. Implementation flow
The implementation cycle is repeated during every release and every sprint cycle so that our QA teams can analyze and compare the metric results for taking fair decisions on improving product quality and defect prioritization. Product Managers and QA teams depend on Reporting tool (R) to visualize the trend of the metric periodically to understand and decide whether the results are conflicting or making real sense in practice.
V. RESULTS AND OBSERVATIONS
A. Implementation Results
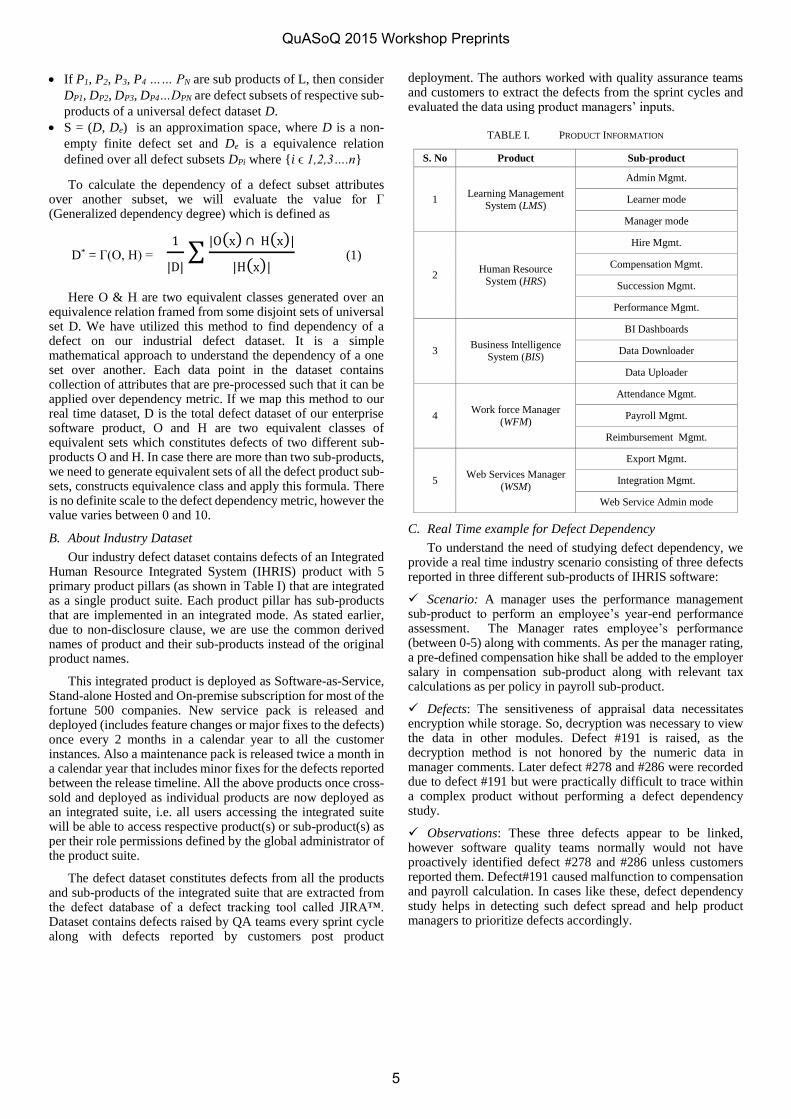
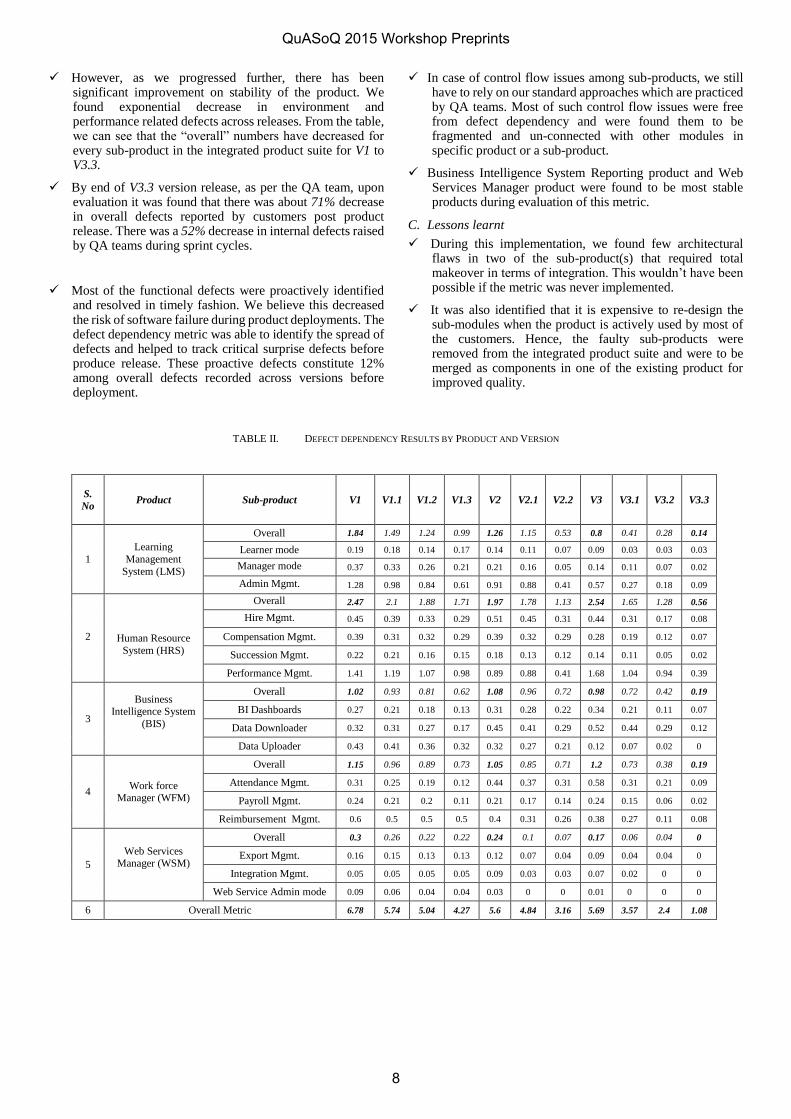
We found interesting results across different version releases of our integrated software product. Table II contains the detailed trend data of metric values captured per product across entire produce suite specific to the released versions. Here {V1, V2, V3} being the service pack releases and {V1.1, V1.2, V1.3, V2.1, V2.2, V3.1, V3.2, V3.3} are the maintenance pack releases. V1 is the considered as major service pack release and V1.1, V1.2 and V1.3 are its subsequent maintenance pack releases. Apart from these values, our QA team captured the metric values for every sprint release separately and for customer defects on weekly basis.
If we carefully observe, we can find the defect dependency values to be high in initial version V1. This was the base version of the implementation. We first calculated the metric value for V1 version to analyze the health of the current integrated software suite and found that it had high defect dependency value of 6.78. Human Resource System. (HRS) product was found to have high defect dependency value across overall product suite whereas Web Service Manager (WSM) was found to have low values. We started implementing the approach across different releases and found a significant changes in the quality of product and also a downtrend in the values of overall metric result for every product within a given specific version i.e. if we consider an example, in case of Learning Management System (LMS) the metric dropped down from 1.84 to 0.99 from service pack version V1 and by end of release of maintenance pack V1.3 which signifies improvement and stability in the product. Similar trend was identified across other product pillars in the enterprise suite. Our QA team has found significant improvement in terms of quality of product as the widespread of defects are diminishing by end of stable release as observed by the decrease in metric value for the products in below table.
Fig. 2 is the graphical representation of values from Table II highlighted in bold and italic, provides the trend analysis of the metric values across all products across version. We find a significant downtrend during the end of every version i.e. from V1 to V1.3, V2 to V2.2 and V3 to V3.3. We were able to minimize the various dependent issues across the integrated suite raising the quality levels of the entire product. This methodology helped QA teams and Product Managers to prioritize and de-prioritize defects with developers. For example, the Sustenance Engineering team responsible for providing fixes by end of upcoming release of a service pack or maintenance pack was able to select a particular defect that needed fix in a particular release cycle.
As per Fig. 2, from version V1 to version V3 we find a rise in dependency issues on every standard service pack release i.e. V2 and V3. We studied causes of this increase and found that rise in metric is due to dependency among the new features introduced in the respective pillar products. However, as the maintenance pack(s) were released with subsequent fixes, we found downtrend in metric results within a version, i.e., V2.1 and V2.2. At the end of every version, we were able to determine the impact of most of the defects. This led to prioritization of addressing high defect modules thereby easing the dependency of the defect to specific part of the product and decreasing it’s widespread.
B. Observations
We present our observations partially based on the retrospective session conducted between Product Managers and QA teams for trend analysis.
It became tough to gain confidence from Product managersin initial sprint cycles, as the defect dependency was toohigh which brought down initial confidence levels. Also asthe approach was mathematical (based on rough set theory),the QA team didn’t seem to comprehend the methodologyin the beginning. As a result we had to spend some timenegotiating for adoption of the approach within the Qualityassurance team.
JIRA
Defect
Database
(D)
Data Extract Package (E)
Reporting Solution (R)
Metric Package (M) Testing
Database
(T)
QuASoQ 2015 Workshop Preprints
7
However, as we progressed further, there has beensignificant improvement on stability of the product. Wefound exponential decrease in environment andperformance related defects across releases. From the table,we can see that the “overall” numbers have decreased forevery sub-product in the integrated product suite for V1 toV3.3.
By end of V3.3 version release, as per the QA team, uponevaluation it was found that there was about 71% decreasein overall defects reported by customers post productrelease. There was a 52% decrease in internal defects raisedby QA teams during sprint cycles.
Most of the functional defects were proactively identifiedand resolved in timely fashion. We believe this decreasedthe risk of software failure during product deployments. Thedefect dependency metric was able to identify the spread ofdefects and helped to track critical surprise defects beforeproduce release. These proactive defects constitute 12%among overall defects recorded across versions beforedeployment.
In case of control flow issues among sub-products, we stillhave to rely on our standard approaches which are practiced by QA teams. Most of such control flow issues were free from defect dependency and were found them to be fragmented and un-connected with other modules in specific product or a sub-product.
Business Intelligence System Reporting product and WebServices Manager product were found to be most stable products during evaluation of this metric.
C. Lessons learnt
During this implementation, we found few architecturalflaws in two of the sub-product(s) that required totalmakeover in terms of integration. This wouldn’t have beenpossible if the metric was never implemented.
It was also identified that it is expensive to re-design thesub-modules when the product is actively used by most ofthe customers. Hence, the faulty sub-products wereremoved from the integrated product suite and were to bemerged as components in one of the existing product forimproved quality.
TABLE II. DEFECT DEPENDENCY RESULTS BY PRODUCT AND VERSION
S.
No Product Sub-product V1 V1.1 V1.2 V1.3 V2 V2.1 V2.2 V3 V3.1 V3.2 V3.3
1
Learning
Management
System (LMS)
Overall 1.84 1.49 1.24 0.99 1.26 1.15 0.53 0.8 0.41 0.28 0.14
Learner mode 0.19 0.18 0.14 0.17 0.14 0.11 0.07 0.09 0.03 0.03 0.03
Manager mode 0.37 0.33 0.26 0.21 0.21 0.16 0.05 0.14 0.11 0.07 0.02
Admin Mgmt. 1.28 0.98 0.84 0.61 0.91 0.88 0.41 0.57 0.27 0.18 0.09
2 Human Resource
System (HRS)
Overall 2.47 2.1 1.88 1.71 1.97 1.78 1.13 2.54 1.65 1.28 0.56
Hire Mgmt. 0.45 0.39 0.33 0.29 0.51 0.45 0.31 0.44 0.31 0.17 0.08
Compensation Mgmt. 0.39 0.31 0.32 0.29 0.39 0.32 0.29 0.28 0.19 0.12 0.07
Succession Mgmt. 0.22 0.21 0.16 0.15 0.18 0.13 0.12 0.14 0.11 0.05 0.02
Performance Mgmt. 1.41 1.19 1.07 0.98 0.89 0.88 0.41 1.68 1.04 0.94 0.39
3
Business Intelligence System
(BIS)
Overall 1.02 0.93 0.81 0.62 1.08 0.96 0.72 0.98 0.72 0.42 0.19
BI Dashboards 0.27 0.21 0.18 0.13 0.31 0.28 0.22 0.34 0.21 0.11 0.07
Data Downloader 0.32 0.31 0.27 0.17 0.45 0.41 0.29 0.52 0.44 0.29 0.12
Data Uploader 0.43 0.41 0.36 0.32 0.32 0.27 0.21 0.12 0.07 0.02 0
4 Work force
Manager (WFM)
Overall 1.15 0.96 0.89 0.73 1.05 0.85 0.71 1.2 0.73 0.38 0.19
Attendance Mgmt. 0.31 0.25 0.19 0.12 0.44 0.37 0.31 0.58 0.31 0.21 0.09
Payroll Mgmt. 0.24 0.21 0.2 0.11 0.21 0.17 0.14 0.24 0.15 0.06 0.02
Reimbursement Mgmt. 0.6 0.5 0.5 0.5 0.4 0.31 0.26 0.38 0.27 0.11 0.08
5
Web Services Manager (WSM)
Overall 0.3 0.26 0.22 0.22 0.24 0.1 0.07 0.17 0.06 0.04 0
Export Mgmt. 0.16 0.15 0.13 0.13 0.12 0.07 0.04 0.09 0.04 0.04 0
Integration Mgmt. 0.05 0.05 0.05 0.05 0.09 0.03 0.03 0.07 0.02 0 0
Web Service Admin mode 0.09 0.06 0.04 0.04 0.03 0 0 0.01 0 0 0
6 Overall Metric 6.78 5.74 5.04 4.27 5.6 4.84 3.16 5.69 3.57 2.4 1.08
QuASoQ 2015 Workshop Preprints
8
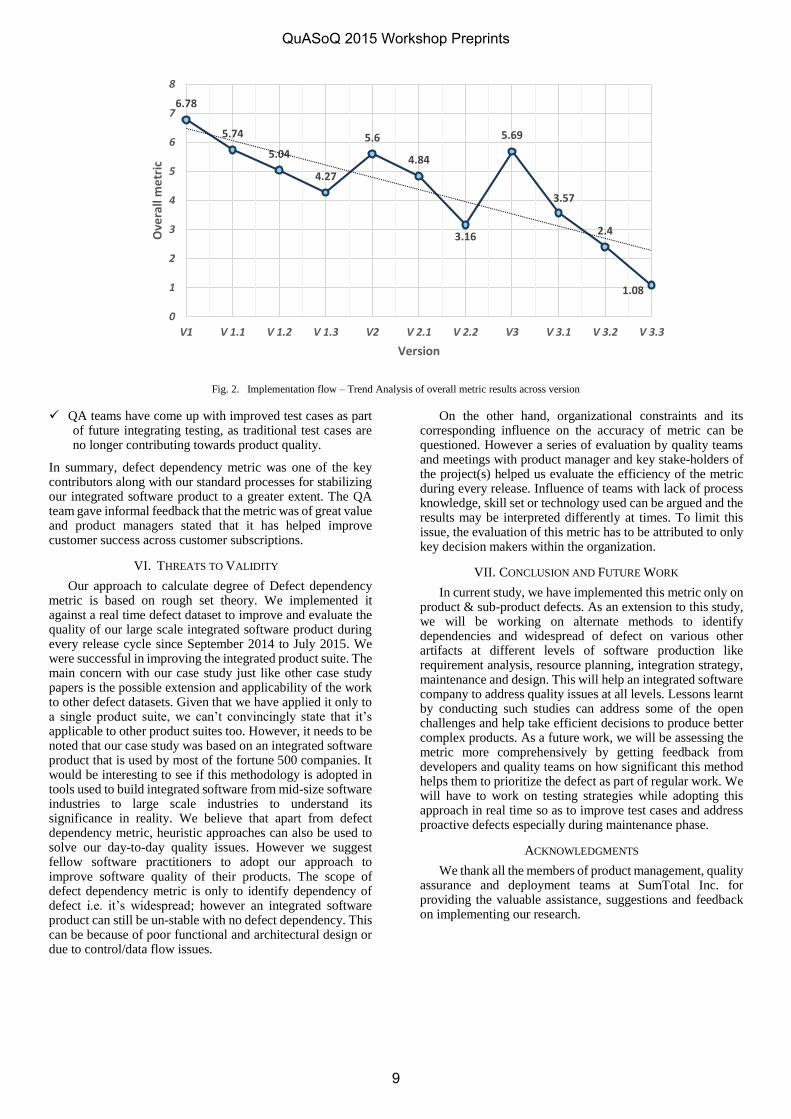
Fig. 2. Implementation flow – Trend Analysis of overall metric results across version
QA teams have come up with improved test cases as partof future integrating testing, as traditional test cases are no longer contributing towards product quality.
In summary, defect dependency metric was one of the key contributors along with our standard processes for stabilizing our integrated software product to a greater extent. The QA team gave informal feedback that the metric was of great value and product managers stated that it has helped improve customer success across customer subscriptions.
VI. THREATS TO VALIDITY
Our approach to calculate degree of Defect dependency metric is based on rough set theory. We implemented it against a real time defect dataset to improve and evaluate the quality of our large scale integrated software product during every release cycle since September 2014 to July 2015. We were successful in improving the integrated product suite. The main concern with our case study just like other case study papers is the possible extension and applicability of the work to other defect datasets. Given that we have applied it only to a single product suite, we can’t convincingly state that it’s applicable to other product suites too. However, it needs to be noted that our case study was based on an integrated software product that is used by most of the fortune 500 companies. It would be interesting to see if this methodology is adopted in tools used to build integrated software from mid-size software industries to large scale industries to understand its significance in reality. We believe that apart from defect dependency metric, heuristic approaches can also be used to solve our day-to-day quality issues. However we suggest fellow software practitioners to adopt our approach to improve software quality of their products. The scope of defect dependency metric is only to identify dependency of defect i.e. it’s widespread; however an integrated software product can still be un-stable with no defect dependency. This can be because of poor functional and architectural design or due to control/data flow issues.
On the other hand, organizational constraints and its corresponding influence on the accuracy of metric can be questioned. However a series of evaluation by quality teams and meetings with product manager and key stake-holders of the project(s) helped us evaluate the efficiency of the metric during every release. Influence of teams with lack of process knowledge, skill set or technology used can be argued and the results may be interpreted differently at times. To limit this issue, the evaluation of this metric has to be attributed to only key decision makers within the organization.
VII. CONCLUSION AND FUTURE WORK
In current study, we have implemented this metric only on product & sub-product defects. As an extension to this study, we will be working on alternate methods to identify dependencies and widespread of defect on various other artifacts at different levels of software production like requirement analysis, resource planning, integration strategy, maintenance and design. This will help an integrated software company to address quality issues at all levels. Lessons learnt by conducting such studies can address some of the open challenges and help take efficient decisions to produce better complex products. As a future work, we will be assessing the metric more comprehensively by getting feedback from developers and quality teams on how significant this method helps them to prioritize the defect as part of regular work. We will have to work on testing strategies while adopting this approach in real time so as to improve test cases and address proactive defects especially during maintenance phase.
ACKNOWLEDGMENTS
We thank all the members of product management, quality assurance and deployment teams at SumTotal Inc. for providing the valuable assistance, suggestions and feedback on implementing our research.
6.78
5.74
5.04
4.27
5.6
4.84
3.16
5.69
3.57
2.4
1.08
0
1
2
3
4
5
6
7
8
V1 V 1.1 V 1.2 V 1.3 V2 V 2.1 V 2.2 V3 V 3.1 V 3.2 V 3.3
Ove
rall
me
tric
Version
QuASoQ 2015 Workshop Preprints
9
REFERENCES
[1] Leupers, Rainer; RWTH Aachen; When, Norbert; Leupers, Rainer; Roodzant, Marco; Stahl, Johannes; Fanucci, Luca; Cohen, Albert; Janson, Bernd, “Technology transfer towards Horizon 2020”, In proceedings of Design, Automation and Test in Europe Conference and Exhibition (DATE), March 2014.
[2] Laird, L; Ye Yang, “Transferring Software Engineering Research into Industry: The Stevens Way”, In proceedings of IEEE/ACM 2nd International Workshop on Software Engineering Research and Industrial Practice (SER&IP), May 2015, pp.46-49
[3] Wohlin, C, “Empirical software engineering research with industry: Top 10 challenges”, In proceedings of 1st International Workshop on Conducting Empirical Studies in Industry (CESI), 2013, pp.43-46.
[4] Massimo Pazzini, Yefin V. Natis, Paolo Malinverno, Kimihiko Iijima, Jess Thompson, Eric Thoo and Keith Guttridge, “Magic Quadrant for Enterprise Integration Platform as a Service, Worldwide”, Gartner, March 2015, Report: G00270939.
[5] Sai Anirudh Karre, Y. Raghu Reddy, "A Defect Dependency approach to Improve Software Quality in Integrated Software products", International Conference on Evaluation of Novel Approaches to Software Engineering, Barcelona, April 2015, pp:110-117
[6] Pawlak Z, “Rough classification”, In International Journal of Human-Computer Studies, 1999, pp. 369–383
[7] Jim-Min Lin, "Cross-platform software reuse by functional integration approach", In proceedings of 21st International conference on Computer Software and Application Conference, Washington DC, USA, Aug 1997, pp:402-408
[8] Daniil Yakimovich, James M. Bieman, and Victor R. Basili, "Software architecture classification for estimating the cost of COTS integration", International Conference on Software Engineering, Los Angeles, USA, May 1999, pp:296-302
[9] Fedrik Ekdahl and Ivica Crnkovic, "How to Improve Software Integration", Information & Software Technology Journal, Elsevier, 2005.
[10] Stig Larsson and Ivica Crnkovic,"Product Integration Improvement Based on Analysis of Build Statistics", European Software Engineering Conference, Dubrovnik, Croatia, Sept 2007
[11] Chih-Hung Chang, Chih-Wei Lu , and Chu W.C, "Improving Software Integration from Requirement Process with a Model-Based Object-Oriented Approach", International Conference on Secure System Integration and Reliability Improvement, Yokohama, Japan, July 2008, pp:175-176
[12] Gotel O, Kulkarni V, Scharff C, and Neak L, "Integration Starts on Day One in Global Software Development Projects", IEEE International Conference on Global Software Engineering, Bangalore, India, Aug 2008, pp:244-248
[13] Hongyu Pei and Ivica Crnkovic,"Using dependency model to support software architecture evolution", 23rd IEEE/ACM International Conference Automated Software Engineering-Workshops, L'Aquila, Italy, Sept 2008, pp:82-91
[14] Pengfei Zeng and Yongping Hao, "Towards a Software Integration Framework in Product Collaborative Design Environment", International Conference on Computer Science and Software Engineering, Wuhan, Hubei, Dec 2008, pp: 527-530
[15] Campbell, M., "The Future of Test-Product Integration and its Impact on Test", 24th IEEE International Symposium on Defect and Fault Tolerance in VLSI Systems, Chicago, USA, Oct 2009.
[16] Rognerud H.J, Hannay J.E,"Challenges in enterprise software integration: An industrial study using repertory grids", International Symposium on Empirical Software Engineering and Measurement, Lake Buena Vista, USA, Oct 2009, pp:11-22
[17] Chong-chong Zhao and Li-yong Zhao, "The research about software integration oriented heterogeneous architecture style", International Conference on Software Engineering and Data Mining, Chengdu, China June 2010, pp:311-315
[18] Steindl M and Mottok J, "Optimizing software integration by considering integration test complexity and test effort", In proceedings of 10th Workshop on Intelligent Solutions in Embedded Systems, Klagenfurt, Austria, July 2012, pp:63-68
[19] Junjie Wang, Juan Li, Qing Wang "Can requirements dependency network be used as early indicator of software integration bugs?", Rio De Janeiro, Brazil, July 2013, pp:185-194
[20] Jun He and Chandler, "Package reliability and performance trends in an era of product integration", 2014 IEEE International Reliability Physics Symposium, Waikoloa, Hawaii, June 2014, pp:2F.1.1-2F.1.5
[21] Yujuan Jiang, "Improving the integration process of large software systems", IEEE 22nd International Conference on Software Analysis, Evolution and Re-engineering, Montreal, Canada, March 2015, pp:598
[22] Yuan Tian, David Lo, Chengnian Sun: “DRONE: Predicting Priority of Reported Bugs by Multi-factor Analysis” In proceedings of International Conference on Software Maintaince (ICSM), Netherlands, Sept 2013, pp. 200-209
[23] Halxuan, Irwin, Michael, “Generalized Dependency Degree Between attributes”, In proceedings of Journal of the American Society for Information Science and Technology, Sept 2007, pp:2280-2294
QuASoQ 2015 Workshop Preprints
10
Automatic Recommendation of Software DesignPatterns Using Anti-patterns in the Design Phase:
A Case Study on Abstract Factory
Nadia Nahar∗ and Kazi Sakib†Institute of Information Technology, University of Dhaka, Dhaka, Bangladesh
∗[email protected], †[email protected]
Abstract—Anti-patterns, one of the reasons for software designproblems, can be solved by applying proper design patterns. Ifanti-patterns are discovered in the design phase, this should leadan early pattern recommendation by using relationships betweenanti- and design patterns. This paper presents an idea called Anti-pattern based Design Pattern Recommender (ADPR), that usesdesign diagrams i.e. class and sequence diagrams to detect anti-patterns and recommend corresponding design patterns. First ofall, anti-patterns relating to specific design patterns are analyzed.Those anti-patterns are detected in the faulty software design toidentify the required design patterns. For assessment, a case studyis shown along with the experimental result analysis. Initially,ADPR is prepared for recommendation of the Abstract Factorydesign pattern only, and compared to an existing code-basedrecommender. The comparative results are promising, as ADPRwas successful for all cases of Abstract Factory.
Keywords—Software design, design pattern, anti-pattern, designpattern recommendation, abstract factory
I. INTRODUCTION
Design patterns formalize reusable solutions for commonrecurring problems, while anti-patterns are outcome of badsolutions degrading the quality of software. Design patternsare often mentioned as double-edged sword, selecting the rightpattern can produce good-quality software while selecting awrong one (anti-pattern) makes it disastrous [1]. Thus, whichpatterns to use in which situation, is a wise decision to take.On the contrary, mapping software usage scenario or userdescription with pattern intent is a manual and hectic task.However, this task can be made easier with assistance ofpattern recommendation systems.The recommendation of a proper design pattern is yet a faultyprocess due to the difficulties in connecting software infor-mation with design pattern intents. The software requirementsdo not contain possible design problems’ indication, makingit infeasible to identify the required patterns. However, anti-patterns can be detected after a faulty design is created fromuser requirements. Now, as every design pattern has its owncontext of design problems that it solves and every anti-patterncauses specific design problems, a relationship should existbetween anti- and design patterns that can be beneficial inpattern recommendation.This paper presents the idea of incorporating anti-pattern detec-tion and design pattern recommendation in the software designphase. This idea is encapsulated in a tool named as Anti-pattern based Design Pattern Recommender (ADPR). The toolrecommends appropriate patterns in two phases. The analysis
of anti-patterns of particular design patterns is conducted inthe first phase. For capturing the full anti-pattern informationi.e. class structure, interactions, and linguistic relationships, theanalysis is performed in three levels - structural, behavioral andsemantic analysis. In the second phase, the inputted system ismatched with those anti-patterns for recommending the relateddesign patterns. This matching is also conducted in threelevels similar as the levels of analysis - structural, behavioraland semantic matching. Based on the matched anti-patternsfrom these levels, the corresponding ‘missing [2]’ designpatterns are recommended. ADPR is initially designed for therecommendation of Abstract Factory as it is one of the mostpopular patterns, and can be extended to the other patterns.Research has been conducted for proposing pattern recom-mendation systems. However, those cannot provide a goodprecision due to the difficulty in logically defining the manualprocess of mapping human requirements with design patternintents. The human requirements i.e. usage scenario, designers’answers to questions or cases residing in the knowledge basein Case Based Reasoning (CBR), have been inadequate toaccurately extract the required design patterns because of thelack of focus on the design problems. Generally, these threeapproaches of design pattern recommendation can be foundin the literature - textual matching of software usage scenariowith design pattern intents [3], [4], [5], question answer sessionwith designers [6], [7], and CBR [8], [9]. The first approachis inefficient to identify probable design problems of softwareas scenario does not contain design information. The genericquestions of the second approach focuses more on designpattern features than design problems of particular software.In the third approach, cases of CBR does not store possibledesign problems of software. Oppositely, the field of anti-pattern detection identifies bad designs in software, assuringthat successful detection of anti-patterns is possible [10], [11].However, the usage of anti-pattern in the design phase foridentifying correct design patterns is yet to be discovered.A case study has been conducted for evaluating the applica-bility of the proposed approach. The case study is carried on abadly designed java project requiring Abstract Factory, namedas Painter. Based on the step-by-step analysis on the project,Abstract Factory is recommended by the tool. This case studyjustifies the approach that, this recommendation process leadsto the correct recommendations.The validity of this approach is further justified by experiment-ing ADPR on the case of Abstract Factory design pattern. Forthis, the prototype of ADPR was implemented for AbstractFactory using java. Moreover, implementation of a prominent
QuASoQ 2015 Workshop Preprints
11
research on source based design pattern recommendation,proposed by Smith et al. [12], was also performed for thecomparison. The dataset were created by gathering projectsthat require Abstract Factory, but intentionally has not beenapplied. The results are encouraging as ADPR provides betterrecommendation results in the design phase of software, com-pared to the source based one operating in the coding phase.
II. RELATED WORK
In terms of recommending suitable patterns for software,the relationship establishment between the design pattern andanti-pattern is rare in the literature. Yet investigations havebeen conducted for proposing design pattern recommendationapproaches from different perspectives as mentioned below.On the other hand, anti-pattern detection is a well-establishedresearch trend for successfully identifying anti-patterns tocheck whether the software design is bad.
A. Design Pattern Recommendation
As mentioned earlier, design pattern recommendation re-searches can be divided into three types – text-based search,question-answer session, and CBR. In text-based search, pat-tern intents are matched with the problem scenarios for iden-tifying the design patterns that relate mostly to the software[3], [4], [5]. This intent matching is based on set of importantwords [3], text classification [4], or query text search usingInformation Retrieval (IR) techniques [5]. However, problemscenarios are ambiguous as written in human language; and areusually not written from a designer’s point of view, making itimpractical to identify possible design problems.In question-answer based approach, designers are asked toanswer some questions about the software and those answerslead to find the required patterns for that software [6], [7].Here, the mapping from question-answers to design patternsis set by formulating Goal-Question-Metric (GQM) model [6],or ontology-based techniques [7]. The problem is that, thequestions are often static or generic, and more related to designpattern features than software specific design problems.In CBR, recommendations are given according to the previousexperiences of pattern usage stored in a knowledge base inthe form of cases [8], [9]. The retrieval of cases from theknowledge base is performed either using user provided classdiagrams [8], or using inputted and reformulated problemdescriptions [9]. Matching cases to identify required patternsare not feasible, as the cases do not focus on the designproblems a software might have.A few researches were conducted for recommending patternswhich do not fall in any of the mentioned categories. Navarro etal. proposed a different recommendation system for suggestingadditional patterns to the designer while a collection of patternsare already selected [13]. Thus, it may not be used for newsoftware being developed. Kampffmeyer et al. presented a newontology based formalization of the design patterns’ intentsmaking those focus on the problems rather than the solutionstructures [14]. However, the problem predicate and conceptconstraints, required by the recommendation tool, makes it’susage challenging. Both of these approaches require expertizeof the designers to use those effectively.The research question of this paper is to use anti-patternknowledge for design pattern recommendation in the design-phase of software. The most related paper of this research
is a code-level design pattern recommendation approach [12],where patterns are recommended dynamically during the codedevelopment phase. That research tried to relate anti-patternswith design patterns for recommendation. Anti-patterns wereidentified using structural and behavioral matching in the code,and required design patterns to mitigate those anti-patternswere recommended. However, design pattern recommendationin the coding phase is too late as the software has already beendesigned and needed to be changed after the recommendation.
B. Anti-pattern Detection
Anti-pattern detection is a rich area of research, thatfocuses on finding bad designs in software [15], [16],[17], [18]. Fourati et al. proposed an anti-pattern detectionapproach in design level using UML diagrams i.e. the classand sequence diagrams [10]. The detection was done basedon some predefined threshold values of metrics, identifiedthrough structural, behavioral and semantic analysis. Thisprominent research assures that anti-pattern detection canbe performed in the design phase. Another approach foranti-pattern detection was based on Support Vector Machines(SVM) [11], where the detection task was accomplished inthree steps - metric specification, SVM classifier trainingand detection of anti-pattern occurrences. The concept ofanti-pattern training has made any defined or newly definedanti-patterns detection possible, breaking the boundary ofonly detection of some well-established anti-patterns (e.g.Blob, Lava Flow, Poltergeists, etc.) [19].
As presented in subsection II-A, the existing approachesof design pattern recommendation in design phase use textualmatch with usage scenario, case match with knowledge basecases, or ask design pattern related generic questions todesigners. These approaches cannot be the proper ways torecommend design patterns, as design patterns are used formitigating design problems, and these do not focus on thesystem design problems. The single paper that focuses ondesign problems (anti-patterns), recommends design patternsin the coding phase, making its usage impractical.
III. THE PROPOSED APPROACH
The novelty of this research lies in identifying designproblems of software for recommending appropriate designpatterns, and in the design phase of software. Without havingthe analysis of bad designs (i.e. anti-patterns), suggesting cor-rect design patterns is difficult. So, an idea is formalized, wherethe appropriate design patterns are suggested from identifyingexisting design problems, that reside as anti-patterns in theinitial system design.
A. Overview of ADPRExistence of an anti-pattern in a software design discloses
that the design is not appropriate; the design can be improvedby application of suitable design patterns. Thus, the detectionof anti-patterns can lead to the recommendation of designpatterns, if the anti-patterns could properly be mapped to theirrelated design patterns.This idea is implemented as a system called Anti-patternbased Design Pattern Recommender (ADPR), which is ini-tially designed for Abstract Factory design pattern. The top-level overview of ADPR is shown in Fig. 1. There are two
QuASoQ 2015 Workshop Preprints
12
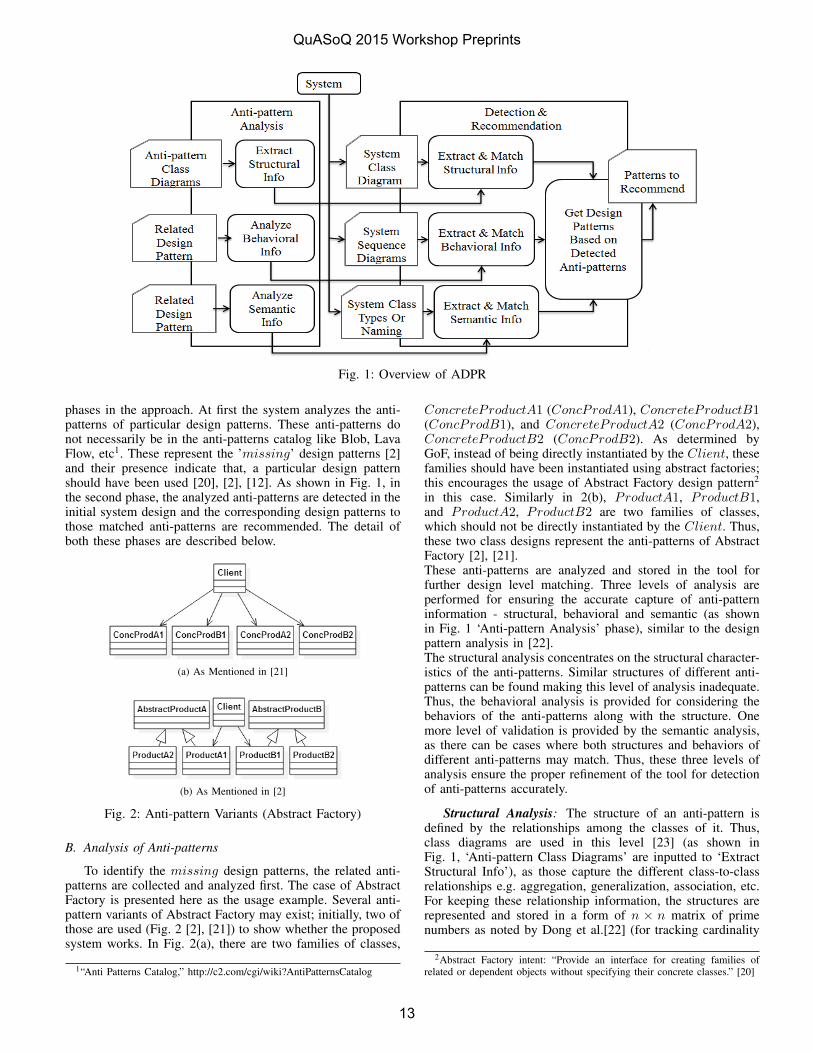
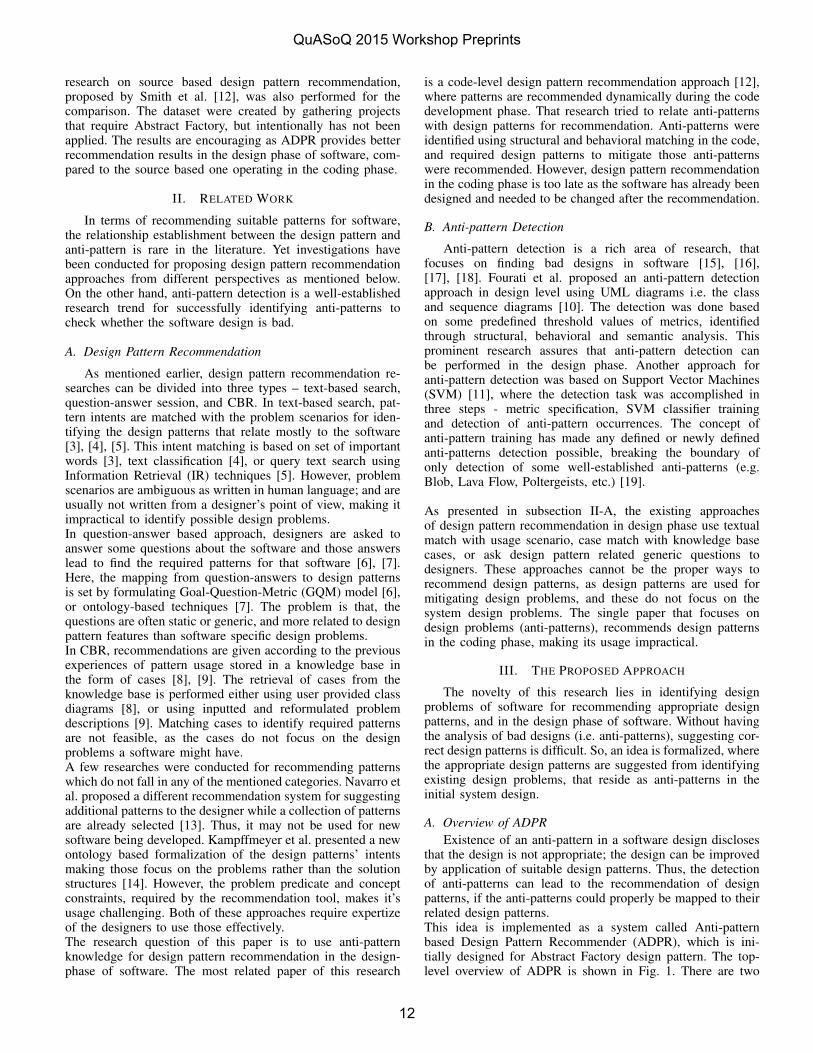
Fig. 1: Overview of ADPR
phases in the approach. At first the system analyzes the anti-patterns of particular design patterns. These anti-patterns donot necessarily be in the anti-patterns catalog like Blob, LavaFlow, etc1. These represent the ’missing’ design patterns [2]and their presence indicate that, a particular design patternshould have been used [20], [2], [12]. As shown in Fig. 1, inthe second phase, the analyzed anti-patterns are detected in theinitial system design and the corresponding design patterns tothose matched anti-patterns are recommended. The detail ofboth these phases are described below.
(a) As Mentioned in [21]
(b) As Mentioned in [2]
Fig. 2: Anti-pattern Variants (Abstract Factory)
B. Analysis of Anti-patterns
To identify the missing design patterns, the related anti-patterns are collected and analyzed first. The case of AbstractFactory is presented here as the usage example. Several anti-pattern variants of Abstract Factory may exist; initially, two ofthose are used (Fig. 2 [2], [21]) to show whether the proposedsystem works. In Fig. 2(a), there are two families of classes,
1“Anti Patterns Catalog,” http://c2.com/cgi/wiki?AntiPatternsCatalog
ConcreteProductA1 (ConcProdA1), ConcreteProductB1(ConcProdB1), and ConcreteProductA2 (ConcProdA2),ConcreteProductB2 (ConcProdB2). As determined byGoF, instead of being directly instantiated by the Client, thesefamilies should have been instantiated using abstract factories;this encourages the usage of Abstract Factory design pattern2
in this case. Similarly in 2(b), ProductA1, ProductB1,and ProductA2, ProductB2 are two families of classes,which should not be directly instantiated by the Client. Thus,these two class designs represent the anti-patterns of AbstractFactory [2], [21].These anti-patterns are analyzed and stored in the tool forfurther design level matching. Three levels of analysis areperformed for ensuring the accurate capture of anti-patterninformation - structural, behavioral and semantic (as shownin Fig. 1 ‘Anti-pattern Analysis’ phase), similar to the designpattern analysis in [22].The structural analysis concentrates on the structural character-istics of the anti-patterns. Similar structures of different anti-patterns can be found making this level of analysis inadequate.Thus, the behavioral analysis is provided for considering thebehaviors of the anti-patterns along with the structure. Onemore level of validation is provided by the semantic analysis,as there can be cases where both structures and behaviors ofdifferent anti-patterns may match. Thus, these three levels ofanalysis ensure the proper refinement of the tool for detectionof anti-patterns accurately.
Structural Analysis: The structure of an anti-pattern isdefined by the relationships among the classes of it. Thus,class diagrams are used in this level [23] (as shown inFig. 1, ‘Anti-pattern Class Diagrams’ are inputted to ‘ExtractStructural Info’), as those capture the different class-to-classrelationships e.g. aggregation, generalization, association, etc.For keeping these relationship information, the structures arerepresented and stored in a form of n × n matrix of primenumbers as noted by Dong et al.[22] (for tracking cardinality
2Abstract Factory intent: “Provide an interface for creating families ofrelated or dependent objects without specifying their concrete classes.” [20]
QuASoQ 2015 Workshop Preprints
13
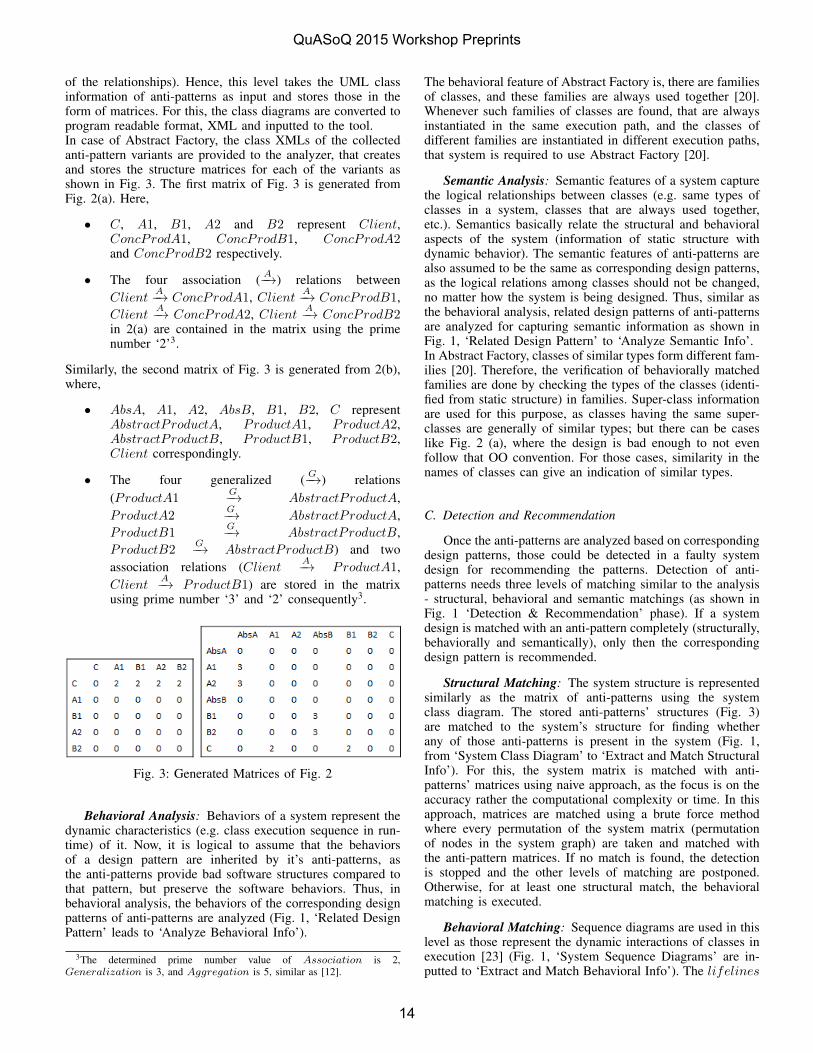
of the relationships). Hence, this level takes the UML classinformation of anti-patterns as input and stores those in theform of matrices. For this, the class diagrams are converted toprogram readable format, XML and inputted to the tool.In case of Abstract Factory, the class XMLs of the collectedanti-pattern variants are provided to the analyzer, that createsand stores the structure matrices for each of the variants asshown in Fig. 3. The first matrix of Fig. 3 is generated fromFig. 2(a). Here,
• C, A1, B1, A2 and B2 represent Client,ConcProdA1, ConcProdB1, ConcProdA2and ConcProdB2 respectively.
• The four association ( A−→) relations betweenClient
A−→ ConcProdA1, ClientA−→ ConcProdB1,
ClientA−→ ConcProdA2, Client
A−→ ConcProdB2in 2(a) are contained in the matrix using the primenumber ‘2’3.
Similarly, the second matrix of Fig. 3 is generated from 2(b),where,
• AbsA, A1, A2, AbsB, B1, B2, C representAbstractProductA, ProductA1, ProductA2,AbstractProductB, ProductB1, ProductB2,Client correspondingly.
• The four generalized ( G−→) relations(ProductA1
G−→ AbstractProductA,ProductA2
G−→ AbstractProductA,ProductB1
G−→ AbstractProductB,ProductB2
G−→ AbstractProductB) and twoassociation relations (Client
A−→ ProductA1,Client
A−→ ProductB1) are stored in the matrixusing prime number ‘3’ and ‘2’ consequently3.
Fig. 3: Generated Matrices of Fig. 2
Behavioral Analysis: Behaviors of a system represent thedynamic characteristics (e.g. class execution sequence in run-time) of it. Now, it is logical to assume that the behaviorsof a design pattern are inherited by it’s anti-patterns, asthe anti-patterns provide bad software structures compared tothat pattern, but preserve the software behaviors. Thus, inbehavioral analysis, the behaviors of the corresponding designpatterns of anti-patterns are analyzed (Fig. 1, ‘Related DesignPattern’ leads to ‘Analyze Behavioral Info’).
3The determined prime number value of Association is 2,Generalization is 3, and Aggregation is 5, similar as [12].
The behavioral feature of Abstract Factory is, there are familiesof classes, and these families are always used together [20].Whenever such families of classes are found, that are alwaysinstantiated in the same execution path, and the classes ofdifferent families are instantiated in different execution paths,that system is required to use Abstract Factory [20].
Semantic Analysis: Semantic features of a system capturethe logical relationships between classes (e.g. same types ofclasses in a system, classes that are always used together,etc.). Semantics basically relate the structural and behavioralaspects of the system (information of static structure withdynamic behavior). The semantic features of anti-patterns arealso assumed to be the same as corresponding design patterns,as the logical relations among classes should not be changed,no matter how the system is being designed. Thus, similar asthe behavioral analysis, related design patterns of anti-patternsare analyzed for capturing semantic information as shown inFig. 1, ‘Related Design Pattern’ to ‘Analyze Semantic Info’.In Abstract Factory, classes of similar types form different fam-ilies [20]. Therefore, the verification of behaviorally matchedfamilies are done by checking the types of the classes (identi-fied from static structure) in families. Super-class informationare used for this purpose, as classes having the same super-classes are generally of similar types; but there can be caseslike Fig. 2 (a), where the design is bad enough to not evenfollow that OO convention. For those cases, similarity in thenames of classes can give an indication of similar types.
C. Detection and Recommendation
Once the anti-patterns are analyzed based on correspondingdesign patterns, those could be detected in a faulty systemdesign for recommending the patterns. Detection of anti-patterns needs three levels of matching similar to the analysis- structural, behavioral and semantic matchings (as shown inFig. 1 ‘Detection & Recommendation’ phase). If a systemdesign is matched with an anti-pattern completely (structurally,behaviorally and semantically), only then the correspondingdesign pattern is recommended.
Structural Matching: The system structure is representedsimilarly as the matrix of anti-patterns using the systemclass diagram. The stored anti-patterns’ structures (Fig. 3)are matched to the system’s structure for finding whetherany of those anti-patterns is present in the system (Fig. 1,from ‘System Class Diagram’ to ‘Extract and Match StructuralInfo’). For this, the system matrix is matched with anti-patterns’ matrices using naive approach, as the focus is on theaccuracy rather the computational complexity or time. In thisapproach, matrices are matched using a brute force methodwhere every permutation of the system matrix (permutationof nodes in the system graph) are taken and matched withthe anti-pattern matrices. If no match is found, the detectionis stopped and the other levels of matching are postponed.Otherwise, for at least one structural match, the behavioralmatching is executed.
Behavioral Matching: Sequence diagrams are used in thislevel as those represent the dynamic interactions of classes inexecution [23] (Fig. 1, ‘System Sequence Diagrams’ are in-putted to ‘Extract and Match Behavioral Info’). The lifelines
QuASoQ 2015 Workshop Preprints
14
of a sequence diagram are the roles or object instances4, andrepresent the classes in the same execution sequence. Thus,families of classes in Abstract Factory are identified from theselifelines, as classes of same families are supposed to be inthe same execution sequence, and so in the same sequencediagram lifelines. For this, the UML sequence diagrams ofthe system are converted to XMLs first, and inputted to thetool. Then, the XMLs are parsed to identify the lifelines andthe corresponding classes of those are identified. Thus, theidentified classes of each sequence diagram are marked to bein the same family.
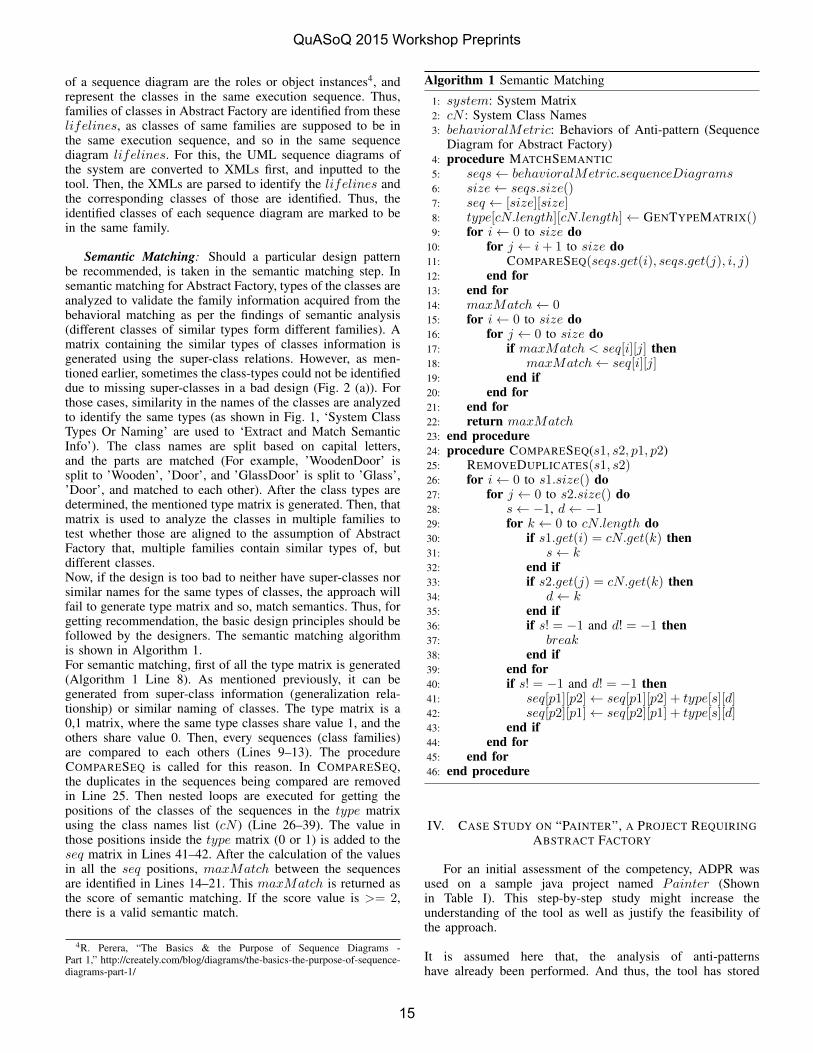
Semantic Matching: Should a particular design patternbe recommended, is taken in the semantic matching step. Insemantic matching for Abstract Factory, types of the classes areanalyzed to validate the family information acquired from thebehavioral matching as per the findings of semantic analysis(different classes of similar types form different families). Amatrix containing the similar types of classes information isgenerated using the super-class relations. However, as men-tioned earlier, sometimes the class-types could not be identifieddue to missing super-classes in a bad design (Fig. 2 (a)). Forthose cases, similarity in the names of the classes are analyzedto identify the same types (as shown in Fig. 1, ‘System ClassTypes Or Naming’ are used to ‘Extract and Match SemanticInfo’). The class names are split based on capital letters,and the parts are matched (For example, ’WoodenDoor’ issplit to ’Wooden’, ’Door’, and ’GlassDoor’ is split to ’Glass’,’Door’, and matched to each other). After the class types aredetermined, the mentioned type matrix is generated. Then, thatmatrix is used to analyze the classes in multiple families totest whether those are aligned to the assumption of AbstractFactory that, multiple families contain similar types of, butdifferent classes.Now, if the design is too bad to neither have super-classes norsimilar names for the same types of classes, the approach willfail to generate type matrix and so, match semantics. Thus, forgetting recommendation, the basic design principles should befollowed by the designers. The semantic matching algorithmis shown in Algorithm 1.For semantic matching, first of all the type matrix is generated(Algorithm 1 Line 8). As mentioned previously, it can begenerated from super-class information (generalization rela-tionship) or similar naming of classes. The type matrix is a0,1 matrix, where the same type classes share value 1, and theothers share value 0. Then, every sequences (class families)are compared to each others (Lines 9–13). The procedureCOMPARESEQ is called for this reason. In COMPARESEQ,the duplicates in the sequences being compared are removedin Line 25. Then nested loops are executed for getting thepositions of the classes of the sequences in the type matrixusing the class names list (cN ) (Line 26–39). The value inthose positions inside the type matrix (0 or 1) is added to theseq matrix in Lines 41–42. After the calculation of the valuesin all the seq positions, maxMatch between the sequencesare identified in Lines 14–21. This maxMatch is returned asthe score of semantic matching. If the score value is >= 2,there is a valid semantic match.
4R. Perera, “The Basics & the Purpose of Sequence Diagrams -Part 1,” http://creately.com/blog/diagrams/the-basics-the-purpose-of-sequence-diagrams-part-1/
Algorithm 1 Semantic Matching
1: system: System Matrix2: cN : System Class Names3: behavioralMetric: Behaviors of Anti-pattern (Sequence
Diagram for Abstract Factory)4: procedure MATCHSEMANTIC5: seqs← behavioralMetric.sequenceDiagrams6: size← seqs.size()7: seq ← [size][size]8: type[cN.length][cN.length]← GENTYPEMATRIX()9: for i← 0 to size do
10: for j ← i+ 1 to size do11: COMPARESEQ(seqs.get(i), seqs.get(j), i, j)12: end for13: end for14: maxMatch← 015: for i← 0 to size do16: for j ← 0 to size do17: if maxMatch < seq[i][j] then18: maxMatch← seq[i][j]19: end if20: end for21: end for22: return maxMatch23: end procedure24: procedure COMPARESEQ(s1, s2, p1, p2)25: REMOVEDUPLICATES(s1, s2)26: for i← 0 to s1.size() do27: for j ← 0 to s2.size() do28: s← −1, d← −129: for k ← 0 to cN.length do30: if s1.get(i) = cN.get(k) then31: s← k32: end if33: if s2.get(j) = cN.get(k) then34: d← k35: end if36: if s! = −1 and d! = −1 then37: break38: end if39: end for40: if s! = −1 and d! = −1 then41: seq[p1][p2]← seq[p1][p2] + type[s][d]42: seq[p2][p1]← seq[p2][p1] + type[s][d]43: end if44: end for45: end for46: end procedure
IV. CASE STUDY ON “PAINTER”, A PROJECT REQUIRINGABSTRACT FACTORY
For an initial assessment of the competency, ADPR wasused on a sample java project named Painter (Shownin Table I). This step-by-step study might increase theunderstanding of the tool as well as justify the feasibility ofthe approach.
It is assumed here that, the analysis of anti-patternshave already been performed. And thus, the tool has stored
QuASoQ 2015 Workshop Preprints
15
the required anti-patterns’ information for the purpose ofdetecting those and recommending the corresponding designpatterns for the inputted systems.
A. About Painter
The project, Painter is a well-known example of AbstractFactory usage5. For testing the recommendation tool, theproject is designed without implementing Abstract Factory(badly designed). The scenario of the project is as follows:“The Paint can draw three types of Shape - Circle,Triangle, or Square. The Shapes can be filled with threeColors - Red, Blue, or Green. Circles will be Red,Triangles will be Blue, and Squares will be Green.”
B. Structural Matching of Painter
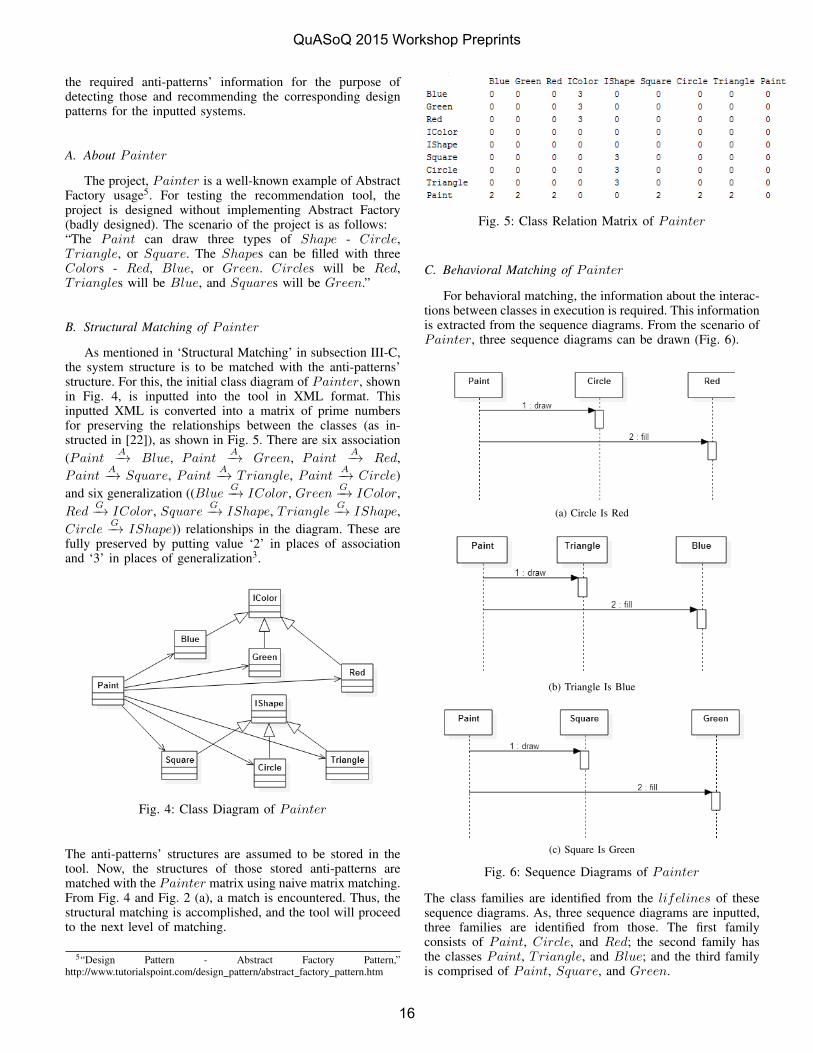
As mentioned in ‘Structural Matching’ in subsection III-C,the system structure is to be matched with the anti-patterns’structure. For this, the initial class diagram of Painter, shownin Fig. 4, is inputted into the tool in XML format. Thisinputted XML is converted into a matrix of prime numbersfor preserving the relationships between the classes (as in-structed in [22]), as shown in Fig. 5. There are six association(Paint
A−→ Blue, PaintA−→ Green, Paint
A−→ Red,Paint
A−→ Square, PaintA−→ Triangle, Paint
A−→ Circle)and six generalization ((Blue
G−→ IColor, GreenG−→ IColor,
RedG−→ IColor, Square G−→ IShape, Triangle G−→ IShape,
CircleG−→ IShape)) relationships in the diagram. These are
fully preserved by putting value ‘2’ in places of associationand ‘3’ in places of generalization3.
Fig. 4: Class Diagram of Painter
The anti-patterns’ structures are assumed to be stored in thetool. Now, the structures of those stored anti-patterns arematched with the Painter matrix using naive matrix matching.From Fig. 4 and Fig. 2 (a), a match is encountered. Thus, thestructural matching is accomplished, and the tool will proceedto the next level of matching.
5“Design Pattern - Abstract Factory Pattern,”http://www.tutorialspoint.com/design pattern/abstract factory pattern.htm
Fig. 5: Class Relation Matrix of Painter
C. Behavioral Matching of Painter
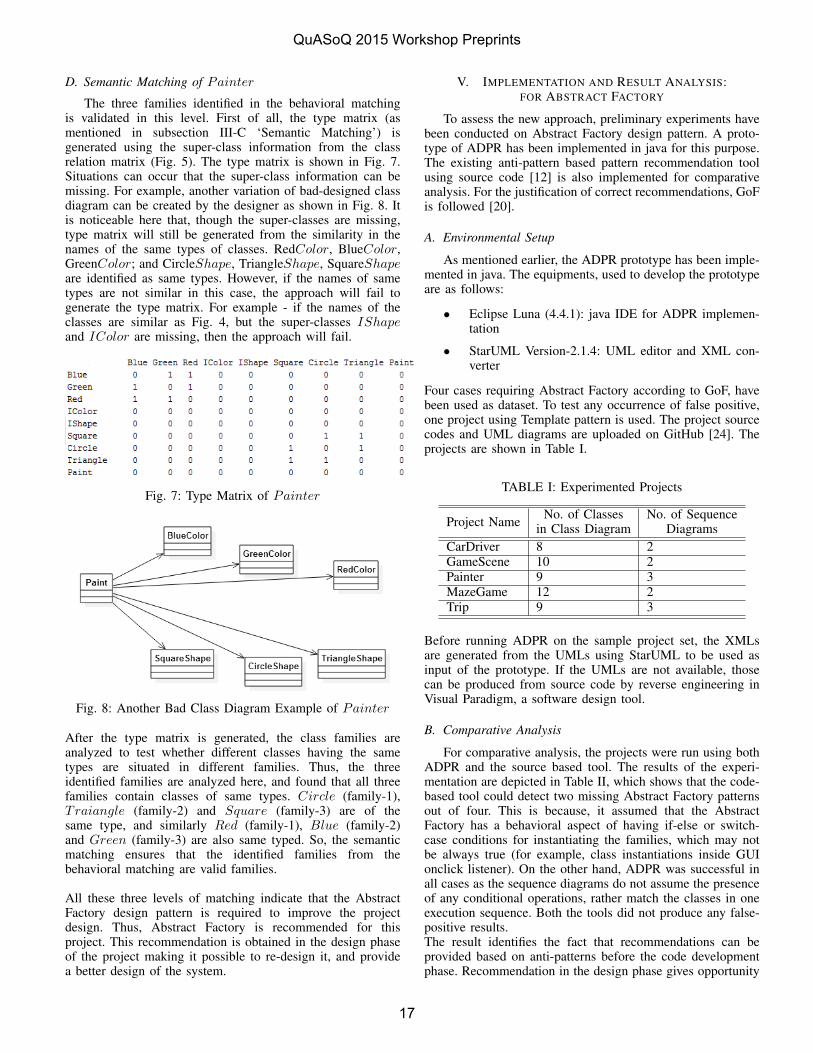
For behavioral matching, the information about the interac-tions between classes in execution is required. This informationis extracted from the sequence diagrams. From the scenario ofPainter, three sequence diagrams can be drawn (Fig. 6).
(a) Circle Is Red
(b) Triangle Is Blue
(c) Square Is Green
Fig. 6: Sequence Diagrams of Painter
The class families are identified from the lifelines of thesesequence diagrams. As, three sequence diagrams are inputted,three families are identified from those. The first familyconsists of Paint, Circle, and Red; the second family hasthe classes Paint, Triangle, and Blue; and the third familyis comprised of Paint, Square, and Green.
QuASoQ 2015 Workshop Preprints
16
D. Semantic Matching of Painter
The three families identified in the behavioral matchingis validated in this level. First of all, the type matrix (asmentioned in subsection III-C ‘Semantic Matching’) isgenerated using the super-class information from the classrelation matrix (Fig. 5). The type matrix is shown in Fig. 7.Situations can occur that the super-class information can bemissing. For example, another variation of bad-designed classdiagram can be created by the designer as shown in Fig. 8. Itis noticeable here that, though the super-classes are missing,type matrix will still be generated from the similarity in thenames of the same types of classes. RedColor, BlueColor,GreenColor; and CircleShape, TriangleShape, SquareShapeare identified as same types. However, if the names of sametypes are not similar in this case, the approach will fail togenerate the type matrix. For example - if the names of theclasses are similar as Fig. 4, but the super-classes IShapeand IColor are missing, then the approach will fail.
Fig. 7: Type Matrix of Painter
Fig. 8: Another Bad Class Diagram Example of Painter
After the type matrix is generated, the class families areanalyzed to test whether different classes having the sametypes are situated in different families. Thus, the threeidentified families are analyzed here, and found that all threefamilies contain classes of same types. Circle (family-1),Traiangle (family-2) and Square (family-3) are of thesame type, and similarly Red (family-1), Blue (family-2)and Green (family-3) are also same typed. So, the semanticmatching ensures that the identified families from thebehavioral matching are valid families.
All these three levels of matching indicate that the AbstractFactory design pattern is required to improve the projectdesign. Thus, Abstract Factory is recommended for thisproject. This recommendation is obtained in the design phaseof the project making it possible to re-design it, and providea better design of the system.
V. IMPLEMENTATION AND RESULT ANALYSIS:FOR ABSTRACT FACTORY
To assess the new approach, preliminary experiments havebeen conducted on Abstract Factory design pattern. A proto-type of ADPR has been implemented in java for this purpose.The existing anti-pattern based pattern recommendation toolusing source code [12] is also implemented for comparativeanalysis. For the justification of correct recommendations, GoFis followed [20].
A. Environmental Setup
As mentioned earlier, the ADPR prototype has been imple-mented in java. The equipments, used to develop the prototypeare as follows:
• Eclipse Luna (4.4.1): java IDE for ADPR implemen-tation
• StarUML Version-2.1.4: UML editor and XML con-verter
Four cases requiring Abstract Factory according to GoF, havebeen used as dataset. To test any occurrence of false positive,one project using Template pattern is used. The project sourcecodes and UML diagrams are uploaded on GitHub [24]. Theprojects are shown in Table I.
TABLE I: Experimented Projects
Project Name No. of Classesin Class Diagram
No. of SequenceDiagrams
CarDriver 8 2GameScene 10 2Painter 9 3MazeGame 12 2Trip 9 3
Before running ADPR on the sample project set, the XMLsare generated from the UMLs using StarUML to be used asinput of the prototype. If the UMLs are not available, thosecan be produced from source code by reverse engineering inVisual Paradigm, a software design tool.
B. Comparative Analysis
For comparative analysis, the projects were run using bothADPR and the source based tool. The results of the experi-mentation are depicted in Table II, which shows that the code-based tool could detect two missing Abstract Factory patternsout of four. This is because, it assumed that the AbstractFactory has a behavioral aspect of having if-else or switch-case conditions for instantiating the families, which may notbe always true (for example, class instantiations inside GUIonclick listener). On the other hand, ADPR was successful inall cases as the sequence diagrams do not assume the presenceof any conditional operations, rather match the classes in oneexecution sequence. Both the tools did not produce any false-positive results.The result identifies the fact that recommendations can beprovided based on anti-patterns before the code developmentphase. Recommendation in the design phase gives opportunity
QuASoQ 2015 Workshop Preprints
17
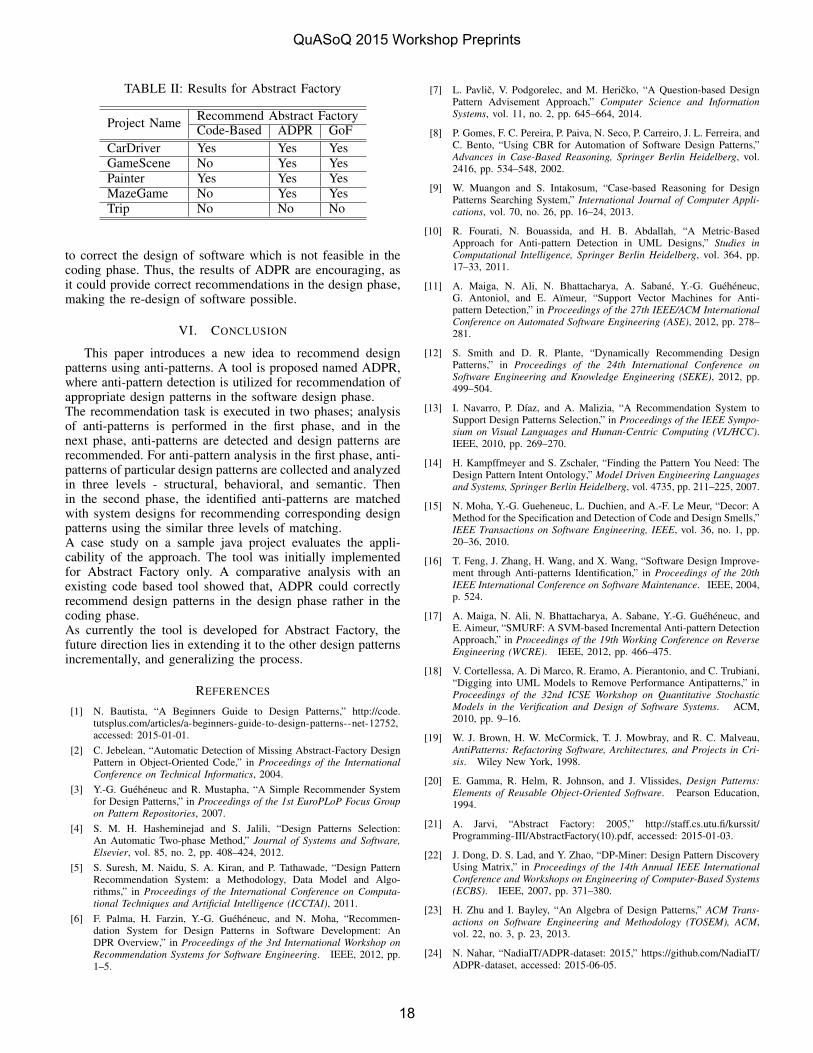
TABLE II: Results for Abstract Factory
Project Name Recommend Abstract FactoryCode-Based ADPR GoF
CarDriver Yes Yes YesGameScene No Yes YesPainter Yes Yes YesMazeGame No Yes YesTrip No No No
to correct the design of software which is not feasible in thecoding phase. Thus, the results of ADPR are encouraging, asit could provide correct recommendations in the design phase,making the re-design of software possible.
VI. CONCLUSION
This paper introduces a new idea to recommend designpatterns using anti-patterns. A tool is proposed named ADPR,where anti-pattern detection is utilized for recommendation ofappropriate design patterns in the software design phase.The recommendation task is executed in two phases; analysisof anti-patterns is performed in the first phase, and in thenext phase, anti-patterns are detected and design patterns arerecommended. For anti-pattern analysis in the first phase, anti-patterns of particular design patterns are collected and analyzedin three levels - structural, behavioral, and semantic. Thenin the second phase, the identified anti-patterns are matchedwith system designs for recommending corresponding designpatterns using the similar three levels of matching.A case study on a sample java project evaluates the appli-cability of the approach. The tool was initially implementedfor Abstract Factory only. A comparative analysis with anexisting code based tool showed that, ADPR could correctlyrecommend design patterns in the design phase rather in thecoding phase.As currently the tool is developed for Abstract Factory, thefuture direction lies in extending it to the other design patternsincrementally, and generalizing the process.
REFERENCES
[1] N. Bautista, “A Beginners Guide to Design Patterns,” http://code.tutsplus.com/articles/a-beginners-guide-to-design-patterns--net-12752,accessed: 2015-01-01.
[2] C. Jebelean, “Automatic Detection of Missing Abstract-Factory DesignPattern in Object-Oriented Code,” in Proceedings of the InternationalConference on Technical Informatics, 2004.
[3] Y.-G. Gueheneuc and R. Mustapha, “A Simple Recommender Systemfor Design Patterns,” in Proceedings of the 1st EuroPLoP Focus Groupon Pattern Repositories, 2007.
[4] S. M. H. Hasheminejad and S. Jalili, “Design Patterns Selection:An Automatic Two-phase Method,” Journal of Systems and Software,Elsevier, vol. 85, no. 2, pp. 408–424, 2012.
[5] S. Suresh, M. Naidu, S. A. Kiran, and P. Tathawade, “Design PatternRecommendation System: a Methodology, Data Model and Algo-rithms,” in Proceedings of the International Conference on Computa-tional Techniques and Artificial Intelligence (ICCTAI), 2011.
[6] F. Palma, H. Farzin, Y.-G. Gueheneuc, and N. Moha, “Recommen-dation System for Design Patterns in Software Development: AnDPR Overview,” in Proceedings of the 3rd International Workshop onRecommendation Systems for Software Engineering. IEEE, 2012, pp.1–5.
[7] L. Pavlic, V. Podgorelec, and M. Hericko, “A Question-based DesignPattern Advisement Approach,” Computer Science and InformationSystems, vol. 11, no. 2, pp. 645–664, 2014.
[8] P. Gomes, F. C. Pereira, P. Paiva, N. Seco, P. Carreiro, J. L. Ferreira, andC. Bento, “Using CBR for Automation of Software Design Patterns,”Advances in Case-Based Reasoning, Springer Berlin Heidelberg, vol.2416, pp. 534–548, 2002.
[9] W. Muangon and S. Intakosum, “Case-based Reasoning for DesignPatterns Searching System,” International Journal of Computer Appli-cations, vol. 70, no. 26, pp. 16–24, 2013.
[10] R. Fourati, N. Bouassida, and H. B. Abdallah, “A Metric-BasedApproach for Anti-pattern Detection in UML Designs,” Studies inComputational Intelligence, Springer Berlin Heidelberg, vol. 364, pp.17–33, 2011.
[11] A. Maiga, N. Ali, N. Bhattacharya, A. Sabane, Y.-G. Gueheneuc,G. Antoniol, and E. Aımeur, “Support Vector Machines for Anti-pattern Detection,” in Proceedings of the 27th IEEE/ACM InternationalConference on Automated Software Engineering (ASE), 2012, pp. 278–281.
[12] S. Smith and D. R. Plante, “Dynamically Recommending DesignPatterns,” in Proceedings of the 24th International Conference onSoftware Engineering and Knowledge Engineering (SEKE), 2012, pp.499–504.
[13] I. Navarro, P. Dıaz, and A. Malizia, “A Recommendation System toSupport Design Patterns Selection,” in Proceedings of the IEEE Sympo-sium on Visual Languages and Human-Centric Computing (VL/HCC).IEEE, 2010, pp. 269–270.
[14] H. Kampffmeyer and S. Zschaler, “Finding the Pattern You Need: TheDesign Pattern Intent Ontology,” Model Driven Engineering Languagesand Systems, Springer Berlin Heidelberg, vol. 4735, pp. 211–225, 2007.
[15] N. Moha, Y.-G. Gueheneuc, L. Duchien, and A.-F. Le Meur, “Decor: AMethod for the Specification and Detection of Code and Design Smells,”IEEE Transactions on Software Engineering, IEEE, vol. 36, no. 1, pp.20–36, 2010.
[16] T. Feng, J. Zhang, H. Wang, and X. Wang, “Software Design Improve-ment through Anti-patterns Identification,” in Proceedings of the 20thIEEE International Conference on Software Maintenance. IEEE, 2004,p. 524.
[17] A. Maiga, N. Ali, N. Bhattacharya, A. Sabane, Y.-G. Gueheneuc, andE. Aimeur, “SMURF: A SVM-based Incremental Anti-pattern DetectionApproach,” in Proceedings of the 19th Working Conference on ReverseEngineering (WCRE). IEEE, 2012, pp. 466–475.
[18] V. Cortellessa, A. Di Marco, R. Eramo, A. Pierantonio, and C. Trubiani,“Digging into UML Models to Remove Performance Antipatterns,” inProceedings of the 32nd ICSE Workshop on Quantitative StochasticModels in the Verification and Design of Software Systems. ACM,2010, pp. 9–16.
[19] W. J. Brown, H. W. McCormick, T. J. Mowbray, and R. C. Malveau,AntiPatterns: Refactoring Software, Architectures, and Projects in Cri-sis. Wiley New York, 1998.
[20] E. Gamma, R. Helm, R. Johnson, and J. Vlissides, Design Patterns:Elements of Reusable Object-Oriented Software. Pearson Education,1994.
[21] A. Jarvi, “Abstract Factory: 2005,” http://staff.cs.utu.fi/kurssit/Programming-III/AbstractFactory(10).pdf, accessed: 2015-01-03.
[22] J. Dong, D. S. Lad, and Y. Zhao, “DP-Miner: Design Pattern DiscoveryUsing Matrix,” in Proceedings of the 14th Annual IEEE InternationalConference and Workshops on Engineering of Computer-Based Systems(ECBS). IEEE, 2007, pp. 371–380.
[23] H. Zhu and I. Bayley, “An Algebra of Design Patterns,” ACM Trans-actions on Software Engineering and Methodology (TOSEM), ACM,vol. 22, no. 3, p. 23, 2013.
[24] N. Nahar, “NadiaIT/ADPR-dataset: 2015,” https://github.com/NadiaIT/ADPR-dataset, accessed: 2015-06-05.
QuASoQ 2015 Workshop Preprints
18
1
Correctness of Semantic Code Smell DetectionTools
Neeraj Mathur∗ and Y Raghu Reddy†∗†Software Engineering Research Center,
International Institute of Information Technology, Hyderabad (IIIT-H), India∗[email protected], †[email protected]
Abstract—Refactoring is a set of techniques used to enhancethe quality of code by restructuring existing code/design withoutchanging its behavior. Refactoring tools can be used to detect spe-cific code smells, propose relevant refactorings, and in some casesautomate the refactoring process. However, usage of refactoringtools in industry is still relatively low. One of the major reasonsbeing the veracity of the detected code smells, especially smellsthat aren’t purely syntactic in nature. We conduct an empiricalstudy on some refactoring tools and evaluate the correctness ofthe code smells they identify. We analyze the level of confidenceusers have on the code smells detected by the tools and discusssome issues with such tools.
Index Terms—Correctness, Detection, Maintenance, Refactor-ing, Semantic code smells.
I. INTRODUCTION
Refactoring improves various qualities of code/design likemaintainability (understandability and readability), extensibil-ity, etc. by changing the structure of the code/design withoutchanging the overall behaviour of the system. It was firstintroduced by Opdyke and Johnson [11] and later popularizedby Martin Fowler [7]. Fowler categorized various types ofrefactorings in terms of their applicability and suggested vari-ous refactorings for code smells (bad indicators in code) withinclasses and between classes. Over the years, other researchershave added to the knowledge base on code smells [16]. Anyrefactoring done to address specific code smells requires oneto test the refactored code with respect to preservation of theoriginal behaviour. This is primarily done by writing test casesbefore the refactoring is done and testing the refactored codeagainst the test cases. As a result, validating the correctnessof a detected code smell and the automation of it’s refactoringis very difficult. Explicit manual intervention may be needed.
Many code smell detection tools support (semi) automaticrefactoring process [4], [8]. iPlasma, Jdeodorant, RefactorJ,etc. are some of the tools that can be used for detection ofcode smells and application of specific refactoring techniquesin automated or semi-automated manner. As noted in ourprevious work, each of these tools can detect only certain typeof code smells automatically [8]. Also, there is no standardizedapproach for detecting such code smells and hence tools followtheir own approach [9], inevitably leading to different set ofcode smells being detected for the same piece of code. Mostcode smell detection techniques depend on static analysis andcode metrics and do not consider factors like system size,
language structure and context. In other words, any design-based refactorings require the tool to understand the actualsemantic intent of the code itself. For example, Long methodis one such code smell that requires the tool to understand thecontext of the method before an Extract method refactoringcan be performed automatically while preserving the originalsemantic intent.
Despite the known benefits of refactoring tools, their usageis not widespread due to users’ lack of trust on the tools’code smell detection capability, learning curve involved, andthe inability of users to understand the code smell detectionresults [4], [6], [14]. In this paper, we study the correctnessof the detected code smells of multiple open source toolslike JDeodorant, InCode, etc. and the lack of trust of userson their detection capability through an empirical study ofopen source projects like JHotDraw (www.jhotdraw.org) andGanttProject (www.ganttproject.biz). We believe that lack oftrust is proportional to the correctness of the tools detectionability. Most code smell detection tools detect code smells thatrequire small-scale resolutions correctly. However, correctnessis an issue when design based refactorings or semantic intentis considered. Hence, we restrict our focus to tools thatdetect code smells that require the tool to understand thesemantic intent (for example, Feature Envy, Long Methods,Shotgun Surgery, God class, etc.). From now on, we refer tosuch code smells as ”semantic code smells”. We crossvalidate our study results on GanttProject with the study resultsconducted by Fontana et al. [6] on GanttProject (v1.11.1).Additionally, we used our own dummy code with a fewinduced semantic code smells to check for correctness of thetools. We focus on the following in this paper:
• Correctness of the identified code smells among thechosen tools
• Deviation in confidence levels of developers in opensource code smell detection tools that detect semanticcode smells
The rest of the paper is structured as follows: Section IIprovides a brief overview of the code smells discussed in thispaper and section III presents some related work. In section IV,we detail the study design. Section V and VI present the resultsand analysis of the results. Based on the study, we providesome guidelines for increasing the correctness of detectingsome code smells in section VII. Finally, in section VIII wediscuss some limitations to our work.
QuASoQ 2015 Workshop Preprints
19
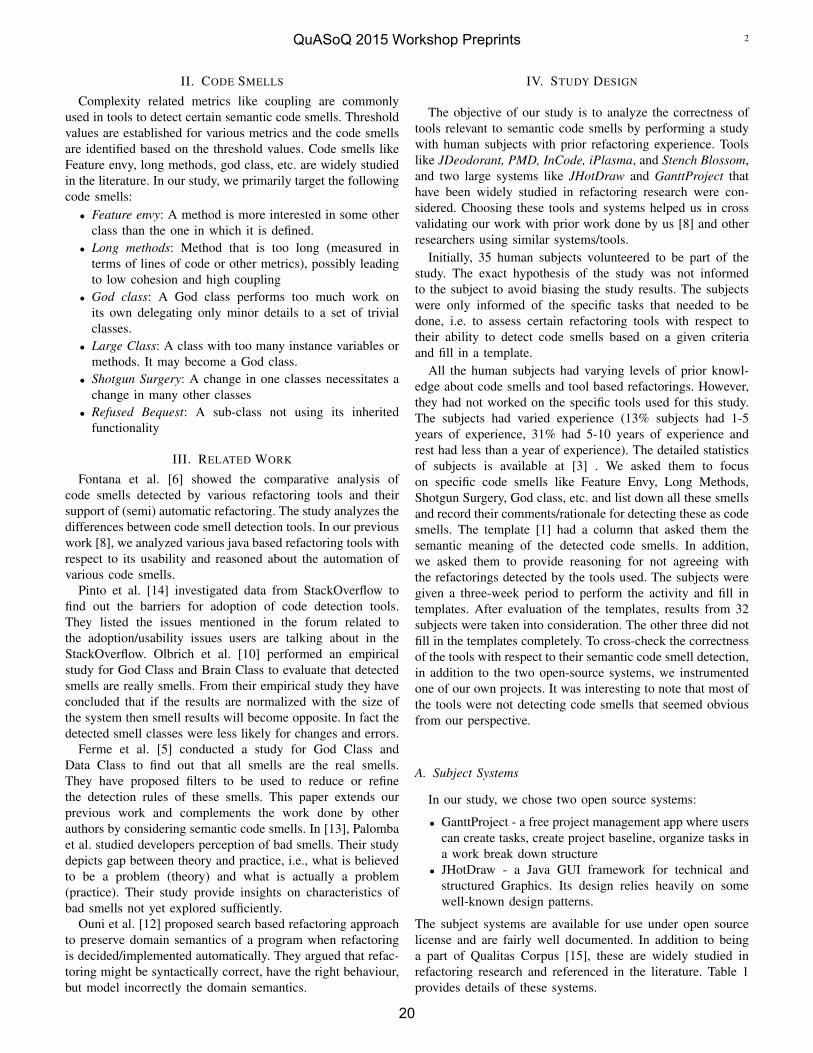
2
II. CODE SMELLS
Complexity related metrics like coupling are commonlyused in tools to detect certain semantic code smells. Thresholdvalues are established for various metrics and the code smellsare identified based on the threshold values. Code smells likeFeature envy, long methods, god class, etc. are widely studiedin the literature. In our study, we primarily target the followingcode smells:
• Feature envy: A method is more interested in some otherclass than the one in which it is defined.
• Long methods: Method that is too long (measured interms of lines of code or other metrics), possibly leadingto low cohesion and high coupling
• God class: A God class performs too much work onits own delegating only minor details to a set of trivialclasses.
• Large Class: A class with too many instance variables ormethods. It may become a God class.
• Shotgun Surgery: A change in one classes necessitates achange in many other classes
• Refused Bequest: A sub-class not using its inheritedfunctionality
III. RELATED WORK
Fontana et al. [6] showed the comparative analysis ofcode smells detected by various refactoring tools and theirsupport of (semi) automatic refactoring. The study analyzes thedifferences between code smell detection tools. In our previouswork [8], we analyzed various java based refactoring tools withrespect to its usability and reasoned about the automation ofvarious code smells.
Pinto et al. [14] investigated data from StackOverflow tofind out the barriers for adoption of code detection tools.They listed the issues mentioned in the forum related tothe adoption/usability issues users are talking about in theStackOverflow. Olbrich et al. [10] performed an empiricalstudy for God Class and Brain Class to evaluate that detectedsmells are really smells. From their empirical study they haveconcluded that if the results are normalized with the size ofthe system then smell results will become opposite. In fact thedetected smell classes were less likely for changes and errors.
Ferme et al. [5] conducted a study for God Class andData Class to find out that all smells are the real smells.They have proposed filters to be used to reduce or refinethe detection rules of these smells. This paper extends ourprevious work and complements the work done by otherauthors by considering semantic code smells. In [13], Palombaet al. studied developers perception of bad smells. Their studydepicts gap between theory and practice, i.e., what is believedto be a problem (theory) and what is actually a problem(practice). Their study provide insights on characteristics ofbad smells not yet explored sufficiently.
Ouni et al. [12] proposed search based refactoring approachto preserve domain semantics of a program when refactoringis decided/implemented automatically. They argued that refac-toring might be syntactically correct, have the right behaviour,but model incorrectly the domain semantics.
IV. STUDY DESIGN
The objective of our study is to analyze the correctness oftools relevant to semantic code smells by performing a studywith human subjects with prior refactoring experience. Toolslike JDeodorant, PMD, InCode, iPlasma, and Stench Blossom,and two large systems like JHotDraw and GanttProject thathave been widely studied in refactoring research were con-sidered. Choosing these tools and systems helped us in crossvalidating our work with prior work done by us [8] and otherresearchers using similar systems/tools.
Initially, 35 human subjects volunteered to be part of thestudy. The exact hypothesis of the study was not informedto the subject to avoid biasing the study results. The subjectswere only informed of the specific tasks that needed to bedone, i.e. to assess certain refactoring tools with respect totheir ability to detect code smells based on a given criteriaand fill in a template.
All the human subjects had varying levels of prior knowl-edge about code smells and tool based refactorings. However,they had not worked on the specific tools used for this study.The subjects had varied experience (13% subjects had 1-5years of experience, 31% had 5-10 years of experience andrest had less than a year of experience). The detailed statisticsof subjects is available at [3] . We asked them to focuson specific code smells like Feature Envy, Long Methods,Shotgun Surgery, God class, etc. and list down all these smellsand record their comments/rationale for detecting these as codesmells. The template [1] had a column that asked them thesemantic meaning of the detected code smells. In addition,we asked them to provide reasoning for not agreeing withthe refactorings detected by the tools used. The subjects weregiven a three-week period to perform the activity and fill intemplates. After evaluation of the templates, results from 32subjects were taken into consideration. The other three did notfill in the templates completely. To cross-check the correctnessof the tools with respect to their semantic code smell detection,in addition to the two open-source systems, we instrumentedone of our own projects. It was interesting to note that most ofthe tools were not detecting code smells that seemed obviousfrom our perspective.
A. Subject Systems
In our study, we chose two open source systems:
• GanttProject - a free project management app where userscan create tasks, create project baseline, organize tasks ina work break down structure
• JHotDraw - a Java GUI framework for technical andstructured Graphics. Its design relies heavily on somewell-known design patterns.
The subject systems are available for use under open sourcelicense and are fairly well documented. In addition to beinga part of Qualitas Corpus [15], these are widely studied inrefactoring research and referenced in the literature. Table 1provides details of these systems.
QuASoQ 2015 Workshop Preprints
20
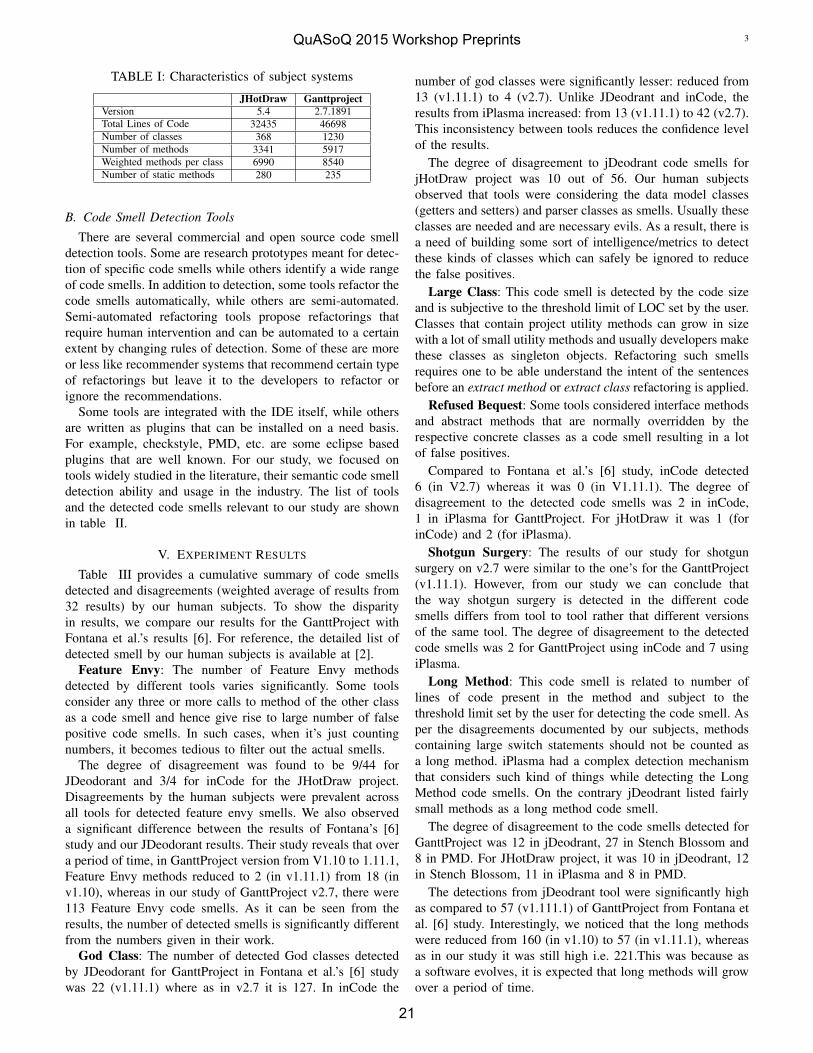
3
TABLE I: Characteristics of subject systems
JHotDraw GanttprojectVersion 5.4 2.7.1891Total Lines of Code 32435 46698Number of classes 368 1230Number of methods 3341 5917Weighted methods per class 6990 8540Number of static methods 280 235
B. Code Smell Detection Tools
There are several commercial and open source code smelldetection tools. Some are research prototypes meant for detec-tion of specific code smells while others identify a wide rangeof code smells. In addition to detection, some tools refactor thecode smells automatically, while others are semi-automated.Semi-automated refactoring tools propose refactorings thatrequire human intervention and can be automated to a certainextent by changing rules of detection. Some of these are moreor less like recommender systems that recommend certain typeof refactorings but leave it to the developers to refactor orignore the recommendations.
Some tools are integrated with the IDE itself, while othersare written as plugins that can be installed on a need basis.For example, checkstyle, PMD, etc. are some eclipse basedplugins that are well known. For our study, we focused ontools widely studied in the literature, their semantic code smelldetection ability and usage in the industry. The list of toolsand the detected code smells relevant to our study are shownin table II.
V. EXPERIMENT RESULTS
Table III provides a cumulative summary of code smellsdetected and disagreements (weighted average of results from32 results) by our human subjects. To show the disparityin results, we compare our results for the GanttProject withFontana et al.’s results [6]. For reference, the detailed list ofdetected smell by our human subjects is available at [2].
Feature Envy: The number of Feature Envy methodsdetected by different tools varies significantly. Some toolsconsider any three or more calls to method of the other classas a code smell and hence give rise to large number of falsepositive code smells. In such cases, when it’s just countingnumbers, it becomes tedious to filter out the actual smells.
The degree of disagreement was found to be 9/44 forJDeodorant and 3/4 for inCode for the JHotDraw project.Disagreements by the human subjects were prevalent acrossall tools for detected feature envy smells. We also observeda significant difference between the results of Fontana’s [6]study and our JDeodorant results. Their study reveals that overa period of time, in GanttProject version from V1.10 to 1.11.1,Feature Envy methods reduced to 2 (in v1.11.1) from 18 (inv1.10), whereas in our study of GanttProject v2.7, there were113 Feature Envy code smells. As it can be seen from theresults, the number of detected smells is significantly differentfrom the numbers given in their work.
God Class: The number of detected God classes detectedby JDeodorant for GanttProject in Fontana et al.’s [6] studywas 22 (v1.11.1) where as in v2.7 it is 127. In inCode the
number of god classes were significantly lesser: reduced from13 (v1.11.1) to 4 (v2.7). Unlike JDeodrant and inCode, theresults from iPlasma increased: from 13 (v1.11.1) to 42 (v2.7).This inconsistency between tools reduces the confidence levelof the results.
The degree of disagreement to jDeodrant code smells forjHotDraw project was 10 out of 56. Our human subjectsobserved that tools were considering the data model classes(getters and setters) and parser classes as smells. Usually theseclasses are needed and are necessary evils. As a result, there isa need of building some sort of intelligence/metrics to detectthese kinds of classes which can safely be ignored to reducethe false positives.
Large Class: This code smell is detected by the code sizeand is subjective to the threshold limit of LOC set by the user.Classes that contain project utility methods can grow in sizewith a lot of small utility methods and usually developers makethese classes as singleton objects. Refactoring such smellsrequires one to be able understand the intent of the sentencesbefore an extract method or extract class refactoring is applied.
Refused Bequest: Some tools considered interface methodsand abstract methods that are normally overridden by therespective concrete classes as a code smell resulting in a lotof false positives.
Compared to Fontana et al.’s [6] study, inCode detected6 (in V2.7) whereas it was 0 (in V1.11.1). The degree ofdisagreement to the detected code smells was 2 in inCode,1 in iPlasma for GanttProject. For jHotDraw it was 1 (forinCode) and 2 (for iPlasma).
Shotgun Surgery: The results of our study for shotgunsurgery on v2.7 were similar to the one’s for the GanttProject(v1.11.1). However, from our study we can conclude thatthe way shotgun surgery is detected in the different codesmells differs from tool to tool rather that different versionsof the same tool. The degree of disagreement to the detectedcode smells was 2 for GanttProject using inCode and 7 usingiPlasma.
Long Method: This code smell is related to number oflines of code present in the method and subject to thethreshold limit set by the user for detecting the code smell. Asper the disagreements documented by our subjects, methodscontaining large switch statements should not be counted asa long method. iPlasma had a complex detection mechanismthat considers such kind of things while detecting the LongMethod code smells. On the contrary jDeodrant listed fairlysmall methods as a long method code smell.
The degree of disagreement to the code smells detected forGanttProject was 12 in jDeodrant, 27 in Stench Blossom and8 in PMD. For JHotDraw project, it was 10 in jDeodrant, 12in Stench Blossom, 11 in iPlasma and 8 in PMD.
The detections from jDeodrant tool were significantly highas compared to 57 (v1.111.1) of GanttProject from Fontana etal. [6] study. Interestingly, we noticed that the long methodswere reduced from 160 (in v1.10) to 57 (in v1.11.1), whereasas in our study it was still high i.e. 221.This was because asa software evolves, it is expected that long methods will growover a period of time.
QuASoQ 2015 Workshop Preprints
21
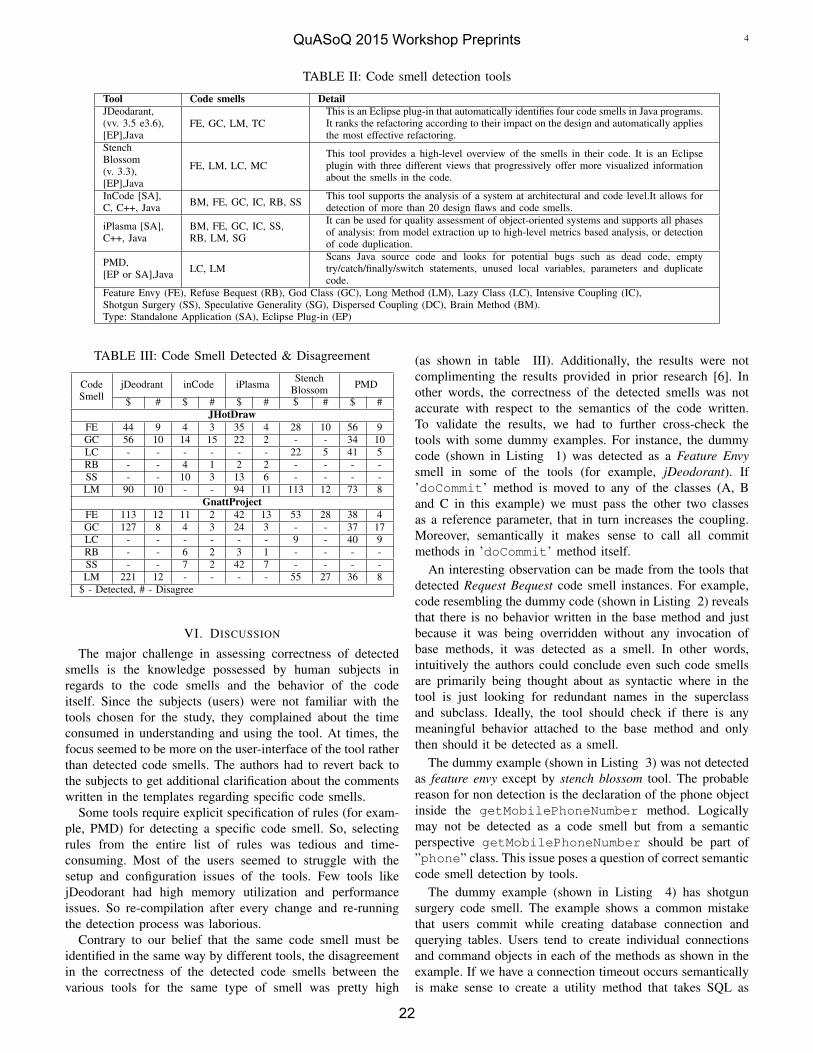
4
TABLE II: Code smell detection tools
Tool Code smells DetailJDeodarant,(vv. 3.5 e3.6),[EP],Java
FE, GC, LM, TCThis is an Eclipse plug-in that automatically identifies four code smells in Java programs.It ranks the refactoring according to their impact on the design and automatically appliesthe most effective refactoring.
StenchBlossom(v. 3.3),[EP],Java
FE, LM, LC, MCThis tool provides a high-level overview of the smells in their code. It is an Eclipseplugin with three different views that progressively offer more visualized informationabout the smells in the code.
InCode [SA],C, C++, Java BM, FE, GC, IC, RB, SS This tool supports the analysis of a system at architectural and code level.It allows for
detection of more than 20 design flaws and code smells.
iPlasma [SA],C++, Java
BM, FE, GC, IC, SS,RB, LM, SG
It can be used for quality assessment of object-oriented systems and supports all phasesof analysis: from model extraction up to high-level metrics based analysis, or detectionof code duplication.
PMD,[EP or SA],Java LC, LM
Scans Java source code and looks for potential bugs such as dead code, emptytry/catch/finally/switch statements, unused local variables, parameters and duplicatecode.
Feature Envy (FE), Refuse Bequest (RB), God Class (GC), Long Method (LM), Lazy Class (LC), Intensive Coupling (IC),Shotgun Surgery (SS), Speculative Generality (SG), Dispersed Coupling (DC), Brain Method (BM).Type: Standalone Application (SA), Eclipse Plug-in (EP)
TABLE III: Code Smell Detected & Disagreement
CodeSmell
jDeodrant inCode iPlasma StenchBlossom PMD
$ # $ # $ # $ # $ #JHotDraw
FE 44 9 4 3 35 4 28 10 56 9GC 56 10 14 15 22 2 - - 34 10LC - - - - - - 22 5 41 5RB - - 4 1 2 2 - - - -SS - - 10 3 13 6 - - - -LM 90 10 - - 94 11 113 12 73 8
GnattProjectFE 113 12 11 2 42 13 53 28 38 4GC 127 8 4 3 24 3 - - 37 17LC - - - - - - 9 - 40 9RB - - 6 2 3 1 - - - -SS - - 7 2 42 7 - - - -LM 221 12 - - - - 55 27 36 8
$ - Detected, # - Disagree
VI. DISCUSSION
The major challenge in assessing correctness of detectedsmells is the knowledge possessed by human subjects inregards to the code smells and the behavior of the codeitself. Since the subjects (users) were not familiar with thetools chosen for the study, they complained about the timeconsumed in understanding and using the tool. At times, thefocus seemed to be more on the user-interface of the tool ratherthan detected code smells. The authors had to revert back tothe subjects to get additional clarification about the commentswritten in the templates regarding specific code smells.
Some tools require explicit specification of rules (for exam-ple, PMD) for detecting a specific code smell. So, selectingrules from the entire list of rules was tedious and time-consuming. Most of the users seemed to struggle with thesetup and configuration issues of the tools. Few tools likejDeodorant had high memory utilization and performanceissues. So re-compilation after every change and re-runningthe detection process was laborious.
Contrary to our belief that the same code smell must beidentified in the same way by different tools, the disagreementin the correctness of the detected code smells between thevarious tools for the same type of smell was pretty high
(as shown in table III). Additionally, the results were notcomplimenting the results provided in prior research [6]. Inother words, the correctness of the detected smells was notaccurate with respect to the semantics of the code written.To validate the results, we had to further cross-check thetools with some dummy examples. For instance, the dummycode (shown in Listing 1) was detected as a Feature Envysmell in some of the tools (for example, jDeodorant). If’doCommit’ method is moved to any of the classes (A, Band C in this example) we must pass the other two classesas a reference parameter, that in turn increases the coupling.Moreover, semantically it makes sense to call all commitmethods in ’doCommit’ method itself.
An interesting observation can be made from the tools thatdetected Request Bequest code smell instances. For example,code resembling the dummy code (shown in Listing 2) revealsthat there is no behavior written in the base method and justbecause it was being overridden without any invocation ofbase methods, it was detected as a smell. In other words,intuitively the authors could conclude even such code smellsare primarily being thought about as syntactic where in thetool is just looking for redundant names in the superclassand subclass. Ideally, the tool should check if there is anymeaningful behavior attached to the base method and onlythen should it be detected as a smell.
The dummy example (shown in Listing 3) was not detectedas feature envy except by stench blossom tool. The probablereason for non detection is the declaration of the phone objectinside the getMobilePhoneNumber method. Logicallymay not be detected as a code smell but from a semanticperspective getMobilePhoneNumber should be part of”phone” class. This issue poses a question of correct semanticcode smell detection by tools.
The dummy example (shown in Listing 4) has shotgunsurgery code smell. The example shows a common mistakethat users commit while creating database connection andquerying tables. Users tend to create individual connectionsand command objects in each of the methods as shown in theexample. If we have a connection timeout occurs semanticallyis make sense to create a utility method that takes SQL as
QuASoQ 2015 Workshop Preprints
22
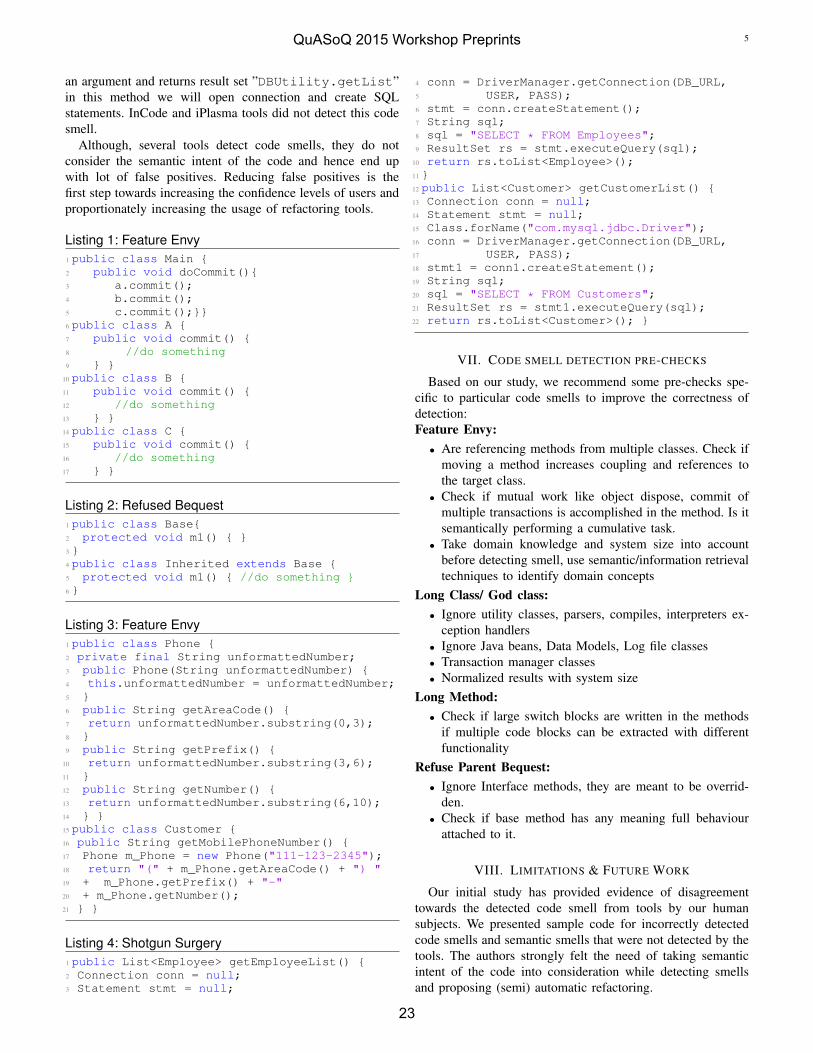
5
an argument and returns result set ”DBUtility.getList”in this method we will open connection and create SQLstatements. InCode and iPlasma tools did not detect this codesmell.
Although, several tools detect code smells, they do notconsider the semantic intent of the code and hence end upwith lot of false positives. Reducing false positives is thefirst step towards increasing the confidence levels of users andproportionately increasing the usage of refactoring tools.
Listing 1: Feature Envy1 public class Main {2 public void doCommit(){3 a.commit();4 b.commit();5 c.commit();}}6 public class A {7 public void commit() {8 //do something9 } }
10 public class B {11 public void commit() {12 //do something13 } }14 public class C {15 public void commit() {16 //do something17 } }
Listing 2: Refused Bequest1 public class Base{2 protected void m1() { }3 }4 public class Inherited extends Base {5 protected void m1() { //do something }6 }
Listing 3: Feature Envy1 public class Phone {2 private final String unformattedNumber;3 public Phone(String unformattedNumber) {4 this.unformattedNumber = unformattedNumber;5 }6 public String getAreaCode() {7 return unformattedNumber.substring(0,3);8 }9 public String getPrefix() {
10 return unformattedNumber.substring(3,6);11 }12 public String getNumber() {13 return unformattedNumber.substring(6,10);14 } }15 public class Customer {16 public String getMobilePhoneNumber() {17 Phone m_Phone = new Phone("111-123-2345");18 return "(" + m_Phone.getAreaCode() + ") "19 + m_Phone.getPrefix() + "-"20 + m_Phone.getNumber();21 } }
Listing 4: Shotgun Surgery1 public List<Employee> getEmployeeList() {2 Connection conn = null;3 Statement stmt = null;
4 conn = DriverManager.getConnection(DB_URL,5 USER, PASS);6 stmt = conn.createStatement();7 String sql;8 sql = "SELECT * FROM Employees";9 ResultSet rs = stmt.executeQuery(sql);
10 return rs.toList<Employee>();11 }12 public List<Customer> getCustomerList() {13 Connection conn = null;14 Statement stmt = null;15 Class.forName("com.mysql.jdbc.Driver");16 conn = DriverManager.getConnection(DB_URL,17 USER, PASS);18 stmt1 = conn1.createStatement();19 String sql;20 sql = "SELECT * FROM Customers";21 ResultSet rs = stmt1.executeQuery(sql);22 return rs.toList<Customer>(); }
VII. CODE SMELL DETECTION PRE-CHECKS
Based on our study, we recommend some pre-checks spe-cific to particular code smells to improve the correctness ofdetection:Feature Envy:
• Are referencing methods from multiple classes. Check ifmoving a method increases coupling and references tothe target class.
• Check if mutual work like object dispose, commit ofmultiple transactions is accomplished in the method. Is itsemantically performing a cumulative task.
• Take domain knowledge and system size into accountbefore detecting smell, use semantic/information retrievaltechniques to identify domain concepts
Long Class/ God class:• Ignore utility classes, parsers, compiles, interpreters ex-
ception handlers• Ignore Java beans, Data Models, Log file classes• Transaction manager classes• Normalized results with system size
Long Method:• Check if large switch blocks are written in the methods
if multiple code blocks can be extracted with differentfunctionality
Refuse Parent Bequest:• Ignore Interface methods, they are meant to be overrid-
den.• Check if base method has any meaning full behaviour
attached to it.
VIII. LIMITATIONS & FUTURE WORK
Our initial study has provided evidence of disagreementtowards the detected code smell from tools by our humansubjects. We presented sample code for incorrectly detectedcode smells and semantic smells that were not detected by thetools. The authors strongly felt the need of taking semanticintent of the code into consideration while detecting smellsand proposing (semi) automatic refactoring.
QuASoQ 2015 Workshop Preprints
23
6
The disagreement in detected code smells correlates tothe confidence levels of users. We saw that the results fromall the users were not the same for the same code smelldetection tools. So, the accuracy of these results can alwaysbe questioned. The results of Fontana et al. were used forcross-validation of our work. For the degree of disagreementto the detected code smells, we took an average of the overalldisagreement report by the users. But, code smell disagreementis subjective until a standardized method for detection andmeasurement is proposed.
As a future work we would to extend our experimentwith more industry level users. We would like to share thedisagreement detected by our human subjects with the actualdevelopers of the system to validate our findings. Towardsunderstanding the correctness of the semantic code smell wewould like to compare detection logic by tools.
REFERENCES
[1] Code smell evaluation template. http://bit.ly/1WBfZPy. [Online;accessed 30-June-2015].
[2] Code smells detected by human subjects & their disagreements. http://bit.ly/1BNJ6KS.
[3] Detailed profile of our human subjects. http://bit.ly/1KiuEvY. [Online;accessed 30-June-2015].
[4] D. Campbell and M. Miller. Designing refactoring tools for developers.In Proceedings of the 2Nd Workshop on Refactoring Tools, WRT ’08,pages 9:1–9:2, New York, NY, USA, 2008. ACM.
[5] V. Ferme, A. Marino, and F. A. Fontana. Is it a real code smell to beremoved or not? In International Workshop on Refactoring & Testing(RefTest), co-located event with XP 2013 Conference, 2013.
[6] F. Fontana, E. Mariani, A. Morniroli, R. Sormani, and A. Tonello. Anexperience report on using code smells detection tools. In SoftwareTesting, Verification and Validation Workshops (ICSTW), 2011 IEEEFourth International Conference on, pages 450–457, 2011.
[7] M. Fowler. Refactoring: improving the design of existing code. PearsonEducation India, 1999.
[8] J. Mahmood and Y. Reddy. Automated refactorings in java usingintellij idea to extract and propogate constants. In Advance ComputingConference (IACC), 2014 IEEE International, pages 1406–1414, 2014.
[9] M. MAntylA and C. Lassenius. Subjective evaluation of softwareevolvability using code smells: An empirical study. Empirical SoftwareEngineering, 11(3):395–431, 2006.
[10] S. Olbrich, D. Cruzes, and D. I. Sjoberg. Are all code smells harmful?a study of god classes and brain classes in the evolution of threeopen source systems. In Software Maintenance (ICSM), 2010 IEEEInternational Conference on, pages 1–10, 2010.
[11] W. F. Opdyke and R. E. Johnson. Refactoring: An aid in designing appli-cation frameworks and evolving object-oriented systems. In Symposiumon Object-Oriented Programming Emphasizing Practical Applications,September 1990., 1990.
[12] A. Ouni, M. Kessentini, H. Sahraoui, and M. Hamdi. Search-basedrefactoring: Towards semantics preservation. In Software Maintenance(ICSM), 2012 28th IEEE International Conference on, pages 347–356,Sept 2012.
[13] F. Palomba, G. Bavota, M. Di Penta, R. Oliveto, and A. De Lucia. Dothey really smell bad? a study on developers’ perception of bad codesmells. In Software Maintenance and Evolution (ICSME), 2014 IEEEInternational Conference on, pages 101–110, Sept 2014.
[14] G. H. Pinto and F. Kamei. What programmers say about refactoringtools?: An empirical investigation of stack overflow. In Proceedings ofthe 2013 ACM Workshop on Workshop on Refactoring Tools, WRT ’13,pages 33–36, New York, NY, USA, 2013. ACM.
[15] E. Tempero, C. Anslow, J. Dietrich, T. Han, J. Li, M. Lumpe, H. Melton,and J. Noble. The qualitas corpus: A curated collection of java code forempirical studies. In Software Engineering Conference (APSEC), 201017th Asia Pacific, pages 336–345, 2010.
[16] W. C. Wake. Refactoring Workbook. Addison-Wesley Longman,Publishing Co., Inc., Boston, MA, USA, 1 edition edition, 2003.
QuASoQ 2015 Workshop Preprints
24
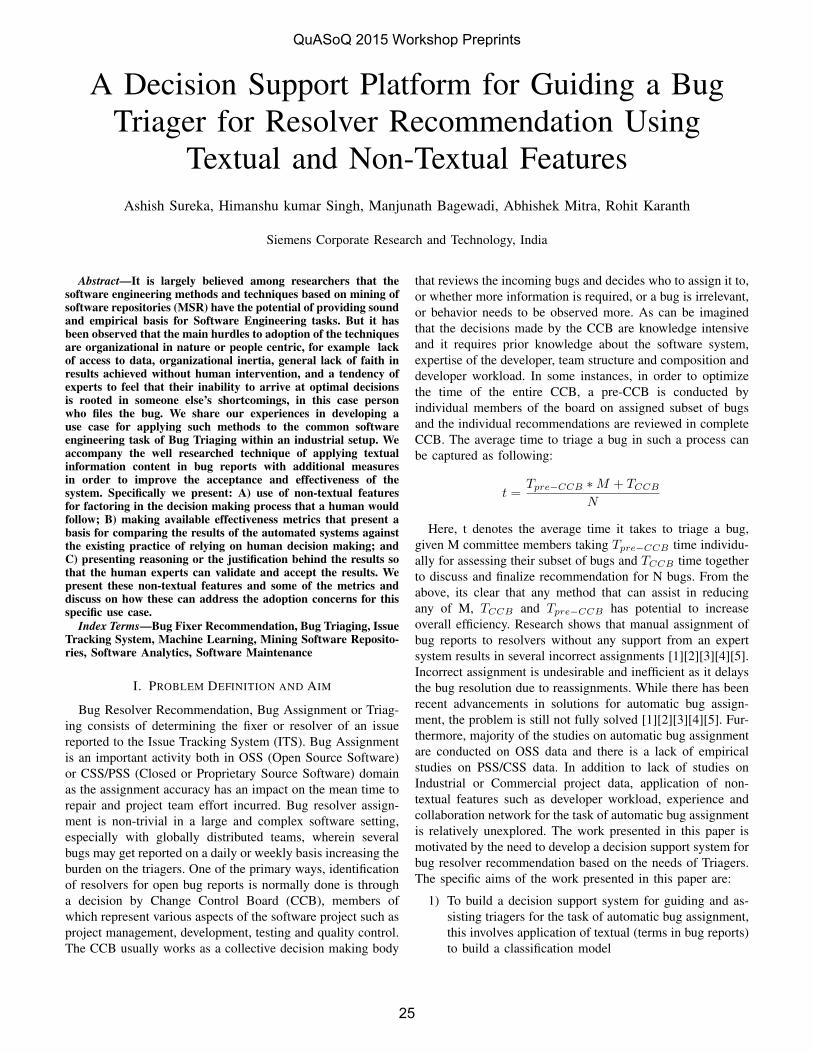
A Decision Support Platform for Guiding a BugTriager for Resolver Recommendation Using
Textual and Non-Textual FeaturesAshish Sureka, Himanshu kumar Singh, Manjunath Bagewadi, Abhishek Mitra, Rohit Karanth
Siemens Corporate Research and Technology, India
Abstract—It is largely believed among researchers that thesoftware engineering methods and techniques based on mining ofsoftware repositories (MSR) have the potential of providing soundand empirical basis for Software Engineering tasks. But it hasbeen observed that the main hurdles to adoption of the techniquesare organizational in nature or people centric, for example lackof access to data, organizational inertia, general lack of faith inresults achieved without human intervention, and a tendency ofexperts to feel that their inability to arrive at optimal decisionsis rooted in someone else’s shortcomings, in this case personwho files the bug. We share our experiences in developing ause case for applying such methods to the common softwareengineering task of Bug Triaging within an industrial setup. Weaccompany the well researched technique of applying textualinformation content in bug reports with additional measuresin order to improve the acceptance and effectiveness of thesystem. Specifically we present: A) use of non-textual featuresfor factoring in the decision making process that a human wouldfollow; B) making available effectiveness metrics that present abasis for comparing the results of the automated systems againstthe existing practice of relying on human decision making; andC) presenting reasoning or the justification behind the results sothat the human experts can validate and accept the results. Wepresent these non-textual features and some of the metrics anddiscuss on how these can address the adoption concerns for thisspecific use case.
Index Terms—Bug Fixer Recommendation, Bug Triaging, IssueTracking System, Machine Learning, Mining Software Reposito-ries, Software Analytics, Software Maintenance
I. PROBLEM DEFINITION AND AIM
Bug Resolver Recommendation, Bug Assignment or Triag-ing consists of determining the fixer or resolver of an issuereported to the Issue Tracking System (ITS). Bug Assignmentis an important activity both in OSS (Open Source Software)or CSS/PSS (Closed or Proprietary Source Software) domainas the assignment accuracy has an impact on the mean time torepair and project team effort incurred. Bug resolver assign-ment is non-trivial in a large and complex software setting,especially with globally distributed teams, wherein severalbugs may get reported on a daily or weekly basis increasing theburden on the triagers. One of the primary ways, identificationof resolvers for open bug reports is normally done is througha decision by Change Control Board (CCB), members ofwhich represent various aspects of the software project such asproject management, development, testing and quality control.The CCB usually works as a collective decision making body
that reviews the incoming bugs and decides who to assign it to,or whether more information is required, or a bug is irrelevant,or behavior needs to be observed more. As can be imaginedthat the decisions made by the CCB are knowledge intensiveand it requires prior knowledge about the software system,expertise of the developer, team structure and composition anddeveloper workload. In some instances, in order to optimizethe time of the entire CCB, a pre-CCB is conducted byindividual members of the board on assigned subset of bugsand the individual recommendations are reviewed in completeCCB. The average time to triage a bug in such a process canbe captured as following:
t =Tpre−CCB ∗M + TCCB
N
Here, t denotes the average time it takes to triage a bug,given M committee members taking Tpre−CCB time individu-ally for assessing their subset of bugs and TCCB time togetherto discuss and finalize recommendation for N bugs. From theabove, its clear that any method that can assist in reducingany of M, TCCB and Tpre−CCB has potential to increaseoverall efficiency. Research shows that manual assignment ofbug reports to resolvers without any support from an expertsystem results in several incorrect assignments [1][2][3][4][5].Incorrect assignment is undesirable and inefficient as it delaysthe bug resolution due to reassignments. While there has beenrecent advancements in solutions for automatic bug assign-ment, the problem is still not fully solved [1][2][3][4][5]. Fur-thermore, majority of the studies on automatic bug assignmentare conducted on OSS data and there is a lack of empiricalstudies on PSS/CSS data. In addition to lack of studies onIndustrial or Commercial project data, application of non-textual features such as developer workload, experience andcollaboration network for the task of automatic bug assignmentis relatively unexplored. The work presented in this paper ismotivated by the need to develop a decision support system forbug resolver recommendation based on the needs of Triagers.The specific aims of the work presented in this paper are:
1) To build a decision support system for guiding and as-sisting triagers for the task of automatic bug assignment,this involves application of textual (terms in bug reports)to build a classification model
QuASoQ 2015 Workshop Preprints
25
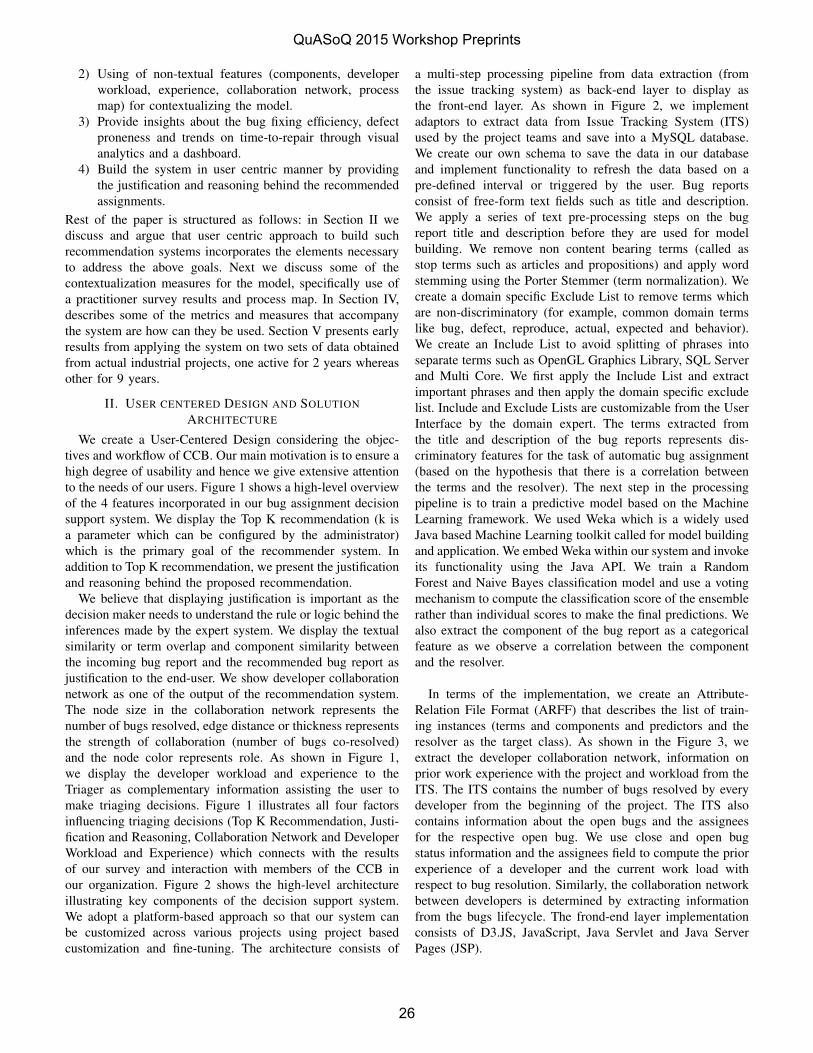
2) Using of non-textual features (components, developerworkload, experience, collaboration network, processmap) for contextualizing the model.
3) Provide insights about the bug fixing efficiency, defectproneness and trends on time-to-repair through visualanalytics and a dashboard.
4) Build the system in user centric manner by providingthe justification and reasoning behind the recommendedassignments.
Rest of the paper is structured as follows: in Section II wediscuss and argue that user centric approach to build suchrecommendation systems incorporates the elements necessaryto address the above goals. Next we discuss some of thecontextualization measures for the model, specifically use ofa practitioner survey results and process map. In Section IV,describes some of the metrics and measures that accompanythe system are how can they be used. Section V presents earlyresults from applying the system on two sets of data obtainedfrom actual industrial projects, one active for 2 years whereasother for 9 years.
II. USER CENTERED DESIGN AND SOLUTIONARCHITECTURE
We create a User-Centered Design considering the objec-tives and workflow of CCB. Our main motivation is to ensure ahigh degree of usability and hence we give extensive attentionto the needs of our users. Figure 1 shows a high-level overviewof the 4 features incorporated in our bug assignment decisionsupport system. We display the Top K recommendation (k isa parameter which can be configured by the administrator)which is the primary goal of the recommender system. Inaddition to Top K recommendation, we present the justificationand reasoning behind the proposed recommendation.
We believe that displaying justification is important as thedecision maker needs to understand the rule or logic behind theinferences made by the expert system. We display the textualsimilarity or term overlap and component similarity betweenthe incoming bug report and the recommended bug report asjustification to the end-user. We show developer collaborationnetwork as one of the output of the recommendation system.The node size in the collaboration network represents thenumber of bugs resolved, edge distance or thickness representsthe strength of collaboration (number of bugs co-resolved)and the node color represents role. As shown in Figure 1,we display the developer workload and experience to theTriager as complementary information assisting the user tomake triaging decisions. Figure 1 illustrates all four factorsinfluencing triaging decisions (Top K Recommendation, Justi-fication and Reasoning, Collaboration Network and DeveloperWorkload and Experience) which connects with the resultsof our survey and interaction with members of the CCB inour organization. Figure 2 shows the high-level architectureillustrating key components of the decision support system.We adopt a platform-based approach so that our system canbe customized across various projects using project basedcustomization and fine-tuning. The architecture consists of
a multi-step processing pipeline from data extraction (fromthe issue tracking system) as back-end layer to display asthe front-end layer. As shown in Figure 2, we implementadaptors to extract data from Issue Tracking System (ITS)used by the project teams and save into a MySQL database.We create our own schema to save the data in our databaseand implement functionality to refresh the data based on apre-defined interval or triggered by the user. Bug reportsconsist of free-form text fields such as title and description.We apply a series of text pre-processing steps on the bugreport title and description before they are used for modelbuilding. We remove non content bearing terms (called asstop terms such as articles and propositions) and apply wordstemming using the Porter Stemmer (term normalization). Wecreate a domain specific Exclude List to remove terms whichare non-discriminatory (for example, common domain termslike bug, defect, reproduce, actual, expected and behavior).We create an Include List to avoid splitting of phrases intoseparate terms such as OpenGL Graphics Library, SQL Serverand Multi Core. We first apply the Include List and extractimportant phrases and then apply the domain specific excludelist. Include and Exclude Lists are customizable from the UserInterface by the domain expert. The terms extracted fromthe title and description of the bug reports represents dis-criminatory features for the task of automatic bug assignment(based on the hypothesis that there is a correlation betweenthe terms and the resolver). The next step in the processingpipeline is to train a predictive model based on the MachineLearning framework. We used Weka which is a widely usedJava based Machine Learning toolkit called for model buildingand application. We embed Weka within our system and invokeits functionality using the Java API. We train a RandomForest and Naive Bayes classification model and use a votingmechanism to compute the classification score of the ensemblerather than individual scores to make the final predictions. Wealso extract the component of the bug report as a categoricalfeature as we observe a correlation between the componentand the resolver.
In terms of the implementation, we create an Attribute-Relation File Format (ARFF) that describes the list of train-ing instances (terms and components and predictors and theresolver as the target class). As shown in the Figure 3, weextract the developer collaboration network, information onprior work experience with the project and workload from theITS. The ITS contains the number of bugs resolved by everydeveloper from the beginning of the project. The ITS alsocontains information about the open bugs and the assigneesfor the respective open bug. We use close and open bugstatus information and the assignees field to compute the priorexperience of a developer and the current work load withrespect to bug resolution. Similarly, the collaboration networkbetween developers is determined by extracting informationfrom the bugs lifecycle. The frond-end layer implementationconsists of D3.JS, JavaScript, Java Servlet and Java ServerPages (JSP).
QuASoQ 2015 Workshop Preprints
26
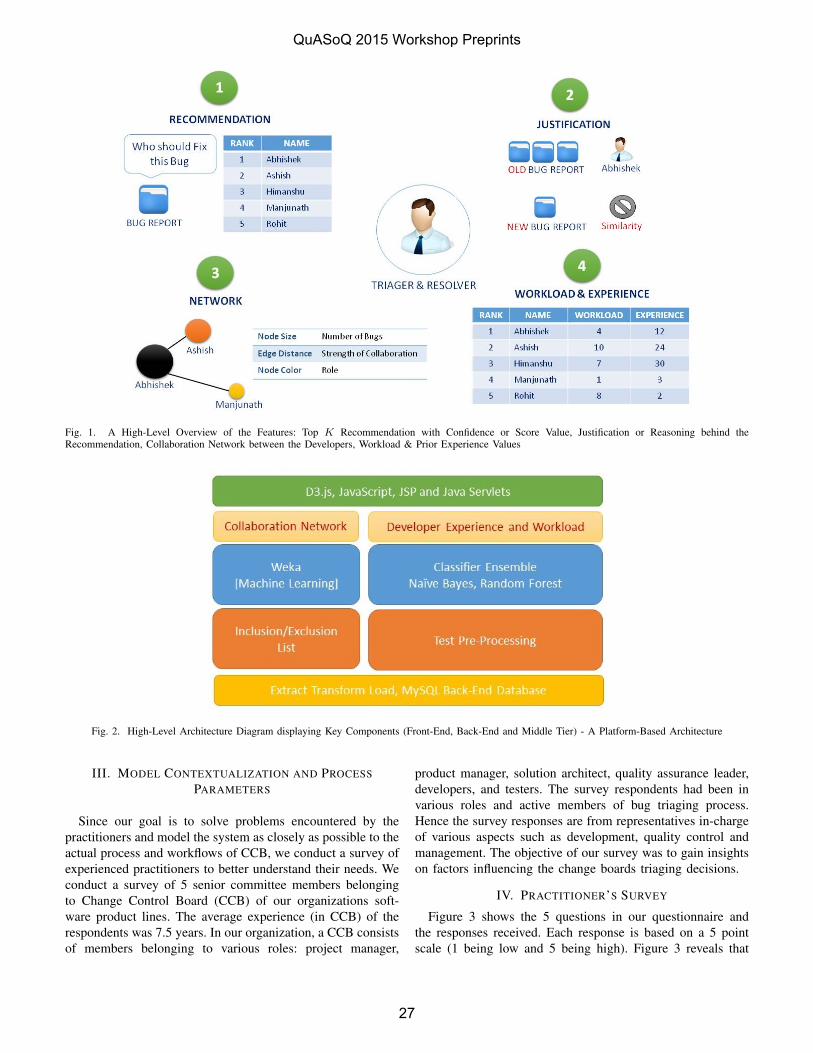
Fig. 1. A High-Level Overview of the Features: Top K Recommendation with Confidence or Score Value, Justification or Reasoning behind theRecommendation, Collaboration Network between the Developers, Workload & Prior Experience Values
Fig. 2. High-Level Architecture Diagram displaying Key Components (Front-End, Back-End and Middle Tier) - A Platform-Based Architecture
III. MODEL CONTEXTUALIZATION AND PROCESSPARAMETERS
Since our goal is to solve problems encountered by thepractitioners and model the system as closely as possible to theactual process and workflows of CCB, we conduct a survey ofexperienced practitioners to better understand their needs. Weconduct a survey of 5 senior committee members belongingto Change Control Board (CCB) of our organizations soft-ware product lines. The average experience (in CCB) of therespondents was 7.5 years. In our organization, a CCB consistsof members belonging to various roles: project manager,
product manager, solution architect, quality assurance leader,developers, and testers. The survey respondents had been invarious roles and active members of bug triaging process.Hence the survey responses are from representatives in-chargeof various aspects such as development, quality control andmanagement. The objective of our survey was to gain insightson factors influencing the change boards triaging decisions.
IV. PRACTITIONER’S SURVEY
Figure 3 shows the 5 questions in our questionnaire andthe responses received. Each response is based on a 5 pointscale (1 being low and 5 being high). Figure 3 reveals that
QuASoQ 2015 Workshop Preprints
27
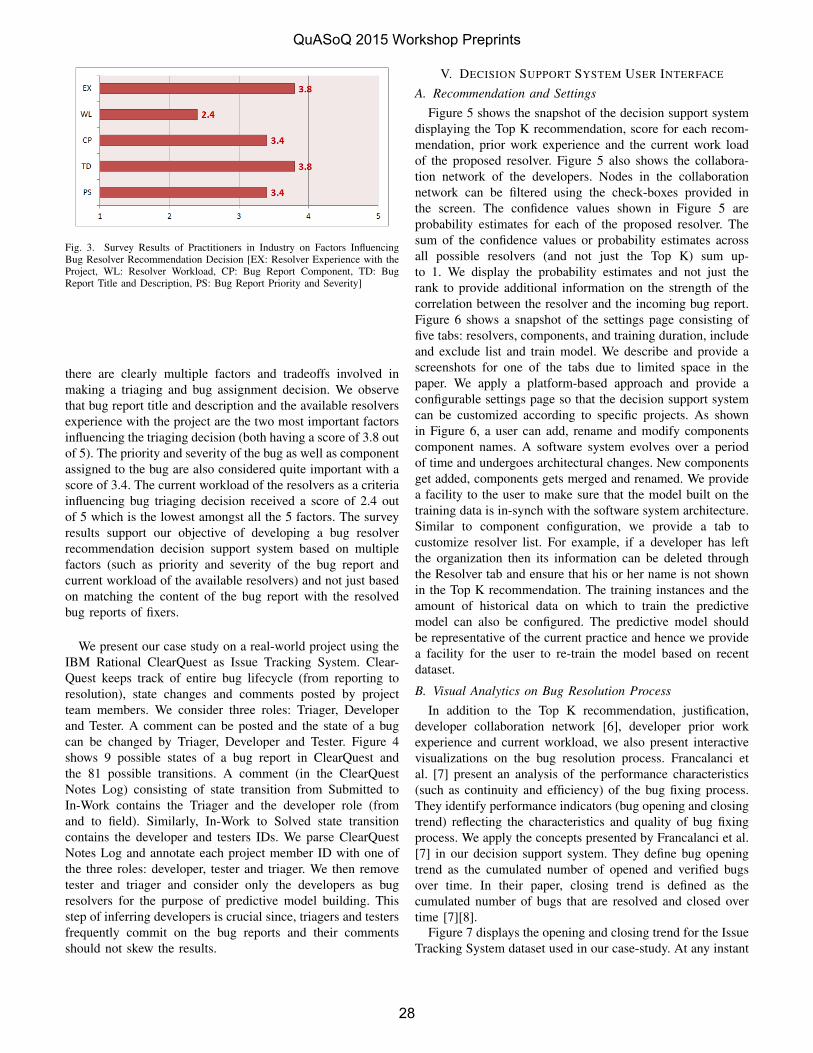
Fig. 3. Survey Results of Practitioners in Industry on Factors InfluencingBug Resolver Recommendation Decision [EX: Resolver Experience with theProject, WL: Resolver Workload, CP: Bug Report Component, TD: BugReport Title and Description, PS: Bug Report Priority and Severity]
there are clearly multiple factors and tradeoffs involved inmaking a triaging and bug assignment decision. We observethat bug report title and description and the available resolversexperience with the project are the two most important factorsinfluencing the triaging decision (both having a score of 3.8 outof 5). The priority and severity of the bug as well as componentassigned to the bug are also considered quite important with ascore of 3.4. The current workload of the resolvers as a criteriainfluencing bug triaging decision received a score of 2.4 outof 5 which is the lowest amongst all the 5 factors. The surveyresults support our objective of developing a bug resolverrecommendation decision support system based on multiplefactors (such as priority and severity of the bug report andcurrent workload of the available resolvers) and not just basedon matching the content of the bug report with the resolvedbug reports of fixers.
We present our case study on a real-world project using theIBM Rational ClearQuest as Issue Tracking System. Clear-Quest keeps track of entire bug lifecycle (from reporting toresolution), state changes and comments posted by projectteam members. We consider three roles: Triager, Developerand Tester. A comment can be posted and the state of a bugcan be changed by Triager, Developer and Tester. Figure 4shows 9 possible states of a bug report in ClearQuest andthe 81 possible transitions. A comment (in the ClearQuestNotes Log) consisting of state transition from Submitted toIn-Work contains the Triager and the developer role (fromand to field). Similarly, In-Work to Solved state transitioncontains the developer and testers IDs. We parse ClearQuestNotes Log and annotate each project member ID with one ofthe three roles: developer, tester and triager. We then removetester and triager and consider only the developers as bugresolvers for the purpose of predictive model building. Thisstep of inferring developers is crucial since, triagers and testersfrequently commit on the bug reports and their commentsshould not skew the results.
V. DECISION SUPPORT SYSTEM USER INTERFACE
A. Recommendation and SettingsFigure 5 shows the snapshot of the decision support system
displaying the Top K recommendation, score for each recom-mendation, prior work experience and the current work loadof the proposed resolver. Figure 5 also shows the collabora-tion network of the developers. Nodes in the collaborationnetwork can be filtered using the check-boxes provided inthe screen. The confidence values shown in Figure 5 areprobability estimates for each of the proposed resolver. Thesum of the confidence values or probability estimates acrossall possible resolvers (and not just the Top K) sum up-to 1. We display the probability estimates and not just therank to provide additional information on the strength of thecorrelation between the resolver and the incoming bug report.Figure 6 shows a snapshot of the settings page consisting offive tabs: resolvers, components, and training duration, includeand exclude list and train model. We describe and provide ascreenshots for one of the tabs due to limited space in thepaper. We apply a platform-based approach and provide aconfigurable settings page so that the decision support systemcan be customized according to specific projects. As shownin Figure 6, a user can add, rename and modify componentscomponent names. A software system evolves over a periodof time and undergoes architectural changes. New componentsget added, components gets merged and renamed. We providea facility to the user to make sure that the model built on thetraining data is in-synch with the software system architecture.Similar to component configuration, we provide a tab tocustomize resolver list. For example, if a developer has leftthe organization then its information can be deleted throughthe Resolver tab and ensure that his or her name is not shownin the Top K recommendation. The training instances and theamount of historical data on which to train the predictivemodel can also be configured. The predictive model shouldbe representative of the current practice and hence we providea facility for the user to re-train the model based on recentdataset.
B. Visual Analytics on Bug Resolution ProcessIn addition to the Top K recommendation, justification,
developer collaboration network [6], developer prior workexperience and current workload, we also present interactivevisualizations on the bug resolution process. Francalanci etal. [7] present an analysis of the performance characteristics(such as continuity and efficiency) of the bug fixing process.They identify performance indicators (bug opening and closingtrend) reflecting the characteristics and quality of bug fixingprocess. We apply the concepts presented by Francalanci et al.[7] in our decision support system. They define bug openingtrend as the cumulated number of opened and verified bugsover time. In their paper, closing trend is defined as thecumulated number of bugs that are resolved and closed overtime [7][8].
Figure 7 displays the opening and closing trend for the IssueTracking System dataset used in our case-study. At any instant
QuASoQ 2015 Workshop Preprints
28
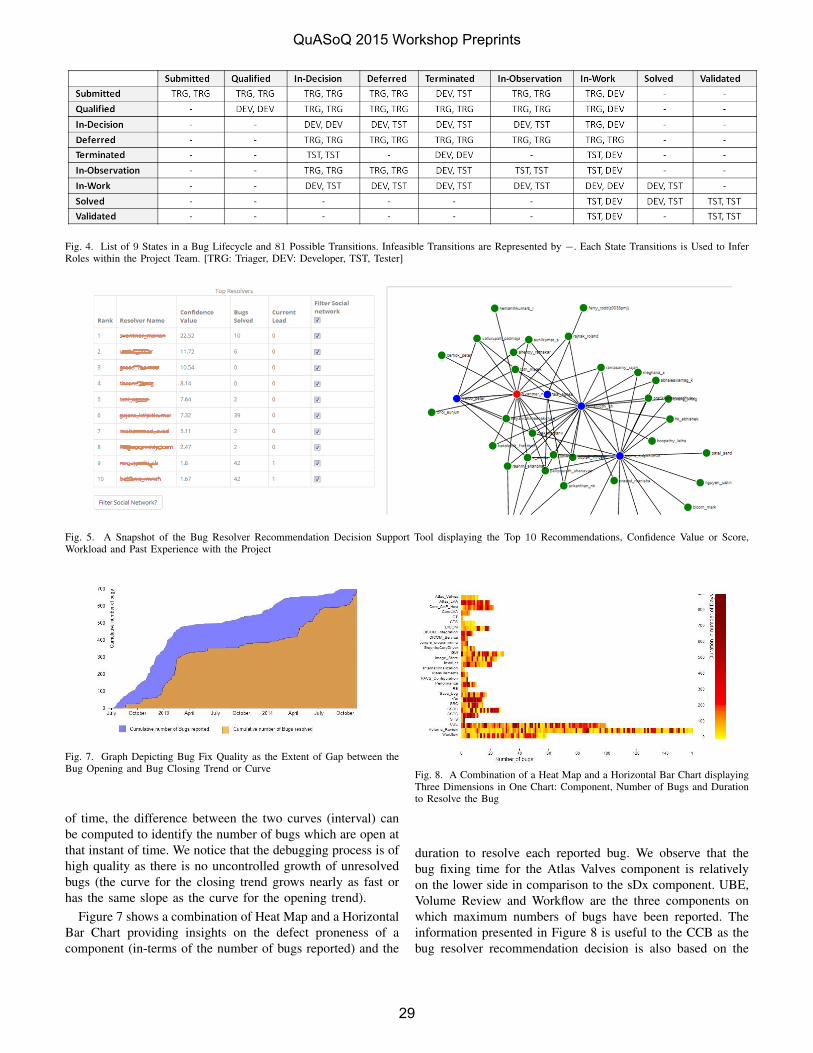
Fig. 4. List of 9 States in a Bug Lifecycle and 81 Possible Transitions. Infeasible Transitions are Represented by −. Each State Transitions is Used to InferRoles within the Project Team. [TRG: Triager, DEV: Developer, TST, Tester]
Fig. 5. A Snapshot of the Bug Resolver Recommendation Decision Support Tool displaying the Top 10 Recommendations, Confidence Value or Score,Workload and Past Experience with the Project
Fig. 7. Graph Depicting Bug Fix Quality as the Extent of Gap between theBug Opening and Bug Closing Trend or Curve
of time, the difference between the two curves (interval) canbe computed to identify the number of bugs which are open atthat instant of time. We notice that the debugging process is ofhigh quality as there is no uncontrolled growth of unresolvedbugs (the curve for the closing trend grows nearly as fast orhas the same slope as the curve for the opening trend).
Figure 7 shows a combination of Heat Map and a HorizontalBar Chart providing insights on the defect proneness of acomponent (in-terms of the number of bugs reported) and the
Fig. 8. A Combination of a Heat Map and a Horizontal Bar Chart displayingThree Dimensions in One Chart: Component, Number of Bugs and Durationto Resolve the Bug
duration to resolve each reported bug. We observe that thebug fixing time for the Atlas Valves component is relativelyon the lower side in comparison to the sDx component. UBE,Volume Review and Workflow are the three components onwhich maximum numbers of bugs have been reported. Theinformation presented in Figure 8 is useful to the CCB as thebug resolver recommendation decision is also based on the
QuASoQ 2015 Workshop Preprints
29
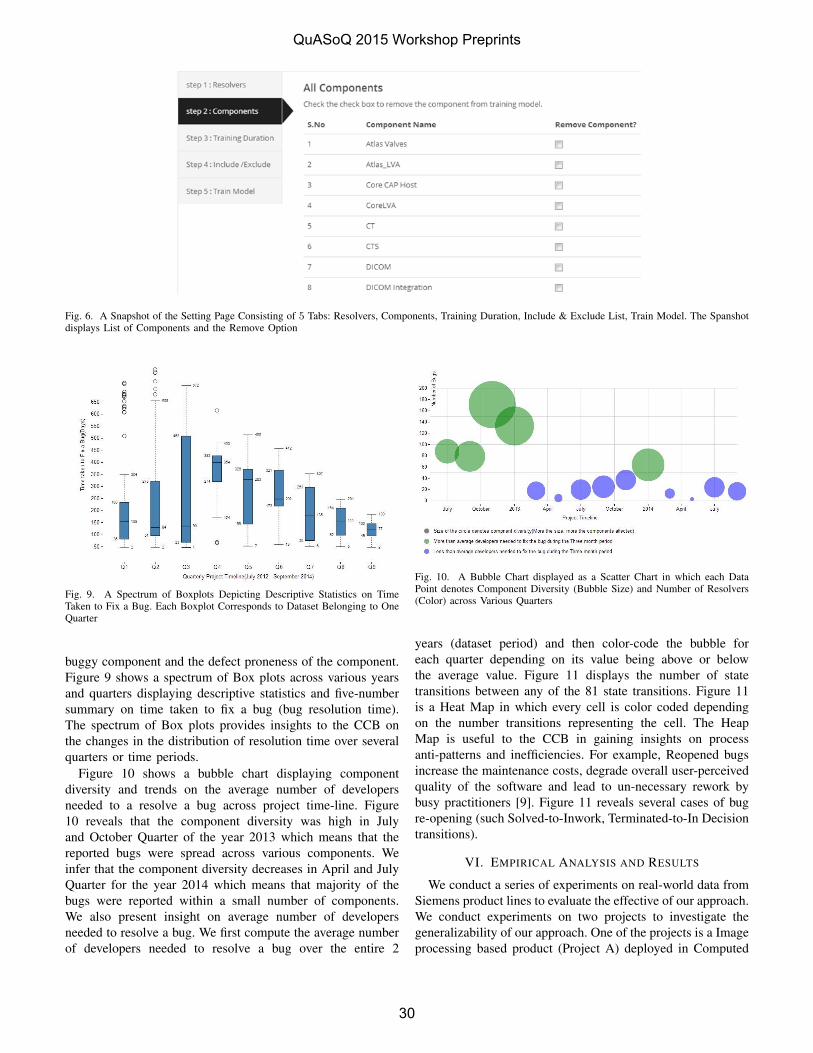
Fig. 6. A Snapshot of the Setting Page Consisting of 5 Tabs: Resolvers, Components, Training Duration, Include & Exclude List, Train Model. The Spanshotdisplays List of Components and the Remove Option
Fig. 9. A Spectrum of Boxplots Depicting Descriptive Statistics on TimeTaken to Fix a Bug. Each Boxplot Corresponds to Dataset Belonging to OneQuarter
buggy component and the defect proneness of the component.Figure 9 shows a spectrum of Box plots across various yearsand quarters displaying descriptive statistics and five-numbersummary on time taken to fix a bug (bug resolution time).The spectrum of Box plots provides insights to the CCB onthe changes in the distribution of resolution time over severalquarters or time periods.
Figure 10 shows a bubble chart displaying componentdiversity and trends on the average number of developersneeded to a resolve a bug across project time-line. Figure10 reveals that the component diversity was high in Julyand October Quarter of the year 2013 which means that thereported bugs were spread across various components. Weinfer that the component diversity decreases in April and JulyQuarter for the year 2014 which means that majority of thebugs were reported within a small number of components.We also present insight on average number of developersneeded to resolve a bug. We first compute the average numberof developers needed to resolve a bug over the entire 2
Fig. 10. A Bubble Chart displayed as a Scatter Chart in which each DataPoint denotes Component Diversity (Bubble Size) and Number of Resolvers(Color) across Various Quarters
years (dataset period) and then color-code the bubble foreach quarter depending on its value being above or belowthe average value. Figure 11 displays the number of statetransitions between any of the 81 state transitions. Figure 11is a Heat Map in which every cell is color coded dependingon the number transitions representing the cell. The HeapMap is useful to the CCB in gaining insights on processanti-patterns and inefficiencies. For example, Reopened bugsincrease the maintenance costs, degrade overall user-perceivedquality of the software and lead to un-necessary rework bybusy practitioners [9]. Figure 11 reveals several cases of bugre-opening (such Solved-to-Inwork, Terminated-to-In Decisiontransitions).
VI. EMPIRICAL ANALYSIS AND RESULTS
We conduct a series of experiments on real-world data fromSiemens product lines to evaluate the effective of our approach.We conduct experiments on two projects to investigate thegeneralizability of our approach. One of the projects is a Imageprocessing based product (Project A) deployed in Computed
QuASoQ 2015 Workshop Preprints
30
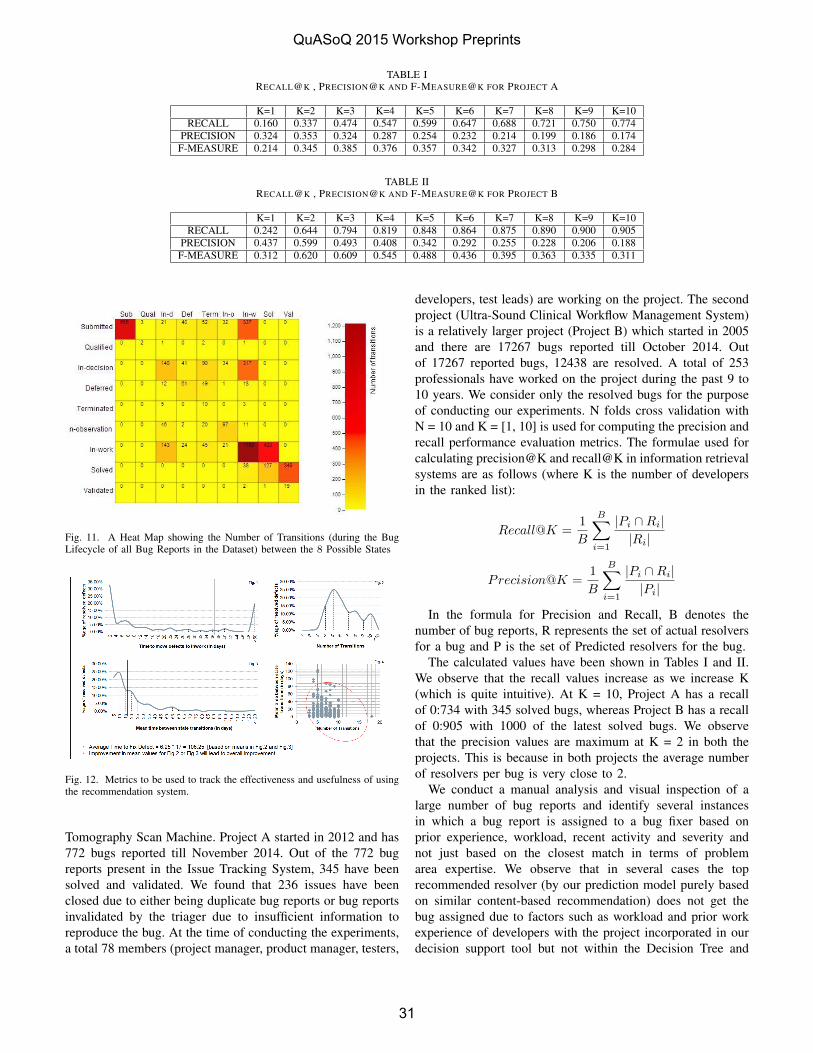
TABLE IRECALL@K , PRECISION@K AND F-MEASURE@K FOR PROJECT A
K=1 K=2 K=3 K=4 K=5 K=6 K=7 K=8 K=9 K=10RECALL 0.160 0.337 0.474 0.547 0.599 0.647 0.688 0.721 0.750 0.774
PRECISION 0.324 0.353 0.324 0.287 0.254 0.232 0.214 0.199 0.186 0.174F-MEASURE 0.214 0.345 0.385 0.376 0.357 0.342 0.327 0.313 0.298 0.284
TABLE IIRECALL@K , PRECISION@K AND F-MEASURE@K FOR PROJECT B
K=1 K=2 K=3 K=4 K=5 K=6 K=7 K=8 K=9 K=10RECALL 0.242 0.644 0.794 0.819 0.848 0.864 0.875 0.890 0.900 0.905
PRECISION 0.437 0.599 0.493 0.408 0.342 0.292 0.255 0.228 0.206 0.188F-MEASURE 0.312 0.620 0.609 0.545 0.488 0.436 0.395 0.363 0.335 0.311
Fig. 11. A Heat Map showing the Number of Transitions (during the BugLifecycle of all Bug Reports in the Dataset) between the 8 Possible States
Fig. 12. Metrics to be used to track the effectiveness and usefulness of usingthe recommendation system.
Tomography Scan Machine. Project A started in 2012 and has772 bugs reported till November 2014. Out of the 772 bugreports present in the Issue Tracking System, 345 have beensolved and validated. We found that 236 issues have beenclosed due to either being duplicate bug reports or bug reportsinvalidated by the triager due to insufficient information toreproduce the bug. At the time of conducting the experiments,a total 78 members (project manager, product manager, testers,
developers, test leads) are working on the project. The secondproject (Ultra-Sound Clinical Workflow Management System)is a relatively larger project (Project B) which started in 2005and there are 17267 bugs reported till October 2014. Outof 17267 reported bugs, 12438 are resolved. A total of 253professionals have worked on the project during the past 9 to10 years. We consider only the resolved bugs for the purposeof conducting our experiments. N folds cross validation withN = 10 and K = [1, 10] is used for computing the precision andrecall performance evaluation metrics. The formulae used forcalculating precision@K and recall@K in information retrievalsystems are as follows (where K is the number of developersin the ranked list):
Recall@K =1
B
B∑i=1
|Pi ∩Ri||Ri|
Precision@K =1
B
B∑i=1
|Pi ∩Ri||Pi|
In the formula for Precision and Recall, B denotes thenumber of bug reports, R represents the set of actual resolversfor a bug and P is the set of Predicted resolvers for the bug.
The calculated values have been shown in Tables I and II.We observe that the recall values increase as we increase K(which is quite intuitive). At K = 10, Project A has a recallof 0:734 with 345 solved bugs, whereas Project B has a recallof 0:905 with 1000 of the latest solved bugs. We observethat the precision values are maximum at K = 2 in both theprojects. This is because in both projects the average numberof resolvers per bug is very close to 2.
We conduct a manual analysis and visual inspection of alarge number of bug reports and identify several instancesin which a bug report is assigned to a bug fixer based onprior experience, workload, recent activity and severity andnot just based on the closest match in terms of problemarea expertise. We observe that in several cases the toprecommended resolver (by our prediction model purely basedon similar content-based recommendation) does not get thebug assigned due to factors such as workload and prior workexperience of developers with the project incorporated in ourdecision support tool but not within the Decision Tree and
QuASoQ 2015 Workshop Preprints
31
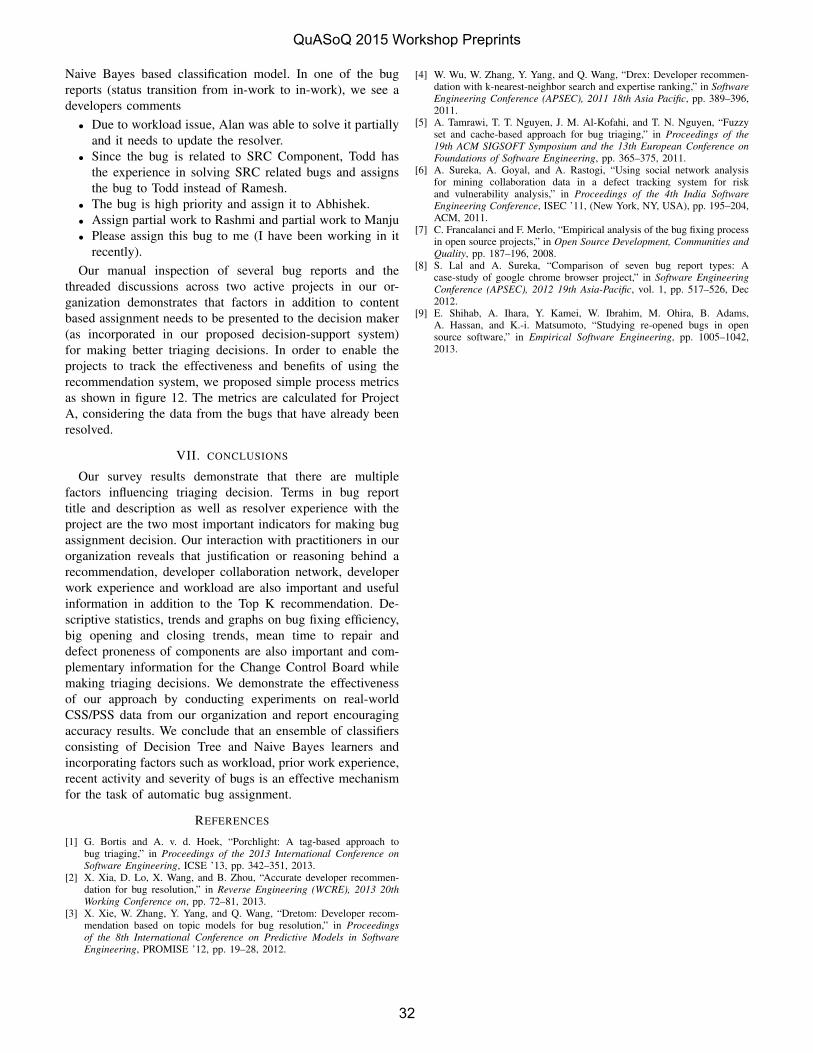
Naive Bayes based classification model. In one of the bugreports (status transition from in-work to in-work), we see adevelopers comments
• Due to workload issue, Alan was able to solve it partiallyand it needs to update the resolver.
• Since the bug is related to SRC Component, Todd hasthe experience in solving SRC related bugs and assignsthe bug to Todd instead of Ramesh.
• The bug is high priority and assign it to Abhishek.• Assign partial work to Rashmi and partial work to Manju• Please assign this bug to me (I have been working in it
recently).Our manual inspection of several bug reports and the
threaded discussions across two active projects in our or-ganization demonstrates that factors in addition to contentbased assignment needs to be presented to the decision maker(as incorporated in our proposed decision-support system)for making better triaging decisions. In order to enable theprojects to track the effectiveness and benefits of using therecommendation system, we proposed simple process metricsas shown in figure 12. The metrics are calculated for ProjectA, considering the data from the bugs that have already beenresolved.
VII. CONCLUSIONS
Our survey results demonstrate that there are multiplefactors influencing triaging decision. Terms in bug reporttitle and description as well as resolver experience with theproject are the two most important indicators for making bugassignment decision. Our interaction with practitioners in ourorganization reveals that justification or reasoning behind arecommendation, developer collaboration network, developerwork experience and workload are also important and usefulinformation in addition to the Top K recommendation. De-scriptive statistics, trends and graphs on bug fixing efficiency,big opening and closing trends, mean time to repair anddefect proneness of components are also important and com-plementary information for the Change Control Board whilemaking triaging decisions. We demonstrate the effectivenessof our approach by conducting experiments on real-worldCSS/PSS data from our organization and report encouragingaccuracy results. We conclude that an ensemble of classifiersconsisting of Decision Tree and Naive Bayes learners andincorporating factors such as workload, prior work experience,recent activity and severity of bugs is an effective mechanismfor the task of automatic bug assignment.
REFERENCES
[1] G. Bortis and A. v. d. Hoek, “Porchlight: A tag-based approach tobug triaging,” in Proceedings of the 2013 International Conference onSoftware Engineering, ICSE ’13, pp. 342–351, 2013.
[2] X. Xia, D. Lo, X. Wang, and B. Zhou, “Accurate developer recommen-dation for bug resolution,” in Reverse Engineering (WCRE), 2013 20thWorking Conference on, pp. 72–81, 2013.
[3] X. Xie, W. Zhang, Y. Yang, and Q. Wang, “Dretom: Developer recom-mendation based on topic models for bug resolution,” in Proceedingsof the 8th International Conference on Predictive Models in SoftwareEngineering, PROMISE ’12, pp. 19–28, 2012.
[4] W. Wu, W. Zhang, Y. Yang, and Q. Wang, “Drex: Developer recommen-dation with k-nearest-neighbor search and expertise ranking,” in SoftwareEngineering Conference (APSEC), 2011 18th Asia Pacific, pp. 389–396,2011.
[5] A. Tamrawi, T. T. Nguyen, J. M. Al-Kofahi, and T. N. Nguyen, “Fuzzyset and cache-based approach for bug triaging,” in Proceedings of the19th ACM SIGSOFT Symposium and the 13th European Conference onFoundations of Software Engineering, pp. 365–375, 2011.
[6] A. Sureka, A. Goyal, and A. Rastogi, “Using social network analysisfor mining collaboration data in a defect tracking system for riskand vulnerability analysis,” in Proceedings of the 4th India SoftwareEngineering Conference, ISEC ’11, (New York, NY, USA), pp. 195–204,ACM, 2011.
[7] C. Francalanci and F. Merlo, “Empirical analysis of the bug fixing processin open source projects,” in Open Source Development, Communities andQuality, pp. 187–196, 2008.
[8] S. Lal and A. Sureka, “Comparison of seven bug report types: Acase-study of google chrome browser project,” in Software EngineeringConference (APSEC), 2012 19th Asia-Pacific, vol. 1, pp. 517–526, Dec2012.
[9] E. Shihab, A. Ihara, Y. Kamei, W. Ibrahim, M. Ohira, B. Adams,A. Hassan, and K.-i. Matsumoto, “Studying re-opened bugs in opensource software,” in Empirical Software Engineering, pp. 1005–1042,2013.
QuASoQ 2015 Workshop Preprints
32
The Way Ahead for Bug-fix time Prediction
Meera Sharma Department of Computer Science
University of Delhi
Delhi, India
Madhu Kumari
Department of Computer Science
University of Delhi
Delhi, India
V.B.Singh
Delhi College of Arts & Commerce,
University of Delhi
Delhi, India
Abstract— The bug-fix time i.e. the time to fix a bug after the
bug was introduced is an important factor for bug related
analysis, such as measuring software quality or coordinating
development effort during bug triaging. Previous work has
proposed many bug-fix time prediction models that use various
bug attributes (number of developers who participated in fixing
the bug, bug severity, bug-opener’s reputation, number of
patches) for predicting the fix time of a newly reported bug. In
this paper, we have investigated the associations between bug
attributes and the bug-fix time. We have proposed two
approaches to apply association rule mining. In the first
approach, we have used Apriori algorithm to predict the fix time
of a newly coming bug based on the bug’s severity, priority
summary terms and assignee. In second approach, we have used
k-means clustering method to get groups of correlated variables
followed by association rule mining inside each cluster. We have
collected 1,695 bug reports of three products namely
AddOnSDK, Thunderbird and Bugzilla of Mozilla open source
project to mine association rules. Results show that for given set
of bug attributes, we can predict the bug-fix time for newly
coming bugs which will help in software quality improvement. A
large number of association rules having high confidence and
support with higher severity and priority as antecedents and
short bug-fix time as consequent show that more important bugs
are fixed without any delay. This information is useful in
determining software quality. We also observe that our approach
for bug-fix time prediction will be helpful in bug triaging by
assigning a bug to the most potential and experienced assignee
who will solve the bug in minimum time period. This will again
help in software quality improvement. In nutshell, we can say
that association rule mining based bug-fix time prediction can
help managers to improve the software development process.
Keywords—Bug-fix time; Apriori algorithm; Association rule
mining; k-means Clustering
I. INTRODUCTION
Bug-fix time prediction is useful in software quality prediction [1] or in coordinating effort during bug triaging to maintain the software systems effectively [2]. In literature efforts have been made to construct many bug-fix time prediction models, based on machine learning algorithms, on both open source and commercial projects [3-5].
A bug report is characterized by many attributes like summary, priority, severity and assignee. The textual description of a bug reported by users is known as its summary. Bug priority tells about the importance and order of bug fixing in comparison of other bugs with P1 as the highest and P5 as the lowest priority. The bug severity can be defined as: (i) the impact of bugs on the functionality of the software (business point of view) (ii) the impact of bugs on developer means how much time a bug will take in fixing. In this paper,
we consider the bug severity from the business point of view. It is measured according to different levels from 1(blocker) to 7(trivial). These levels are defined in repositories as 1 for highest and 7 for lowest. Assignee is a person to whom the bug is assigned to work on.
To the best of our knowledge, no approach has been proposed till now to mine association rules among different bug attributes for bug-fix time prediction. In software development this can help the managers to improve the process in terms of cost and resources. We have proposed an approach for bug fix time prediction based on other bug attributes namely summary terms, priority, severity and assignee. We have applied association rule mining by using Apriori algorithm and k-means clustering followed by Apriori algorithm. For experiment of the proposed approach we have used 1,695 bug reports of AddOnSDK, Thunderbird and Bugzilla products of Mozilla open source project. Association rule mining was first explored by [7] which is the base of our prediction method.
In a database, the interesting correlations, frequent patterns, associations or casual structures among the attributes can be discovered by using association rule mining. Let C is a database of transactions and each transaction T is a set of items. An association rule is an expression A⇒ D, where A is called antecedent and D is called consequent. A⇒ D reveals that whenever a transaction T contains A, then T also contains D with a specified confidence and support. The confidence of a rule is defined as percentage/fraction of the number of transactions that contain A∪D to the total number of transactions that contain A. It is a measure of the rule’s strength or certainty [8]. Support of a rule is defined as the percentage/fraction of transactions that contain A∪D to the total number of transactions in the database. It corresponds to statistical significance or usefulness of the rule. Minimum support count is defined as the number of transactions required for an item set to satisfy minimum support. Association rule mining generates all association rules that have a support greater than minimum support min.Supp(A⇒D), in the database, i.e., the rules are frequent. The rules must also have confidence greater than minimum confidence min.Conf(A⇒ D), i.e., the rules are strong.
In a wide range of science and business areas association rule mining can be applied successfully. Several performance studies have resulted in better accuracy for associative classification than state-of-the-art classification methods [9-18].
QuASoQ 2015 Workshop Preprints
33
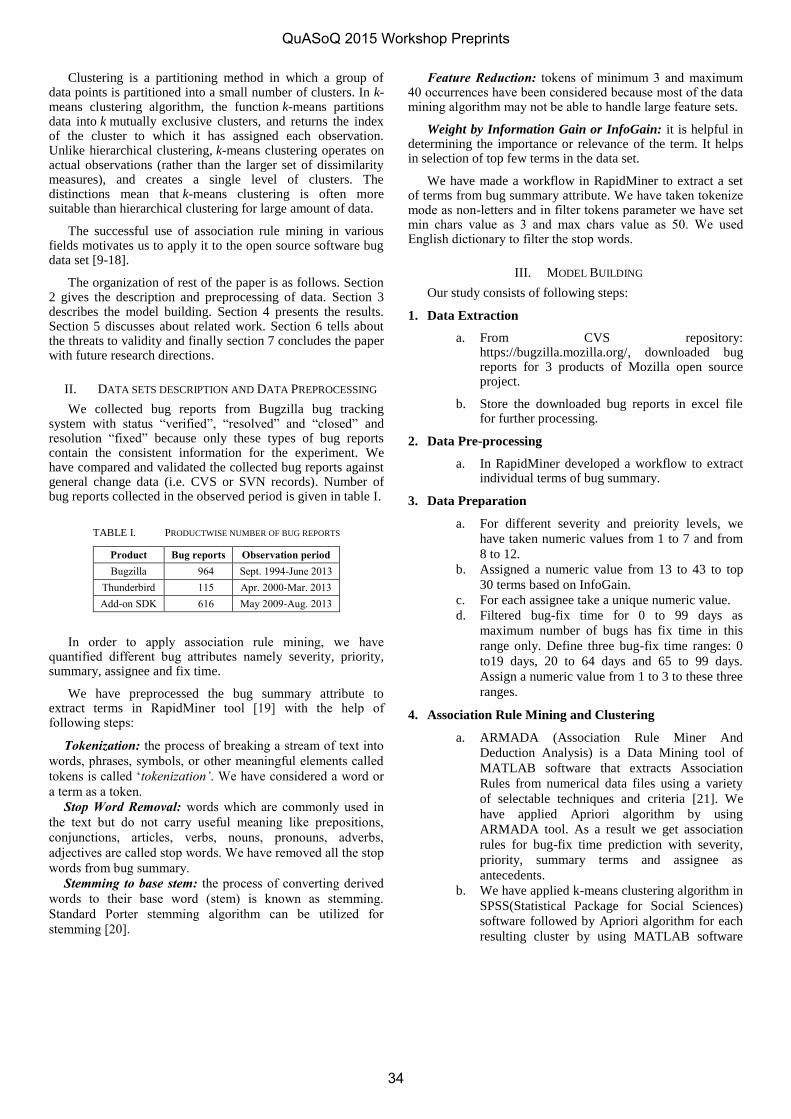
Clustering is a partitioning method in which a group of data points is partitioned into a small number of clusters. In k-means clustering algorithm, the function k-means partitions data into k mutually exclusive clusters, and returns the index of the cluster to which it has assigned each observation. Unlike hierarchical clustering, k-means clustering operates on actual observations (rather than the larger set of dissimilarity measures), and creates a single level of clusters. The distinctions mean that k-means clustering is often more suitable than hierarchical clustering for large amount of data.
The successful use of association rule mining in various fields motivates us to apply it to the open source software bug data set [9-18].
The organization of rest of the paper is as follows. Section 2 gives the description and preprocessing of data. Section 3 describes the model building. Section 4 presents the results. Section 5 discusses about related work. Section 6 tells about the threats to validity and finally section 7 concludes the paper with future research directions.
II. DATA SETS DESCRIPTION AND DATA PREPROCESSING
We collected bug reports from Bugzilla bug tracking system with status “verified”, “resolved” and “closed” and resolution “fixed” because only these types of bug reports contain the consistent information for the experiment. We have compared and validated the collected bug reports against general change data (i.e. CVS or SVN records). Number of bug reports collected in the observed period is given in table I.
TABLE I. PRODUCTWISE NUMBER OF BUG REPORTS
Product Bug reports Observation period
Bugzilla 964 Sept. 1994-June 2013
Thunderbird 115 Apr. 2000-Mar. 2013
Add-on SDK 616 May 2009-Aug. 2013
In order to apply association rule mining, we have quantified different bug attributes namely severity, priority, summary, assignee and fix time.
We have preprocessed the bug summary attribute to extract terms in RapidMiner tool [19] with the help of following steps:
Tokenization: the process of breaking a stream of text into
words, phrases, symbols, or other meaningful elements called
tokens is called ‘tokenization’. We have considered a word or
a term as a token.
Stop Word Removal: words which are commonly used in
the text but do not carry useful meaning like prepositions,
conjunctions, articles, verbs, nouns, pronouns, adverbs,
adjectives are called stop words. We have removed all the stop
words from bug summary.
Stemming to base stem: the process of converting derived
words to their base word (stem) is known as stemming.
Standard Porter stemming algorithm can be utilized for
stemming [20].
Feature Reduction: tokens of minimum 3 and maximum 40 occurrences have been considered because most of the data mining algorithm may not be able to handle large feature sets.
Weight by Information Gain or InfoGain: it is helpful in determining the importance or relevance of the term. It helps in selection of top few terms in the data set.
We have made a workflow in RapidMiner to extract a set of terms from bug summary attribute. We have taken tokenize mode as non-letters and in filter tokens parameter we have set min chars value as 3 and max chars value as 50. We used English dictionary to filter the stop words.
III. MODEL BUILDING
Our study consists of following steps:
1. Data Extraction
a. From CVS repository:https://bugzilla.mozilla.org/, downloaded bugreports for 3 products of Mozilla open sourceproject.
b. Store the downloaded bug reports in excel filefor further processing.
2. Data Pre-processing
a. In RapidMiner developed a workflow to extractindividual terms of bug summary.
3. Data Preparation
a. For different severity and preiority levels, we
have taken numeric values from 1 to 7 and from
8 to 12.
b. Assigned a numeric value from 13 to 43 to top
30 terms based on InfoGain.
c. For each assignee take a unique numeric value.
d. Filtered bug-fix time for 0 to 99 days as
maximum number of bugs has fix time in this
range only. Define three bug-fix time ranges: 0
to19 days, 20 to 64 days and 65 to 99 days.
Assign a numeric value from 1 to 3 to these three
ranges.
4. Association Rule Mining and Clustering
a. ARMADA (Association Rule Miner And
Deduction Analysis) is a Data Mining tool of
MATLAB software that extracts Association
Rules from numerical data files using a variety
of selectable techniques and criteria [21]. We
have applied Apriori algorithm by using
ARMADA tool. As a result we get association
rules for bug-fix time prediction with severity,
priority, summary terms and assignee as
antecedents.
b. We have applied k-means clustering algorithm in
SPSS(Statistical Package for Social Sciences)
software followed by Apriori algorithm for each
resulting cluster by using MATLAB software
QuASoQ 2015 Workshop Preprints
34
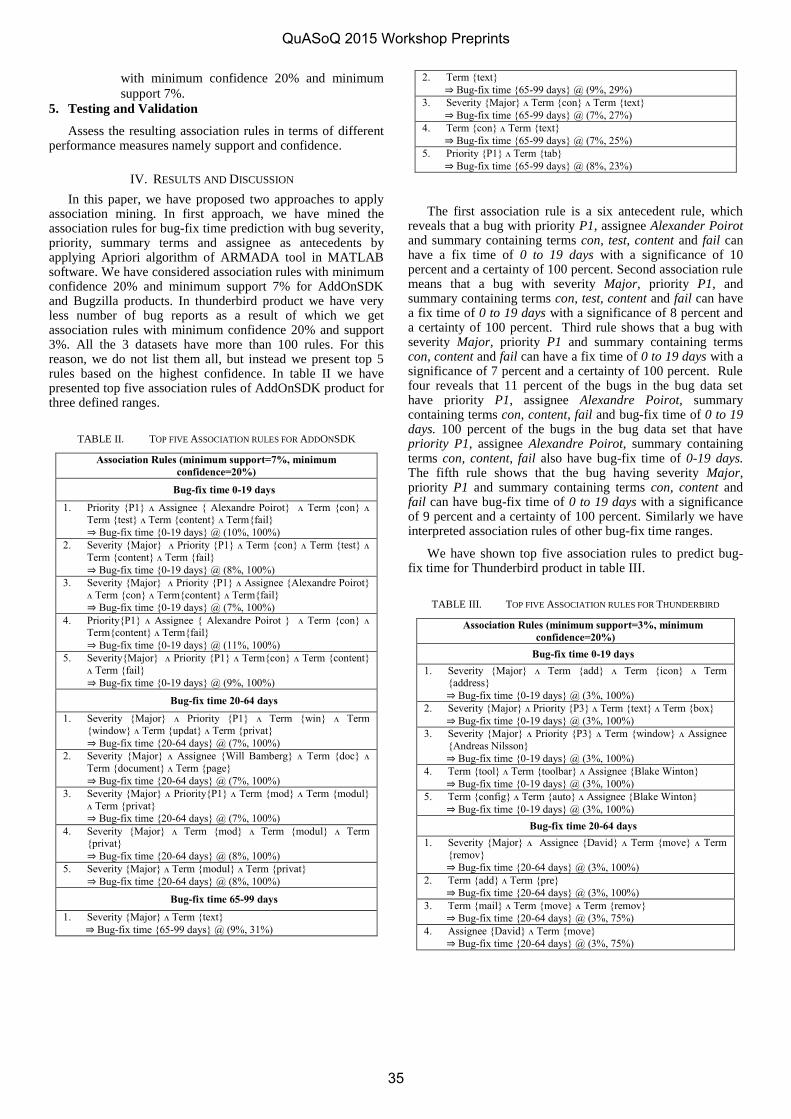
with minimum confidence 20% and minimum
support 7%.
5. Testing and Validation
Assess the resulting association rules in terms of differentperformance measures namely support and confidence.
IV. RESULTS AND DISCUSSION
In this paper, we have proposed two approaches to apply association mining. In first approach, we have mined the association rules for bug-fix time prediction with bug severity, priority, summary terms and assignee as antecedents by applying Apriori algorithm of ARMADA tool in MATLAB software. We have considered association rules with minimum confidence 20% and minimum support 7% for AddOnSDK and Bugzilla products. In thunderbird product we have very less number of bug reports as a result of which we get association rules with minimum confidence 20% and support 3%. All the 3 datasets have more than 100 rules. For this reason, we do not list them all, but instead we present top 5 rules based on the highest confidence. In table II we have presented top five association rules of AddOnSDK product for three defined ranges.
TABLE II. TOP FIVE ASSOCIATION RULES FOR ADDONSDK
Association Rules (minimum support=7%, minimum
confidence=20%)
Bug-fix time 0-19 days
1. Priority {P1} ᴧ Assignee { Alexandre Poirot} ᴧ Term {con} ᴧTerm {test} ᴧ Term {content} ᴧ Term{fail}
⇒ Bug-fix time {0-19 days} @ (10%, 100%)
2. Severity {Major} ᴧ Priority {P1} ᴧ Term {con} ᴧ Term {test} ᴧ
Term {content} ᴧ Term {fail}
⇒ Bug-fix time {0-19 days} @ (8%, 100%)
3. Severity {Major} ᴧ Priority {P1} ᴧ Assignee {Alexandre Poirot}
ᴧ Term {con} ᴧ Term{content} ᴧ Term{fail}
⇒ Bug-fix time {0-19 days} @ (7%, 100%)
4. Priority{P1} ᴧ Assignee { Alexandre Poirot } ᴧ Term {con} ᴧTerm{content} ᴧ Term{fail}
⇒ Bug-fix time {0-19 days} @ (11%, 100%)
5. Severity{Major} ᴧ Priority {P1} ᴧ Term{con} ᴧ Term {content}
ᴧ Term {fail}
⇒ Bug-fix time {0-19 days} @ (9%, 100%)
Bug-fix time 20-64 days
1. Severity {Major} ᴧ Priority {P1} ᴧ Term {win} ᴧ Term{window} ᴧ Term {updat} ᴧ Term {privat}
⇒ Bug-fix time {20-64 days} @ (7%, 100%)
2. Severity {Major} ᴧ Assignee {Will Bamberg} ᴧ Term {doc} ᴧ
Term {document} ᴧ Term {page}
⇒ Bug-fix time {20-64 days} @ (7%, 100%)
3. Severity {Major} ᴧ Priority{P1} ᴧ Term {mod} ᴧ Term {modul}
ᴧ Term {privat}
⇒ Bug-fix time {20-64 days} @ (7%, 100%)
4. Severity {Major} ᴧ Term {mod} ᴧ Term {modul} ᴧ Term{privat}
⇒ Bug-fix time {20-64 days} @ (8%, 100%)
5. Severity {Major} ᴧ Term {modul} ᴧ Term {privat}
⇒ Bug-fix time {20-64 days} @ (8%, 100%)
Bug-fix time 65-99 days
1. Severity {Major} ᴧ Term {text}
⇒ Bug-fix time {65-99 days} @ (9%, 31%)
2. Term {text}
⇒ Bug-fix time {65-99 days} @ (9%, 29%)
3. Severity {Major} ᴧ Term {con} ᴧ Term {text}
⇒ Bug-fix time {65-99 days} @ (7%, 27%)
4. Term {con} ᴧ Term {text}
⇒ Bug-fix time {65-99 days} @ (7%, 25%)
5. Priority {P1} ᴧ Term {tab}
⇒ Bug-fix time {65-99 days} @ (8%, 23%)
The first association rule is a six antecedent rule, which reveals that a bug with priority P1, assignee Alexander Poirot and summary containing terms con, test, content and fail can have a fix time of 0 to 19 days with a significance of 10 percent and a certainty of 100 percent. Second association rule means that a bug with severity Major, priority P1, and summary containing terms con, test, content and fail can have a fix time of 0 to 19 days with a significance of 8 percent and a certainty of 100 percent. Third rule shows that a bug with severity Major, priority P1 and summary containing terms con, content and fail can have a fix time of 0 to 19 days with a significance of 7 percent and a certainty of 100 percent. Rule four reveals that 11 percent of the bugs in the bug data set have priority P1, assignee Alexandre Poirot, summary containing terms con, content, fail and bug-fix time of 0 to 19 days. 100 percent of the bugs in the bug data set that have priority P1, assignee Alexandre Poirot, summary containing terms con, content, fail also have bug-fix time of 0-19 days. The fifth rule shows that the bug having severity Major, priority P1 and summary containing terms con, content and fail can have bug-fix time of 0 to 19 days with a significance of 9 percent and a certainty of 100 percent. Similarly we have interpreted association rules of other bug-fix time ranges.
We have shown top five association rules to predict bug-fix time for Thunderbird product in table III.
TABLE III. TOP FIVE ASSOCIATION RULES FOR THUNDERBIRD
Association Rules (minimum support=3%, minimum
confidence=20%)
Bug-fix time 0-19 days
1. Severity {Major} ᴧ Term {add} ᴧ Term {icon} ᴧ Term{address}
⇒ Bug-fix time {0-19 days} @ (3%, 100%)
2. Severity {Major} ᴧ Priority {P3} ᴧ Term {text} ᴧ Term {box}
⇒ Bug-fix time {0-19 days} @ (3%, 100%)
3. Severity {Major} ᴧ Priority {P3} ᴧ Term {window} ᴧ Assignee
{Andreas Nilsson}
⇒ Bug-fix time {0-19 days} @ (3%, 100%)
4. Term {tool} ᴧ Term {toolbar} ᴧ Assignee {Blake Winton}
⇒ Bug-fix time {0-19 days} @ (3%, 100%)
5. Term {config} ᴧ Term {auto} ᴧ Assignee {Blake Winton}
⇒ Bug-fix time {0-19 days} @ (3%, 100%)
Bug-fix time 20-64 days
1. Severity {Major} ᴧ Assignee {David} ᴧ Term {move} ᴧ Term
{remov}
⇒ Bug-fix time {20-64 days} @ (3%, 100%)
2. Term {add} ᴧ Term {pre}
⇒ Bug-fix time {20-64 days} @ (3%, 100%)
3. Term {mail} ᴧ Term {move} ᴧ Term {remov}
⇒ Bug-fix time {20-64 days} @ (3%, 75%)
4. Assignee {David} ᴧ Term {move}
⇒ Bug-fix time {20-64 days} @ (3%, 75%)
QuASoQ 2015 Workshop Preprints
35
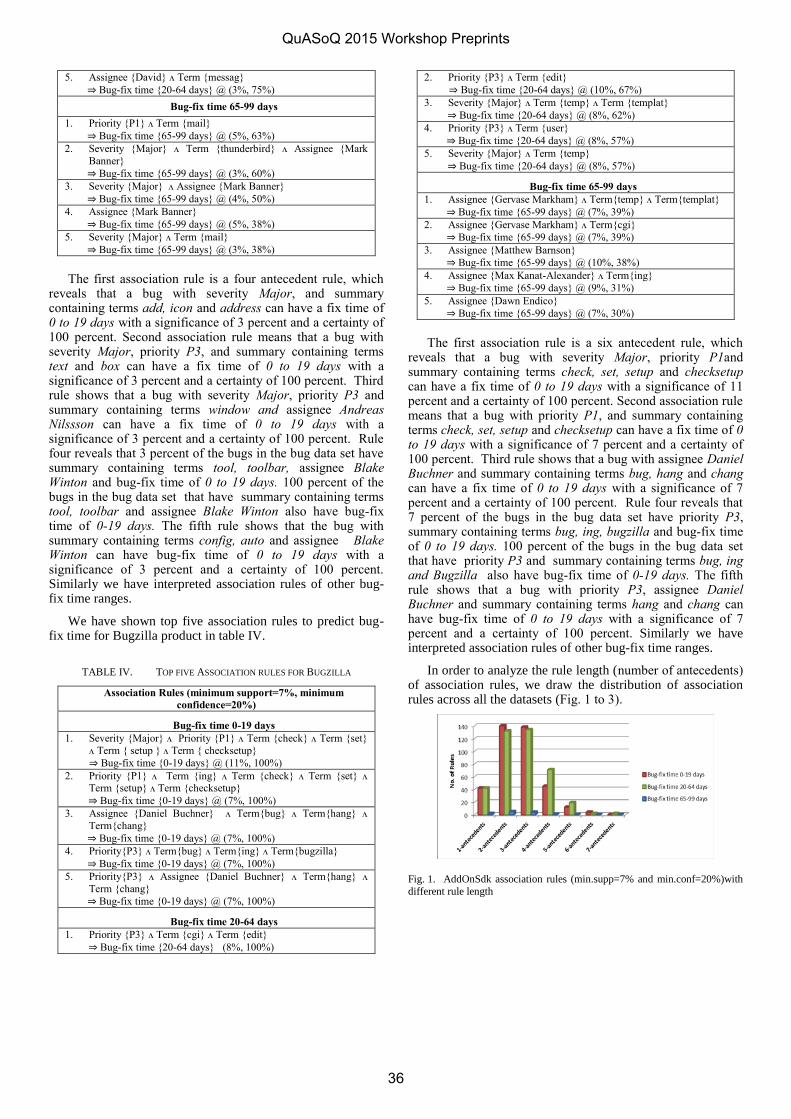
5. Assignee {David} ᴧ Term {messag}
⇒ Bug-fix time {20-64 days} @ (3%, 75%)
Bug-fix time 65-99 days
1. Priority {P1} ᴧ Term {mail}
⇒ Bug-fix time {65-99 days} @ (5%, 63%)
2. Severity {Major} ᴧ Term {thunderbird} ᴧ Assignee {Mark
Banner}
⇒ Bug-fix time {65-99 days} @ (3%, 60%)
3. Severity {Major} ᴧ Assignee {Mark Banner}
⇒ Bug-fix time {65-99 days} @ (4%, 50%)
4. Assignee {Mark Banner}
⇒ Bug-fix time {65-99 days} @ (5%, 38%)
5. Severity {Major} ᴧ Term {mail}
⇒ Bug-fix time {65-99 days} @ (3%, 38%)
The first association rule is a four antecedent rule, which reveals that a bug with severity Major, and summary containing terms add, icon and address can have a fix time of 0 to 19 days with a significance of 3 percent and a certainty of 100 percent. Second association rule means that a bug with severity Major, priority P3, and summary containing terms text and box can have a fix time of 0 to 19 days with a significance of 3 percent and a certainty of 100 percent. Third rule shows that a bug with severity Major, priority P3 and summary containing terms window and assignee Andreas Nilssson can have a fix time of 0 to 19 days with a significance of 3 percent and a certainty of 100 percent. Rule four reveals that 3 percent of the bugs in the bug data set have summary containing terms tool, toolbar, assignee Blake Winton and bug-fix time of 0 to 19 days. 100 percent of the bugs in the bug data set that have summary containing terms tool, toolbar and assignee Blake Winton also have bug-fix time of 0-19 days. The fifth rule shows that the bug with summary containing terms config, auto and assignee Blake Winton can have bug-fix time of 0 to 19 days with a significance of 3 percent and a certainty of 100 percent. Similarly we have interpreted association rules of other bug-fix time ranges.
We have shown top five association rules to predict bug-fix time for Bugzilla product in table IV.
TABLE IV. TOP FIVE ASSOCIATION RULES FOR BUGZILLA
Association Rules (minimum support=7%, minimum
confidence=20%)
Bug-fix time 0-19 days
1. Severity {Major} ᴧ Priority {P1} ᴧ Term {check} ᴧ Term {set}
ᴧ Term { setup } ᴧ Term { checksetup}
⇒ Bug-fix time {0-19 days} @ (11%, 100%)
2. Priority {P1} ᴧ Term {ing} ᴧ Term {check} ᴧ Term {set} ᴧ Term {setup} ᴧ Term {checksetup}
⇒ Bug-fix time {0-19 days} @ (7%, 100%)
3. Assignee {Daniel Buchner} ᴧ Term{bug} ᴧ Term{hang} ᴧ
Term{chang}
⇒ Bug-fix time {0-19 days} @ (7%, 100%)
4. Priority{P3} ᴧ Term{bug} ᴧ Term{ing} ᴧ Term{bugzilla}
⇒ Bug-fix time {0-19 days} @ (7%, 100%)
5. Priority{P3} ᴧ Assignee {Daniel Buchner} ᴧ Term{hang} ᴧ
Term {chang}
⇒ Bug-fix time {0-19 days} @ (7%, 100%)
Bug-fix time 20-64 days
1. Priority {P3} ᴧ Term {cgi} ᴧ Term {edit}
⇒ Bug-fix time {20-64 days} (8%, 100%)
2. Priority {P3} ᴧ Term {edit}
⇒ Bug-fix time {20-64 days} @ (10%, 67%)
3. Severity {Major} ᴧ Term {temp} ᴧ Term {templat}
⇒ Bug-fix time {20-64 days} @ (8%, 62%)
4. Priority {P3} ᴧ Term {user}
⇒ Bug-fix time {20-64 days} @ (8%, 57%)
5. Severity {Major} ᴧ Term {temp}
⇒ Bug-fix time {20-64 days} @ (8%, 57%)
Bug-fix time 65-99 days
1. Assignee {Gervase Markham} ᴧ Term{temp} ᴧ Term{templat}
⇒ Bug-fix time {65-99 days} @ (7%, 39%)
2. Assignee {Gervase Markham} ᴧ Term{cgi}
⇒ Bug-fix time {65-99 days} @ (7%, 39%)
3. Assignee {Matthew Barnson}
⇒ Bug-fix time {65-99 days} @ (10%, 38%)
4. Assignee {Max Kanat-Alexander} ᴧ Term{ing}
⇒ Bug-fix time {65-99 days} @ (9%, 31%)
5. Assignee {Dawn Endico}
⇒ Bug-fix time {65-99 days} @ (7%, 30%)
The first association rule is a six antecedent rule, which reveals that a bug with severity Major, priority P1and summary containing terms check, set, setup and checksetup can have a fix time of 0 to 19 days with a significance of 11 percent and a certainty of 100 percent. Second association rule means that a bug with priority P1, and summary containing terms check, set, setup and checksetup can have a fix time of 0 to 19 days with a significance of 7 percent and a certainty of 100 percent. Third rule shows that a bug with assignee Daniel Buchner and summary containing terms bug, hang and chang can have a fix time of 0 to 19 days with a significance of 7 percent and a certainty of 100 percent. Rule four reveals that 7 percent of the bugs in the bug data set have priority P3, summary containing terms bug, ing, bugzilla and bug-fix time of 0 to 19 days. 100 percent of the bugs in the bug data set that have priority P3 and summary containing terms bug, ing and Bugzilla also have bug-fix time of 0-19 days. The fifth rule shows that a bug with priority P3, assignee Daniel Buchner and summary containing terms hang and chang can have bug-fix time of 0 to 19 days with a significance of 7 percent and a certainty of 100 percent. Similarly we have interpreted association rules of other bug-fix time ranges.
In order to analyze the rule length (number of antecedents) of association rules, we draw the distribution of association rules across all the datasets (Fig. 1 to 3).
Fig. 1. AddOnSdk association rules (min.supp=7% and min.conf=20%)with
different rule length
QuASoQ 2015 Workshop Preprints
36
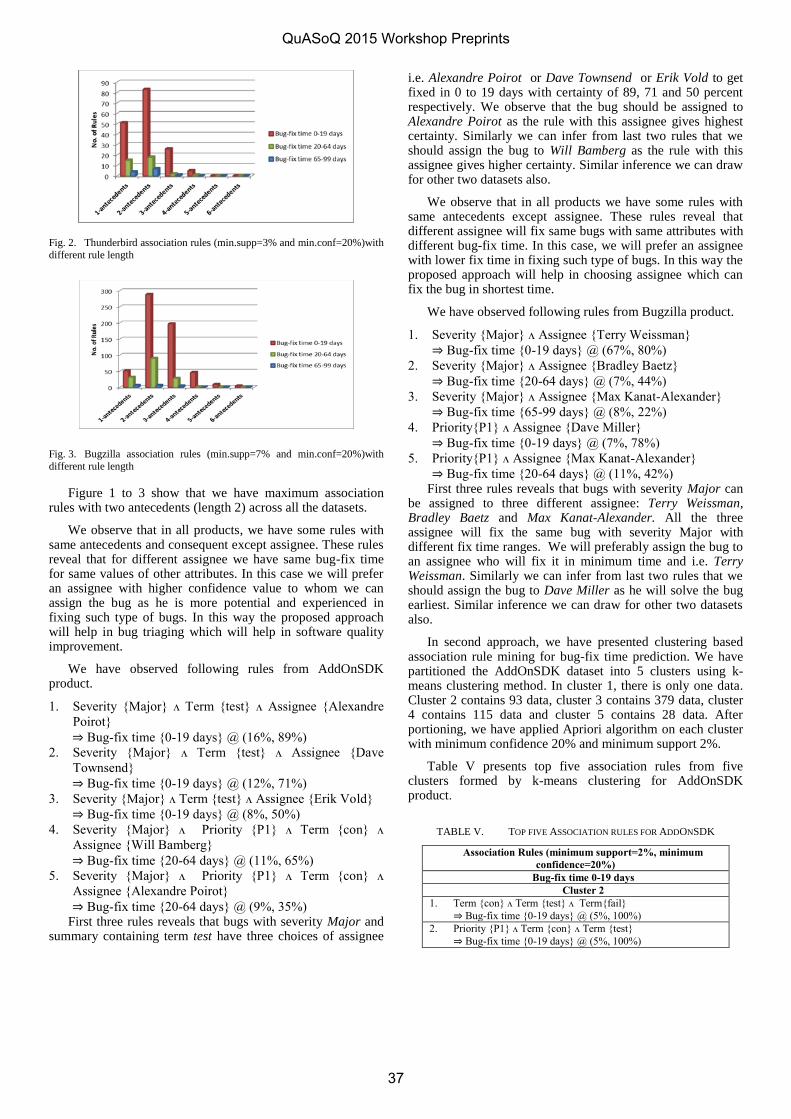
Fig. 2. Thunderbird association rules (min.supp=3% and min.conf=20%)with
different rule length
Fig. 3. Bugzilla association rules (min.supp=7% and min.conf=20%)with
different rule length
Figure 1 to 3 show that we have maximum association rules with two antecedents (length 2) across all the datasets.
We observe that in all products, we have some rules with same antecedents and consequent except assignee. These rules reveal that for different assignee we have same bug-fix time for same values of other attributes. In this case we will prefer an assignee with higher confidence value to whom we can assign the bug as he is more potential and experienced in fixing such type of bugs. In this way the proposed approach will help in bug triaging which will help in software quality improvement.
We have observed following rules from AddOnSDK product.
1. Severity {Major} ᴧ Term {test} ᴧ Assignee {Alexandre
Poirot}
⇒ Bug-fix time {0-19 days} @ (16%, 89%)
2. Severity {Major} ᴧ Term {test} ᴧ Assignee {Dave
Townsend}
⇒ Bug-fix time {0-19 days} @ (12%, 71%)
3. Severity {Major} ᴧ Term {test} ᴧ Assignee {Erik Vold}
⇒ Bug-fix time {0-19 days} @ (8%, 50%)
4. Severity {Major} ᴧ Priority {P1} ᴧ Term {con} ᴧ
Assignee {Will Bamberg}
⇒ Bug-fix time {20-64 days} @ (11%, 65%)
5. Severity {Major} ᴧ Priority {P1} ᴧ Term {con} ᴧ
Assignee {Alexandre Poirot}
⇒ Bug-fix time {20-64 days} @ (9%, 35%)First three rules reveals that bugs with severity Major and
summary containing term test have three choices of assignee
i.e. Alexandre Poirot or Dave Townsend or Erik Vold to get fixed in 0 to 19 days with certainty of 89, 71 and 50 percent respectively. We observe that the bug should be assigned to Alexandre Poirot as the rule with this assignee gives highest certainty. Similarly we can infer from last two rules that we should assign the bug to Will Bamberg as the rule with this assignee gives higher certainty. Similar inference we can draw for other two datasets also.
We observe that in all products we have some rules with same antecedents except assignee. These rules reveal that different assignee will fix same bugs with same attributes with different bug-fix time. In this case, we will prefer an assignee with lower fix time in fixing such type of bugs. In this way the proposed approach will help in choosing assignee which can fix the bug in shortest time.
We have observed following rules from Bugzilla product.
1. Severity {Major} ᴧ Assignee {Terry Weissman}
⇒ Bug-fix time {0-19 days} @ (67%, 80%)
2. Severity {Major} ᴧ Assignee {Bradley Baetz}
⇒ Bug-fix time {20-64 days} @ (7%, 44%)
3. Severity {Major} ᴧ Assignee {Max Kanat-Alexander}
⇒ Bug-fix time {65-99 days} @ (8%, 22%)
4. Priority{P1} ᴧ Assignee {Dave Miller}
⇒ Bug-fix time {0-19 days} @ (7%, 78%)
5. Priority{P1} ᴧ Assignee {Max Kanat-Alexander}
⇒ Bug-fix time {20-64 days} @ (11%, 42%)First three rules reveals that bugs with severity Major can
be assigned to three different assignee: Terry Weissman, Bradley Baetz and Max Kanat-Alexander. All the three assignee will fix the same bug with severity Major with different fix time ranges. We will preferably assign the bug to an assignee who will fix it in minimum time and i.e. Terry Weissman. Similarly we can infer from last two rules that we should assign the bug to Dave Miller as he will solve the bug earliest. Similar inference we can draw for other two datasets also.
In second approach, we have presented clustering based association rule mining for bug-fix time prediction. We have partitioned the AddOnSDK dataset into 5 clusters using k-means clustering method. In cluster 1, there is only one data. Cluster 2 contains 93 data, cluster 3 contains 379 data, cluster 4 contains 115 data and cluster 5 contains 28 data. After portioning, we have applied Apriori algorithm on each cluster with minimum confidence 20% and minimum support 2%.
Table V presents top five association rules from five clusters formed by k-means clustering for AddOnSDK product.
TABLE V. TOP FIVE ASSOCIATION RULES FOR ADDONSDK
Association Rules (minimum support=2%, minimum
confidence=20%)
Bug-fix time 0-19 days
Cluster 2
1. Term {con} ᴧ Term {test} ᴧ Term{fail}
⇒ Bug-fix time {0-19 days} @ (5%, 100%)
2. Priority {P1} ᴧ Term {con} ᴧ Term {test}
⇒ Bug-fix time {0-19 days} @ (5%, 100%)
QuASoQ 2015 Workshop Preprints
37
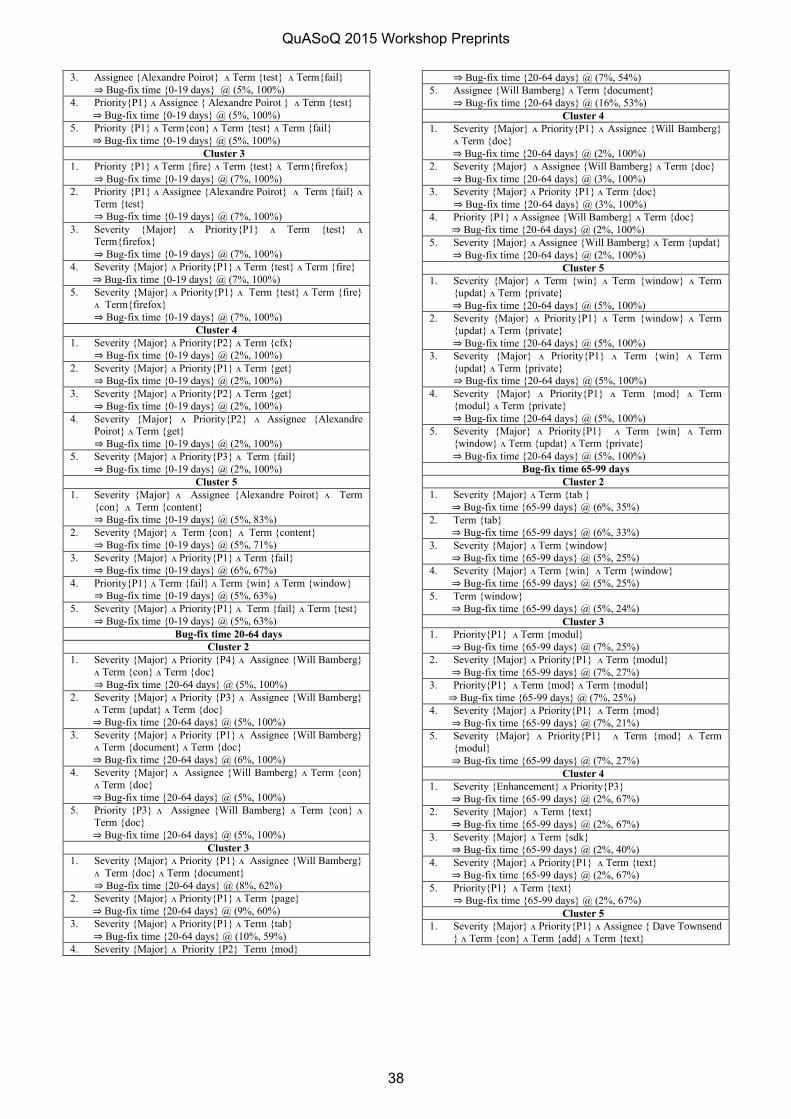
3. Assignee {Alexandre Poirot} ᴧ Term {test} ᴧ Term{fail}
⇒ Bug-fix time {0-19 days} @ (5%, 100%)
4. Priority{P1} ᴧ Assignee { Alexandre Poirot } ᴧ Term {test}
⇒ Bug-fix time {0-19 days} @ (5%, 100%)
5. Priority {P1} ᴧ Term{con} ᴧ Term {test} ᴧ Term {fail}
⇒ Bug-fix time {0-19 days} @ (5%, 100%)
Cluster 3
1. Priority {P1} ᴧ Term {fire} ᴧ Term {test} ᴧ Term{firefox}
⇒ Bug-fix time {0-19 days} @ (7%, 100%)
2. Priority {P1} ᴧ Assignee {Alexandre Poirot} ᴧ Term {fail} ᴧ
Term {test}
⇒ Bug-fix time {0-19 days} @ (7%, 100%)
3. Severity {Major} ᴧ Priority{P1} ᴧ Term {test} ᴧ Term{firefox}
⇒ Bug-fix time {0-19 days} @ (7%, 100%)
4. Severity {Major} ᴧ Priority{P1} ᴧ Term {test} ᴧ Term {fire}
⇒ Bug-fix time {0-19 days} @ (7%, 100%)
5. Severity {Major} ᴧ Priority{P1} ᴧ Term {test} ᴧ Term {fire}
ᴧ Term{firefox}
⇒ Bug-fix time {0-19 days} @ (7%, 100%)
Cluster 4
1. Severity {Major} ᴧ Priority{P2} ᴧ Term {cfx}
⇒ Bug-fix time {0-19 days} @ (2%, 100%)
2. Severity {Major} ᴧ Priority{P1} ᴧ Term {get}
⇒ Bug-fix time {0-19 days} @ (2%, 100%)
3. Severity {Major} ᴧ Priority{P2} ᴧ Term {get}
⇒ Bug-fix time {0-19 days} @ (2%, 100%)
4. Severity {Major} ᴧ Priority{P2} ᴧ Assignee {Alexandre Poirot} ᴧ Term {get}
⇒ Bug-fix time {0-19 days} @ (2%, 100%)
5. Severity {Major} ᴧ Priority{P3} ᴧ Term {fail}
⇒ Bug-fix time {0-19 days} @ (2%, 100%)
Cluster 5
1. Severity {Major} ᴧ Assignee {Alexandre Poirot} ᴧ Term
{con} ᴧ Term {content}
⇒ Bug-fix time {0-19 days} @ (5%, 83%)
2. Severity {Major} ᴧ Term {con} ᴧ Term {content}
⇒ Bug-fix time {0-19 days} @ (5%, 71%)
3. Severity {Major} ᴧ Priority{P1} ᴧ Term {fail}
⇒ Bug-fix time {0-19 days} @ (6%, 67%)
4. Priority{P1} ᴧ Term {fail} ᴧ Term {win} ᴧ Term {window}
⇒ Bug-fix time {0-19 days} @ (5%, 63%)
5. Severity {Major} ᴧ Priority{P1} ᴧ Term {fail} ᴧ Term {test}
⇒ Bug-fix time {0-19 days} @ (5%, 63%)
Bug-fix time 20-64 days
Cluster 2
1. Severity {Major} ᴧ Priority {P4} ᴧ Assignee {Will Bamberg}
ᴧ Term {con} ᴧ Term {doc}
⇒ Bug-fix time {20-64 days} @ (5%, 100%)
2. Severity {Major} ᴧ Priority {P3} ᴧ Assignee {Will Bamberg}
ᴧ Term {updat} ᴧ Term {doc}
⇒ Bug-fix time {20-64 days} @ (5%, 100%)
3. Severity {Major} ᴧ Priority {P1} ᴧ Assignee {Will Bamberg}ᴧ Term {document} ᴧ Term {doc}
⇒ Bug-fix time {20-64 days} @ (6%, 100%)
4. Severity {Major} ᴧ Assignee {Will Bamberg} ᴧ Term {con}
ᴧ Term {doc}
⇒ Bug-fix time {20-64 days} @ (5%, 100%)
5. Priority {P3} ᴧ Assignee {Will Bamberg} ᴧ Term {con} ᴧ
Term {doc}
⇒ Bug-fix time {20-64 days} @ (5%, 100%)
Cluster 3
1. Severity {Major} ᴧ Priority {P1} ᴧ Assignee {Will Bamberg}
ᴧ Term {doc} ᴧ Term {document}
⇒ Bug-fix time {20-64 days} @ (8%, 62%)
2. Severity {Major} ᴧ Priority{P1} ᴧ Term {page}
⇒ Bug-fix time {20-64 days} @ (9%, 60%)
3. Severity {Major} ᴧ Priority{P1} ᴧ Term {tab}
⇒ Bug-fix time {20-64 days} @ (10%, 59%)
4. Severity {Major} ᴧ Priority {P2} Term {mod}
⇒ Bug-fix time {20-64 days} @ (7%, 54%)
5. Assignee {Will Bamberg} ᴧ Term {document}
⇒ Bug-fix time {20-64 days} @ (16%, 53%)
Cluster 4
1. Severity {Major} ᴧ Priority{P1} ᴧ Assignee {Will Bamberg}
ᴧ Term {doc}
⇒ Bug-fix time {20-64 days} @ (2%, 100%)
2. Severity {Major} ᴧ Assignee {Will Bamberg} ᴧ Term {doc}
⇒ Bug-fix time {20-64 days} @ (3%, 100%)
3. Severity {Major} ᴧ Priority {P1} ᴧ Term {doc}
⇒ Bug-fix time {20-64 days} @ (3%, 100%)
4. Priority {P1} ᴧ Assignee {Will Bamberg} ᴧ Term {doc}
⇒ Bug-fix time {20-64 days} @ (2%, 100%)
5. Severity {Major} ᴧ Assignee {Will Bamberg} ᴧ Term {updat}
⇒ Bug-fix time {20-64 days} @ (2%, 100%)
Cluster 5
1. Severity {Major} ᴧ Term {win} ᴧ Term {window} ᴧ Term{updat} ᴧ Term {private}
⇒ Bug-fix time {20-64 days} @ (5%, 100%)
2. Severity {Major} ᴧ Priority{P1} ᴧ Term {window} ᴧ Term
{updat} ᴧ Term {private}
⇒ Bug-fix time {20-64 days} @ (5%, 100%)
3. Severity {Major} ᴧ Priority{P1} ᴧ Term {win} ᴧ Term
{updat} ᴧ Term {private}
⇒ Bug-fix time {20-64 days} @ (5%, 100%)
4. Severity {Major} ᴧ Priority{P1} ᴧ Term {mod} ᴧ Term{modul} ᴧ Term {private}
⇒ Bug-fix time {20-64 days} @ (5%, 100%)
5. Severity {Major} ᴧ Priority{P1} ᴧ Term {win} ᴧ Term
{window} ᴧ Term {updat} ᴧ Term {private}
⇒ Bug-fix time {20-64 days} @ (5%, 100%)
Bug-fix time 65-99 days
Cluster 2
1. Severity {Major} ᴧ Term {tab }
⇒ Bug-fix time {65-99 days} @ (6%, 35%)
2. Term {tab}
⇒ Bug-fix time {65-99 days} @ (6%, 33%)
3. Severity {Major} ᴧ Term {window}
⇒ Bug-fix time {65-99 days} @ (5%, 25%)
4. Severity {Major} ᴧ Term {win} ᴧ Term {window}
⇒ Bug-fix time {65-99 days} @ (5%, 25%)
5. Term {window}
⇒ Bug-fix time {65-99 days} @ (5%, 24%)
Cluster 3
1. Priority{P1} ᴧ Term {modul}
⇒ Bug-fix time {65-99 days} @ (7%, 25%)
2. Severity {Major} ᴧ Priority{P1} ᴧ Term {modul}
⇒ Bug-fix time {65-99 days} @ (7%, 27%)
3. Priority{P1} ᴧ Term {mod} ᴧ Term {modul}
⇒ Bug-fix time {65-99 days} @ (7%, 25%)
4. Severity {Major} ᴧ Priority{P1} ᴧ Term {mod}
⇒ Bug-fix time {65-99 days} @ (7%, 21%)
5. Severity {Major} ᴧ Priority{P1} ᴧ Term {mod} ᴧ Term
{modul}
⇒ Bug-fix time {65-99 days} @ (7%, 27%)
Cluster 4
1. Severity {Enhancement} ᴧ Priority{P3}
⇒ Bug-fix time {65-99 days} @ (2%, 67%)
2. Severity {Major} ᴧ Term {text}
⇒ Bug-fix time {65-99 days} @ (2%, 67%)
3. Severity {Major} ᴧ Term {sdk}
⇒ Bug-fix time {65-99 days} @ (2%, 40%)
4. Severity {Major} ᴧ Priority{P1} ᴧ Term {text}
⇒ Bug-fix time {65-99 days} @ (2%, 67%)
5. Priority{P1} ᴧ Term {text}
⇒ Bug-fix time {65-99 days} @ (2%, 67%)
Cluster 5
1. Severity {Major} ᴧ Priority{P1} ᴧ Assignee { Dave Townsend
} ᴧ Term {con} ᴧ Term {add} ᴧ Term {text}
QuASoQ 2015 Workshop Preprints
38
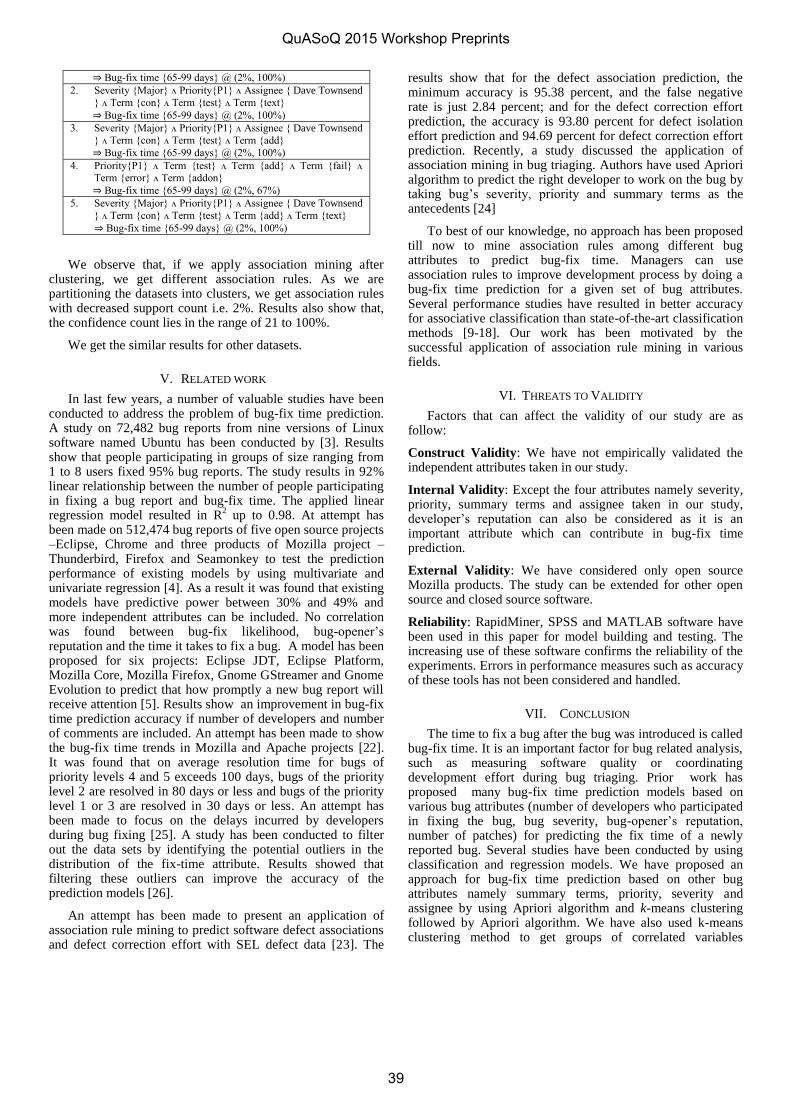
⇒ Bug-fix time {65-99 days} @ (2%, 100%)
2. Severity {Major} ᴧ Priority{P1} ᴧ Assignee { Dave Townsend
} ᴧ Term {con} ᴧ Term {test} ᴧ Term {text}
⇒ Bug-fix time {65-99 days} @ (2%, 100%)
3. Severity {Major} ᴧ Priority{P1} ᴧ Assignee { Dave Townsend
} ᴧ Term {con} ᴧ Term {test} ᴧ Term {add}
⇒ Bug-fix time {65-99 days} @ (2%, 100%)
4. Priority{P1} ᴧ Term {test} ᴧ Term {add} ᴧ Term {fail} ᴧ Term {error} ᴧ Term {addon}
⇒ Bug-fix time {65-99 days} @ (2%, 67%)
5. Severity {Major} ᴧ Priority{P1} ᴧ Assignee { Dave Townsend
} ᴧ Term {con} ᴧ Term {test} ᴧ Term {add} ᴧ Term {text}
⇒ Bug-fix time {65-99 days} @ (2%, 100%)
We observe that, if we apply association mining after clustering, we get different association rules. As we are partitioning the datasets into clusters, we get association rules with decreased support count i.e. 2%. Results also show that, the confidence count lies in the range of 21 to 100%.
We get the similar results for other datasets.
V. RELATED WORK
In last few years, a number of valuable studies have been conducted to address the problem of bug-fix time prediction. A study on 72,482 bug reports from nine versions of Linux software named Ubuntu has been conducted by [3]. Results show that people participating in groups of size ranging from 1 to 8 users fixed 95% bug reports. The study results in 92% linear relationship between the number of people participating in fixing a bug report and bug-fix time. The applied linear regression model resulted in R
2 up to 0.98. At attempt has
been made on 512,474 bug reports of five open source projects –Eclipse, Chrome and three products of Mozilla project –Thunderbird, Firefox and Seamonkey to test the prediction performance of existing models by using multivariate and univariate regression [4]. As a result it was found that existing models have predictive power between 30% and 49% and more independent attributes can be included. No correlation was found between bug-fix likelihood, bug-opener’s reputation and the time it takes to fix a bug. A model has been proposed for six projects: Eclipse JDT, Eclipse Platform, Mozilla Core, Mozilla Firefox, Gnome GStreamer and Gnome Evolution to predict that how promptly a new bug report will receive attention [5]. Results show an improvement in bug-fix time prediction accuracy if number of developers and number of comments are included. An attempt has been made to show the bug-fix time trends in Mozilla and Apache projects [22]. It was found that on average resolution time for bugs of priority levels 4 and 5 exceeds 100 days, bugs of the priority level 2 are resolved in 80 days or less and bugs of the priority level 1 or 3 are resolved in 30 days or less. An attempt has been made to focus on the delays incurred by developers during bug fixing [25]. A study has been conducted to filter out the data sets by identifying the potential outliers in the distribution of the fix-time attribute. Results showed that filtering these outliers can improve the accuracy of the prediction models [26].
An attempt has been made to present an application of association rule mining to predict software defect associations and defect correction effort with SEL defect data [23]. The
results show that for the defect association prediction, the minimum accuracy is 95.38 percent, and the false negative rate is just 2.84 percent; and for the defect correction effort prediction, the accuracy is 93.80 percent for defect isolation effort prediction and 94.69 percent for defect correction effort prediction. Recently, a study discussed the application of association mining in bug triaging. Authors have used Apriori algorithm to predict the right developer to work on the bug by taking bug’s severity, priority and summary terms as the antecedents [24]
To best of our knowledge, no approach has been proposed till now to mine association rules among different bug attributes to predict bug-fix time. Managers can use association rules to improve development process by doing a bug-fix time prediction for a given set of bug attributes. Several performance studies have resulted in better accuracy for associative classification than state-of-the-art classification methods [9-18]. Our work has been motivated by the successful application of association rule mining in various fields.
VI. THREATS TO VALIDITY
Factors that can affect the validity of our study are as follow:
Construct Validity: We have not empirically validated the independent attributes taken in our study.
Internal Validity: Except the four attributes namely severity, priority, summary terms and assignee taken in our study, developer’s reputation can also be considered as it is an important attribute which can contribute in bug-fix time prediction.
External Validity: We have considered only open source Mozilla products. The study can be extended for other open source and closed source software.
Reliability: RapidMiner, SPSS and MATLAB software have been used in this paper for model building and testing. The increasing use of these software confirms the reliability of the experiments. Errors in performance measures such as accuracy of these tools has not been considered and handled.
VII. CONCLUSION
The time to fix a bug after the bug was introduced is called bug-fix time. It is an important factor for bug related analysis, such as measuring software quality or coordinating development effort during bug triaging. Prior work has proposed many bug-fix time prediction models based on various bug attributes (number of developers who participated in fixing the bug, bug severity, bug-opener’s reputation, number of patches) for predicting the fix time of a newly reported bug. Several studies have been conducted by using classification and regression models. We have proposed an approach for bug-fix time prediction based on other bug attributes namely summary terms, priority, severity and assignee by using Apriori algorithm and k-means clustering followed by Apriori algorithm. We have also used k-means clustering method to get groups of correlated variables
QuASoQ 2015 Workshop Preprints
39
followed by association rules mining inside each cluster. We have validated our results on 1,695 bug reports of AddOnSDK, Thunderbird and Bugzilla products of Mozilla open source project. We have presented top five association rules for 20% minimum confidence and 3% and 7% minimum support. We observe that, if we apply association mining after clustering, we get different association rules. As we are partitioning the datasets into clusters, we get association rules with decreased support count i.e. 2%. Results show that, the confidence count lies in the range of 21 to 100%.
By using these rules we can predict the bug-fix time for a newly coming bug. We also observe that our approach for bug-fix time prediction will be helpful in bug triaging by assigning a bug to the most potential and experienced assignee that will solve the bug in minimum time period. Prediction of bug-fix time will help the managers in measuring software quality and in software development process. From results, we can observe the number of association rules having high confidence and support with higher severity and priority as antecedents and short bug-fix time as consequent. A large number for such rules show that more important bugs are fixed with out any delay. This information is useful in determining software quality during software evolution process. Further, for bugs with long predicted fix time we need to pay more attention to the related source files to make sure that the files remain stable during fixing process. This will again help in determining software quality. We will extend our work with other association mining algorithms to empirically validate the results.
References [1] S. Kim and J. E. Whitehead, “How long did it take to fix bugs?,” Int.
Workshop Mining Software Repositories. New York, NY, USA, ACM, pp. 173–174, 2006
[2] P. Hooimeijer and W. Weimer, “Modeling bug report quality,” ASE 2007.
[3] P. Anbalagan and M. Vouk, “On predicting the time taken to correct bug reports in open source projects,” Int. Conf. Software Management (Edmonton, AB). IEEE, pp. 523-526, September 20-26, 2009, DOI= http://ieeexplore.ieee.org/10.1109/ICSM.2009.5306337.
[4] P. Bhattacharya and I. Neamtiu, “Bug-fix Time Prediction Models: Can We Do Better?,” 8th Working Conf. Mining Software Repositories (New York, NY, USA). ACM, pp. 207-210, 2012, DOI= http://dl.acm.org/10.1145/1985441.1985472.
[5] E. Giger, M. Pinzger and H. Gall, “Predicting the fix time of bugs,” Int. Workshop Recommendation Systems on Software Enginnering (New York, NY, USA), ACM, pp. 52-56, 2010.
[6] M. Sharma, M. Kumari and V.B. Singh, “Understanding the Meaning of Bug Attributes and Prediction Models,” 5th IBM Collaborative Academia Research Exchange Workshop, I-CARE, Article No. 15, ACM, 2013.
[7] R. Agrawal, T. Imielinski and A. Swami, “Mining Association Rules between Sets of Items in Large Databases,” SIGMOD Conf. Management of Data, ACM, May 1993.
[8] Q. Song, M. Shepperd, M. Cartwright and C. Mair, “Software defect association mining and defect correction effort prediction,” IEEE Transactions on Software Engineering, Vol. 32(2) pp. 69 – 82, 2006.
[9] K. Ali, S. Manganaris and R. Srikant, “Partial Classification Using Association Rules,” Int. Conf. Knowledge Discovery and Data Mining., pp. 115-118, 1997
[10] G. Dong, X. Zhang, L. Wong, and J. Li, “CAEP: Classification by Aggregating Emerging Patterns,” Int. Conf. Discovery Science, pp. 30-42, 1999.
[11] B. Liu, W. Hsu, and Y. Ma, “Integrating Classification and Association Rule Mining,” Int. Conf. Knowledge Discovery and Data Mining, pp. 80-86, 1998.
[12] R. She, F. Chen, K. Wang, M. Ester, J.L. Gardy and F.L. Brinkman, “Frequent-Subsequence-Based Prediction of Outer Membrane Proteins,” ACM SIGKDD Int. Conf. Knowledge Discovery and Data Mining, 2003.
[13] K. Wang, S.Q. Zhou and S.C. Liew, “Building Hierarchical Classifiers Using Class Proximity,” Int. Conf. Very Large Data Bases, pp. 363-374, 1999.
[14] K. Wang, S. Zhou and Y. He, “Growing Decision Tree on Support-Less Association Rules.” Int. Conf. Knowledge Discovery and Data Mining, 2000.
[15] Q. Yang, H.H. Zhang and T. Li, “Mining Web Logs for Prediction Models in WWW Caching and Prefetching,” ACM SIGKDD Int. Conf. Knowledge Discovery and Data Mining, 2001.
[16] X. Yin and J. Han, “CPAR: Classification Based on Predictive Association Rules,” SIAM Int. Conf. Data Mining, 2003.
[17] A.T.T. Ying, C.G. Murphy, R. Ng and M.C. Chu-Carroll,. “Predicting Source Code Changes by Mining Revision History,” Int. Workshop Mining Software Repositories, 2004.
[18] T. Zimmermann, P. Weigerber, S. Diehl and A. Zeller, “Mining Version Histories to Guide Software Changes,” Int. Conf. Software Engineering, 2004.
[19] I. Mierswa, M. Wurst, R. Klinkenberg, M. Scholz and T. Euler, “YALE: Rapid Prototyping for Complex Data Mining Tasks,” ACM SIGKDD Int. Conf. Knowledge Discovery and Data Mining (KDD-06), 2006 (http://www.rapid-i.com).
[20] M. Porter, “An algorithm for suffix stripping,” Program.Vol. 14 (3), pp. 130–137, 2008.
[21] “http://in.mathworks.com/.../3016-armada-data-mining-tool-version-1-4”, 2015, URL: http://in.mathworks.com/[accessed:2015-07-24].
[22] A. Mockus, R. T. Fielding and J. D. Herbsleb, “Two case studies of open source software development: Apache and Mozilla,” ACM Trans. on Software Eng. Vol. (11)3, 2002.
[23] M. Plassea, N. Nianga, G. Saportaa, A. Villeminotb and L. Leblondb, “Combined use of association rules mining and clustering methods to find relevant links between binary rare attributes in a large data set,” Computational Statistics & Data Analysis, ELSEVIER, 2007.
[24] M. Sharma, M. Kumari and V.B. Singh, “Bug Assignee Prediction Using Association Rule Mining,” ICCSA 2015, Part IV, LNCS 9158, pp.444–457, 2015.
[25] F. Zhang , F. Khomh , Y. Zou and A. E. Hassan, “An Empirical Study on Factors Impacting Bug Fixing Time,” 19th Working Conference on Reverse Engineering (WCRE), pp. 225-234, 15-18 Oct 2012.
[26] W. AbdelMoez, M. Kholief and F. M. Elsalmy, “Improving bug fix-time prediction model by filtering out outliers,” International Conference on Technological Advances in Electrical, Electronics and Computer Engineering (TAEECE), 2013 , pp.359-364, 9-11 May 2013.
QuASoQ 2015 Workshop Preprints
40