universiti putra malaysia quantifying …psasir.upm.edu.my/id/eprint/10057/1/fh_2001_14_a.pdfatau...
TRANSCRIPT
UNIVERSITI PUTRA MALAYSIA
QUANTIFYING DEFORESTATION IN PERMANENT FOREST RESERVE (PFR) IN NORTHERN KELANTAN USING
REMOTE SENSING AND GEOGRAPHIC INFORMATION SYSTEM
IWAN SETIAWAN
FH 2001 14
QUANTIFYING DEFORESTATION IN PERMANENT FOREST RESERVE (PFR) IN NORTHERN KELANTAN USING REMOTE SENSING AND
GEOGRAPIDC INFORMATION SYSTEM
By
IW AN SETIAWAN
Thesis Submitted in Fulfilment of the Requirement for the Degree of Master of Science in the Faculty of Forestry
Universiti Putra Malaysia
February 2001
Abstract of thesis presented to the Senate ofUniversiti Putra Malaysia in fulfilment of the requirement for the degree of Master of Science
QUANTIFYING DEFORESTATION IN PERMANENT FOREST RESERVE (PFR) IN NORTHERN KELANTAN USING REMOTE SENSING AND
GEOGRAPIDC INFORMATION SYSTEM
By
IW AN SETIAWAN
February 2001
Chairman : Capt. Professor Kamaruzaman Jusoff, Ph.D
Faculty : Forestry
A study was carried out to monitor and quantify deforestation using remote
sensing and GIS in the Permanent Forest Reserve (PFR), in northern part of
Kelantan, Malaysia (latitudes 04°30'N to 06° 15 'N and longitudes of 1 01 °20'E to
1 02°40'E). The PFR boundary map published by Kelantan State Forestry
Department in 1 989 was digitized using ARCIINFO 3 .4.2 GIS software and used as
basic data in the study. A Landsat TM image of 1 997 of northern part of Kelantan
(127/56 path and row) was enhanced, classified and vectorized using PCI 6.2 and ER
Mapper 6.0 software to monitor and quantify deforestation. The extent of the
forested area extracted from the Landsat TM images of 1 997 was about 329,349.23
ha. Results indicated that about 73,236. 1 6 ha of the PFR area had been converted
into non-forestry purpose within eight years (1 989-1 997). The rate of deforestation
was 2.27% per year. The PFR's area extent declined from 402,585 .39 ha in 1989 to
329,349.23 ha in 1 997. The change from forest into mixed crop or rubber within
eight years ( 1989- 1997) was estimated to be 1 9,252.07 ha. However, about
11
53,984.09 ha of forest were changed into shrubs, while approximately 1 , 1 78 .49 ha of
forest were changed into grassland/open areas.
Deforestation was mostly located close to transportational features like roads,
logging roads and rivers. The forest's accessibility plays an important role to support
the presence and extent of deforestation. Generally, the deforested areas were located
in radius of 1 km from the roads, rivers or both. Although, the Landsat TM image
was not capable to differentiate between rubber and secondary forest or shrub, the
deforested areas were detected easily using this image. This indicated that remote
sensing and GIS techniques are reliable methods in the detection, monitoring and
quantification of deforestation and the extent of forested areas. Persistent cloud-cover
over the southern part of the study area was unavoidable problem. The use of high
resolution radar satellite data was recommended in future study in order to avoid the
atmospheric or climatological interference.
iii
Abstrak tesis yang dikemukakan kepada Senat Universiti Putra Malaysia sebagai memenuhi keperluan untuk ijazah Master Sains
PENGUKURAN PELUPUSAN HUTAN DI DALAM RUTAN SIMPAN KEKAL DI BAHAGIAN UTARA KELANTAN MENGGUNAKAN
PENDERlAAN JAUH DAN SISTEM MAKLUMAT GEOGRAFI (GIS)
Pengerusi
Fakulti
Oleh
IWAN SETIAWAN
Februari 2001
: Kapt. Profesor Kamaruzaman Jusoff, Ph.D
: Perhutanan
Satu kajian untuk memantau dan mengukur pelupusan hutan menggunakan
pederiaan jauh dan GIS telah dijalankan di hutan simpan kekal (HSK), bahagian
utara Kelantan, Malaysia (garis lintang 04°30'U ke 06°1 5'U dan garis bujur
101 020'T ke 1 02°40'T) di mana kegiatan pelupusan hutan telah dilaporkan. Peta
sempadan HSK berkenaan yang diterbitkan dalam tahun 1 989 oleh J abatan
Perhutanan Negeri Kelantan telah "didigitalkan" menggunakan perisian GIS
ARCIINFO 3 .4.2 dan digunakan sebagai data asas kajian ini. Satu imej Landsat TM
( 127/56) tahun 1 997 untuk kawasan utara Kelantan telah dipertingkatkan, dikelaskan
dan "divektorkan" menggunakan perisian-perisian PCI 6.2 dan ER Mapper 6.0 untuk
tujuan pemantauan dan pengukuran pelupusan hutan. Keputusan telah menunjukkan
dengan jelas bahawa seluas 73,236. 1 6 ha kawasan HSK telah ditukar kepada
penggunaan bukan-hutan dalam jangka masa lapan tahun (1 989- 1997). Keluasan
kawasan berhutan yang diperolehi dari imej 1 997 Landsat TM adalah dianggarkan
329,349.23 ha. Kadar pelupusan hutan adalah 2.27% setahun. Keluasan kawasan
HSK berkurang dari 402,585.39 ha dalam tahun 1 989 kepada 329,349.23 ha dalam
iv
PER·PUST, ... KAAN UNIVER3ITI PU1RA MALAYS]
tahun 1 997. Perubahan daripada hutan kepada tanaman campuran atau getah dalam
j angka waktu lapan tahun itu (1 989-1997) dianggarkan sebanyak 1 9,252.07 ha, yang
mana 53,984.09 daripada hutan telah ditukar ke belukar, sementara 1 , 1 78.49 ha
untuk hutan telah ditukar ke kawasan terbuka atau padang rumput.
Pelupusan hutan kebanyakannya tertumpu kepada kawasan-kawasan
berhampiran sumber fisikal bercirikan pengangkutan seperti jalan raya, jalan balak
dan sungai. Kebolehcapaian kawasan hutan memainkan peranan penting untuk
menyokong kehadiran dan keluasan pelupusan hutan. Secara amnya, kawasan-
kawasan yang telah dibalak terletak dalam lingkungan 1 km dari jalan raya, sungai
atau kedua�duanya. Walaupun imej Landsat TM tidak boleh membezakan antara
getah dan hutan sekunder atau belukar, kawasan-kawasan yang telah dibalak boleh
dikesan dengan jelas menggunakan imej ini. Ini menunjukkan bahawa teknik
penderiaan jauh dan GIS adalah kaedah-kaedah yang boleh dipercayai dalam
pengesanan, peninjauan dan pengiraan keluasan kawasan berhutan dan
pelupusannya. Awan-awan yang sentiasa hadir di bahagian selatan kawasan kajian
menunjukkan perlunya untuk memperolehi sumber-sumber data radar yang tidak
diganggu oleh keadaan atmosfera atau cuaca untuk kajian masa hadapan.
v
ACKNOWLEDGMENTS
Praise to Allah Almighty for His blessings and strength which enable me to
complete this thesis. First and foremost, I would like to express my most sincere and
deepest gratitude to my Supervisor, Capt. Prof. Dr. Kamaruzaman Jusoff, for his
helpful advices, encouragement and constructive criticism throughout the study. I am
thankful for his patience and for the lmowledge that I acquire from his comments and
suggestions.
Sincere thanks are also due to Mr. Ismail Adnan Abdul Malek and Dr. Anuar
Abd. Rahim for their invaluable advice and constructive criticism that substantially
improved this study.
I am also grateful for the cooperation and support given by the Kelantan State
Forestry Department during field verification work and the Malaysian Centre of
Remote Sensing (MACRES) for their support of satellite images. I would also like to
extent my thanks to my colleagues at the Center for Precision Agriculture and
Bioresource Remote Sensing, Institute of Bioscience, UPM for their assistance.
Last but not least, my utmost gratitude to my mother, brother and sisters who
have been patient and faithfully praying for my success. Not forgotten are friends
who contributed towards the success of this project.
vi
I certify that an Examination Committee met on 21 st February 2001 to conduct the final examination of Iwan Setiawan on his Master of Science thesis entitled "Quantifying Deforestation in Permanent Forest Reserve in Northern Kelantan Using Remote Sensing and Geographic Information System" in accordance with Universiti Pertanian Malaysia (Higher Degree) Act 1 980 and Universiti Pertanian Malaysia (Higher Degree) Regulations 1 98 1 . The committee recommends that the candidate be awarded the relevant degree. Members of the Examination Committee are as follows:
AHMAD AINUDDIN NURUDDIN, Ph.D Head, Department of Forest Management, Faculty of Forestry Universiti Putra Malaysia (Chairman)
KAMARUZAMAN JUSOFF, Ph.D Professor, Faculty of Forestry Universiti Putra Malaysia (Member)
ISMAIL ADNAN ABDUL MALEK, M.F. Lecturer, Faculty of Forestry, Universiti Putra Malaysia (Member)
ANUAR ABD.RAHIM, Ph.D Lecturer, Faculty of Agriculture Universiti Putra Malaysia (Member)
GHAZALI MOHA YIDIN, Ph.D, ProfessorlDeputy Dean of Graduate School, Universiti Putra Malaysia
Date: 1 3 MAR 2001
vii
This thesis submitted to the Senate ofUniversiti Putra Malaysia has been accepted as fulfilment of the requirement for the degree of Master of Science.
Vlll
MOHD. GHAZALI MOHAYIDIN, Ph.D. Professor Deputy Dean of Graduate School Universiti Putra Malaysia
Date:
DECLARATION
I hereby declare that the thesis is based on my original work except for quotations and citations which have been duly aclmowledged. I also declare that it has not been previously or concurrently submitted for any other degree at UPM or other insti tuti ons.
Date: I�f I .� lA7 (I )
ix
TABLE OF CONTENTS
Page
ABSTRA.CT............... ............................................................ ii ABSTRAK.......................................... .................................. ... iv ACKNOWLEDGEMENTS...... ...... ... .... ...... ...... ........ ...... ...... ...... vi APPROVAL SHEETS....................... ............ ........................... .. vii DECALARATION FORM... ... ......... ...... ......... ......... ......... ......... ix LIST OF TABLES................................... ................................. xii LIST OF FIGURES.................................................................. xiii
CHAPTER
I INTRODUCTION . . . . . . . . . . . . . . . . . '" ........ ............ ... ..... . . ....... .. 1 General. . . . . . . . . . . . . . . . . . . . . . . . . . . . . . . . . . . . . . . . . . . . . . . '" . . . . . . . . . . . . . . . . . . . . . . . . 1 Problem Statement . . .. . . . . . . . . . . .. . . . . . . . . . . . . .. , . . . . . . . . . . . . . . . . . . . . . . . . . . . . . . 3 Objectives of The Study. . . . . . . . . . . . . .. . . . . . . . . . . . . . .... . . . . . . . . . . . . . . . . . . . . . . . . 4
II LITERA.TURE RE��. ...... . . . . .. . . . . . . . .. . ...... .... . . . . .. . .. . . . . .. . .. 5 Deforestation. . . . . . . . . . . . . . . . . . . . . . . . . . . . . . . . . . . . . . . . . . . . . . . . . . . . . . . . . . . . . . . . . . . 5 Causes of Deforestation. . . . ... . . . . . . . . . . . . . ... . . . . . . . . .. . . . . . . . . . . . . . . . ..... . . 8 Concept and Foundation of Remote Sensing. . . . . . . . . . . . . . . . . . . . . . . . . . . . . . . 13
Definition of Remote Sensing. . . . . . . . . . .. . . . . . . . . . . . .. . . . . . . . . . . . .... . . . 13 Types of Remote Sensing. . . . . . . . .. . . . . . . . . . . . . . . . . . . . . . . . . . . . . . . . . . . . . . . 19
Optical Remote Sensing. . . . . . . . . . . . . . . . . . . . . . . . . . . . . . . . . . . . . . . . . . 19 Microwave Remote Sensing . . . . . . . . . . . . . . . . . . . . . : . . . . . . . . . . . . . . . . 24
Image Processing and Analysis . . . . . . . . . . . . . . . . . . . . . . . . . . . . . . . . . . . . . . . . . . . . . . 25 Pre-Processing. . . . . . . . ..... . . . . .. . . . . . . . . . . . . . . . . . . . . . . . . . . . . . . . . . . . . . . . . . 25 Image Enhancement. . . . . . . . . . . . . . . . . . . . . . . . . . . . . . . . . . . . . . . . . . . . . . . . . . . . . . 26 Image Classification. . . . . . . . . . . . . . . . . . . . . . . . . . . . . . . . . . . . . . . . . . . . . . . . . . . ... 29
Landsat . . ... . . . . . .. . . . . . . . . . . . . . . . . . . . . . . . . . . . . .. . . . . . . . . . . . .. . . . . . . . .. . ...... . . . 30 Data Characteristics of Landsat. . . . . . . . . . . . . . . . . . . . . . . . . . . . . . . . . . . . . . . . . . 30 Sensors . . . . . . . . . . . . . . . . . . . . . . . . . . . . . . . . . . . . . . . . . . . . . . . . . . . . . . . . . . . . . . . . . . . . . . 31 Application of Landsat. . . . . . . . . . . . . . . . . . . . . . . . . . . . . .. . . . . . . . ... . . . . . . . . . . 39
Geographic Information System (GIS) . . . . . . . . . . . . . . . . . . . . . . . .. . . . . . . . . . . . . 40 Definition of GIS . . . . . . . . . . . . . . . . . . . . . . . . . . . . . . . . . . . . . . . . . . . .. . . . . . . . . . . . . . 40 Components of GIS . . .. . . . . . . . . . . . .... . . . . . . . . . . . . . . . . .. . . . . . . . . . . . . . . . . . " 41 Capability of GIS. . . . . . . . . . . . . . . . . . . . . . . . . . . . . . . . . . . . . . . . . . . . . . . . . . . . . . . . . . 45
Satellite Remote Sensing and GIS Capability in Monitoring and Quantifying Deforestation. . . . . . . . . . . . . . . . . . . . . . . . . . . . . . . . . . . . . . . . . . . . . . . . . . . . 49
III MATERIALS AND METHODS..... ........ . ... . . . .. . . . . . . . . . . . . . . . . . . . .. 54 Description of Study Area. . . . . . . . . . . . . . . . . . . . . . . . . . . . . . . . . . . . . . . . . . . . . . . . . . . . 54
Climate . . . . . . . . . . . . . . . . . . . . . . . . . . . . . . . . . . . . . . . . . . . . . . . . . . . . . . . . . . . .. . . . . . . . . . 56 Geology. . . . . . . . . . . ... . . . . . . . . . . . . . . . . . . . . . . . . . . . . . . . . . . . . . . . . . . . . . . . . . . . . . . . 56
Materials . . . . . . . . . . . .. . . . . . . . . . . . . . . . . . . . . . . ...................................... 57
x
Imagery. . . . . . . . . . . . . . . . . . . . . . . . . . . . . . . . . . . . . . . . . . . . . . . . . . . . . . . . . . . . . . . . . . . . . 57 Ancillary Data. . . .... . . . . . . . . . . .. . .. . .. . . . . . . . .. . ... . .. . . . . .. . .. . .. . .. . . . . .. 57 Hardware and Software. . . . . . . . . . . . . . . . . . . . . . . . . . . . . . . . . . . . . . . . . . . . . . . .... 57
Methodology. . . . . . . . . . . . . . . . . . . . . . . . . . . . . . . ... . ........ .... ..... ......... ..... .. 59 Pre-Processing. . . . . . . . . . . . . . . . . . . . . . . . . . . . . . . . . . . . . . . . . . . . . . . . . . . . . . . . . . . .. 59
Radiometric Correction. . . . . . . . . . . . . ............... .... .. .... .. . .... 59 Geometric Correction . . . . . . . . . . . . . . . . . . . . . . . . . . . . . . . . . . . . . . . . . . . . . . . .
Image Processing . . . . . . . . . . . . . . . . . . . . . . . . . . . . . . . . . . . . . . . . . . . . . . . . . . . . . . . . . . Image Enhancement . . . . . . . . . . . . . . . . . . . . . . . . . . . . . . . . . . . . . . . . . . . . . . . . . . Filtering . . . . . . . . . . . . . . . . . . . . . . . . . . . . . . . . . . . . . . . . . . . . . . . . . . . . . . . . . . . . . . . .
Image Classification . . . . . . . . . . . .. . . . . . . .. . . . . . .. . . . . . . . . . . . . . . . . . . . . . . . . . . Unsupervised Classification . . . . . . . .. . . . . . . . . . . . . . . . . . . . . . . . . . . . . . . . Supervised Classification . . . . . . . . . . . . . . . . . . . . . . . . . . . . . . . . . . . . . . . . . . .
Accuracy Assessment . . . . . .. . . . . . . . . . . . . . . . . . . . . . . . . . . . . . . . . . . . . . . . . . . . . . . . . . . Raster to Vector Conversion . . . . . . . . . . . . . . . . . . . . . . . . . . . . . . . . . . . . . . . . . . . . . . . . . Ground Truthing . . . . . . . . . . . . . . . . . . . . . . . .. . . . . . . . . . . . . . . . . . . . . . . . . . . . . . . . . . . . . . .
Digitizing . . . . . . . . . . . . . . . . . . . . . . . . . . . . . . . . . . . . . . . . . . . . . . . . . . . . . . . . . . . . . . . . . . . . . . . . CorrectionlEditing . . . . . . . . . . . . . . . . . . . . . . . . . . . . . . . . . . . . . . . . . . . . . . . . . . . . . . . . . . . . . Construct Topology . . . . . . . . . . . . . . . . . . .. . . . . . . . . . . . . . . . . . . . . . . . . . . . . . . . . . . . . . . . . Transformation . . . . . . . . . . . . . . . . . . . . . . . . . . . . . . . . . . . . . . . . . . . . . . . . . . . . . . . . . . . . . . . . . Database Query . . . . . . . . . . . . . . . . . . . . . . . . . . . . . . . . . . . . . . . . . . . . . . . . . . . . . . . . . . . . . . . .
61 61 61 62 63 63 64 64 65 66 67 68 68 69 69
IV RESULTS AND DISCUSSION....... .... ...... . . . . . .... ... . ........ .. . . .. 70 Image Processing. . . . . . . . . . . . . . . . . . . . . . . . . . . . . . . . . . . ......................... ... 70 Band Combination. . . . . . . . . . . . . . . . . . . . . . . . . . .. . . . . . . . . . . . . . . . . . . . . . . . . . . . . . . . .. 77 EnhancementlFiltering. . .. . . . . . . . . . . .. . . . . . . . . . . . . . . . . . . . . . . . . . . . . . . . . . . .... . . 81 Image Interpretation/Classification of Landsat TM Images . . . . . .... . . . . . 81 Accuracy Assessment. . . . . . . ......... ... ...... ....... ... ............... ....... 88 Ground Truthing. . . . . . . . . . . . . . .. . . . . .. . . . . . . . . . . . . . . . . . . . . . . . . . . . . . . . . . . . . . . . . . 89 Raster to Vector Conversion. . . . . . . . . . . . . . . . . . . . . . . . . . . . . . . . . . . . . . . . . . . . . . . .. 96 Changes in Permanent Forest Reserve and Its Implication. . . . . . . . . . . . . . . 101
V CONCLUSIONS AND RECOMMENDATIONS................. .... 110 Conclusions . . . . . . . . . . . . . . . . . . . . . . . . . . . . . .... . . . . . . . . . . . . . . . . . . . . . . . . . . . . . . . . . . . . 110 Recommendations. . .. . . . . . . . ........................................... ... .... 111
REFERENCES............................................................... 113
BIODATA OF AUTHOR................................................... 120
xi
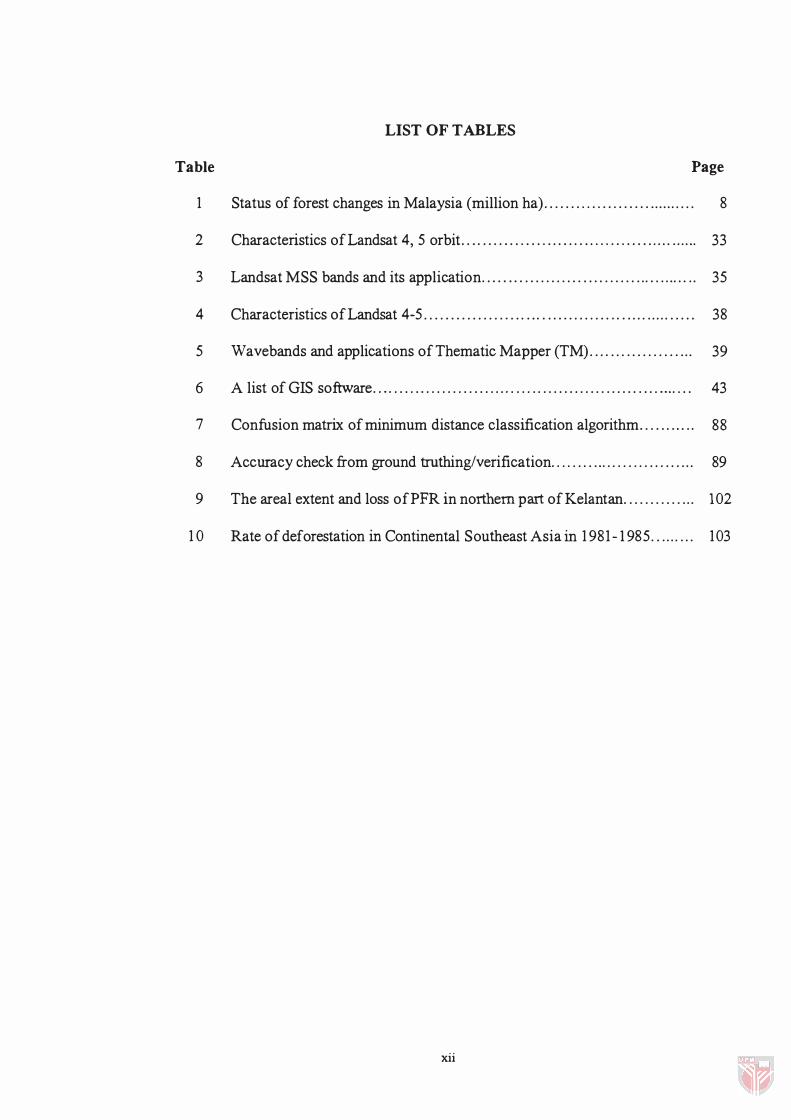
LIST OF TABLES
Table Page
1 Status of forest changes in Malaysia (million ha) . . . . . . . . . . . . . . . . . . . . .......... 8
2 Characteristics of Landsat 4 , 5 orbit. . . . . . . . . . . . . . . . . . . . . . . . . . . . . . . . . . . ..... ...... 33
3 Landsat MSS bands and its application. . . . .. . . ........... . ... ...... ...... ..... .. 35
4 Characteristics of Landsat 4-5...................................... .... .......... 38
5 Wavebands and applications of Thematic Mapper (TM) . . . . ... ........ . .... 39
6 A list of GIS software. .. . ..... ................ . . ... .. ............ ...... . ... ..... .. 43
7 Confusion matrix of minimum distance classification algorithm. . . . . ... . .. 88
8 Accuracy check from ground truthing/verification. . . . . . . . .... . . . . . . . . . . . . . ... 89
9 The areal extent and loss ofPFR in northern part of Kelantan. . . . . . . . . . . . . . 102
10 Rate of deforestation in Continental Southeast Asia in 1981-1985......... 103
xii
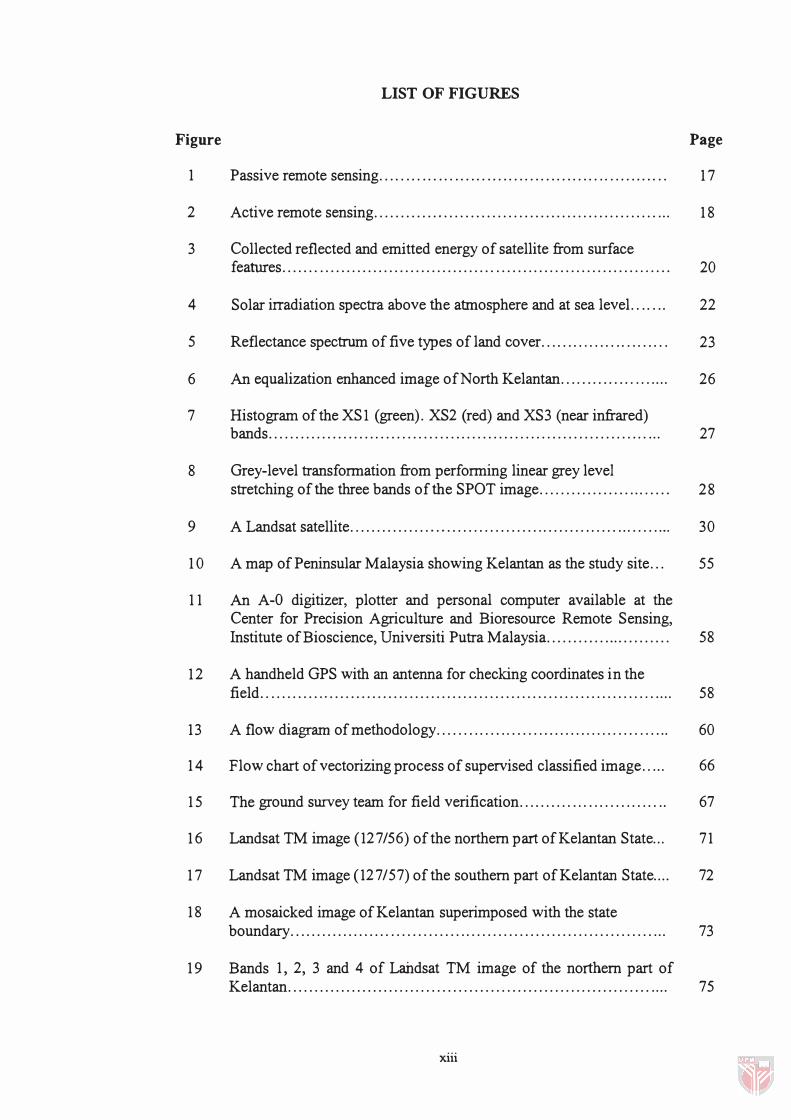
LIST OF FIGURES
Figure Page
1 Passive remote sensing. . . . . . . . . . . . . . . . . . . . . . . . . . . . . . . . . . . . . . . . . . . . . . . . . . . . . . 17
2 Active remote sensing........ ..................... ........................ ... 18
3 Collected reflected and emitted energy of satellite from surface features....... ................................. ....... .......................... 20
4 Solar irradiation spectra above the atmosphere and at sea level. . . . . .. 22
5 Reflectance spectrum of five types of land cover. . . . . . . . . . . . . . . . . . . . . . . . 23
6 An equalization enhanced image of North Kelantan. . . . . . . . . . . . . . . . . .... 26
7 Histogram of the XSI (green). XS2 (red) and XS3 (near infrared) bands.......................................................................... 27
8 Grey-level transformation from performing linear grey level stretching of the three bands of the SPOT image..... ............ ........ 28
9 A Landsat satellite........ .......................................... ....... .... 30
10 A map of Peninsular Malaysia showing Kelantan as the study site... 55
11 An A-O digitizer, plotter and personal computer available at the Center for Precision Agriculture and Bioresource Remote Sensing, Institute of Bioscience, Universiti Putra Malaysia........... ............. 58
12 A handheld GPS with an antenna for checking coordinates in the field.. ........................................................................ .... 58
13 A flow diagram of methodology.. ...... ..... ....... .............. .... ...... 60
14 Flow chart of vectorizing process of supervised classified image. . ... 66
15 The ground survey team for field verification.......... . . . . . . . . . . . . . . . . .. 67
16 Landsat TM image (127/56) of the northern part ofKelantan State... 71
17 Landsat TM image (127/57) of the southern part ofKelantan State.... 72
18 A mosaicked image ofKelantan superimposed with the state boundary.................................................................... ... 73
19 Bands 1, 2, 3 and 4 of Landsat TM image of the northern part of Kelantan.... ...................... ............... ........................... .... 75
xiii
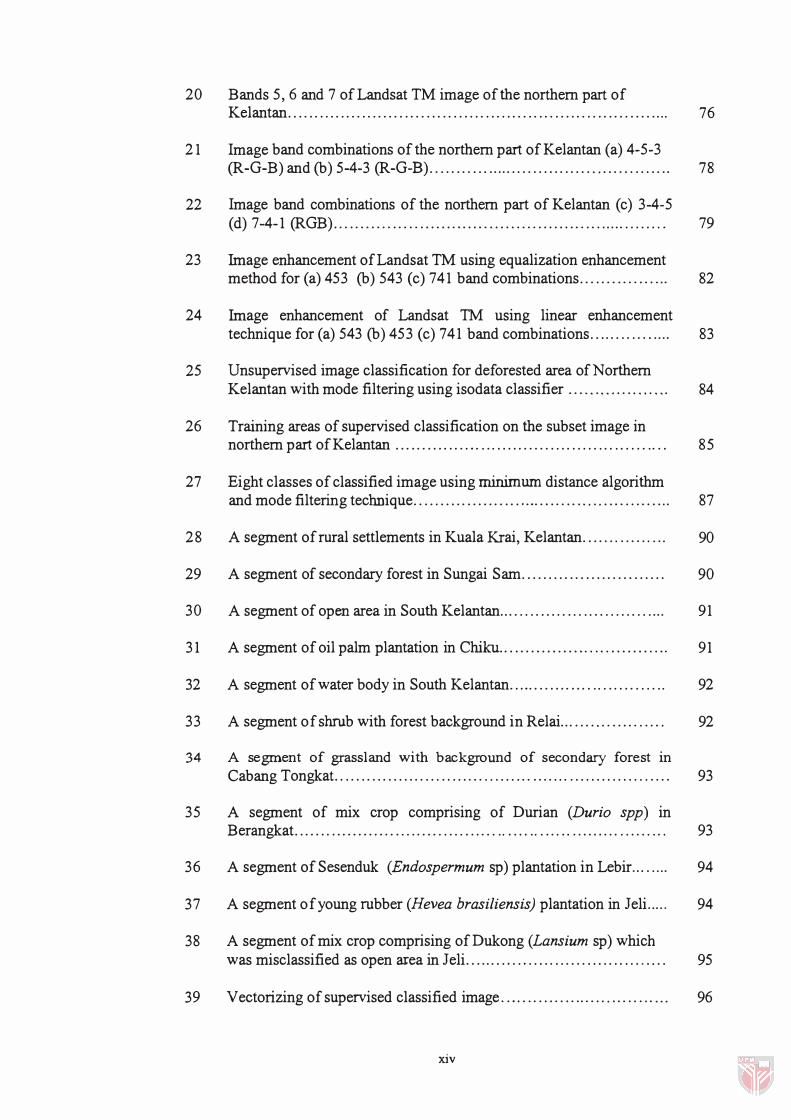
20 Bands 5, 6 and 7 of Landsat TM image of the northern part of Kelantan.......................................................... .......... .... 76
21 Image band combinations of the northern part of Kelantan (a) 4 -5-3 (R-G-B) and (b) 5-4 -3 (R-G-B)........... .................... ............... 78
22 Image band combinations of the northern part of Kelantan (c) 3-4 -5 (d) 7-4 -1 (RGB).............. ......... ........................... ............ . 79
23 Image enhancement of Landsat TM using equalization enhancement method for (a) 453 (b) 54 3 (c) 741 band combinations.............. ... 82
24 Image enhancement of Landsat TM using linear enhancement technique for (a) 543 (b) 453 (c) 741 band combinations.. .......... .... 83
25 Unsupervised image classification for deforested area of Northern Kelantan with mode filtering using isodata classifier ... . . .. . . ... . . .. . .. 84
26 Training areas of supervised classification on the subset image in northern part ofKelantan ............. .... .. ................................ 85
27 Eight classes of classified image using minimum distance algorithm and mode filtering technique.................... ..... ....... . . .. .. . ....... ... 87
28 A segment of rural settlements in Kuala Krai, Kelantan. . . . . . . . . . . . . . .. 90
29 A segment of secondary forest in Sungai Sam........................... 90
30 A segment of open area in South Kelantan...... ....... ... .. .......... . ... 91
31 A segment of oil palm plantation in Chiku. . . . . . . . . . . . . . . . . . . . . . . . . . . . . . . . 91
32 A segment of water body in South Kelantan............ ... ... . ...... . . ... 92
33 A segment of shrub with forest background in Relai... .... . ....... . ... . 92
34 A segment of grassland with background of secondary forest in
Cabang Tongkat.. .................. ........ . . . ... ... ....... .............. . .... 93
35 A segment of mix crop comprising of Durian (Durio spp) in Berangkat....... ............ . . . ...... . .. . ..... . .. .... .. . ... .. ......... . . .... . .. 93
36 A segment of Sesenduk (Endospermum sp) plantation in Lebir... . . ... 94
37 A segment of young rubber (Hevea brasiliensis) plantation in Jeli..... 94
38 A segment of mix crop comprising ofDukong (Lansium sp) which was misclassified as open area in Jeli... ..... . .. . .......................... 95
39 Vectorizing of supervised classified image ..................... . ,. .. . .. ... 96
xiv
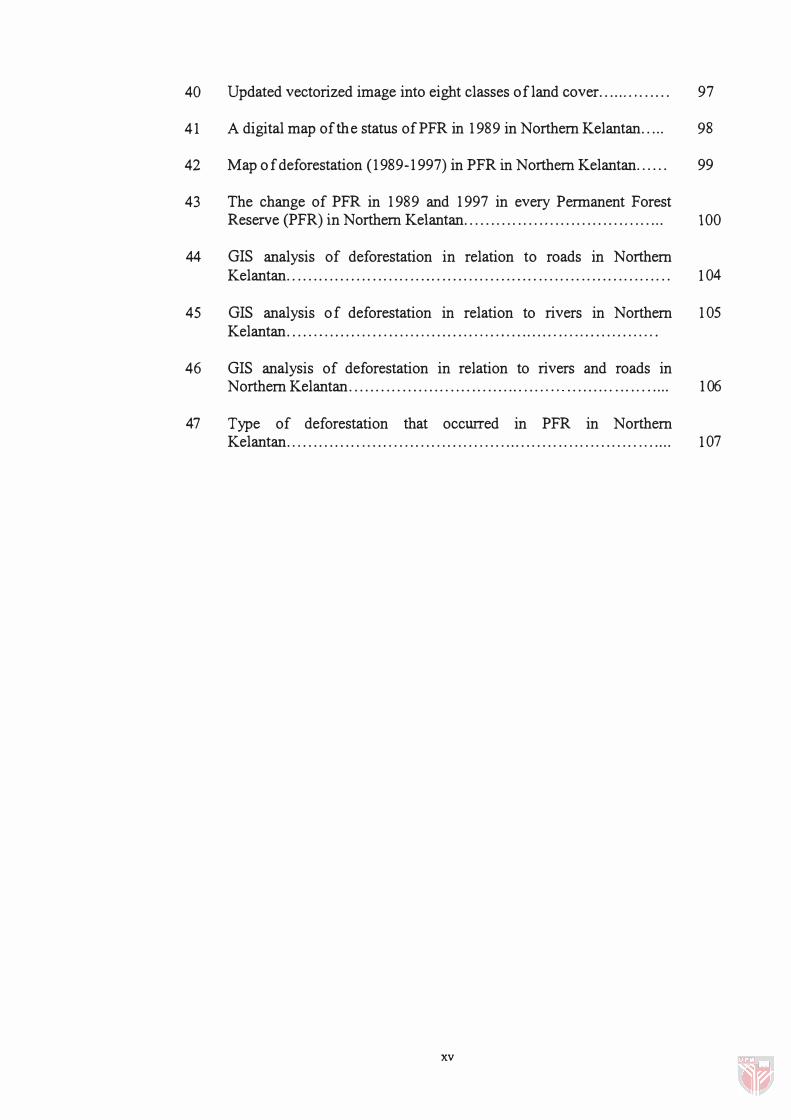
40 Updated vectorized image into eight classes of land cover. . .... . . . . . . . . 97
41 A digital map of the status of PFR in 1989 in Northern Kelantan.. ... 98
42 Map of deforestation (1989-1997) in PFR in Northern Kelantan...... 99
4 3 The change of PFR in 1989 and 1997 in every Permanent Forest Reserve (PFR) in Northern Kelantan. . . . . . . . . . . . . . . . . . . . . . . . . . . . . . . . . . . ... 100
44 GIS analysis of deforestation in relation to roads in Northern Kelantan. . . . . . . . . . . . . . . . . . . . . . . . . . . . . . . . . . . . . . . . . . . . . . . . . . . . . . . . . . . . . . . . . . . . . . . . 104
45 GIS analysis of deforestation in relation to rivers in Northern 105 Kelantan . . . . . . . . . . . . . . . . . . . . . . . . . . . . . . . . . . . . . . . . . . . . . . . . . . . . . . . . . . . . . . . . . . . . . .
4 6 GIS analysis of deforestation in relation to rivers and roads in Northern Kelantan ..................................... , '" ......... . .. ... . . ... 106
47 Type of deforestation that occurred in PFR in Northern Kelantan. . . . . . . . .. . . . . . . . . . . . . . . . . . . . . . . . . . . . . . . . ... . . . . . . . . . . . . . . . . . . . . . . . . . .... 107
xv
CHAPTER I
INTRODUCTION
General
The forests of Peninsular Malaysia are a major renewable natural resource,
which make a significant fmancial contribution to the economy. Forested areas of
Peninsular Malaysia cover 5.8 million ha which is equivalent to 44% of the land
area. From the total forested areas, 5.3 million ha are designated as Permanent
Forest Reserve (PFR) or Wildlife Reserve, including Taman Negara (The National
Park) (Anon, 1993). It plays an important role in the ecological environment of the
country. The function of tropical rain forest is not only limited for producing timber
but also for environmental stability, erosion control and provision for numerous
social needs and has largely contributed to its socio-economic development. The
present area, however, has been extensively cleared mainly for conversion into
agricultural lands, mining activities, recreational, and industrial development and
indiscriminate logging, especially in the lowlands where only patches of primary
forest still remain.
The degraded forest areas will take a longer time to revert to economically
productive forests, even with the normal silviculture treatments and enrichment
planting with indigenous species. On the other hand, some programs of reforestation
and plantation have been conducted during the last few years.
2
Environmental problems including deforestation, soil eroSIOn, salinity,
prolonged drought and floods have become increasingly recognized in the past 20
years. However it is only in recent years that the magnitude of economic and social
costs has been widely recognized. The lack of recognition and in many cases, the
effects of actions taken without adequate knowledge have often adversely affected
the environment. Environmental conservation and restoration has become a
government policy in almost every country. The dimensions of conservation and
restoration action vary considerably according to the local situation, and are largely
determined by the available resources. Amelioration approaches being addressed
include revegetation, rehabilitation, reclamation, management systems, establishment
of protected areas and control of forest encroachment (Pinoyopusrerk, 1998).
The development of land use is rapidly changing due to econOTIllC
improvements. The availability of the most recent land use information is very
useful and necessary for administration, monitoring and management for decision
making and planning. With advanced technology of remote sensing and GIS, the
mapping process can acquire spatial information more efficiently, quickly and easy
to re-check.
Remote sensing and GIS have become important tools to inventory and
monitor natural resources. Forest inventory IS the procedure for obtaining
information on the quantity and quality of the forest resources and other
characteristics of the land area. Monitoring the changes in forest resources is done to
maintain current inventories, test the implementation of policies and analyze trends
for planning purposes.
3
Problem Statement
Many ecosystems are subjected to increase degradation in one way or another
by encroachment from man. In the case of tropical humid forest, it is rapid loss is
due to many causes especially conversion to agriculture, settlements, and industrial
development. Land is one of the basic natural resources for development and
progress. However, the impact of world population increase and demand for timbers
had resulted to a certain extent, the shrinkage of forestlands particularly in the
tropics. Lately, to some extent much of the forestlands were degraded. The major
causes of forestlands degradation are fairly well understood. The main concern here
are those areas within the Permanent Forest Estate (PFE) which had been resulted
from encroachment, shifting cultivation, uncontrolled exploitation of timber. Major
change in land use within environmental, social, economic condition may limit
option for use of land resources. In Malaysia, the need for new dimension of land
mapping is getting more important. The demand for storage, analysis and display of
complex and voluminous environmental data in recent years is increasing.
Today, forestland degradation is becoming a major problem threatening the
sustainability of forest and its productivity potential. As of end 1989, a total of
approximately 4.6 million ha of degraded secondary forests exist and distributed all
over the country (Kamaruzaman and Ibrahim, 1994). Rehabilitation and
management of these degraded secondary forestlands had been the focus of many
meetings. Unfortunately, forest degradation issues have not been met by a
commensurate number of practical initiatives aiming at planting and implementing a
proper rehabilitation system. Insufficient data, financial problem and lack of specific
4
skilled work force and appropriate technology in the agencies concerned contribute
to the lack of practical implementation of rehabilitating degraded forestlands.
The total land area of Kelantan State is approximately 1,493,181 ha. Of this,
894 ,276 ha are forested areas of which about 626,372 ha of the total are Forest
Reserves and the remainder is Government Forest and Taman Negara (The National
Park). This implies that 60% of the total land in Kelantan is still forested area and of
which 42% is under forest reserve (Anon, 1993).
Until 1993, a total of 4 8,135.50 ha of forest reserves in this state has been
encroached. The main causes of forest encroachment in Kelantan are slash-and-burn
(4 ,884 ha) and opening up of agriculture land (23,128 ha) (Anon, 1993). Due to the
unavailability of data from 1993 onwards, this study is necessary to be conducted in
order to monitor and quantify the rate of deforestation in Kelantan.
Objectives of The Study
The general objective of this study is to assess the usefulness of integrating
remote sensing data and GIS in quantifying and monitoring deforestation in
Kelantan, Malaysia.
The specific objectives of the study are:
1. To quantify the extent of Permanent Forest Reserve (PFR) in Northern Kelantan.
2. To identify the causes of deforestation in PFR.
3. To produce a digital map of deforestation in Northern Kelantan.
5
CHAPTER II
LITERATURE REVIEW
Deforestation
Deforestation is defined as the temporary or permanent clearance of forest for
agriculture or other purposes. This is compatible with FAO's definition (Lanly,
1982). The key word here is clearance, if forest is not cleared the deforestation does
not take place. Often, but not always, forest is cleared so it can be replaced by
another land use, such as cattle ranching. Tropical deforestation is more a land use
problem than merely a forestry problem and it usually takes place so that forest can
be replaced by another land use (Grainger, 1993).
In many temperate regions of the world, forests have been severely depleted.
It has been estimated that one-third of the temperate broadleaved forest have been
lost since the dawn of agriculture. Continental Europe was still 90% forested during
Roman times. Today, West Germany is 30% forested, Italy 27% and France 25%. In
Britain, forest cover is down to a mere 9 %. Western Europe has lost almost 70 % of
its forests since Roman times (Anon, 1990).
Worldwide, all tropical countries have experienced a massive increase in the
rate of deforestation since the Second World War. In the early 1980s, The United
Nations Food and Agriculture Organization (FAO) estimated that annual rate of
deforestation was just over 100,000 1an2 (10 million ha) a year. However, the figure
did not include area where primary forest had been degraded but not completely
6
destroyed (for examples, areas which had been logged over but where some -trees had
been left standing). In 1987, FAO reassessed its figures where some 58 million ha of
"productive closed broadleaved forest" were cleared, along with 13 million ha of
commercially unproductive forest, making a total of 71 million ha for the period
1980-1985. That translates into an annual rate of 14.2 million ha for all forests and
11.6 million ha for productive broadleaved forest alone-the equivalent of more than
31,500 halday or an area the size of Great Britain a year. In 1989, the annual rate of
tropical forest loss was at 142,000 1an2 (Anon, 1990).
The degradation and deforestation of natural forest in many tropical countries
of the region has accelerated and increasingly eroded the forestlands. The FAO's
global project, "Forest Resources Assessment 1990 Project" indicated that the annual
deforestation rate increased from 2.0 million ha during 1976-1980 to 3.9 million ha
during 1981-1990 in the Asia-Pacific region. In Indonesia, the latest data indicate
that about 1.2 million ha of forests have been annually converted to other land uses
(mainly agricultural use) according to the government land use programs. In
Thailand, deforestation kept a high pace of about 0.5 million ha per year due to
illegal encroachment, excessive shifting cultivation, infrastructure development,
mining development, etc., and the forest coverage has dropped to 24.9 % of total
land area. In Malaysia, the natural forests were reduced by 0.8 million ha during
1986-1990 due to agricultural expansion (Kashio, 1997).
As far as deforestation by countries In Southeast Asia is concerned,
Thailand's forest area was depleted from 27,400,000 ha representing 53 % of its total
land area in 1961, to 24 ,280,000 ha or 48 % of its area in 1995. Likewise in
7
Indonesia, the forest area has shrunk from 83 % its total land area in 1 950 to about
79 % in 1 995. Regarding the annual average rate of deforestation, it was found to be
the highest in Thailand (2. 1 4%), followed by Malaysia (2. 1 0%), Vietnam (1 .34%),
Indonesia (0.84%) and Philippines (0.49%) (Haron, 1 996).
In Malaysia, more than 2.6 % of the total forest cover was lost between 1 983-
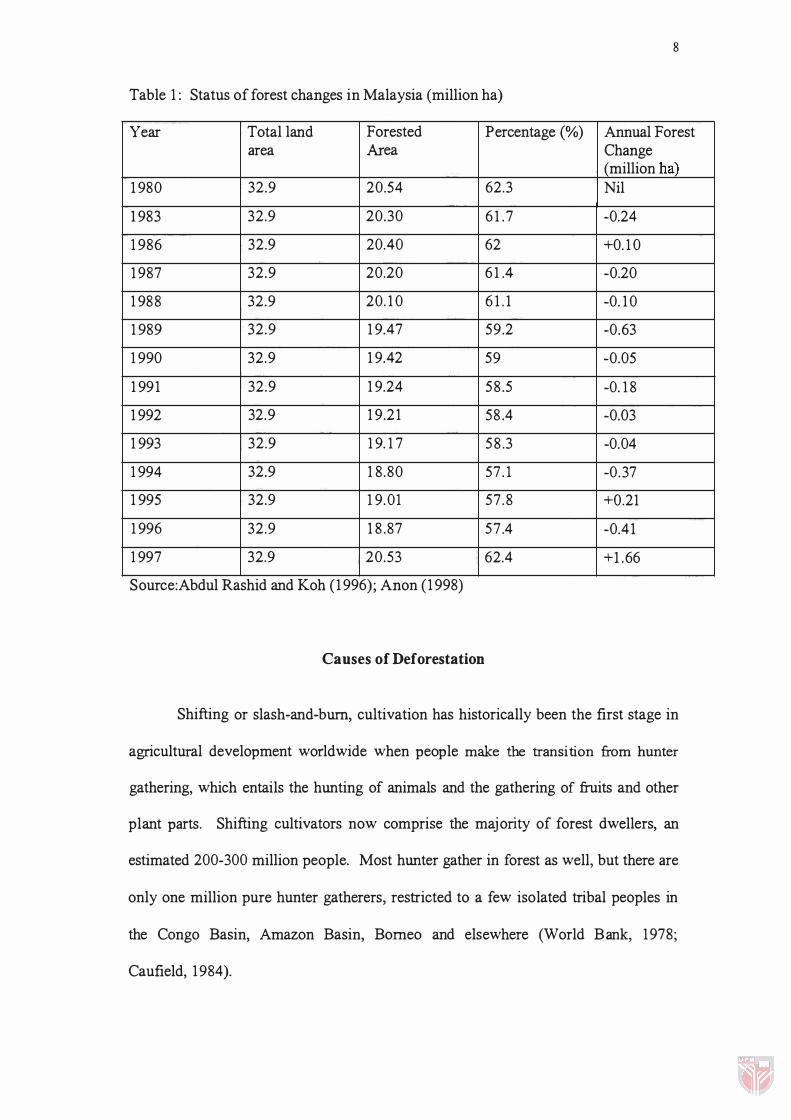
1 995 (Haron, 1 996). Table 1 provides some information of forest changes and total
land area in Malaysia. In Sarawak, about 60,000 ha of natural forest are destroyed
annually due to shifting cultivation, constituting a loss of 2.7 million m3 of logs (Lau,
1 979 cited by Noor and Mohamad, 1 998). The current trend to shorten the fallow
period of shifting cultivation to 3-5 years as a result of demographic pressure could
worsen the situation. Cash crops such as pepper planted on steep slopes are
detrimental to the environment due to intense erosion and should be discontinued and
replaced with environmentally friendly crops such as hill paddy (Noor and
Mohamad, 1 998).
The large-scale harvesting of mixed Dipterocarp forests in Peninsular
Malaysia began in the 1 960s. The major historical cause of deforestation has been
the conversion of land from forest to agriculture, mining and dam and water reservoir
construction. However, the rate of deforestation has been declining over the last
decade due to the area set aside for conversion to agriculture being exhausted
(Collins et a!., 1 991 cited by Kamaruzaman and Abdul Manaf, 1 995).
8
Table 1 : Status of forest changes in Malaysia (million ha)
Year Total land Forested Percentage (%) Annual Forest area Area Change
(million ha) 1 980 32.9 20.54 62.3 Nil
1 983 32.9 20.30 6 1 .7 -0.24
1 986 32.9 20.40 62 +0. 1 0
1 987 32.9 20.20 6 1 .4 -0.20
1 988 32.9 20. 1 0 6 1 . 1 -0. 10
1 989 32.9 1 9.47 59.2 -0.63
1 990 32.9 1 9.42 59 -0.05
1 991 32.9 1 9.24 58 .5 -0. 1 8
1 992 32.9 1 9.21 58.4 -0.03
1 993 32.9 1 9. 1 7 58 .3 -0.04
1 994 32.9 1 8 .80 57.1 -0.37
1 995 32.9 1 9.01 57.8 +0.21
1 996 32.9 1 8 .87 57 .4 -0.41
1 997 32.9 20.53 62.4 +1 .66
Source:Abdul Rashid and Koh (1 996); Anon (1 998)
Causes of Deforestation
Shifting or slash-and-burn, cultivation has historically been the fIrst stage in
agricultural development worldwide when people make the transition from hunter
gathering, which entails the hunting of animals and the gathering of fruits and other
plant parts. Shifting cultivators now comprise the majority of forest dwellers, an
estimated 200-300 million people. Most hunter gather in forest as well, but there are
only one million pure hunter gatherers, restricted to a few isolated tribal peoples in
the Congo Basin, Amazon Basin, Borneo and elsewhere (World Bank, 1978;
CaufIeld, 1984).
9
The spread of people and farming techniques in forested areas is influenced
by the distribution of forest in relation to populated areas and the ease of access by
roads and rivers. Roads are still few and far between over large areas of the humid
tropics. So rivers often remain the chief means of communication and even today
permanent cultivation tends to be concentrated close to waterways. Roads also
connect farmers to urban markets and promote cash crop cultivation if transport costs
are satisfactory. Environmental factors such as topography and soil fertility also
influence the spread of deforestation but in less predictable ways. Lowlands should
ideally be more attractive for colonization than hilly areas, if they are not swampy
(Grainger, 1 993). Other direct causes of deforestation are the result of infra structural
development, such as hydroelectric dams, roads, housing, industrial complexes,
harbors, and war (Kashio, 1 997).
Grainger (1 993) stated that the major underlying causes of deforestation are:
1 . Socio-economic factors:
a. Population growth
b. Economic development
c. Poverty
2. Physical and environmental factors
a. Distribution of forests
b . Proximity of rivers
c. Proximity of roads
d. Distance from urban center
e. Topography
f. Soil fertility