technological innovation in services and the efficiency of ...2)/jeko_48(2)-10.pdf · technological...
TRANSCRIPT
Jurnal Ekonomi Malaysia 48(2) 2014 111 - 125
Technological Innovation in Services and the Efficiency of Malaysian Commercial Banks
(Inovasi Teknologi dalam Sektor Perkhidmatan dan Kecekapan Bank Komersil di Malaysia)
Chee-Wooi, HooySchool of Management, Universiti Sains Malaysia
Sok-Gee, ChanFaculty of Business and Accountancy, University of Malaya
ABSTRAcT
This paper revisits relative efficiency of commercial banks in Malaysia using Data Envelopment Analysis (DEA) over the 2004-2012 periods. We take into account technological innovation in bank services, a new dimension that were not investigated by any previous literature. Our main findings are: (1) Commercial banks in Malaysian have higher pure technical efficiency as compare to scale efficiency. (2) Foreign banks are relatively inefficient but the gap has been gradually closing after the end of the capital control by the Malaysian government in 2005. (3) Excess numbers of Branches, Cash Deposit Machine and Cheque Deposit Machine appeared to be the major weakness of the inefficient banks. Our result implies technological innovation in bank services is one important dimension in addressing the relative efficiency of commercial banks. Banks that provide better technological services do acquire competitive advantage against their peers.
Keywords: Bank; technical efficiency; scale efficiency; technological innovation; DEA
ABSTRAK
Kajian ini melihat kembali kecekapan relatif bank komersil di Malaysia menggunakan Analisis Penyampulan Data (DEA) bagi tahun 2004-2012. Dengan mengambilkira inovasi teknologi dalam perkhidmatan bank, satu dimensi baru yang belum pernah dikaji disajikan. Dapatan utama kajian adalah: (1) Bank Komersil di Malaysia mempunyai kecekapan teknikal asli yang lebih tinggi berbanding kecekapan skala. (2) Bank asing secara relatifnya kurang cekap tetapi jurangnya semakin mengecil selepas dasar kawalan modal yang dilaksanakan kerajaan Malaysia pada tahun 2005. (3) Terlebih bilangan cawangan Mesin Deposit Tunai dan Mesin Deposit Cek muncul sebagai factor utama ketidakcekapan bank. Keputusan kajian menunjukkan bahawa inovasi teknologi dalam perkhidmatan perbankan adalah satu dimensi penting bagi kecekapan relatif bank komersil. Kesimpulannya bank yang memberikan perkhidmatan berteknologi lebih baik akan mencapai kelebihan saingan berbanding yang lain.
Kata kunci: Bank; kecekapan teknikal; kecekapan skala; inovasi teknologi; DEA
INTRODUCTION
The traditional bank delivery system has been the branch network. Modern banks, however, do not rely on the number of its branch network anymore as customers have demands for more advance and convenient delivery systems. Success or failure of commercial banking today is depends very much on the capabilities of bank to anticipate and react to fast changes in the marketplace. For example, the use of electronic banking recently has change the nature of banking activities and provides a lot of other advantages over traditional banking delivery channels, and this trend is well coped by commercial banks in Malaysia. Over the last 2 decades, the quality of bank services in Malaysia has also been enhanced by utilization of technological innovation in the delivery
system. Technological innovation is expected to add value to the bank. It happen either through increasing revenue at marginal cost or through reducing costs at marginal changes in revenue. However, existing literature on banking efficiency focus on tangible value creation such as the amount of profit gained or costs reduction. Other aspect such as operation process and system efficiency in the delivery system received little attention. This is the knowledge gap that the present paper trying to gauged. The dimensions of new delivery channels include increasing customer base, cost savings, mass product customization and innovation, marketing and communications, development of non-core businesses and the offering of services regardless of geographic area and time (Giannakoudi 1999).
112 Jurnal Ekonomi Malaysia 48(2)
Since the 1980s, Malaysian commercial banks have consistently harnessed state-of-the-art technology in its effort to upgrade new delivery channels. The Automated Teller Machine (ATM) in the 1980s to electronic banking and electronic cards in the 1990s, were all innovations of the information and computer technology (ICT). Computerization and self-service terminals are essential in answering the pressure of cost reduction and improved service qualities. Migration to electronic payments and reduction in the quantity of over-the-counter services have becomes part of the bank’s agenda to increase the efficiency of the payment systems. Installing more self-service terminals not only can achieve cost saving objective but also deliver better services to customers in terms of accessibility and convenience. Today, ATM does not only provide serves to withdraw cash, but it also offers multi-purposes functions which include bill payments and credit upload. In this regards, Malaysian commercial banks have expand quite tremendously. In this paper, we explore whether the technological innovation in banking delivery system affects the relative efficiency of commercial banks in Malaysia. To be more specific, we considered the role of all kinds of banking self-service terminals, which include ATM that offers more type of services as compared to 10 years ago, in determining the relative efficiency of Malaysian banks. We shall call these terminals as bank’s technological services henceforth.
In the context of technical efficiency, we yet to find any research conducted on the role of technological services offered by banking. Existing literature on bank technical efficiency whether on developed market, or on emerging markets including Malaysia, were all build on conventional inputs and outputs variables such as staff numbers, branches and financial indicators or ratio. Our study offers a different perspective in efficiency study in terms of modeling and data. We follow the production approach in defining our variables, but we introduced new variables to gauge for technological innovation in bank services, i.e. the new service facilities offered by modern banks, covering ATM machines, cash deposit machine, cheque deposit machine, cheque scan machine, and passbook update machine. The fast reformation in the banking sectors over the last 2 decades implies that these physical facilities deserved a special focus in addressing the issue of banking efficiency.
The rest of this paper is organized as follows: Section 2 portrayed the overall picture of the trend and acceptance level of technological innovation in Malaysian banking delivery system. Sections 3 discussed the current accepted measures of bank efficiency, and some literature review on Malaysia banking efficiency. Section 4 introduced the DEA methodology in brief. Section 5 reports the results from DEA and it is divided into 4 sub sections to facilitate the different stages of our DEA analysis. The final section is our concluding remark.
ACCEPTANCE OF TECHNOLOGICAL INNOVATION IN MALAYSIAN BANKING
DELIVERY SYSTEM
Technological innovation in Malaysian banking industry began in the 1980s, with the introduction of credit cards, and Automatic Teller Machine (ATM) networks. This was followed by telephone banking, electronic banking and electronic cards in the late 1990s. Technological innovation allows customer to perform many banking transactions that would traditionally be served over the counter. Due to its convenience, the acceptance rate for these new technologies is growing rapidly and the territory of some old system of payment has been invaded. In the US, the rise of electronic mode of payments has caused the value of checks paid to drop significantly from about $49 billion in 1995 to about $42 billion in 2002 (Gerdes and Walton 2002).
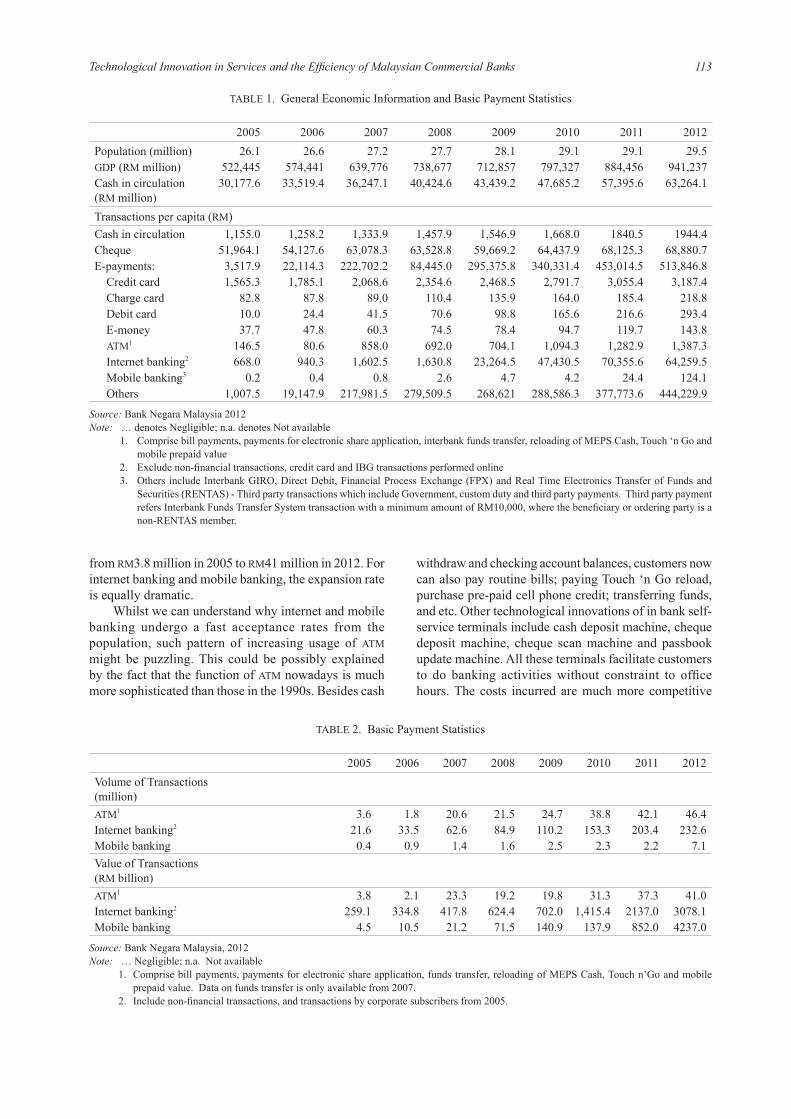
In Malaysia, such trend is not observed significantly. As reported in Table 1, over the last half decade the value of per capita cash and cheque transactions are still in a rise, partly reflecting the stable improvement of income, and partly reflecting the attach to cash and cheque payment are still solid. However, the values of the uses of various modes of e-payments are mostly in a significant rise. This is especially obvious when come to ATM internet banking and mobile banking. For example the per capita transaction value through ATM is only RM146.5 in 2005, but the value has jumped to RM1,387.3 in 2012, nearly 10 times higher in about 7 years time. For internet banking, the per capita value has increased from RM668 in 2005 to RM64, 259.5 in 2012, a 100 times jumped in value. For mobile banking which was first introduced in 2005, the value has also jumped significantly from 20 cent per capita to RM124.1 per capita in 2012. The total value of E-payments in 2005, i.e. RM 3,517.9 per capita, has increase significantly to RM513,846.8 per capita. This could be due to the direct link between Real-time Electronic Transfer of Funds and Securities System (RENTAS) for the settlement of ringgit and the USD CHATS system (Clearing Housed Automated Transfer System) in Hong Kong (Hong Kong Monetary Authority) for the settlement of US dollar, which enable the simultaneous settlement of ringgit in Malaysia and US dollar in Hong Kong during Malaysian business hours. The link is aims to eliminate foreign exchange settlement risk for ringgit and US dollar transactions. RENTAS is a large value payment system that enables the transfer and settlement of high value interbank funds and scripless securities transactions.
Table 2 takes a closer look at the payment statistics for the ATM, internet banking and mobile banking. The figures reveal that the volume of transactions involving ATM has jumped more than 12 times from 3.6 million transactions in 2005 to 46.4 million transactions in 2012, while in terms of values it also jumped more than 10 times
113Technological Innovation in Services and the Efficiency of Malaysian Commercial Banks
from RM3.8 million in 2005 to RM41 million in 2012. For internet banking and mobile banking, the expansion rate is equally dramatic.
Whilst we can understand why internet and mobile banking undergo a fast acceptance rates from the population, such pattern of increasing usage of ATM might be puzzling. This could be possibly explained by the fact that the function of ATM nowadays is much more sophisticated than those in the 1990s. Besides cash
withdraw and checking account balances, customers now can also pay routine bills; paying Touch ‘n Go reload, purchase pre-paid cell phone credit; transferring funds, and etc. Other technological innovations of in bank self-service terminals include cash deposit machine, cheque deposit machine, cheque scan machine and passbook update machine. All these terminals facilitate customers to do banking activities without constraint to office hours. The costs incurred are much more competitive
TABLE 1. General Economic Information and Basic Payment Statistics
2005 2006 2007 2008 2009 2010 2011 2012Population (million) 26.1 26.6 27.2 27.7 28.1 29.1 29.1 29.5GDP (RM million) 522,445 574,441 639,776 738,677 712,857 797,327 884,456 941,237Cash in circulation (RM million)
30,177.6 33,519.4 36,247.1 40,424.6 43,439.2 47,685.2 57,395.6 63,264.1
Transactions per capita (RM)Cash in circulation 1,155.0 1,258.2 1,333.9 1,457.9 1,546.9 1,668.0 1840.5 1944.4Cheque 51,964.1 54,127.6 63,078.3 63,528.8 59,669.2 64,437.9 68,125.3 68,880.7E-payments: 3,517.9 22,114.3 222,702.2 84,445.0 295,375.8 340,331.4 453,014.5 513,846.8 Credit card 1,565.3 1,785.1 2,068.6 2,354.6 2,468.5 2,791.7 3,055.4 3,187.4 Charge card 82.8 87.8 89.0 110.4 135.9 164.0 185.4 218.8 Debit card 10.0 24.4 41.5 70.6 98.8 165.6 216.6 293.4 E-money 37.7 47.8 60.3 74.5 78.4 94.7 119.7 143.8 ATM1 146.5 80.6 858.0 692.0 704.1 1,094.3 1,282.9 1,387.3 Internet banking2 668.0 940.3 1,602.5 1,630.8 23,264.5 47,430.5 70,355.6 64,259.5 Mobile banking3 0.2 0.4 0.8 2.6 4.7 4.2 24.4 124.1 Others 1,007.5 19,147.9 217,981.5 279,509.5 268,621 288,586.3 377,773.6 444,229.9
Source: Bank Negara Malaysia 2012Note: … denotes Negligible; n.a. denotes Not available
1. Comprise bill payments, payments for electronic share application, interbank funds transfer, reloading of MEPS Cash, Touch ‘n Go and mobile prepaid value
2. Exclude non-financial transactions, credit card and IBG transactions performed online3. Others include Interbank GIRO, Direct Debit, Financial Process Exchange (FPX) and Real Time Electronics Transfer of Funds and
Securities (RENTAS) - Third party transactions which include Government, custom duty and third party payments. Third party payment refers Interbank Funds Transfer System transaction with a minimum amount of RM10,000, where the beneficiary or ordering party is a non-RENTAS member.
TABLE 2. Basic Payment Statistics
2005 2006 2007 2008 2009 2010 2011 2012Volume of Transactions (million)ATM1 3.6 1.8 20.6 21.5 24.7 38.8 42.1 46.4Internet banking2 21.6 33.5 62.6 84.9 110.2 153.3 203.4 232.6Mobile banking 0.4 0.9 1.4 1.6 2.5 2.3 2.2 7.1Value of Transactions (RM billion)ATM1 3.8 2.1 23.3 19.2 19.8 31.3 37.3 41.0Internet banking2 259.1 334.8 417.8 624.4 702.0 1,415.4 2137.0 3078.1Mobile banking 4.5 10.5 21.2 71.5 140.9 137.9 852.0 4237.0
Source: Bank Negara Malaysia, 2012Note: … Negligible; n.a. Not available
1. Comprise bill payments, payments for electronic share application, funds transfer, reloading of MEPS Cash, Touch n’Go and mobile prepaid value. Data on funds transfer is only available from 2007.
2. Include non-financial transactions, and transactions by corporate subscribers from 2005.
114 Jurnal Ekonomi Malaysia 48(2)
as compared to employing a bank teller or clerk over the counter.
In short, the technological innovation in Malaysian banking landscape in neatly on track. Migrating from paper-based payments to electronic and terminal based delivery system has provided an opportunity for the banks to improve productivity levels and lower the cost of doing business, and thus it is expected to improve the overall efficiency of the banking sector, as well as to the Malaysian economy as a whole.
DEA EFFICIENCY STUDIES ON MALAYSIAN BANKS
Basically the efficiency analysis in the banking sector can be measured in terms of ratio analysis, technical efficiency, cost efficiency, and profit efficiency. In this paper, we focus on technical efficiency. Technical efficiency can be furthered decomposed into pure technical efficiency and scale efficiency. Pure technical efficiency deals with the management ability in maximizing it production of outputs at a given set of input level or minimizes the use of inputs given the output vectors while the scale efficiency deals measure the performance of the banks when the scale of operations increases.
Data Envelopment Analysis (DEA) is one of the most commonly applied method in capturing technical efficiency. DEA is a non-parametric frontier efficiency technique, which is essentially a relative benchmarking method, providing an overall, objectively determined, numerical efficiency value (X-efficiency) and ranking of the production units that is not otherwise available (Berger and Humphrey 1997). The concept of frontier efficiency techniques can be dated back to the hallmark paper of Farrell (1957), but Sherman and Gold (1985) is perhaps the earliest study to apply DEA in banking studies. An extensive discussion on some recent application of DEA in banking studies can be found in Berger and Humphrey (1997), and Thanassoulis (1999).
In the Malaysia context, Katib and Mathews (2000) had studied the characteristics of the technical efficiency of twenty domestic commercial banks using data from 1989 to 1995. Their DEA results imply that economies of scale exist in small banks; diseconomies of scale exist in large-sized banks. They further conclude that there is a deterioration of operational efficiency of Malaysian banks in the 1990s. Another pioneer study that is more relevant with our paper is Salleh et al. (2001). Salleh et al. (2001) covered Malaysian local commercial banks, as well as foreign banks and utilized physical input such as ATM, staff number and bank branches, and their DEA relative efficiency is measured based on 3-year analysis over the Asian financial crisis horizon (1997-1999). The paper documented considerable relative inefficiency in Malaysian local banks, and they are mainly due to oversupply of inputs, especially ATM. They also found the
inefficient banks suffer a great disadvantage in terms of profit. The paper indicates that foreign bank, especially Citibank, despite having tough regulatory restriction, still perform superbly. The study concludes that the relative efficiency of the commercial banks in Malaysia is not changing very much across the crisis horizon, despite having to face the Asian financial crisis and the banking merger program initiated by the Malaysian government in 1999.
As a result of the banking merger program in Malaysia, many scholars have investigated the impact of the merger program. Krishnasamy et al. (2004) for example, investigated productivity changes of Malaysian local banks in the post-merger year in 2000-2001. The paper applies only monetary variables, where the inputs used were overhead expenses on labor, and the total assets (excluding loans, advances and financing) while loans and advances and total deposits are defined as outputs. The paper documented that Malaysian banks achieved a total factor productivity growth of 5.1% as the result of the merger. However, they find that the merger has not resulted in better scale efficiency. Another study by Sufian (2004) also focuses on the effect of mergers and acquisitions towards the technical efficiency of the local commercial banks over 1998-2003 periods. The inputs used were labor expenses; fixed assets, retail and other financial institutions deposits, while the output covered are total loans, and investment and dealing securities, which are all monetary measures. The paper found that commercial banks experienced an improvement in overall technical efficiency scores after the merger process, but it was the small and medium size banks that benefited the most from the merger program. Large banks seem to face reduction in scale efficiency after the merger. The study highlighted that most of the banks in Malaysia have achieved 100% in terms of pure technical efficiency even though the average pure technical efficiency scores of all commercial banks is relatively low as compared to scale efficiency.
In a more general study Mohd. Azmi et al. (2006) follows up to study 11 local Malaysian commercial banks for the period 2000-2004 using loans and advances, capital market investments, and money market investments as outputs, and total deposits, personnel expenses, and capital expenses as inputs. This study also reported an increase of total factor productivity in the industry as a whole and concludes that scale efficiency is relatively important than pure efficiency. They conclude that bank size does matter in improving bank efficiency and more importantly, and the negative growth of technical efficiency signal the needs of higher utilization of technology among the Malaysian local banks. The result is occurred by Tahir et al. (2009a, 2009b) who expanded the sample to include foreign banks over the sample of 2000-2006 periods. They find that the source of inefficiency of the locally-owned commercial banks in Malaysia is due to pure technical inefficiency.
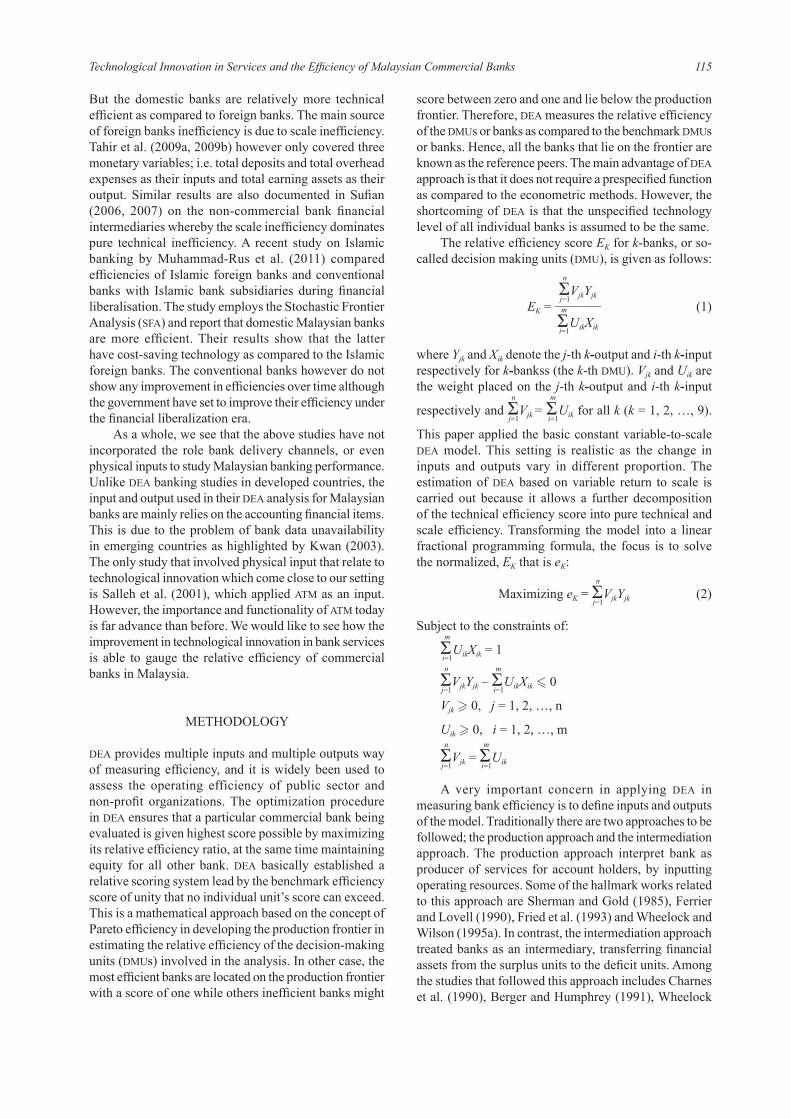
115Technological Innovation in Services and the Efficiency of Malaysian Commercial Banks
But the domestic banks are relatively more technical efficient as compared to foreign banks. The main source of foreign banks inefficiency is due to scale inefficiency. Tahir et al. (2009a, 2009b) however only covered three monetary variables; i.e. total deposits and total overhead expenses as their inputs and total earning assets as their output. Similar results are also documented in Sufian (2006, 2007) on the non-commercial bank financial intermediaries whereby the scale inefficiency dominates pure technical inefficiency. A recent study on Islamic banking by Muhammad-Rus et al. (2011) compared efficiencies of Islamic foreign banks and conventional banks with Islamic bank subsidiaries during financial liberalisation. The study employs the Stochastic Frontier Analysis (SFA) and report that domestic Malaysian banks are more efficient. Their results show that the latter have cost-saving technology as compared to the Islamic foreign banks. The conventional banks however do not show any improvement in efficiencies over time although the government have set to improve their efficiency under the financial liberalization era.
As a whole, we see that the above studies have not incorporated the role bank delivery channels, or even physical inputs to study Malaysian banking performance. Unlike DEA banking studies in developed countries, the input and output used in their DEA analysis for Malaysian banks are mainly relies on the accounting financial items. This is due to the problem of bank data unavailability in emerging countries as highlighted by Kwan (2003). The only study that involved physical input that relate to technological innovation which come close to our setting is Salleh et al. (2001), which applied ATM as an input. However, the importance and functionality of ATM today is far advance than before. We would like to see how the improvement in technological innovation in bank services is able to gauge the relative efficiency of commercial banks in Malaysia.
METHODOLOGY
DEA provides multiple inputs and multiple outputs way of measuring efficiency, and it is widely been used to assess the operating efficiency of public sector and non-profit organizations. The optimization procedure in DEA ensures that a particular commercial bank being evaluated is given highest score possible by maximizing its relative efficiency ratio, at the same time maintaining equity for all other bank. DEA basically established a relative scoring system lead by the benchmark efficiency score of unity that no individual unit’s score can exceed. This is a mathematical approach based on the concept of Pareto efficiency in developing the production frontier in estimating the relative efficiency of the decision-making units (DMUs) involved in the analysis. In other case, the most efficient banks are located on the production frontier with a score of one while others inefficient banks might
score between zero and one and lie below the production frontier. Therefore, DEA measures the relative efficiency of the DMUs or banks as compared to the benchmark DMUs or banks. Hence, all the banks that lie on the frontier are known as the reference peers. The main advantage of DEA approach is that it does not require a prespecified function as compared to the econometric methods. However, the shortcoming of DEA is that the unspecified technology level of all individual banks is assumed to be the same.
The relative efficiency score EK for k-banks, or so-called decision making units (DMU), is given as follows:
EK = Σ
n
j=1VjkYjk
–––––––Σ
m
i=1UikXik
(1)
where Yjk and Xik denote the j-th k-output and i-th k-input respectively for k-bankss (the k-th DMU). Vjk and Uik are the weight placed on the j-th k-output and i-th k-input
respectively and Σn
j=1Vjk = Σ
m
i=1Uik for all k (k = 1, 2, …, 9).
This paper applied the basic constant variable-to-scale DEA model. This setting is realistic as the change in inputs and outputs vary in different proportion. The estimation of DEA based on variable return to scale is carried out because it allows a further decomposition of the technical efficiency score into pure technical and scale efficiency. Transforming the model into a linear fractional programming formula, the focus is to solve the normalized, EK that is eK:
Maximizing eK = Σn
j=1VjkYjk (2)
Subject to the constraints of:
Σm
i=1UikXik = 1
Σn
j=1VjkYjk – Σ
m
i=1UikXik 0
Vjk 0, j = 1, 2, …, n
Uik 0, i = 1, 2, …, m
Σn
j=1Vjk = Σ
m
i=1Uik
A very important concern in applying DEA in measuring bank efficiency is to define inputs and outputs of the model. Traditionally there are two approaches to be followed; the production approach and the intermediation approach. The production approach interpret bank as producer of services for account holders, by inputting operating resources. Some of the hallmark works related to this approach are Sherman and Gold (1985), Ferrier and Lovell (1990), Fried et al. (1993) and Wheelock and Wilson (1995a). In contrast, the intermediation approach treated banks as an intermediary, transferring financial assets from the surplus units to the deficit units. Among the studies that followed this approach includes Charnes et al. (1990), Berger and Humphrey (1991), Wheelock
116 Jurnal Ekonomi Malaysia 48(2)
and Wilson (1995b), Miller and Noulas (1996), Haslem and Scheraga (1999) and Saha and Ravisankar (2000), to name a few. Latly, there is another modern approach which mix up the
To gauge for technological innovation, the input vectors employed in this study covered the number of branches, number of staff, number of ATM machines, number of cash deposit machine, number of cheque deposit machine, number of cheque scan machine, and number of passbook update machine. For the outputs we use total loans and advances and total deposits. With our setting, it is believed that the advancement in technological employment enables better and more convenient services to the banks customers which will attract more customers to the banks and improve the amount of loans and deposits customers. Basically what we assumed here is that banks employed various factors of production in generating the banks financial goods and services, namely the loans and deposits of the banks. Thus, we are following the production approach for the estimation of technical efficiency scores of technology innovation. The reason is all our inputs are physical facilities that provide services for the account holders which are highly consistent with the definition of the production approach. Our model does not fir to explain the intermediate role of banks in the fund transferring process. The two outputs, i.e. loans and advances and deposits employed are expressed in RM million.
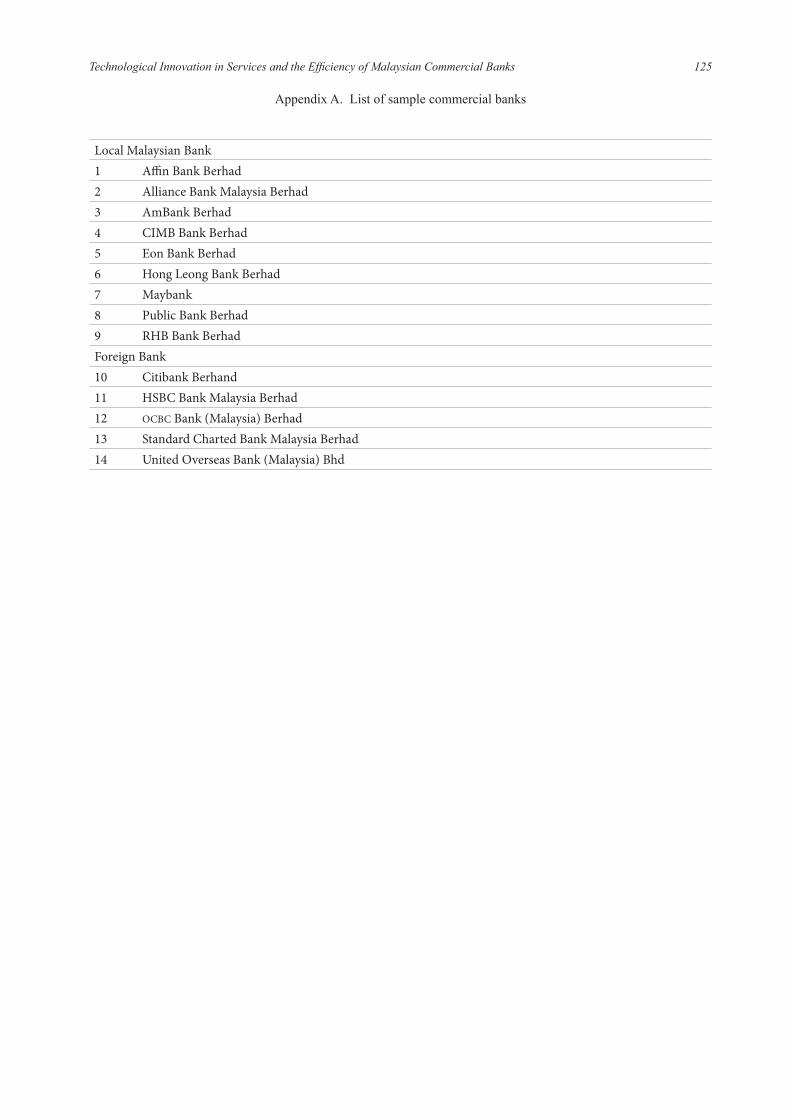
We cover 14 out of 24 (before 2007 there were 25) commercial banks operate in Malaysia for the year 2004, 2006, and 2008. The reason we skip annual data is that the information for the service terminals are only available once in every two years, provided by The Association of Banks in Malaysia (ABM). The list of the banks covered is reported in Appendix A. We exclude some banks due to incomplete data or insufficient data variation, especially those do not have any self-service terminals, including ABN AMRO Bank Berhad, Bangkok Bank Berhad, Bank of America Malaysia Berhad, Bank of China (Malaysia) Berhad, Bank of Tokyo-Mitsubishi (Malaysia) Berhad, Deutsche Bank (Malaysia) Berhad, J.P Morgan Chase Bank Berhad, The Bank of Nova Scotia Berhad and The Royal Bank of Scotland Berhad, which are all foreign banks.
RESULTS AND DISCUSSION
DESCRIPTIVE STATISTICS
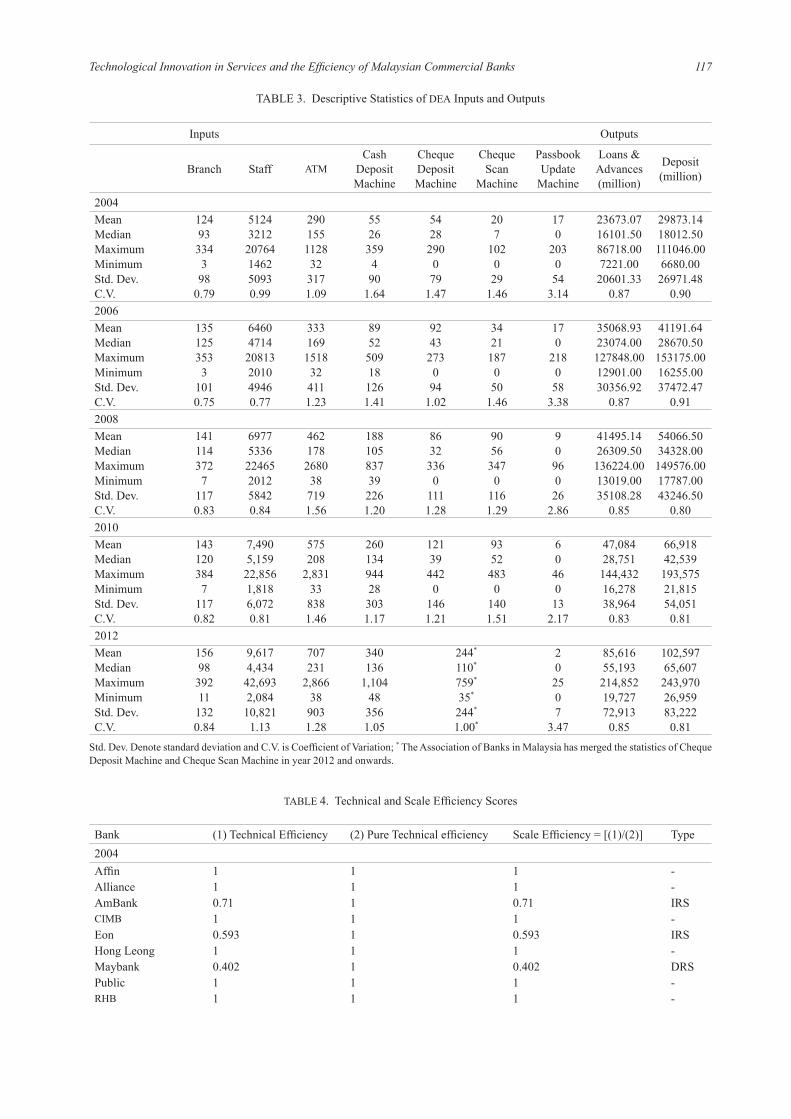
The descriptive statistics of all the inputs and outputs involved are reported in Table 3. In general, there is substantial variation in the distribution of each of the inputs and outputs across space and time. For example, the mean unit of Branch in 2004 is 124 units, with a medium of 93 branches, but a range of 331 branches (maximum is 334 branches minus minimum 3 branches).
The standard deviation is 98 branches with a coefficient of variation of 0.79. This wide dispersion is due to the restrictive policy of Bank Negara Malaysia (BNM) in allowing foreign banks to expand. Relatively foreign banks have very small number of branches in Malaysia, with United Overseas Bank (Malaysia) Bhd having the most number of branches, i.e. 36 branches in 2004. Many foreign banks only have 1 branch (all of these foreign banks are not covered in the present study). For our sample, Citibank is the one with the least number of branches – only 3 branches in 2004 (increases to 11 branches in 2012). The number of branches also increases over years, where in 2008 the mean is 141 but in 2012 the mean is 156. Of course, the expansion is due mainly to local banks. Similar pattern of huge variation are observed for other inputs and outputs more or less for the same reasons mentioned above.
In fact, the variation in the new facilities, i.e. the 4 machines that facilitates payment system, are even bigger. Note that not all of the sample banks offer a full set of these modern facilities. In 2004 for example, Public bank still do not have any unit of Cheque Deposit Machine, while Alliance and Eon Bank do not provide this modern payment facility in the whole sample. RHB and Citibank do not have Cheque Scan Machine in our sample. Hong Leong Bank has 2 units in 2004, but this facility was not offered after 2005, while Affin and CIMB only offer this payment facility in 2005. Only 3 banks offer Passbook Update Machine, they are Maybank, OCBC bank and Standard Charted Bank Malaysia. It seems that the leading local banks have offered a huge quantify of these new payment facilities. For example Maybank have 359 units of Cash Deposit Machines in 2004, and the number continue to rise to 986 units of Cash Deposit Machines in 2012. Other local banks however, averagely only have 50 units in 2004 but also have increases to 434 units in 2012. However, if we were to look at quantity per branch, foreign banks actually top the list. By branch level, Citibank, HSBC and OCBC offer actually offering more of these facilities relative to Maybank.
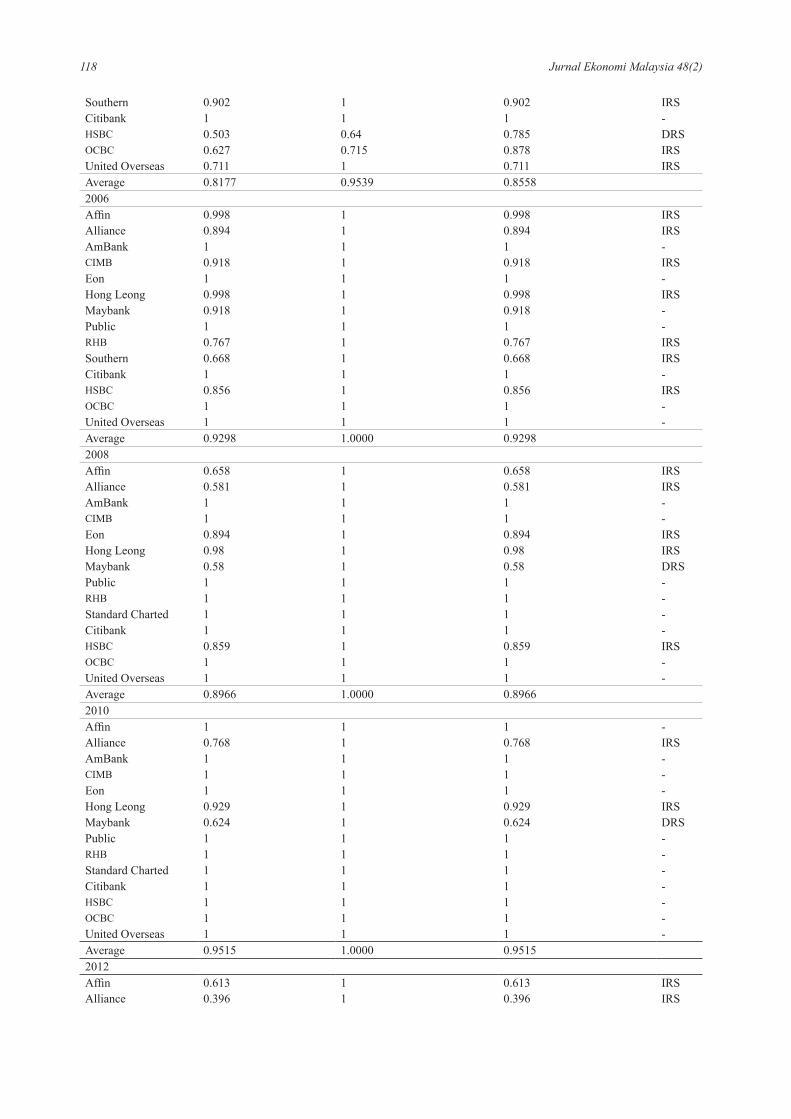
TECHNICAL AND SCALE EFFICIENCY FROM DEA
The results of DEA scores are tabulated in Table 4. The table shows the technical efficiency of the commercial banks over year 2004-20012 and the decomposition of pure technical efficiency and scale efficiency. On average, in the context of technological innovation in banking delivery system, the average technical efficient of commercial banks in Malaysia are relatively close with average efficiency score of 81.77% in 2004, 92.98% in 2006, 89.66% in 2008, 95.15% in 2010 and 87.72 in 2012. This means that the inefficient banks (those scored less than 100%) would have to reduce less than 20% of their factor of production in the delivery system in order to produce the same level of financial output as their efficient counterpart. In addition, it can be seen that these banks
117Technological Innovation in Services and the Efficiency of Malaysian Commercial Banks
TABLE 3. Descriptive Statistics of DEA Inputs and Outputs
Inputs Outputs
Branch Staff ATMCash
Deposit Machine
Cheque Deposit Machine
Cheque Scan
Machine
Passbook Update
Machine
Loans &Advances (million)
Deposit (million)
2004Mean 124 5124 290 55 54 20 17 23673.07 29873.14Median 93 3212 155 26 28 7 0 16101.50 18012.50Maximum 334 20764 1128 359 290 102 203 86718.00 111046.00Minimum 3 1462 32 4 0 0 0 7221.00 6680.00Std. Dev. 98 5093 317 90 79 29 54 20601.33 26971.48C.V. 0.79 0.99 1.09 1.64 1.47 1.46 3.14 0.87 0.902006Mean 135 6460 333 89 92 34 17 35068.93 41191.64Median 125 4714 169 52 43 21 0 23074.00 28670.50Maximum 353 20813 1518 509 273 187 218 127848.00 153175.00Minimum 3 2010 32 18 0 0 0 12901.00 16255.00Std. Dev. 101 4946 411 126 94 50 58 30356.92 37472.47C.V. 0.75 0.77 1.23 1.41 1.02 1.46 3.38 0.87 0.912008Mean 141 6977 462 188 86 90 9 41495.14 54066.50Median 114 5336 178 105 32 56 0 26309.50 34328.00Maximum 372 22465 2680 837 336 347 96 136224.00 149576.00Minimum 7 2012 38 39 0 0 0 13019.00 17787.00Std. Dev. 117 5842 719 226 111 116 26 35108.28 43246.50C.V. 0.83 0.84 1.56 1.20 1.28 1.29 2.86 0.85 0.802010Mean 143 7,490 575 260 121 93 6 47,084 66,918Median 120 5,159 208 134 39 52 0 28,751 42,539Maximum 384 22,856 2,831 944 442 483 46 144,432 193,575Minimum 7 1,818 33 28 0 0 0 16,278 21,815Std. Dev. 117 6,072 838 303 146 140 13 38,964 54,051C.V. 0.82 0.81 1.46 1.17 1.21 1.51 2.17 0.83 0.812012Mean 156 9,617 707 340 244* 2 85,616 102,597Median 98 4,434 231 136 110* 0 55,193 65,607Maximum 392 42,693 2,866 1,104 759* 25 214,852 243,970Minimum 11 2,084 38 48 35* 0 19,727 26,959Std. Dev. 132 10,821 903 356 244* 7 72,913 83,222C.V. 0.84 1.13 1.28 1.05 1.00* 3.47 0.85 0.81
Std. Dev. Denote standard deviation and C.V. is Coefficient of Variation; * The Association of Banks in Malaysia has merged the statistics of Cheque Deposit Machine and Cheque Scan Machine in year 2012 and onwards.
TABLE 4. Technical and Scale Efficiency Scores
Bank (1) Technical Efficiency (2) Pure Technical efficiency Scale Efficiency = [(1)/(2)] Type2004Affin 1 1 1 -Alliance 1 1 1 -AmBank 0.71 1 0.71 IRSCIMB 1 1 1 -Eon 0.593 1 0.593 IRSHong Leong 1 1 1 -Maybank 0.402 1 0.402 DRSPublic 1 1 1 -RHB 1 1 1 -
118 Jurnal Ekonomi Malaysia 48(2)
Southern 0.902 1 0.902 IRSCitibank 1 1 1 -HSBC 0.503 0.64 0.785 DRSOCBC 0.627 0.715 0.878 IRSUnited Overseas 0.711 1 0.711 IRSAverage 0.8177 0.9539 0.85582006Affin 0.998 1 0.998 IRSAlliance 0.894 1 0.894 IRSAmBank 1 1 1 -CIMB 0.918 1 0.918 IRSEon 1 1 1 -Hong Leong 0.998 1 0.998 IRSMaybank 0.918 1 0.918 -Public 1 1 1 -RHB 0.767 1 0.767 IRSSouthern 0.668 1 0.668 IRSCitibank 1 1 1 -HSBC 0.856 1 0.856 IRSOCBC 1 1 1 -United Overseas 1 1 1 -Average 0.9298 1.0000 0.92982008Affin 0.658 1 0.658 IRSAlliance 0.581 1 0.581 IRSAmBank 1 1 1 -CIMB 1 1 1 -Eon 0.894 1 0.894 IRSHong Leong 0.98 1 0.98 IRSMaybank 0.58 1 0.58 DRSPublic 1 1 1 -RHB 1 1 1 -Standard Charted 1 1 1 -Citibank 1 1 1 -HSBC 0.859 1 0.859 IRSOCBC 1 1 1 -United Overseas 1 1 1 -Average 0.8966 1.0000 0.89662010Affin 1 1 1 -Alliance 0.768 1 0.768 IRSAmBank 1 1 1 -CIMB 1 1 1 -Eon 1 1 1 -Hong Leong 0.929 1 0.929 IRSMaybank 0.624 1 0.624 DRSPublic 1 1 1 -RHB 1 1 1 -Standard Charted 1 1 1 -Citibank 1 1 1 -HSBC 1 1 1 -OCBC 1 1 1 -United Overseas 1 1 1 -Average 0.9515 1.0000 0.95152012Affin 0.613 1 0.613 IRSAlliance 0.396 1 0.396 IRS
119Technological Innovation in Services and the Efficiency of Malaysian Commercial Banks
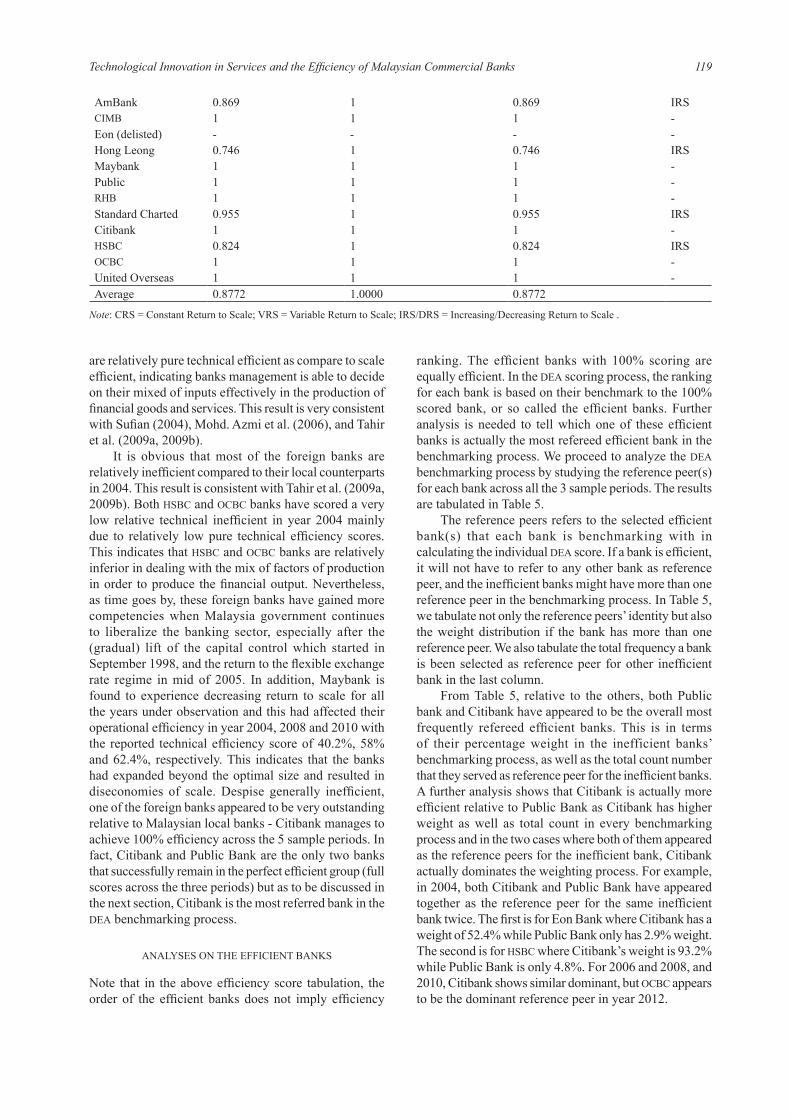
are relatively pure technical efficient as compare to scale efficient, indicating banks management is able to decide on their mixed of inputs effectively in the production of financial goods and services. This result is very consistent with Sufian (2004), Mohd. Azmi et al. (2006), and Tahir et al. (2009a, 2009b).
It is obvious that most of the foreign banks are relatively inefficient compared to their local counterparts in 2004. This result is consistent with Tahir et al. (2009a, 2009b). Both HSBC and OCBC banks have scored a very low relative technical inefficient in year 2004 mainly due to relatively low pure technical efficiency scores. This indicates that HSBC and OCBC banks are relatively inferior in dealing with the mix of factors of production in order to produce the financial output. Nevertheless, as time goes by, these foreign banks have gained more competencies when Malaysia government continues to liberalize the banking sector, especially after the (gradual) lift of the capital control which started in September 1998, and the return to the flexible exchange rate regime in mid of 2005. In addition, Maybank is found to experience decreasing return to scale for all the years under observation and this had affected their operational efficiency in year 2004, 2008 and 2010 with the reported technical efficiency score of 40.2%, 58% and 62.4%, respectively. This indicates that the banks had expanded beyond the optimal size and resulted in diseconomies of scale. Despise generally inefficient, one of the foreign banks appeared to be very outstanding relative to Malaysian local banks - Citibank manages to achieve 100% efficiency across the 5 sample periods. In fact, Citibank and Public Bank are the only two banks that successfully remain in the perfect efficient group (full scores across the three periods) but as to be discussed in the next section, Citibank is the most referred bank in the DEA benchmarking process.
ANALYSES ON THE EFFICIENT BANKS
Note that in the above efficiency score tabulation, the order of the efficient banks does not imply efficiency
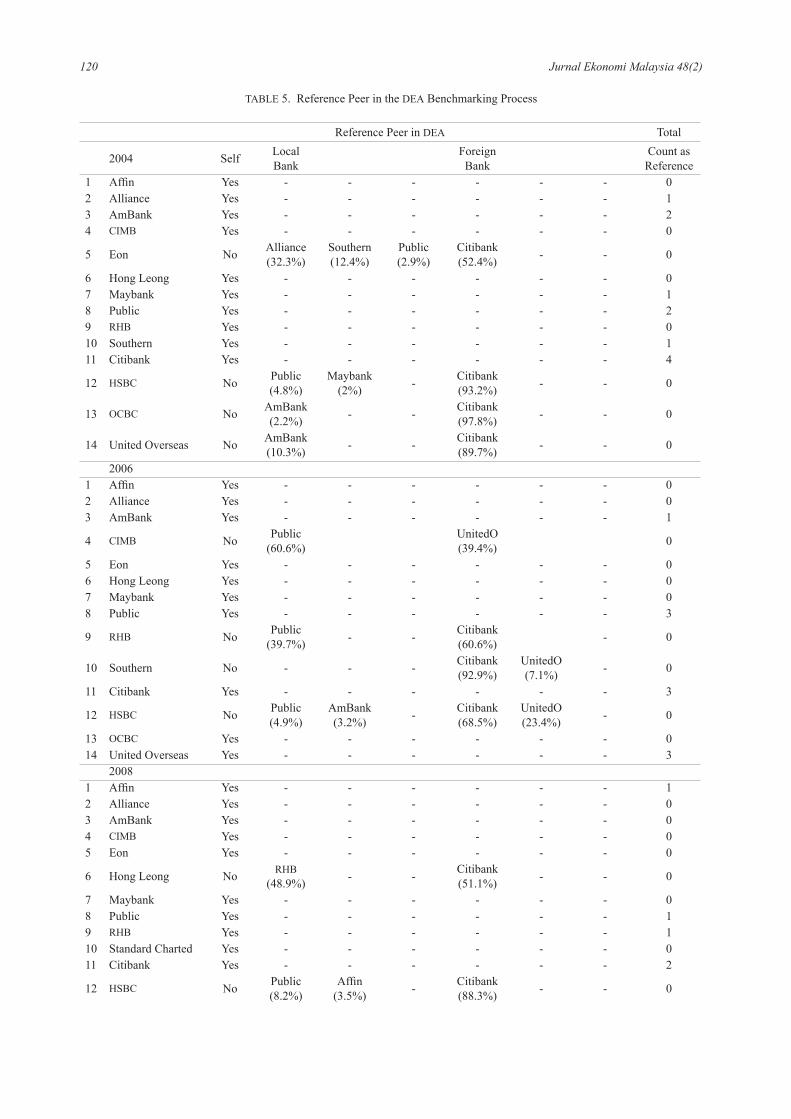
ranking. The efficient banks with 100% scoring are equally efficient. In the DEA scoring process, the ranking for each bank is based on their benchmark to the 100% scored bank, or so called the efficient banks. Further analysis is needed to tell which one of these efficient banks is actually the most refereed efficient bank in the benchmarking process. We proceed to analyze the DEA benchmarking process by studying the reference peer(s) for each bank across all the 3 sample periods. The results are tabulated in Table 5.
The reference peers refers to the selected efficient bank(s) that each bank is benchmarking with in calculating the individual DEA score. If a bank is efficient, it will not have to refer to any other bank as reference peer, and the inefficient banks might have more than one reference peer in the benchmarking process. In Table 5, we tabulate not only the reference peers’ identity but also the weight distribution if the bank has more than one reference peer. We also tabulate the total frequency a bank is been selected as reference peer for other inefficient bank in the last column.
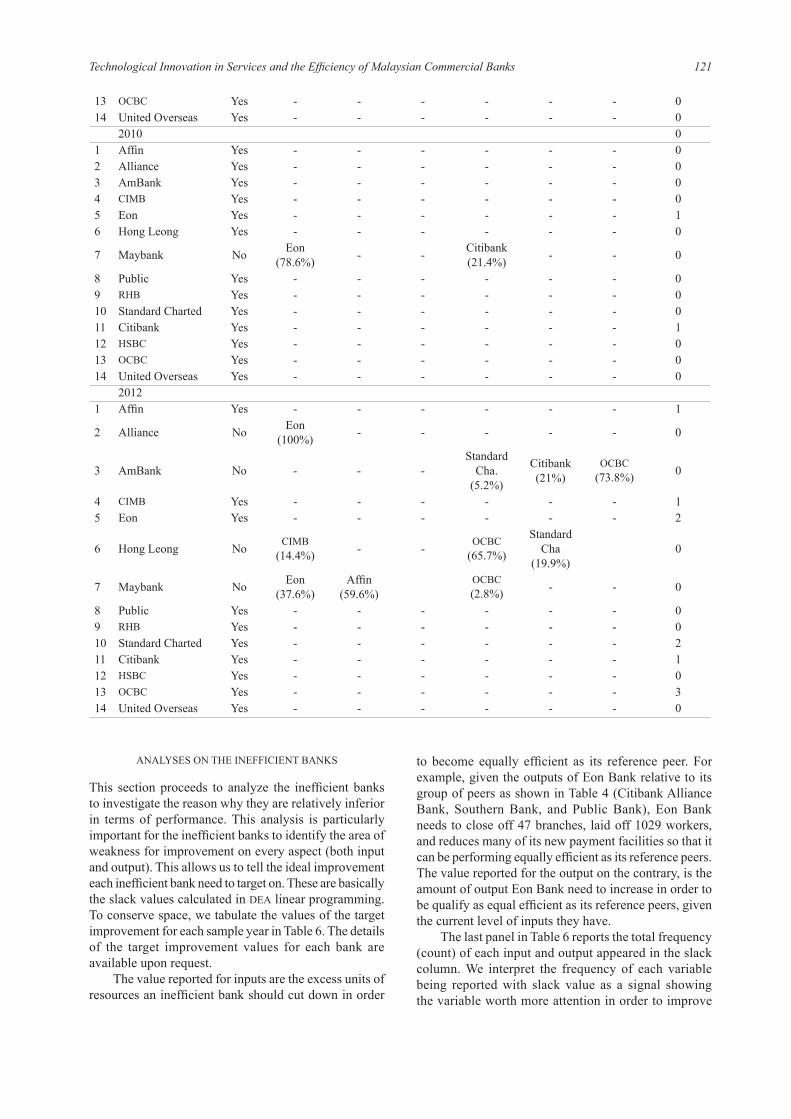
From Table 5, relative to the others, both Public bank and Citibank have appeared to be the overall most frequently refereed efficient banks. This is in terms of their percentage weight in the inefficient banks’ benchmarking process, as well as the total count number that they served as reference peer for the inefficient banks. A further analysis shows that Citibank is actually more efficient relative to Public Bank as Citibank has higher weight as well as total count in every benchmarking process and in the two cases where both of them appeared as the reference peers for the inefficient bank, Citibank actually dominates the weighting process. For example, in 2004, both Citibank and Public Bank have appeared together as the reference peer for the same inefficient bank twice. The first is for Eon Bank where Citibank has a weight of 52.4% while Public Bank only has 2.9% weight. The second is for HSBC where Citibank’s weight is 93.2% while Public Bank is only 4.8%. For 2006 and 2008, and 2010, Citibank shows similar dominant, but OCBC appears to be the dominant reference peer in year 2012.
AmBank 0.869 1 0.869 IRSCIMB 1 1 1 -Eon (delisted) - - - -Hong Leong 0.746 1 0.746 IRSMaybank 1 1 1 -Public 1 1 1 -RHB 1 1 1 -Standard Charted 0.955 1 0.955 IRSCitibank 1 1 1 -HSBC 0.824 1 0.824 IRSOCBC 1 1 1 -United Overseas 1 1 1 -Average 0.8772 1.0000 0.8772
Note: CRS = Constant Return to Scale; VRS = Variable Return to Scale; IRS/DRS = Increasing/Decreasing Return to Scale .
120 Jurnal Ekonomi Malaysia 48(2)
TABLE 5. Reference Peer in the DEA Benchmarking Process
Reference Peer in DEA Total
2004 Self Local Bank Foreign
Bank Count as Reference
1 Affin Yes - - - - - - 02 Alliance Yes - - - - - - 13 AmBank Yes - - - - - - 24 CIMB Yes - - - - - - 0
5 Eon No Alliance (32.3%)
Southern (12.4%)
Public (2.9%)
Citibank (52.4%) - - 0
6 Hong Leong Yes - - - - - - 07 Maybank Yes - - - - - - 18 Public Yes - - - - - - 29 RHB Yes - - - - - - 010 Southern Yes - - - - - - 111 Citibank Yes - - - - - - 4
12 HSBC No Public (4.8%)
Maybank (2%) - Citibank
(93.2%) - - 0
13 OCBC No AmBank (2.2%) - - Citibank
(97.8%) - - 0
14 United Overseas No AmBank (10.3%) - - Citibank
(89.7%) - - 0
2006 1 Affin Yes - - - - - - 02 Alliance Yes - - - - - - 03 AmBank Yes - - - - - - 1
4 CIMB No Public (60.6%)
UnitedO (39.4%) 0
5 Eon Yes - - - - - - 06 Hong Leong Yes - - - - - - 07 Maybank Yes - - - - - - 08 Public Yes - - - - - - 3
9 RHB No Public (39.7%) - - Citibank
(60.6%) - 0
10 Southern No - - - Citibank (92.9%)
UnitedO (7.1%) - 0
11 Citibank Yes - - - - - - 3
12 HSBC No Public (4.9%)
AmBank (3.2%) - Citibank
(68.5%)UnitedO (23.4%) - 0
13 OCBC Yes - - - - - - 014 United Overseas Yes - - - - - - 3 2008 1 Affin Yes - - - - - - 12 Alliance Yes - - - - - - 03 AmBank Yes - - - - - - 04 CIMB Yes - - - - - - 05 Eon Yes - - - - - - 0
6 Hong Leong No RHB (48.9%) - - Citibank
(51.1%) - - 0
7 Maybank Yes - - - - - - 08 Public Yes - - - - - - 19 RHB Yes - - - - - - 110 Standard Charted Yes - - - - - - 011 Citibank Yes - - - - - - 2
12 HSBC No Public (8.2%)
Affin (3.5%) - Citibank
(88.3%) - - 0
121Technological Innovation in Services and the Efficiency of Malaysian Commercial Banks
ANALYSES ON THE INEFFICIENT BANKS
This section proceeds to analyze the inefficient banks to investigate the reason why they are relatively inferior in terms of performance. This analysis is particularly important for the inefficient banks to identify the area of weakness for improvement on every aspect (both input and output). This allows us to tell the ideal improvement each inefficient bank need to target on. These are basically the slack values calculated in DEA linear programming. To conserve space, we tabulate the values of the target improvement for each sample year in Table 6. The details of the target improvement values for each bank are available upon request.
The value reported for inputs are the excess units of resources an inefficient bank should cut down in order
to become equally efficient as its reference peer. For example, given the outputs of Eon Bank relative to its group of peers as shown in Table 4 (Citibank Alliance Bank, Southern Bank, and Public Bank), Eon Bank needs to close off 47 branches, laid off 1029 workers, and reduces many of its new payment facilities so that it can be performing equally efficient as its reference peers. The value reported for the output on the contrary, is the amount of output Eon Bank need to increase in order to be qualify as equal efficient as its reference peers, given the current level of inputs they have.
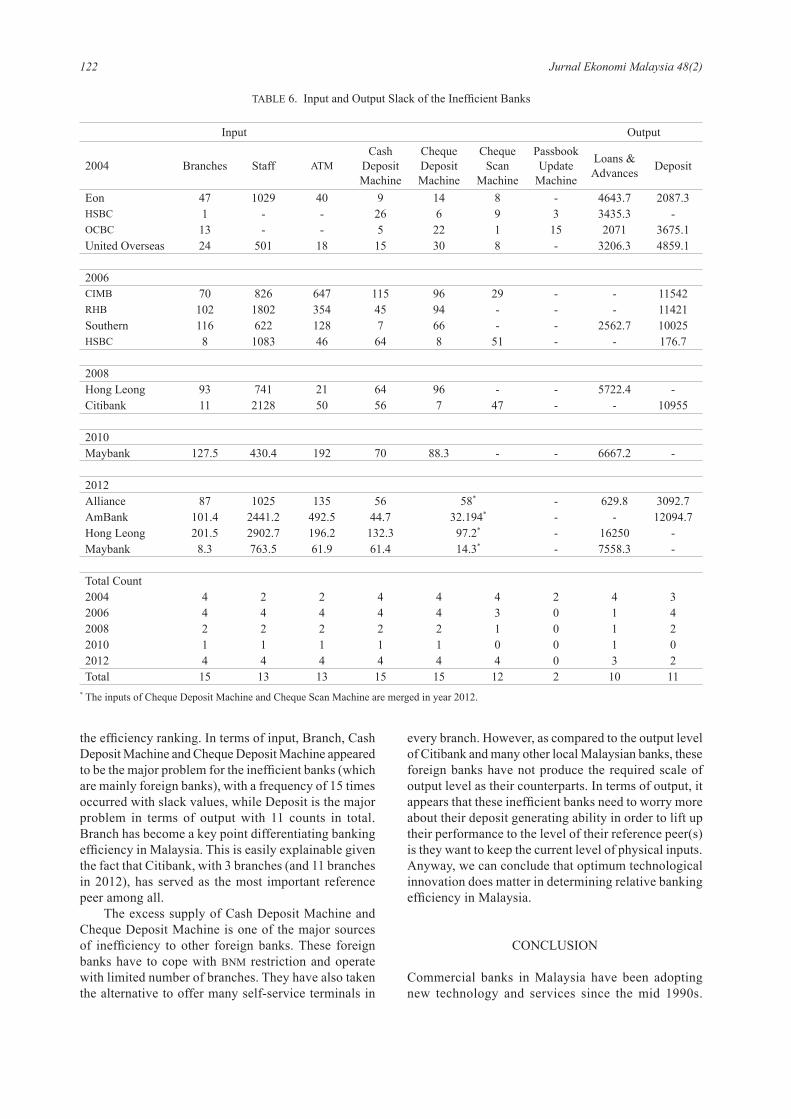
The last panel in Table 6 reports the total frequency (count) of each input and output appeared in the slack column. We interpret the frequency of each variable being reported with slack value as a signal showing the variable worth more attention in order to improve
13 OCBC Yes - - - - - - 014 United Overseas Yes - - - - - - 0
2010 01 Affin Yes - - - - - - 02 Alliance Yes - - - - - - 03 AmBank Yes - - - - - - 04 CIMB Yes - - - - - - 05 Eon Yes - - - - - - 16 Hong Leong Yes - - - - - - 0
7 Maybank No Eon (78.6%) - - Citibank
(21.4%) - - 0
8 Public Yes - - - - - - 09 RHB Yes - - - - - - 010 Standard Charted Yes - - - - - - 011 Citibank Yes - - - - - - 112 HSBC Yes - - - - - - 013 OCBC Yes - - - - - - 014 United Overseas Yes - - - - - - 0
20121 Affin Yes - - - - - - 1
2 Alliance No Eon (100%) - - - - - 0
3 AmBank No - - -Standard
Cha. (5.2%)
Citibank (21%)
OCBC (73.8%) 0
4 CIMB Yes - - - - - - 15 Eon Yes - - - - - - 2
6 Hong Leong No CIMB (14.4%) - - OCBC
(65.7%)
Standard Cha
(19.9%)0
7 Maybank No Eon (37.6%)
Affin (59.6%)
OCBC (2.8%) - - 0
8 Public Yes - - - - - - 09 RHB Yes - - - - - - 010 Standard Charted Yes - - - - - - 211 Citibank Yes - - - - - - 112 HSBC Yes - - - - - - 013 OCBC Yes - - - - - - 314 United Overseas Yes - - - - - - 0
122 Jurnal Ekonomi Malaysia 48(2)
the efficiency ranking. In terms of input, Branch, Cash Deposit Machine and Cheque Deposit Machine appeared to be the major problem for the inefficient banks (which are mainly foreign banks), with a frequency of 15 times occurred with slack values, while Deposit is the major problem in terms of output with 11 counts in total. Branch has become a key point differentiating banking efficiency in Malaysia. This is easily explainable given the fact that Citibank, with 3 branches (and 11 branches in 2012), has served as the most important reference peer among all.
The excess supply of Cash Deposit Machine and Cheque Deposit Machine is one of the major sources of inefficiency to other foreign banks. These foreign banks have to cope with BNM restriction and operate with limited number of branches. They have also taken the alternative to offer many self-service terminals in
every branch. However, as compared to the output level of Citibank and many other local Malaysian banks, these foreign banks have not produce the required scale of output level as their counterparts. In terms of output, it appears that these inefficient banks need to worry more about their deposit generating ability in order to lift up their performance to the level of their reference peer(s) is they want to keep the current level of physical inputs. Anyway, we can conclude that optimum technological innovation does matter in determining relative banking efficiency in Malaysia.
CONCLUSION
Commercial banks in Malaysia have been adopting new technology and services since the mid 1990s.
TABLE 6. Input and Output Slack of the Inefficient Banks
Input Output
2004 Branches Staff ATMCash
Deposit Machine
Cheque Deposit Machine
Cheque Scan
Machine
Passbook Update
Machine
Loans &Advances Deposit
Eon 47 1029 40 9 14 8 - 4643.7 2087.3HSBC 1 - - 26 6 9 3 3435.3 -OCBC 13 - - 5 22 1 15 2071 3675.1United Overseas 24 501 18 15 30 8 - 3206.3 4859.1
2006CIMB 70 826 647 115 96 29 - - 11542RHB 102 1802 354 45 94 - - - 11421Southern 116 622 128 7 66 - - 2562.7 10025HSBC 8 1083 46 64 8 51 - - 176.7
2008Hong Leong 93 741 21 64 96 - - 5722.4 -Citibank 11 2128 50 56 7 47 - - 10955
2010Maybank 127.5 430.4 192 70 88.3 - - 6667.2 -
2012Alliance 87 1025 135 56 58* - 629.8 3092.7AmBank 101.4 2441.2 492.5 44.7 32.194* - - 12094.7Hong Leong 201.5 2902.7 196.2 132.3 97.2* - 16250 -Maybank 8.3 763.5 61.9 61.4 14.3* - 7558.3 -
Total Count 2004 4 2 2 4 4 4 2 4 32006 4 4 4 4 4 3 0 1 42008 2 2 2 2 2 1 0 1 22010 1 1 1 1 1 0 0 1 02012 4 4 4 4 4 4 0 3 2Total 15 13 13 15 15 12 2 10 11
* The inputs of Cheque Deposit Machine and Cheque Scan Machine are merged in year 2012.
123Technological Innovation in Services and the Efficiency of Malaysian Commercial Banks
However, there is no attempt in empirical studies to quantify the contribution of technological innovation in bank services in accessing their performance and efficiency. Existing literature on bank technical efficiency were all build on conventional inputs and outputs variables such as staff numbers, branches, and financial indicators or ratio. Our study offers a different perspective of efficiency in terms of modeling and data. Basically we introduced new variables to gauge for technological innovation, which covered all the new service facilities offered by commercial banks in the last decade or so, including cash deposit machine, cheque deposit machine, cheque scan machine, and passbook update machine. These technology platforms not only are cost saving to the banks but they also improve customer satisfaction with more easy, speedy and reliable transaction processing.
Based on data over 2004-2012 periods, our new modeling that incorporated technological services shows that Malaysian banks have better pure technical efficiency as compared to scale efficiency, indicating banks management is able to decide on their input mixed effectively in the production of financial goods and services. This result is consistent with the previous literature, including Sufian (2004), Mohd. Azmi et al. (2006), and Tahir et al. (2009a, 2009b). With technological services as inputs, we documented that foreign banks in general are relatively inefficient compared to local Malaysian banks somewhat consistent with Tahir et al. (2009a, 2009b), but after the Malaysia government ended its capital control in 2005, the gap has been gradually closing. The result is not a surprise given that the Malaysian government has embark on liberalization in the banking and financial sectors, which surely allow for more competition between local and foreign banks. Sooner or later we can expect the foreign banks to become a dominant force in Malaysian should the local banks is not well prepared for the opening up of the banking sectors in the near future. Despise generally inefficient, one foreign bank – Citibank appear to be very outstanding relative to Malaysian local banks. Our efficiency ranking basically is consistent with Salleh et al. (2001) although their study uses conventional set of financial input in the efficiency benchmarking process using the data in the late 1990s.
In short, our study implies that technological innovation in banking services does contribute to differentiating the relative efficiency of banks. In the context of policy recommendation, our novel result indicates bank that provide better technological services do acquire competitive advantage against their peers and so local bankers should keep up with the latest technology needs of their customers in order to stay ahead of the stiff competition in this industry.
REFERENCES
Berger, A.N. & Humphrey, D.B. 1991. The Dominance of inefficiencies over scale and product mix economies in banking. Journal of Monetary Economics 28: 117–148.
Berger, A.N. & Humphrey, D.B. 1997. Efficiency of financial institutions: International survey and directions for future research. European Journal of Operational Research 98: 175–212.
Charnes, A., Coopers, W.W., Huang, Z.M. & Sun, D.B. 1990. Polyhedral cone-ratio DEA models with an illustrative application to large commercial banks. Journal of Econometric 46: 73–91.
Farrell, M.J. 1957. The measurement of productive efficiency. Journal of the Royal Statistical Society A 120: 253–281.
Ferrier, G.D. & Lovell, C.A.K. 1990. Measuring cost efficiency in banking: Econometric and linear programming evidence. Journal of Econometric 46: 229–245.
Fried, H.O., Lovell, C.A.K. & Eeckaut, P.V. 1993. Evaluating the performance of U.S. credit unions. Journal of Banking and Finance 17(2–3): 251–265.
Gerdes, G.R. & Walton, II J.K. 2002. The use of checks and other noncash payment instruments in the United States. Federal Reserve Bulletin 88: 360–374.
Giannakoudi, S. 1999. Internet banking: The digital voyage of banking and money in cyberspace. Information and Communications Technology Law 8(3): 205–244.
Haslem, J.A. & Scheraga, C.A. 1999. DEA efficiency profiles of U.S. banks operating internationally. International Review of Economics and Finance 8: 165–183.
Katib, M.N., Mathews, K. 2000. A non-parametric approach to efficiency measurement in the Malaysian banking sector. The Singapore Economic Review 44: 89–114.
Krishnasamy, G., Ridzwa, A.F. & Vignesan, P. 2004. Malaysian post-merger banks’ productivity: Application of malmquist productivity index. Managerial Finance 30: 63–74.
Kwan, S.H. 2003. Operating performance of banks among Asian economies: An international and time series comparison. Journal of Banking and Finance 27: 471–489.
Miller, S.M. & Noulas, A.G. 1996. The technical efficiency of large bank production. Journal of Banking and Finance 20: 495–509.
Mohd. Azmi, O., Abdul Rahim, A.R., Rosylin, M.Y., Shabri, A.M. & Mohd. Eskandar Shah, M.R. 2006. Efficiency of commercial banks in Malaysia. Asian Academic of Management Journal of Accounting and Finance 2(2): 19–42.
Muhammad-Rus, A.D., Abdul-Majid M., and Mohd-Nor, A.H.S. 2011. Financial liberalization and cost efficiency in islamic and conventional banking: A stochastic frontier approach. Journal Ekonomi Malaysia 45: 89–100.
Saha, A. & Ravisankar, T.S. 2000. Rating of Indian commercial banks: A DEA approach. European Journal of Operational Research 124: 187–203.
Salleh, Y., Hooy, C.W., Goh, W.K. 2001. Using DEA to rate commercial banks. Banker’s Journal Malaysia 118: 5–18.
Sherman, H.D. & Gold, F. 1985. Bank branch operating efficiency: Evaluation with data envelope analysis. Journal of Banking and Finance 9: 297–316.
Sufian, F. 2004. The efficiency effects of bank mergers and acquisitions in developing economy: Evidence from
124 Jurnal Ekonomi Malaysia 48(2)
Malaysia. International Journal of Applied Econometrics and Quantitative Studies 1(4): 53–74.
Sufian, F. 2006. The efficiency of non-bank financial institutions: Empirical evidence from Malaysia. International Journal of Finance and Economics 6: 49–65.
Sufian, F. 2007. What explains differences in the efficiency of non-commercial bank financial intermediaries: Empirical evidence from Malaysia. Asian Academic of Management Journal of Accounting and Finance 3(1): 37–57.
Tahir I.M., Nor Mazlina, A.B. & Haron, S. 2009a. Estimating technical and scale efficiency of Malaysian commercial banks: A non-parametric approach. International Review of Business Research Papers 5(1): 113–123.
Tahir I.M., Nor Mazlina, A.B. & Haron, S. 2009b. Evaluating efficiency of Malaysian banks using data envelopment analysis. International Journal of Business and Management 4(8): 96–106.
Thanassoulis, E. 1999. Data envelopment analysis and its use in banking. Interfaces 29(3): 1–13.
Wheelock, D.C. & Wilson, P.W. 1995a. Evaluating the efficiency of commercial banks: Does our view of what banks do matter? Review, Federal Reserve Bank of St. Louis 77: 39–52.
Wheelock, D.C. & Wilson, P.W. 1995b. Explaining bank failures: Deposit insurance, regulation, and efficiency. The Review of Economics and Statistics 77: 689–700.
Chee-Wooi, Hooy*School of ManagementUniversiti Sains Malaysia11800 PenangMALAYSIA
Sok-Gee, Chan**Department of Finance and BankingFaculty of Business and Accountancy BuildingUniversity of Malaya50603 Kuala LumpurMALAYSIA
*[email protected] (corresponding author)**[email protected]
125Technological Innovation in Services and the Efficiency of Malaysian Commercial Banks
Appendix A. List of sample commercial banks
Local Malaysian Bank1 Affin Bank Berhad2 Alliance Bank Malaysia Berhad3 AmBank Berhad 4 CIMB Bank Berhad5 Eon Bank Berhad6 Hong Leong Bank Berhad7 Maybank8 Public Bank Berhad9 RHB Bank BerhadForeign Bank10 Citibank Berhand11 HSBC Bank Malaysia Berhad12 OCBC Bank (Malaysia) Berhad13 Standard Charted Bank Malaysia Berhad14 United Overseas Bank (Malaysia) Bhd