potential of membrane technology for treatment and reuse of … teow yeit haan.pdf · semua...
TRANSCRIPT
Sains Malaysiana 47(11)(2018): 2887–2897 http://dx.doi.org/10.17576/jsm-2018-4711-32
Potential of Membrane Technology for Treatment and Reuse of Water from Old Mining Lakes
(Potensi Teknologi Membran untuk Rawatan dan Penggunaan Semula Air dari Tasik Lombong Lama)
TEOW YEIT HAAN*, ABDUL WAHAB MOHAMMAD, SYAZAMAN RAMLI, MOHD SHAIFUL SAJAB & NOORINI IZZATI MOHAMAD MAZUKI
ABSTRACT
The El-Nino phenomenon in early 2014 contributed to the lack of water supply in most Southeast Asian countries. Suggestions have since been made to ensure the continuity of water supply, one of which involves membrane technology to treat mine water so that it is compatible for citizens’ use. Accordingly, the objective of this research was to study the efficiency of membrane technology in treating mine water. Our elucidation of all the parameters has showed that the best attainable classification is at Class IV. Although it was still regarded as polluted, the treated mine water can be used as water supply reservoir. For the membranes tested such as ultrafiltration 10 kDa, 5 kDa and reverse osmosis, the percentage of rejection for chemical oxygen demand is 21-72%, 40-96% for total suspended solids and 21-72% for ammonia nitrogen. The pH also gradually shifted to almost neutral after the filtration.
Keywords: Heavy metal; mine water; membrane technology; water quality parameter; water reuse
ABSTRAK
Fenomenon cuaca El-Nino pada awal 2014 menyumbang kepada kekurangan bekalan air di kebanyakan negara di Asia Tenggara. Objektif kajian ini adalah untuk mengkaji kecekapan teknologi membran untuk rawatan air lombong dengan membandingkan parameter kualiti air sebelum dan selepas penurasan berdasarkan Indeks Kualiti Air (WQI) seterusnya memberi cadangan reka bentuk loji rawatan air yang merawat air lombong dengan menggunakan teknologi membran. Semua parameter yang dikaji menunjukkan bahawa klasifikasi maksimum yang tercapai adalah Kelas IV. Berdasarkan WQI, walaupun semua air lombong dianggap tercemar tetapi ia masih dapat digunakan sebagai sumber air takungan. Nilai WQI yang berada dalam lingkungan 47-65 dikategorikan sebagai Kelas III dan IV. Untuk membran yang diuji seperti penurasan ultra 10 kDa, 5 kDa dan osmosis songsang, peratusan penolakan untuk permintaan oksigen kimia adalah 21-72%, 40-96% untuk jumlah pepejal terampai dan 21-72% untuk nitrogen ammonia. pH juga beransur-ansur berubah hampir ke neutral selepas proses penurasan dijalankan.
Kata kunci: Air lombong; logam berat; parameter kualiti air; penggunaan semula air; teknologi membran
INTRODUCTION
The El-Nino phenomenon hit Southeast Asia in early 2014 and persisted for about 18 months, leading to the movement of hot airs and less rainfall. This caused elevation in the temperatures of the surrounding regions, culminating in the receding of water levels in dam systems and, by extension, water rationing in most of the affected countries. Against this background, suggestions have been made to ensure the continuity of water supply, one of which is to channel the water from mines to dams and rivers for the citizens’ use. A former mining area is an area where mining used to be performed that has been abandoned for a long time. Although earlier studies have shown that mine water is safe for daily uses, there is evidence that mine water contains heavy metals. Hence, anxiety has arisen among users concerning the safety and quality mine water. A comprehensive study on mine water from different potential former mining areas is therefore warranted for assessing the safety and quality.
Therearefivemajorcategoriesofpotentialpollutantsin mine water, namely physical, chemical (organic), chemical (non-organic), biological, and radiological pollutants, as shown in Table 1. In previous studies, Rozkowski and Rozkowski (1994) and Sivakumar et al. (1994) have stated that the acceptable parameters for mine water are as follows: 500-2000 mg/L for total dissolved solids (TSS), 10-100 mg/L for suspended solids (SS), < 5 mg/L for biochemical oxygen demand (BOD), 10-100 mg/L for chemical oxygen demand (COD), 7-9.5 for pH, 600-10,000μs/cmforconductivityand30-600unitsforcolour. Membrane technology is a generic term for a number of a number of separation processes that are similar in their involvement of membranes but are otherwise different in their characteristics. Membranes have widely been implemented as a valuablemeansoffiltering andcleaning in the production of processed water from groundwater, surface water or wastewater. Some studies
2888
have demonstrated that separation processes through membranes could be effective in treating mine water (Kesieme & Aral 2015; Mullett et al. 2014). As reported by Kesieme and Aral (2015), sulphate and metal separation efficiencywas>99.99%andtheoverallwaterrecoveryexceeded80%.Ontheotherhand,rejectionabove95%forall multivalent cations was achieved by NF 270 membrane in Mullet et al. (2014) research work. Georgescu and Andrei (2000) investigated the application of reverse osmosis (RO) membranes for the treatment of mining and metallurgical wastewater in replacing the conventional treatment method, such as ion exchange, precipitation, electrochemical, filtration and floatation as the need of economic and effective removal methods for heavy metals. Wilmonth et al. (1978) determined the effectiveness of RO membranes in treating the acid mine drainage (AMD) at the EPA Crown Field Site, located near Morgantown, West Virginia. Themainobjectiveofthisstudywastoinvestigatethepotential of different membrane modules (UF membrane with the nominal molecular weight cut-off (MWCO) of 10 kDa, UF membrane with MWCO of 5 kDa, and RO membrane) used in treating mine water collected from three places in Selangor,Malaysia:BandarSaujanaPutra,Jenjarom(Sample1),fromTamanPutraPerdana,Puchong(Sample 2) and Persiaran Puchong Perdana, Puchong (Sample3).
EXPERIMENTAL DETAILS
MATERIALS
The samples of mine water in this study were collected from three places in Selangor,Malaysia:BandarSaujanaPutra, Jenjarom (Sample 1) withGPS coordinate of
2.9390562000°,101.5844967000°;TamanPutraPerdana,Puchong (Sample 2) with GPScoordinateof2.942668°,101.620389°;andPersiaranPuchongPerdana,Puchong(Sample3)withGPScoordinateof2.998139°,101.636252°.Threedifferenttypesofflatsheetcommercialmembraneswere purchased fromAmfor Inc., Beijing,China.Asreported by the manufacturer, UF membranes were made from polyethersulphone (PES) with the nominal MWCOs of 10 kDa and 5 kDa; while pH resistance ranged from 1 to13.FortheRO membrane, it was made from polyamide thinfilmcompositewith95%MgSO4and99.4%NaClrejection.
MEMBRANE PERFORMANCE EVALUATION
Membrane Permeability Test Membrane permeability is the simplest method to measure the ability of a membrane toallowfluidstopassthroughit.Alaboratorybench-scaledead-end test unit was used to study the performance of each membrane module (UF membrane with the nominal MWCO of 10 kDa, UF membrane with MWCO of 5 kDa and RO membrane). At the earliest stage of the experiment, ultra-pure water was used as the background solution. The membranes were flushedwithultra-purewaterbeforeanyprocesssolutionswere passed through them. Each membrane module was tested with ultra-pure water to investigate the pure water flux (PWF) at various applied pressures (P). All of the membranes were cut into a disc shape with an effective membranefiltrationareaof46.2cm2 (including the area covered by the O-ring). Continuous stirring was provided throughoutthemembranefiltrationprocesstoreducetheconcentration polarization effect on the membrane surface.Thespecificpressure-driven PWF of each membrane module at a constant pressure can be described by Darcy’s law:
TABLE 1. Potential pollutants in mine water and its categories
Categories Pollutant
Physical
Suspended solidsTurbidityColourTemperatureTaste and odour
Chemical(Organic)
CoalOil and greaseSoap and detergentRubberColouring and phenolic compound
Chemical(Non-organic)
Heavy metal ( Cr, Hg, Cu, Cd, Pb, Zn, Ni, Mn, Fe)AcidAlkaliCyanideSaline solution:- Cations: Mg, Ca, K, Na, Fe, Mn- Anions: Cl-, SO4
-, NO3-, HCO3
-, PO4-
Biological Bacteria, virus and microorganismRadiological Uranium, tritium
2889
(1)
where Jisthespecificmembranewaterflux(L/m2 h); A is the membrane effective area (m2); V is the volume of permeating water (L) and; tisthefiltrationtimerequiredto collect V (h), ∆P represents the transmembrane pressure (TMP); η is the dynamic viscosity of the water; Rm is the membraneresistancetothepurewaterflux;andRc stands for the deposited resistance.
MEMBRANE TREATMENT ON MINE WATER
The effectiveness of the membranes in treating mine water was measured by the degree to which the feed material was retained during operation. It was determined under 5 bar using the raw mine water samples collected from the different sampling locations as aforementioned in previous section. In order to alleviate the impact of compaction, the pre-filtrationstudywithpurewaterwasfirstconductedat5barfor30minuntilasteady-statefluxwasachieved.The quality of the treated mine water was analyzed in terms of BOD, COD, DO, NH3-N, SS and pH for subsequent classification based on theWaterQuality Index (WQI) calculation as follows:
WQI= 0.22 × SIDO + 0.19SIBOD + 0.16SICOD + 0.15SIAN + 0.16SISS + 0.12SIpH (2)
Based on the Malaysia WQI, the water quality is classified according to one of the following categoriesshown in Table 2 (Department of Environment Malaysia (DOE) 2008).
ANALYTICAL METHODS
Inductively Coupled Plasma Electron Spectrometry (ICPES) ICPES was used to detect the presence of metals listed in periodic table at concentrations as low as one part in 1015 (part per quadrillion, ppq).
pH Analysis The solubility of metals in water is mainly dependent on the pH of the water sample. Low pH values (acidic conditions) contribute to higher metal solubility whereas high pH values (alkaline conditions) lead to the precipitation of metal oxides. The pH of the water samples
was measured using a pH meter (Eutech Instruments Pte Ltd., Singapore).
Dissolved Oxygen (DO) Analysis DO refers to the level of free, non-compound oxygen present in water or other liquids. It is measured in the number of milligrams of oxygen dissolved in a liter of water (mg/L) using a DO meter(ThermoFisherScientific,Inc.,U.S).
Ammonia Nitrogen (NH3-N) Analysis NH3-N was analyzed using the Nessler method for quantifying the amount of ammonia, a toxic pollutant often found in liquid organic waste products. The apparatus used in the NH3-N study was DR3900BenchtopSpectrophotometerwithRFID*Technology (Hach Company, Colorado, USA) at the wavelength of 425 nm.
Chemical Oxygen Demand (COD) Analysis COD test serves to quantify the capacity of water to consume oxygen during the decomposition of organic matters and the oxidation of inorganic chemicals such as ammonia and nitrite; it is therefore commonly used to indirectly measure the amounts of organic compounds in water. The COD was measured using the reactor digestion method by meansofaDR3900BenchtopSpectrophotometerwithRFID* Technology (Hach Company, Colorado, USA). Two types of vials, COD Digestion Reagent of low range (LR) 3–150mg/L (HachCompany,Colorado,USA) and COD Digestion Reagent of high range (HR) 20–1500 mg/L (Hach Company, Colorado, USA), were applied for low-range and high-range levels of contamination, respectively.
Biochemical Oxygen Demand (BOD) Analysis BOD is the amount of dissolved oxygen needed by aerobic biological organisms in a body of water to break down organic materials present in a given water sample at certain temperatureoveraspecifictimeperiod.The5-dayBOD was measured by the dilution method, a standard method recognized by the U.S. Environmental Protection Agency (EPA) for the examination of water and wastewater.
Total Suspended Solids (TSS) Analysis TSS are solids in waterthatcanbetrappedbyafilter.Theyincludeawidevariety of materials, such as silt, decaying plant and animal matters, industrial wastes and sewage. The TSSs of the
TABLE2.MalaysianQualityIndex(DepartmentofEnvironmentMalaysia(DOE)2008)
ParameterClass
I II III IV VNH3-NBODCODDOpH
TSSWQI
< 0.1< 1< 10>7>7
< 2.5>92.7
0.1-0.31-3
10-255-76-7
25-5076.5-92.7
0.3-0.93-6
25-503-55-6
50-15051.9-76.5
0.9-2.76-12
50-1001-3< 530-5031-51.9
>2.7>12>100< 1< 5>300<31.0
2890
sample was directly measured by the DR3900BenchtopSpectrophotometer with RFID* Technology, using the photometricmethodwhichdidnotrequirethefiltrationorignition/weighing at the wavelength of 810 nm.
RESULTS AND DISCUSSION
ULTRA PURE WATER FLUX ANALYSIS
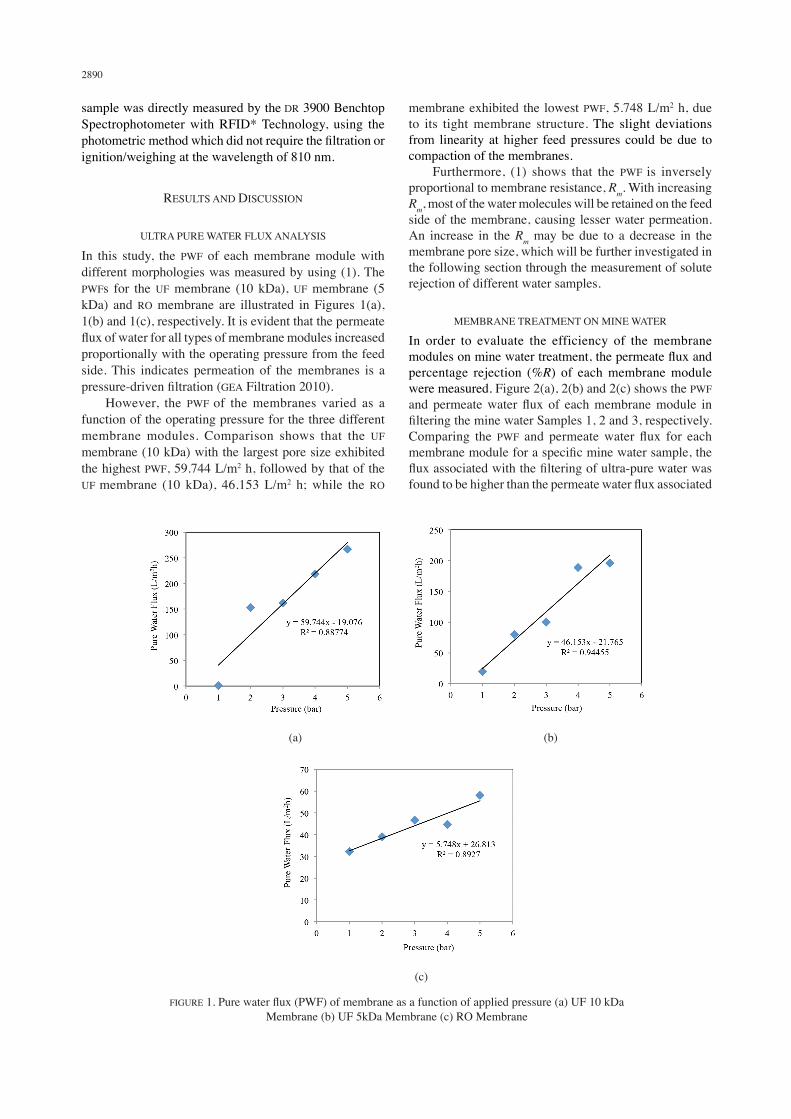
In this study, the PWF of each membrane module with different morphologies was measured by using (1). The PWFs for the UF membrane (10 kDa), UF membrane (5 kDa) and RO membrane are illustrated in Figures 1(a), 1(b) and 1(c), respectively. It is evident that the permeate fluxofwaterforalltypesofmembranemodulesincreasedproportionally with the operating pressure from the feed side. This indicates permeation of the membranes is a pressure-drivenfiltration(GEA Filtration 2010). However, the PWF of the membranes varied as a function of the operating pressure for the three different membrane modules. Comparison shows that the UF membrane (10 kDa) with the largest pore size exhibited the highest PWF, 59.744 L/m2 h, followed by that of the UF membrane (10 kDa), 46.153L/m2 h; while the RO
membrane exhibited the lowest PWF, 5.748 L/m2 h, due to its tight membrane structure. The slight deviations from linearity at higher feed pressures could be due to compaction of the membranes. Furthermore, (1) shows that the PWF is inversely proportional to membrane resistance, Rm. With increasing Rm, most of the water molecules will be retained on the feed side of the membrane, causing lesser water permeation. An increase in the Rm may be due to a decrease in the membrane pore size, which will be further investigated in the following section through the measurement of solute rejectionofdifferentwatersamples.
MEMBRANE TREATMENT ON MINE WATER
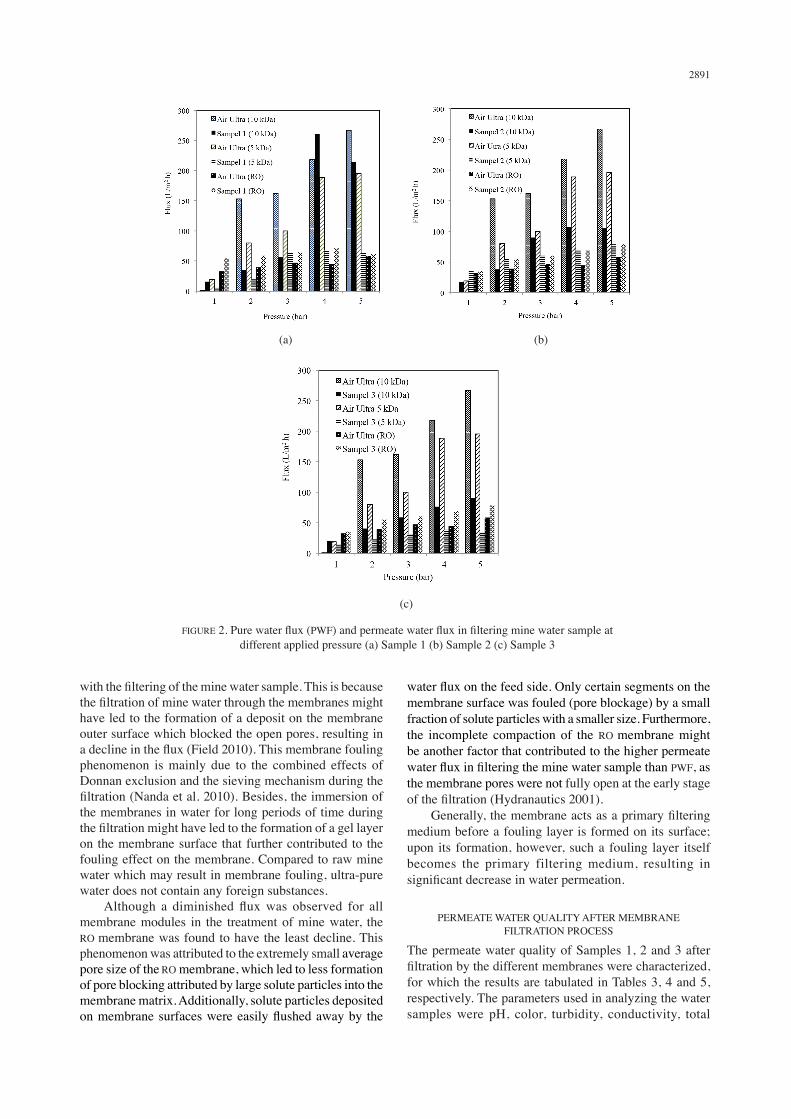
In order to evaluate the efficiency of the membrane modulesonminewatertreatment,thepermeatefluxandpercentage rejection (%R) of each membrane module were measured. Figure 2(a), 2(b) and 2(c) shows the PWF and permeatewater flux of eachmembranemodule infilteringtheminewaterSamples1,2and3,respectively.Comparing the PWF and permeatewater flux for eachmembranemoduleforaspecificminewatersample,thefluxassociatedwiththefilteringofultra-purewaterwasfoundtobehigherthanthepermeatewaterfluxassociated
FIGURE1.Purewaterflux(PWF)ofmembraneasafunctionofappliedpressure(a)UF10kDaMembrane (b) UF 5kDa Membrane (c) RO Membrane
(a) (b)
(c)
2891
withthefilteringoftheminewatersample.Thisisbecausethefiltrationofminewaterthroughthemembranesmighthave led to the formation of a deposit on the membrane outer surface which blocked the open pores, resulting in adeclineintheflux(Field2010).Thismembranefoulingphenomenon is mainly due to the combined effects of Donnan exclusion and the sieving mechanism during the filtration(Nandaetal.2010).Besides,theimmersionofthe membranes in water for long periods of time during thefiltrationmighthaveledtotheformationofagellayeron the membrane surface that further contributed to the fouling effect on the membrane. Compared to raw mine water which may result in membrane fouling, ultra-pure water does not contain any foreign substances. Although a diminished fluxwas observed for allmembrane modules in the treatment of mine water, the RO membrane was found to have the least decline. This phenomenon was attributed to the extremely small average pore size of the RO membrane, which led to less formation of pore blocking attributed by large solute particles into the membrane matrix. Additionally, solute particles deposited onmembranesurfaceswereeasilyflushedawayby the
waterfluxonthefeedside.Onlycertainsegmentsonthemembrane surface was fouled (pore blockage) by a small fraction of solute particles with a smaller size. Furthermore, the incomplete compaction of the RO membrane might be another factor that contributed to the higher permeate waterfluxinfilteringtheminewatersamplethanPWF, as the membrane pores were not fully open at the early stage ofthefiltration(Hydranautics2001). Generally,themembraneactsasaprimaryfilteringmedium before a fouling layer is formed on its surface; upon its formation, however, such a fouling layer itself becomes the primary filtering medium, resulting in significantdecreaseinwaterpermeation.
PERMEATEWATERQUALITYAFTERMEMBRANEFILTRATION PROCESS
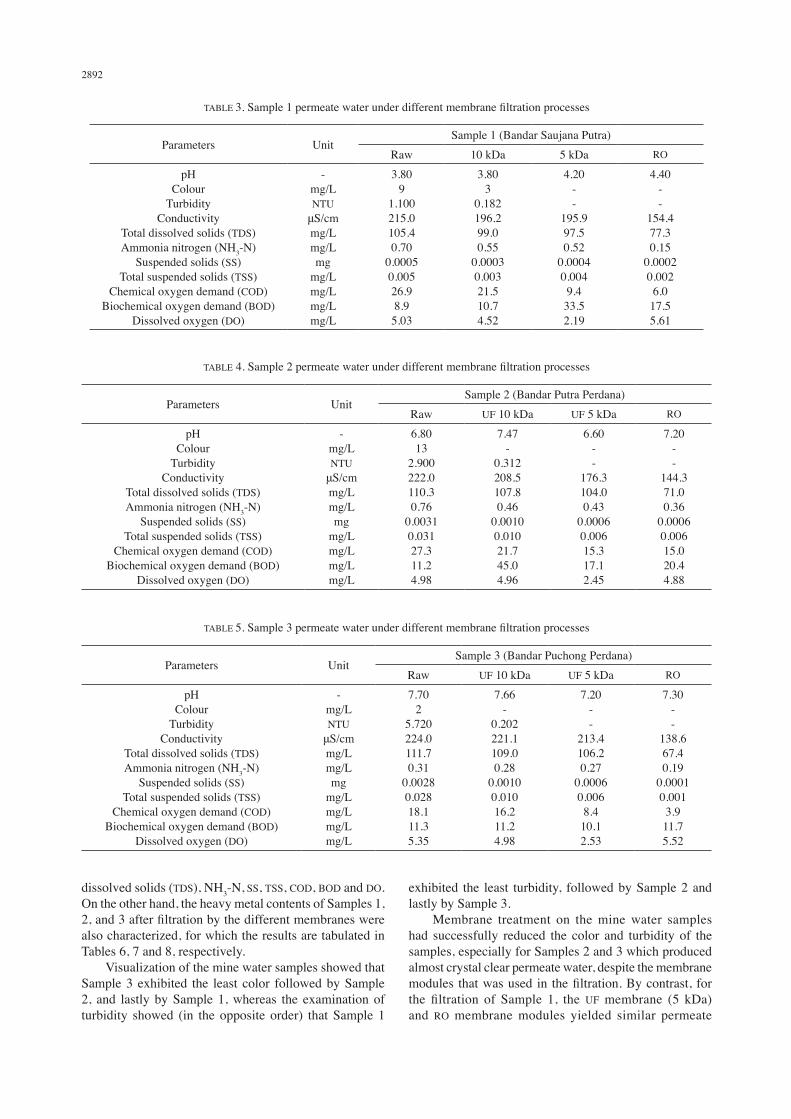
ThepermeatewaterqualityofSamples1,2and3afterfiltrationbythedifferentmembraneswerecharacterized,forwhichtheresultsaretabulatedinTables3,4and5,respectively. The parameters used in analyzing the water samples were pH, color, turbidity, conductivity, total
(a) (b)
(c)
FIGURE2.Purewaterflux(PWF)andpermeatewaterfluxinfilteringminewatersampleatdifferentappliedpressure(a)Sample1(b)Sample2(c)Sample3
2892
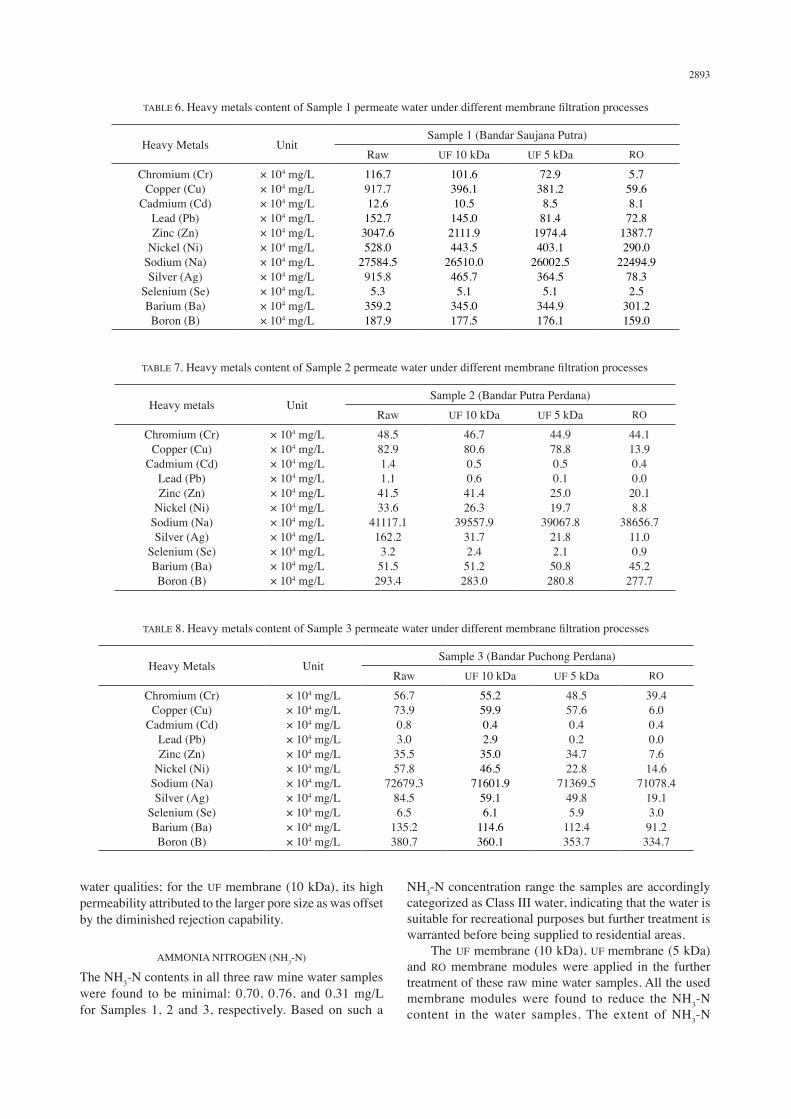
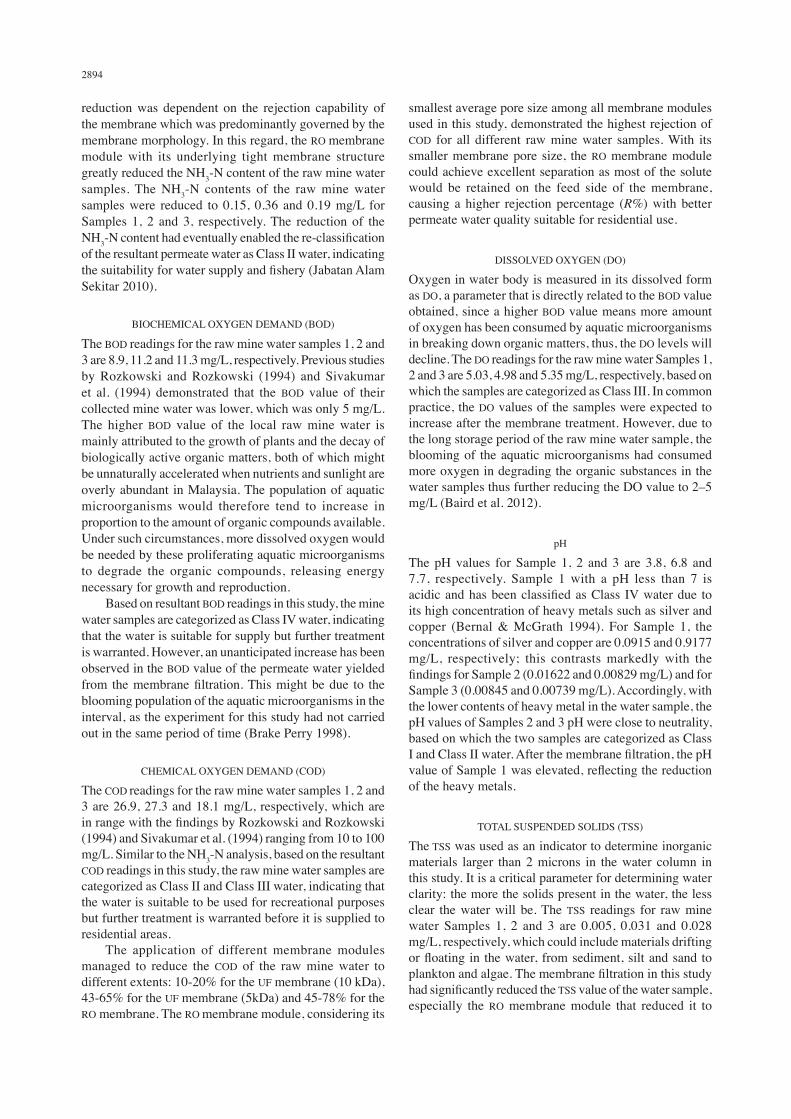
dissolved solids (TDS), NH3-N, SS, TSS, COD, BOD and DO. On the other hand, the heavy metal contents of Samples 1, 2,and3afterfiltrationbythedifferentmembraneswerealso characterized, for which the results are tabulated in Tables 6, 7 and 8, respectively. Visualization of the mine water samples showed that Sample3exhibited the least color followedbySample2, and lastly by Sample 1, whereas the examination of turbidity showed (in the opposite order) that Sample 1
exhibited the least turbidity, followed by Sample 2 and lastlybySample3. Membrane treatment on the mine water samples had successfully reduced the color and turbidity of the samples,especiallyforSamples2and3whichproducedalmost crystal clear permeate water, despite the membrane modules thatwasusedin thefiltration.Bycontrast, forthe filtration of Sample 1, theUF membrane (5 kDa) and RO membrane modules yielded similar permeate
TABLE 3.Sample1permeatewaterunderdifferentmembranefiltrationprocesses
Parameters UnitSample1(BandarSaujanaPutra)
Raw 10 kDa 5 kDa RO
pHColour
TurbidityConductivity
Total dissolved solids (TDS)Ammonia nitrogen (NH3-N)
Suspended solids (SS)Total suspended solids (TSS)
Chemical oxygen demand (COD)Biochemical oxygen demand (BOD)
Dissolved oxygen (DO)
-mg/LNTUμS/cmmg/Lmg/Lmg
mg/Lmg/Lmg/Lmg/L
3.809
1.100215.0105.40.70
0.00050.00526.98.95.03
3.803
0.182196.299.00.550.00030.00321.510.74.52
4.20--
195.997.50.52
0.00040.0049.433.52.19
4.40--
154.477.30.15
0.00020.0026.017.55.61
TABLE4.Sample2permeatewaterunderdifferentmembranefiltrationprocesses
Parameters UnitSample 2 (Bandar Putra Perdana)
Raw UF 10 kDa UF 5 kDa RO
pHColour
TurbidityConductivity
Total dissolved solids (TDS)Ammonia nitrogen (NH3-N)
Suspended solids (SS)Total suspended solids (TSS)
Chemical oxygen demand (COD)Biochemical oxygen demand (BOD)
Dissolved oxygen (DO)
-mg/LNTUμS/cmmg/Lmg/Lmg
mg/Lmg/Lmg/Lmg/L
6.8013
2.900222.0110.30.760.00310.03127.311.24.98
7.47-
0.312208.5107.80.46
0.00100.01021.745.04.96
6.60--
176.3104.00.43
0.00060.00615.317.12.45
7.20--
144.371.00.36
0.00060.00615.020.44.88
TABLE 5.Sample3permeatewaterunderdifferentmembranefiltrationprocesses
Parameters UnitSample3(BandarPuchongPerdana)
Raw UF 10 kDa UF 5 kDa RO
pHColour
TurbidityConductivity
Total dissolved solids (TDS)Ammonia nitrogen (NH3-N)
Suspended solids (SS)Total suspended solids (TSS)
Chemical oxygen demand (COD)Biochemical oxygen demand (BOD)
Dissolved oxygen (DO)
-mg/LNTUμS/cmmg/Lmg/Lmg
mg/Lmg/Lmg/Lmg/L
7.702
5.720224.0111.70.31
0.00280.02818.111.35.35
7.66-
0.202221.1109.00.28
0.00100.01016.211.24.98
7.20--
213.4106.20.27
0.00060.0068.410.12.53
7.30--
138.667.40.19
0.00010.0013.911.75.52
2893
TABLE 6.HeavymetalscontentofSample1permeatewaterunderdifferentmembranefiltrationprocesses
Heavy Metals UnitSample1(BandarSaujanaPutra)
Raw UF 10 kDa UF 5 kDa RO
Chromium (Cr)Copper (Cu)
Cadmium (Cd)Lead (Pb)Zinc (Zn)
Nickel (Ni)Sodium (Na)Silver (Ag)
Selenium (Se)Barium (Ba)Boron (B)
× 104 mg/L× 104 mg/L× 104 mg/L× 104 mg/L× 104 mg/L× 104 mg/L× 104 mg/L× 104 mg/L× 104 mg/L× 104 mg/L× 104 mg/L
116.7917.712.6152.73047.6528.0
27584.5915.85.3359.2187.9
101.6396.110.5145.02111.9443.5
26510.0465.75.1345.0177.5
72.9381.28.581.4
1974.4403.1
26002.5364.55.1344.9176.1
5.759.68.172.81387.7290.0
22494.978.32.5301.2159.0
TABLE7.HeavymetalscontentofSample2permeatewaterunderdifferentmembranefiltrationprocesses
Heavy metals UnitSample 2 (Bandar Putra Perdana)
Raw UF 10 kDa UF 5 kDa RO
Chromium (Cr)Copper (Cu)
Cadmium (Cd)Lead (Pb)Zinc (Zn)
Nickel (Ni)Sodium (Na)Silver (Ag)
Selenium (Se)Barium (Ba)Boron (B)
× 104 mg/L× 104 mg/L× 104 mg/L× 104 mg/L× 104 mg/L× 104 mg/L× 104 mg/L× 104 mg/L× 104 mg/L× 104 mg/L× 104 mg/L
48.582.91.41.141.533.6
41117.1162.23.251.5293.4
46.780.60.50.641.426.3
39557.931.72.451.2283.0
44.978.80.50.125.019.7
39067.821.82.150.8280.8
44.113.90.40.020.18.8
38656.711.00.945.2277.7
TABLE8.HeavymetalscontentofSample3permeatewaterunderdifferentmembranefiltrationprocesses
Heavy Metals UnitSample3(BandarPuchongPerdana)
Raw UF 10 kDa UF 5 kDa RO
Chromium (Cr)Copper (Cu)
Cadmium (Cd)Lead (Pb)Zinc (Zn)
Nickel (Ni)Sodium (Na)Silver (Ag)
Selenium (Se)Barium (Ba)Boron (B)
× 104 mg/L× 104 mg/L× 104 mg/L× 104 mg/L× 104 mg/L× 104 mg/L× 104 mg/L× 104 mg/L× 104 mg/L× 104 mg/L× 104 mg/L
56.773.90.83.035.557.8
72679.384.56.5135.2380.7
55.259.90.42.935.046.5
71601.959.16.1
114.6360.1
48.557.60.40.234.722.8
71369.549.85.9
112.4353.7
39.46.00.40.07.614.6
71078.419.13.091.2334.7
water qualities; for the UF membrane (10 kDa), its high permeability attributed to the larger pore size as was offset bythediminishedrejectioncapability.
AMMONIA NITROGEN (NH3-N)
The NH3-N contents in all three raw mine water samples were found to beminimal: 0.70, 0.76, and 0.31mg/Lfor Samples 1, 2 and 3, respectively.Based on such a
NH3-N concentration range the samples are accordingly categorized as Class III water, indicating that the water is suitable for recreational purposes but further treatment is warranted before being supplied to residential areas. The UF membrane (10 kDa), UF membrane (5 kDa) and RO membrane modules were applied in the further treatment of these raw mine water samples. All the used membrane modules were found to reduce the NH3-N content in the water samples. The extent of NH3-N
2894
reductionwas dependent on the rejection capability ofthe membrane which was predominantly governed by the membrane morphology. In this regard, the RO membrane module with its underlying tight membrane structure greatly reduced the NH3-N content of the raw mine water samples. The NH3-N contents of the raw mine water sampleswere reduced to 0.15, 0.36 and0.19mg/L forSamples 1, 2 and3, respectively.The reduction of theNH3-Ncontenthadeventuallyenabledthere-classificationof the resultant permeate water as Class II water, indicating thesuitabilityforwatersupplyandfishery(JabatanAlamSekitar 2010).
BIOCHEMICAL OXYGEN DEMAND (BOD)
The BOD readings for the raw mine water samples 1, 2 and 3are8.9,11.2and11.3mg/L,respectively.Previousstudiesby Rozkowski and Rozkowski (1994) and Sivakumar et al. (1994) demonstrated that the BOD value of their collected mine water was lower, which was only 5 mg/L. The higher BOD value of the local raw mine water is mainly attributed to the growth of plants and the decay of biologically active organic matters, both of which might be unnaturally accelerated when nutrients and sunlight are overly abundant in Malaysia. The population of aquatic microorganisms would therefore tend to increase in proportion to the amount of organic compounds available. Under such circumstances, more dissolved oxygen would be needed by these proliferating aquatic microorganisms to degrade the organic compounds, releasing energy necessary for growth and reproduction. Based on resultant BOD readings in this study, the mine water samples are categorized as Class IV water, indicating that the water is suitable for supply but further treatment is warranted. However, an unanticipated increase has been observed in the BOD value of the permeate water yielded from themembranefiltration.Thismightbedue to theblooming population of the aquatic microorganisms in the interval, as the experiment for this study had not carried out in the same period of time (Brake Perry 1998).
CHEMICAL OXYGEN DEMAND (COD)
The COD readings for the raw mine water samples 1, 2 and 3are26.9,27.3and18.1mg/L,respectively,whichareinrangewiththefindingsbyRozkowskiandRozkowski(1994) and Sivakumar et al. (1994) ranging from 10 to 100 mg/L. Similar to the NH3-N analysis, based on the resultant COD readings in this study, the raw mine water samples are categorized as Class II and Class III water, indicating that the water is suitable to be used for recreational purposes but further treatment is warranted before it is supplied to residential areas. The application of different membrane modules managed to reduce the COD of the raw mine water to differentextents:10-20%fortheUF membrane (10 kDa), 43-65%fortheUFmembrane(5kDa)and45-78%fortheRO membrane. The RO membrane module, considering its
smallest average pore size among all membrane modules usedinthisstudy,demonstratedthehighestrejectionofCOD for all different raw mine water samples. With its smaller membrane pore size, the RO membrane module could achieve excellent separation as most of the solute would be retained on the feed side of the membrane, causing a higher rejectionpercentage (R%) with better permeate water quality suitable for residential use.
DISSOLVED OXYGEN (DO)
Oxygen in water body is measured in its dissolved form as DO, a parameter that is directly related to the BOD value obtained, since a higher BOD value means more amount of oxygen has been consumed by aquatic microorganisms in breaking down organic matters, thus, the DO levels will decline. The DO readings for the raw mine water Samples 1, 2and3are5.03,4.98and5.35mg/L,respectively,basedonwhich the samples are categorized as Class III. In common practice, the DO values of the samples were expected to increase after the membrane treatment. However, due to the long storage period of the raw mine water sample, the blooming of the aquatic microorganisms had consumed more oxygen in degrading the organic substances in the water samples thus further reducing the DO value to 2–5 mg/L (Baird et al. 2012).
pH
ThepHvalues forSample 1, 2 and3 are 3.8, 6.8 and7.7, respectively. Sample 1 with a pH less than 7 is acidicandhasbeenclassifiedasClass IVwaterdue toits high concentration of heavy metals such as silver and copper (Bernal & McGrath 1994). For Sample 1, the concentrations of silver and copper are 0.0915 and 0.9177 mg/L, respectively; this contrasts markedly with the findingsforSample2(0.01622and0.00829mg/L)andforSample3(0.00845and0.00739mg/L).Accordingly,withthe lower contents of heavy metal in the water sample, the pHvaluesofSamples2and3pHwereclosetoneutrality,based on which the two samples are categorized as Class IandClassIIwater.Afterthemembranefiltration,thepHvalueofSample1waselevated,reflectingthereductionof the heavy metals.
TOTAL SUSPENDED SOLIDS (TSS)
The TSS was used as an indicator to determine inorganic materials larger than 2 microns in the water column in this study. It is a critical parameter for determining water clarity: the more the solids present in the water, the less clear the water will be. The TSS readings for raw mine water Samples 1, 2 and 3 are 0.005, 0.031 and 0.028mg/L, respectively, which could include materials drifting orfloatinginthewater,fromsediment,siltandsandtoplanktonandalgae.ThemembranefiltrationinthisstudyhadsignificantlyreducedtheTSS value of the water sample, especially the RO membrane module that reduced it to
2895
almost zero. Suspended solids with a particle diameter larger than the membrane pore size would often be retained on the feed side, through which only water molecules were allowed to pass.
WATERQUALITYINDEX(WQI)
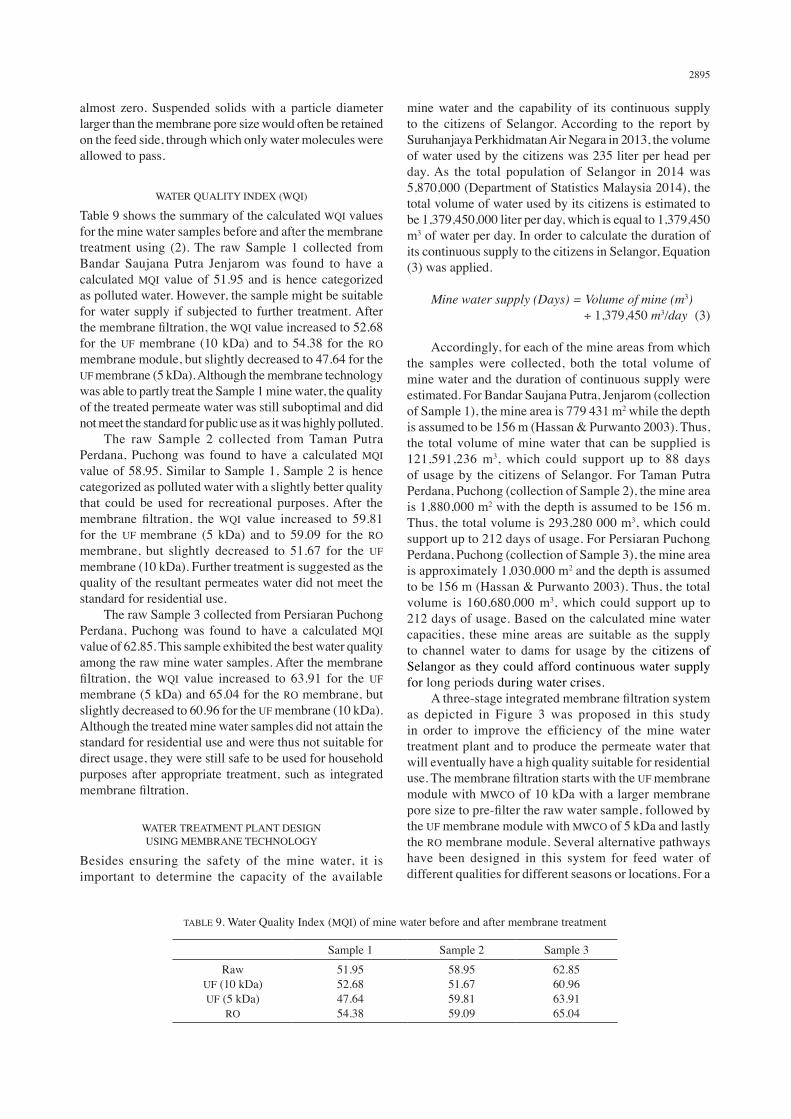
Table 9 shows the summary of the calculated WQI values for the mine water samples before and after the membrane treatment using (2). The raw Sample 1 collected from Bandar Saujana Putra Jenjaromwas found to have acalculated MQI value of 51.95 and is hence categorized as polluted water. However, the sample might be suitable forwatersupply ifsubjected tofurther treatment.Afterthemembranefiltration,theWQI value increased to 52.68 for the UFmembrane(10kDa)and to54.38for theRO membrane module, but slightly decreased to 47.64 for the UF membrane (5 kDa). Although the membrane technology was able to partly treat the Sample 1 mine water, the quality of the treated permeate water was still suboptimal and did not meet the standard for public use as it was highly polluted. The raw Sample 2 collected from Taman Putra Perdana, Puchong was found to have a calculated MQIvalue of 58.95. Similar to Sample 1, Sample 2 is hence categorized as polluted water with a slightly better quality that could be used for recreational purposes. After the membrane filtration, theWQI value increased to 59.81 for the UF membrane (5 kDa) and to 59.09 for the RO membrane, but slightly decreased to 51.67 for the UF membrane (10 kDa). Further treatment is suggested as the quality of the resultant permeates water did not meet the standard for residential use. TherawSample3collectedfromPersiaranPuchongPerdana, Puchong was found to have a calculated MQIvalue of 62.85. This sample exhibited the best water quality among the raw mine water samples. After the membrane filtration, theWQI value increased to 63.91 for theUF membrane (5 kDa) and 65.04 for the RO membrane, but slightly decreased to 60.96 for the UF membrane (10 kDa).Although the treated mine water samples did not attain the standard for residential use and were thus not suitable for direct usage, they were still safe to be used for household purposes after appropriate treatment, such as integrated membranefiltration.
WATER TREATMENT PLANT DESIGN USING MEMBRANE TECHNOLOGY
Besides ensuring the safety of the mine water, it is important to determine the capacity of the available
mine water and the capability of its continuous supply to the citizens of Selangor. According to the report by SuruhanjayaPerkhidmatanAirNegarain2013,thevolumeofwaterusedbythecitizenswas235literperheadperday. As the total population of Selangor in 2014 was 5,870,000 (Department of Statistics Malaysia 2014), the total volume of water used by its citizens is estimated to be1,379,450,000literperday,whichisequalto1,379,450m3 of water per day. In order to calculate the duration of its continuous supply to the citizens in Selangor, Equation (3)wasapplied.
Mine water supply (Days) = Volume of mine (m3) ÷1,379,450 m3/day (3)
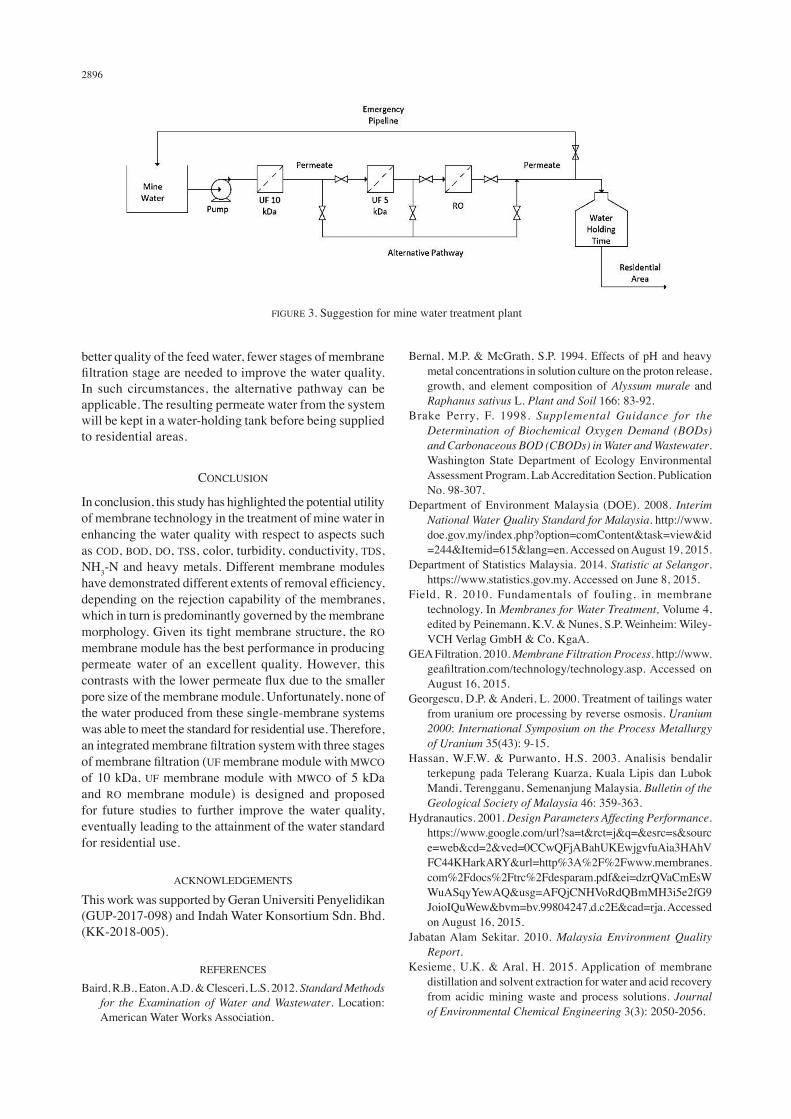
Accordingly, for each of the mine areas from which the samples were collected, both the total volume of mine water and the duration of continuous supply were estimated.ForBandarSaujanaPutra,Jenjarom(collectionofSample1),themineareais779431m2 while the depth isassumedtobe156m(Hassan&Purwanto2003).Thus,the total volume of mine water that can be supplied is 121,591,236m3, which could support up to 88 days of usage by the citizens of Selangor. For Taman Putra Perdana, Puchong (collection of Sample 2), the mine area is 1,880,000 m2 with the depth is assumed to be 156 m. Thus,thetotalvolumeis293,280000m3, which could support up to 212 days of usage. For Persiaran Puchong Perdana,Puchong(collectionofSample3),themineareaisapproximately1,030,000m2 and the depth is assumed tobe156m(Hassan&Purwanto2003).Thus,thetotalvolume is 160,680,000 m3, which could support up to 212 days of usage. Based on the calculated mine water capacities, these mine areas are suitable as the supply to channel water to dams for usage by the citizens of Selangor as they could afford continuous water supply for long periods during water crises. Athree-stageintegratedmembranefiltrationsystemas depicted in Figure 3 was proposed in this studyin order to improve the efficiency of theminewatertreatment plant and to produce the permeate water that will eventually have a high quality suitable for residential use.ThemembranefiltrationstartswiththeUF membrane module with MWCO of 10 kDa with a larger membrane poresizetopre-filtertherawwatersample,followedbythe UF membrane module with MWCO of 5 kDa and lastly the RO membrane module. Several alternative pathways have been designed in this system for feed water of different qualities for different seasons or locations. For a
TABLE9.WaterQualityIndex(MQI) of mine water before and after membrane treatment
Sample 1 Sample 2 Sample3Raw
UF (10 kDa)UF (5 kDa)
RO
51.9552.6847.6454.38
58.9551.6759.8159.09
62.8560.9663.9165.04
2896
better quality of the feed water, fewer stages of membrane filtrationstageareneededtoimprovethewaterquality.In such circumstances, the alternative pathway can be applicable. The resulting permeate water from the system will be kept in a water-holding tank before being supplied to residential areas.
CONCLUSION
In conclusion, this study has highlighted the potential utility of membrane technology in the treatment of mine water in enhancing the water quality with respect to aspects such as COD, BOD, DO, TSS, color, turbidity, conductivity, TDS, NH3-N and heavy metals. Different membrane modules havedemonstrateddifferentextentsofremovalefficiency,dependingontherejectioncapabilityofthemembranes,which in turn is predominantly governed by the membrane morphology. Given its tight membrane structure, the RO membrane module has the best performance in producing permeate water of an excellent quality. However, this contrastswiththelowerpermeatefluxduetothesmallerpore size of the membrane module. Unfortunately, none of the water produced from these single-membrane systems was able to meet the standard for residential use. Therefore, anintegratedmembranefiltrationsystemwiththreestagesofmembranefiltration(UF membrane module with MWCO of 10 kDa, UF membrane module with MWCO of 5 kDa and RO membrane module) is designed and proposed for future studies to further improve the water quality, eventually leading to the attainment of the water standard for residential use.
ACKNOWLEDGEMENTS
This work was supported by Geran Universiti Penyelidikan (GUP-2017-098) and Indah Water Konsortium Sdn. Bhd. (KK-2018-005).
REFERENCES
Baird, R.B., Eaton, A.D. & Clesceri, L.S. 2012. Standard Methods for the Examination of Water and Wastewater. Location: American Water Works Association.
Bernal, M.P. & McGrath, S.P. 1994. Effects of pH and heavy metal concentrations in solution culture on the proton release, growth, and element composition of Alyssum murale and Raphanus sativus L. Plant and Soil166:83-92.
Brake Perry, F. 1998. Supplemental Guidance for the Determination of Biochemical Oxygen Demand (BODs) and Carbonaceous BOD (CBODs) in Water and Wastewater. Washington State Department of Ecology Environmental Assessment Program. Lab Accreditation Section. Publication No.98-307.
Department of Environment Malaysia (DOE). 2008. Interim National Water Quality Standard for Malaysia. http://www.doe.gov.my/index.php?option=comContent&task=view&id=244&Itemid=615&lang=en. Accessed on August 19, 2015.
Department of Statistics Malaysia. 2014. Statistic at Selangor. https://www.statistics.gov.my. Accessed on June 8, 2015.
Field, R. 2010. Fundamentals of fouling, in membrane technology. In Membranes for Water Treatment, Volume 4, edited by Peinemann, K.V. & Nunes, S.P. Weinheim: Wiley-VCH Verlag GmbH & Co. KgaA.
GEA Filtration. 2010. Membrane Filtration Process. http://www.geafiltration.com/technology/technology.asp.Accessed on August 16, 2015.
Georgescu, D.P. & Anderi, L. 2000. Treatment of tailings water from uranium ore processing by reverse osmosis. Uranium 2000: International Symposium on the Process Metallurgy of Uranium35(43):9-15.
Hassan,W.F.W.& Purwanto,H.S. 2003.Analisis bendalirterkepung pada Telerang Kuarza, Kuala Lipis dan Lubok Mandi,Terengganu,SemenanjungMalaysia.Bulletin of the Geological Society of Malaysia46:359-363.
Hydranautics. 2001. Design Parameters Affecting Performance. https://www.google.com/url?sa=t&rct=j&q=&esrc=s&source=web&cd=2&ved=0CCwQFjABahUKEwjgvfuAia3HAhVFC44KHarkARY&url=http%3A%2F%2Fwww.membranes.com%2Fdocs%2Ftrc%2Fdesparam.pdf&ei=dzrQVaCmEsWWuASqyYewAQ&usg=AFQjCNHVoRdQBmMH3i5e2fG9JoioIQuWew&bvm=bv.99804247,d.c2E&cad=rja.Accessedon August 16, 2015.
Jabatan Alam Sekitar. 2010. Malaysia Environment Quality Report.
Kesieme, U.K. & Aral, H. 2015. Application of membrane distillation and solvent extraction for water and acid recovery from acidic mining waste and process solutions. Journal of Environmental Chemical Engineering3(3):2050-2056.
FIGURE3.Suggestionforminewatertreatmentplant
2897
Mullett,M.,Fornarelli,R.&Ralph,D.2014.Nanofiltrationofmine water: Impact of feed pH and membrane charge on resource recovery and water discharge. Membranes 4(2): 163-180.
Nanda, D., Tung, K.L., Li, Y.L., Lin, N.J. & Chuang, C.J. 2010. Effect of pH on membrane morphology, fouling potential, andfiltrationperformanceofnanofiltrationmembrane forwater softening. Journal of Membrane Science349:411-420.
Rozkowski, A. & Rozkowski, J. 1994. Impact of mine waters on river water quality in the upper Silesian Coal Basin. 5th International Mine Water Congress, Nottingham (U.K.). pp. 811- 821.
Sivakumar, M., Morton, S.G.S. & Singh, R.N. 1994. Case history analysis of mine water pollution in New South Wales, Australia. 5th International Mine Water Congress, Nottingham (U.K.).pp.823-834.
SuruhanjayaPerkhidmatanAirNegara.2013.Jumlah Penggunaan Air (2009-2010). http://www.span.gov.my.html. Accessed on 5 May 2015.
Wilmoth, R.C., Baugh, T.L. & Decker, D.W. 1978. Removal of selected trace elements from acid mine drainage using existing technology. 33rd Industrial Waste Conference. pp. 886-894.
Teow Yeit Haan*, Abdul Wahab Mohammad & MohdShaifulSajabResearch Centre for Sustainable Process Technology (CESPRO)Faculty of Engineering and Built EnvironmentUniversiti Kebangsaan Malaysia43600 UKM Bangi, Selangor Darul EhsanMalaysia
Teow Yeit Haan*, Abdul Wahab Mohammad, Syazaman Ramli, MohdShaifulSajab&NooriniIzzatiMohamadMazukiChemical Engineering ProgrammeFaculty of Engineering and Built Environment Universiti Kebangsaan Malaysia43600UKM Bangi, Selangor Darul EhsanMalaysia
*Corresponding author; email: [email protected]
Received: 22 May 2018Accepted: 22 July 2018