pertanika j. soc. sci. hum. 13(1): 23-38(2005) issn: 0128-7702...
TRANSCRIPT
Pertanika J. Soc. Sci. & Hum. 13(1): 23-38 (2005) ISSN: 0128-7702© Universiti Putra Malaysia Press
Non-linear Dependence in the Malaysian Stock Market
'IKJAN-PI G LIM, 2MUZAFAR SHAH HABIBULlAH & IHOCK-AN LEEI Labuan School of International Business and Finance
Universiti Malaysia SabahP.o. Box 80594
87015 F. T. Labuan, Malaysia2Department of Economics
Faculty of Economics and ManagementUniversiti Putra Malaysia
43400 UPM Serdang, Selangor, Malaysia
ABSTRAK.
Kajian ini mengkaji secara empirik kewujudan ketidaklinearan dalam pasaran saham Malaysiadengan mengaplikasikan ujian Brock-Dechert-Scheinkman (BDS) dan bispektrum Hinich. Hasilkeputusan BDS menunjukkan bahawa ciri siri pulangan di pasaran saham Malaysia didorong olehmekanisme ketidaklinearan. Aplikasi seterusnya dengan menggunakan ujian bispektrum Hinichjuga menyokong hasil ujian BDS. Hasil keputusan kajian ini memberi implikasi kuat terhadapkerja penyelidikan yang melibatkan pasaran saham Malaysia kerana kewujudan ketidaklinearanmenyarankan bahawa penggunaan kaedah linear adalah tidak sesuai untuk membuat inferens.
ABSTRACf
This study empirically investigates the presence of non-linearity in the Malaysian stock market,employing the Brock-Dechert-Scheinkman (BDS) and Hinich bispectrum tests. The BDS resultsreveal that the characteristics of the returns series in the Malaysian stock market are driven by non-linear mechanisms. Subsequent application of the Hinich bispectrum test confirms the results ofthe BDS test. The result of the present study has strong implications on the empirical workinvolving the Malaysian stock market as the existence of non-linearity suggests the inappropriatenessof using linear methods for drawing inferences.
Keywords: Non-linearity, BDS test, Hinich bispectrum test, stock market, Malaysia
INTRODUCTION
It is an accepted fact that financial economicshas been dominated over the past few decadesby linear paradigm, with linear models beingwidely employed in the time series analysis offinancial data. However, with the developmentand adaptation of more sophisticated econometrictechniques, this assumption of linearity, whichhas been made as an approximation of the realworld, is now found to be inappropriate.
Specifically, the adequacy of conventional linearmodels has been challenged in recent years withabundant evidence emerging in the literature tosuggest non-linearityl is a universal phenomenon,at least for time series data of stock prices. Thisgrowing body of research covers stock marketsof the .S. (Hinich and Patterson 1985;Scheinkman and LeBaron 1989; Hsieh 1991),U.K (Abhyankar et aL 1995; Opong et al. 1999),Germany (Kosfeld and Robe 2001), G-7 countries
* Correspondence author: Kian-Ping LimE-mail: [email protected] the literature, there is no generally agreed definition for 'non-linearity'. Following Ammermann and Patterson(2003: 177), any time sel"ies model that cannot be written in the form of a linear ARMA or ARlMA model, i.e., anytype of model that exhibits some form of serial dependency other than simple correlation or autocorrelation, is, bydefinition, a non-linear model.
Kian-Ping Lim, Muzafar Shah Habibullah & Hock-Ann Lee
(Sarantis 2001), Turkey (Antoniou et aL 1997),Greece (Barkoulas and Travlos 1998; Panas2001), eleven Mrican markets (Joe and Menyah2003), and random sample of world stockmarkets (De Gooijer 1989; Ammermann andPatterson 2003). The above stylized fact of stockreturns is hardly surprising as Antoniou et aL(1997) and Sarantis (2001) listed several possiblefactors that might induce significant non-linearityin stock markets. Among them are difficulties inexecuting arbitrage transactions, marketimperfections, irrational investors' behaviour,diversity in agents' beliefs, and heterogeneity ininvestors' objectives. However, from our surveyon the literature of the Malaysian stock market,it was found that the issue of non-linearity didnot receive much attention from researchers intheir empirical work. This was a shock findingsince the first evidence of non-linearity in stockreturns was reported by Hinich and Patterson(1985) 20 years back. It could be that Malaysianresearchers were not aware of the profoundimplications resulting from the existence of nonlinearity on their empirical analysis or little testinghas been done due to lack of computer codes toimplement the tests (Patterson and Ashley 2000:1). These two possibilities motivate the writingof the present paper.
IMPliCATIONS OF NON-UNEARITY
To raise the awareness of Malaysian researchers,this paper provides a brief discussion on theimplications of non-linearity on empirical analysis.Generally, testing for non-linearity can be viewedas a general test of model adequacy for linearmodels (Hinich and Patterson 1989). In thisregard, the existence of non-linearity calls intoquestion the adequacy of linear models, andhence invites the development of non-linear timeseries models. On the theoretical front, there hasbeen an emergence of non-linear models overthe past two decades to capture the complexfeatures of fmancial time series and subsequentlyprovide more superior forecasts than their linearcounterparts or the naive random walk. Thegrowth in this area is indeed phenomenal withliterally unlimited numbers of non-linear modelsbeing documented in extant literature. Thosethat have generated much attention fromresearchers include the Generalized AutoregressiveConditional Heteroskedasticity (GARCH) models(for recent survey, refer to Engle 2002; Li et al.2002) and Smooth Transition Autoregressive
(STAR) models (a survey of recent developmentsis provided by van Dijk et aL 2002).
On the empirical front, the existence ofnon-linearity casts doubt on the robustness ofempirical results and statistical inferences drawnfrom linear methods. In this regard, severalstudies have demonstrated the weaknesses ofthose popular time series tests that areconstructed on the basis of linear autoregressivemodels, such as the stationarity tests, the causalityand cointegration tests, under those circumstanceswhen the underlying generating process is nonlinear in nature. Sarno (2000), Kapetanois et al.(2003) and Liew et aL (2004) illustrated that theadoption of linear stationarity tests areinappropriate in detecting mean reversion if thetrue data-generating process is in fact a stationarynon-linear process. The empirical findings ofSarantis (2001) highlighted the risk of drawingwrong inferences on causal relationships whennon-linearity is ignored and non-eausality testsbased on linear models are employed. The MonteCarlo simulation evidence in Bierens (1997)indicated that the standard linear cointegrationframework presents a mis-specification problemwhen the true nature of the adjustment processis non-linear and the speed of adjustment varieswith the magnitude of the disequilibrium. Allthe aforementioned studies highlight the factthat it is imperative to test for non-linearity todetermine the nature of the underlying seriesbefore deciding on the appropriate empiricalmethods. If non-linearity prevails, then non-linearmethods should be employed in subsequentempirical analysis. To date, progress in this areahas been encouraging, with more advancedstatistical tools being developed such as the nonlinear stationarity tests (Sarno 2001; Chortareaset al. 2002; Kapetanios et aL 2003), non-linearcausality tests (Baek and Brock 1992; Brooks andHinich 1999; Skalin and Terasvirta 1999), nonparametric cointegration tests (Bierens 1997;Breitung 2002) and non-linear cointegration test(Kapetanios 2003). However, existing studiesinvolving the Malaysian stock market have yet toadopt the above research framework.
In the literature on the Malaysian stockmarket, one of the most active research areasfocuses on the investigation of her informationalefficiency in terms of weak-form. Browsingthrough prior work reveals that the empiricalevidence is inconclusive. On the one hand, moststudies reported the market is weak-form
24 PertanikaJ. Soc. Sci. & Hum. Vol. 13 o. 1 2005
Non-linear Dependence in the Malaysian Stock Market
efficient, for instance, Barnes (1986), Laurence(1986), Saw and Tan (1989), Annuar et al. (1991,1993), Kok and Lee (1994) and Kok and Goh(1995). On the other hand, empirical evidenceof inefficiency cannot be suppressed, which isdocumented in Yong (1989, 1993). Another recentstudy by Lai et al. (2003) using the variance ratiotest also reveals the non-randomness of successiveprice changes in Bursa Malaysia. Though theempirical results on the Malaysian stock marketare mixed, one notable similarity of all the aforementioned studies is the application of standardstatistical tests- serial correlation test, runs test,variance ratio test and unit root tests, to uncoverlinear serial dependencies or autocorrelation inthe data. However, the lack of linear dependenciesdoes not imply that the series are random asthere might be other more complex forms ofdependencies which cannot be detected by thesestandard methodologies. A possible hiddenpattern that went undetected in earlier studies isthat of the non-linear dependency structure.Even the influential paper of Fama (1970: 394)acknowledged this possibility, "Moreover, zerocovariances are consistent with a fair game model,but as noted earlier, there are other types ofnonlinear dependence that imply the existenceof profitable trading systems, and yet do notimply nonzero serial covariances."
The prevalence of non-linearity in stockmarkets has at least two important implicationson the weak-form efficient market hypothesis(EMH). Firstly, the existence of non-linearityimplies the potential of predictability in stockreturns (Antoniou et aL 1997; Patterson and Ashley2000). In this regard, the empirical work ofAndrada-Felix et at. (2003) has demonstratedthe profitability of non-linear trading rules.Furthermore, in testing the primary hypothesisthat graphical technical analysis methods maybe equivalent to non-linear forecasting methods,Clyde and Osler (1997) found that technicalanalysis works better on nonlinear data than onrandom data, and the use of technical analysiscan generate higher profits than a random trading
strategy if the data generating process is nonlinear. This finding of non-linear predictablepatterns would certainly be at odds with theweak-form EMH, which postulates that even nonlinear combinations of previous prices are notuseful predictors of future prices (Brooks 1996;Brooks and Hinich 1999; McMillan and Speight2001). Secondly, those conventional linearstatistical tests based on autocorrelationcoefficients and runs tests are not capable ofcapturing non-linearity, as they are designed touncover linear patterns in the data. Specifically,if the returns generating process is non-linearand a linear model is used to test for efficiency,then the hypothesis of no predictability may bewrongly accepted (De Gooijer 1989; Hsieh 1989;Antoniou et at. 1997;Joe and Menyah 2003; Liewet at. 2003). It is possible then that thosefavourable evidences of efficiency in the Malaysianstock market are the outcome of using linearmodels in markets characterized by inherent nonlinearity, and hence the findings should be metwith a dose of scepticism. Given the profoundimplications of non-linearity on model adequacyand its subsequent statistical inferences in variousaspects of financial applications2, the present studyattempts to document the existence of nonlinearity in the Malaysian stock market.
EMPIRICAL TESTS FOR NON-UNEARITY
In the literature, there is a wide variety of testsdesigned to detect non-linearitY, each developedto serve as diagnostic test procedure to identifythe presence of varying forms of nonlinearstructure which are undetected by conventionaltime series techniques. Barnett and Serletis(2000) highlighted that none of the tests fornon-linearity completely dominates the others.This is supported by the Monte Carloexperiments conducted by Ashley et at. (1986),Ashley and Patterson (1989), Hsieh (1991), Liuet aL (1992), Lee et at. (1993), Brock et al.(1996), Barnett et al. (1997) and Ashley andPatterson (2001). In this case, the available nonlinearity tests can be utilized in a complementary
2 Besides the empirical work on market linkages and weak-form efficiency discussed earlier, the implications of nonlinearity on other financial applications are no lesser. For instance, pricing derivative securities such as options andfutures with martingale methods may not be appropriate. Statistical inferences concerning asset pricing modelsbased on standard testing procedures may no longer be valid. On the theoretical level, it invites the developmentof non-linear pricing models to account for non-linear behaviour.
! Barnett and Serletis (2000) and Patterson and Ashley (2000) provided a review of those non-linearity tests that arewidely employed in the literature.
PertanikaJ. Soc. Sci. & Hum. Vol. 13 o. 1 2005 25
Kian-Ping Lim, Muzafar Shah Habibullah & Hock-Ann Lee
way, rather than competing. Several studies haveadvocated that the application of a battery ofnon-linearity tests in a sequential way can providedeeper insight into the nature of non-lineargenerating mechanism of a time series (see, forexample, Barnett et aL 1995, 1997; Barnett andSerletis 2000; Ashley and Patterson 2001).
Among those existing tests for non-linearity,the most popular one is the Brock-DechertScheinkman (BDS) test developed by Brock etat. (1987). This test has been extensivelyemployed by researchers for the detection ofnon-linearity in financial time series data (see,for example, Hsieh 1989, 1991; Scheinkman andLeBaron 1989; De Grauwe et aL 1993; Steurer1995; Brooks 1996; Al-Loughani and Chappell1997; Mahajan and Wagner 1999; Opong et al.1999; Serletis and Shintani 2003). Though thesampling distribution of the BDS test statistic isnot known, either in finite samples orasymptotically, under the null of non-linearity, itis possible to use the BDS test to produce a testof linearity against the broad alternative of nonlinearity. In particular, after the linear structurehas been removed by fitting the best possiblelinear model, the BDS test can then be used totest the residuals for remaining non-lineardependence. The issue that needs to beaddressed is whether such a method of linearfiltering will change either the asymptotic or thefinite sample distribution of the BDS test statistic.Brock (1987) proved that using residuals inlinear models instead of raw data does not alterthe asymptotic distribution of the BDS teststatistic. The simulations results in Hsieh (1991)provided further support. In practice, to removethe linear structure in the data, the class ofARIMA or Box:Jenkins models can be used to fita linear model to a time series. According toBarnett et aL (1995: 304), filtering out all possiblelinear possibilities with certainty is difficult, butnevertheless pre-filtering by ARIMA fit is oftenviewed as a reputable means of pre-whitening.However, for simplicity, the AR(P) model hasbeen widely used in the literature for filteringlinear dependence from time series data priorto testing for non-linearity (see, for example,Hsieh 1989, 1991; Steurer 1995; Brooks 1996;Barkoulas and Travlos 1998; Opong et al. 1999;Mahajan and Wagner 1999). Brooks (1996: 309)
justified the use of this simplified autoregressiveprocedure, arguing that the process of logdifferencing has already removed the unit rootin the series, and since any moving average modelcan also be represented by an infinite orderautoregression, the class of possible linearspecifications is restricted to those of anautoregressive form. Though applying the BDStest to the residuals of a filtered data will givestrong support for the conclusion of nonlinearity'\ it conveys very little information as towhat kind of non-linear process that generatedthe data. This is because the BDS test has greatpower against vast class of non-linear processes(Hsieh 1991; Barnett et aL 1997; Ashley andPatterson 2001). With high power against such avast class of alternatives, the BDS test can onlybe used as a "non-linearity screening test". Infact, this is the limitation of previous studies thatonly provide evidence of non-linearity, assumingat the outset that the non-linearity takes aparticular form.
Another popular non-linear test is the Hinichbispectrum test (Hinich 1982), which involvesestimating the bispectrum of the observed timeseries (for empirical applications, see, forexample, De Grauwe et al. 1993; Abhyankar et aL1995; Brooks 1996; Vilasuso and Cunningham1996; Ammermann and Patterson 2003; Lim etat. 2003a). Unlike the BDS test, the Hinichbispectrum test provides a direct test for a nonlinear generating mechanism, irrespective of anylinear serial dependencies that might be present.Thus, pre-whitening is not necessary in usingthe Hinich approach. Even if pre-whitening isdone anyway, the adequacy of the pre-whiteningis irrelevant to the validity of the test. Ashley etal. (1986) presented an equivalence theorem toprove that the Hinich linearity test statistic isinvariant to linear filtering of the data, even ifthe filter is estimated. Thus, the linearity testcan be applied to the original returns series, orto the residuals of a linear model with no loss ofpower. In terms of implementation, thebispectrum test produces a test statistic havingknown asymptotic sampling distribution underthe respective null hypotheses of linearity andGaussianity. However, the alternative hypothesisis not as broad as that for the BDS test. With thebispectrum test, the alternative hypothesis is all
26
Rejection of the null of 'independent and identical distribution' (i.i.d.) indicates the presence of non-linearity (sincelinear dependence has been filtered out), while the non-rejection implies no evidence of non-linearity.
PertanikaJ. Soc. Sci. & Hum. Vol. 13 o. 12005
on-linear Dependence in the Malaysian Stock Market
non-linear processes having non-flat bispectrum.In other words, the bispectrum test has no poweragainst those forms of non-linearity that displayflat bispectrum and non-flat higher orderpolyspectra (Barnett et aL 1997). Thus, thisapproach appears to have limitations when thedata fails to reject the null of linearity. Failure ofrejection does not imply the acceptance oflinearity for it might be due to some non-linearprocesses against which the bispectrum test haslow power. Thus, a further test is needed in thiscase to determine the presence of non-linearity.
To overcome the above-mentionedlimitations, both the BDS and Hinich bispectrumtest can be used in a complementary, ratherthan competing way. Moreover, the applicationof both the BDS and Hinich bispectrum tests ina sequential way can provide a deeper insightinto the types of non-linear processes (Barnett etaL 1995, 1997; Barnett and Serletis 2000; Ashleyand Patterson 2001). In this study, the differingpower of the BDS and Hinich bispectrum testsin detecting GARCH-type models is utilized asan alternative framework for determining theadequacy of GARCH models for the datagenerating process of the series under study.Specifically, the low power of the Hinichbispectrum test relative to the BDS test for theGARCH-type models suggests that the bispectrumtest is useful as a marker for these GARCHmodels. This is supported by the Monte Carloexperiments conducted by Barnett et aL (1997)in which the bispectrum test wrongly acceptslinearity for data simulated from the ARCH andGARCH models. The fact that the Hinichbipsectrum test has low power against ARCHand GARCH is well acknowledged in theliterature (see, for example, Hsieh 1989; Brooks1996).
In addition to the modest contribution ofdetecting non-linearity in the Malaysian stockmarket as mentioned earlier, the present studyillustrates the applications of two popular nonlinearity tests, that is, the BDS and Hinichbispectrum tests. The lack of computer codesshould not be a cause of concern for researcherssince they are made available by the developersin their respective web page. For the BDS test,the code written for DOS-based computers was
first provided by W.D. Dechert in his web pages.Later, B. LeBaron shared the source code in theC programming language6, and provided a briefdescription of the BDS algorithms in LeBaron(1997). In a recen t developmen t, the BDS testhas been incorporated in the statistical packageof EViews, starting from version 4.0. Thebispectrum test, on the other hand, is availablefrom the personal web page of MJ. Hinich7•
The application of both the BDS andbispectrum tests not only provides empiricalevidence of non-linearity, but serves as analternative framework for determining theadequacy of GARCH-type models in characterizingthe underlying data-generating process for theseries under study. This issue is of greatimportance to the field of finance in view of thewide applications of GARCH models inunderstanding the relationship between risk andexpected returns, particularly in the areas ofasset pricing, portfolio selection and riskmanagement. In the existing literature, the nonrejection by the BDS test on the standardizedresiduals of a GARCH model has been taken asevidence that the GARCH model 'fits' the data(see, for example, Hsieh 1989, 1991; Krager andKugler 1993; Abhyankar et aL 1995; Opong et al.1999; McMillan and Speight 2001; Caporale etaL 2005). Another popular framework to examinethe validity of specifying a GARCH error structureis the Hinich portmanteau bicorrelation test(see, for example, Hinich and Patterson 1995;Brooks and Hinich 1998; Brooks et al. 2000; Limet aL 2003b).
In following sections, the paper reviews somemajor development in the Malaysian stockmarket, describes the data and procedures. Theresults are then summarized and used to drawconclusions and implications.
THE MAlAYSIAN STOCK MARKET
In Malaysia, the Kuala Lumpur Stock Exchange(KLSE) is the only body approved by the Ministryof Finance, under the provisions of the SecuritiesIndustry Act, 1983, as the stock exchange in thecountry. The KLSE is a self-regulatory organizationwith its own memorandum and articles ofassociation, as well as rules which govern theconduct of its members in securities dealings.
The URL is http://dechcrt.econ.uh.edu/'6 The URL for B. LeBaron's web page is http://people.l7randeis.edu/-blebaron/.7 The URL is http://www.gov. utexas.edu/hinich.
PertanikaJ. Soc. Sci. & Hum. Vol. 13 o. 12005 27
Kian-Ping Lim, Muzafar Shah Habibullah & Hock-Ann Lee
The KLSE is also responsible for the surveillanceof the market place, and for the enforcement ofits listing requirements which spell out thecriteria for listing, disclosure requirements andstandards to be maintained by listed companies.
Although the history of KLSE can be tracedto the 1930s, public trading of shares in Malaysiaonly began in 1960 when the Malayan StockExchange (MSE) was formed. When theFederation of Malaysia was formed in 1963, withSingapore as a component state, the MSE wasrenamed the Stock Exchange of Malaysia (SEM).With the secession of Singapore from theFederation of Malaysia in 1965, the commonstock exchange continued to function but as theStock Exchange ofMalaysia and Singapore (SEMS).
The year 1973 was a major turning point inthe development of the local securities industry,for it saw the split of SEMS into The KualaLumpur Stock Exchange Berhad (KLSEB) andthe Stock Exchange of Singapore (SES). Thesplit was opportune in view of the termination ofthe currency interchangeability arrangementsbetween Malaysia and Singapore. Although theKLSEB and SES were deemed to be separateexchanges, all the companies previously listedon the SEMS continued to be listed on bothexchanges.
When the Securities Industry Act 1973 wasbrought into force in 1976, a new companycalled the Kuala Lumpur Stock Exchange (KLSE)took over the operations of KLSEB as the stockexchange in Malaysia, to provide a central marketplace for buyers and sellers to transact businessin shares, bonds and various other securities ofMalaysian listed companies. On 1 January 1990,following the decision on the "final split" of theKLSE and SES, all Singapore-incorporatedcompanies were delisted from the KLSE and viceversa for Malaysian companies listed on the SES.
The year 2004 represents another majormilestone in the development of the Malaysiansecurities industry with the demutualisation ofKLSE. The demutualisation process took placewith the passing of the Demutualisation Bill bythe Dewan Rakyat on 11 September 2003, togetherwith other related amendments to the securitieslaw. This was followed by the passing of the Billby the Dewan egara on 5 ovember 2003. Asa result of the exercise, KLSE ceases to be a nonprofit entity limited by the guarantee of itsmembers, and becomes a public company limitedby shares. On 20 April 2004, KLSE was officially
renamed Bursa Malaysia, and there is noabbreviation or translation for its usage since itis a brand name for the exchange.
The KLSE computes an index for each ofthe main sectors traded on the bourse- industrial,finance, property, tin and plantation sectorsand the second board. However, the most widelyfollowed, by far, is the Kuala Lumpur CompositeIndex (KLCI). The KLCI was introduced in1986 after it was found that there was a need fora stock market index which would serve as amore accurate indicator of the performance ofthe Malaysian stock market and the economy. Atthat time, there was effectively no index whichrepresented the entire market. The KLCI satisfiesstringent guidelines and was arrived at only afterrigorous screening of the component companiesthat were eventually selected to compose theindex. In 1995, the number of componentcompanies was increased to 100 and will be limitedto this number although the actual componentcompanies may change from time to time. TheKLCI is constructed by using the value weightedaverage method, where the weight used is theprice of the stock multiplied by the number ofordinary shares outstanding.
METHODOLOGYIn this paper, the BDS test, as the first run test,is applied to the residuals of a pre-fIltered linearmodel. If the null of 'independent and identicaldistribution' (i.i.d.) cannot be rejected, there islittle point in continuing, since the BDS testprovides strong evidence against the presence ofnon-linearity. If the null is instead rejected, theHinich bispectrum test can then be used topermit the class of relevant non-linearity to benarrowed. In particular, the Hinich bispectrumtest is useful as a marker for the GARCH-typemodels. Since linearity has been ruled out bythe BDS test, the non-rejection of the null by theHinich bispectrum test might be due to thepresence of non-linear processes which theHinich test has low power against, specificallythe GARCH-type models (Hsieh 1989; Brooks1996; Barnett et al. 1997). On the other hand,rejection of the null hypothesis by the Hinichbispectrum test provides evidence against theadequacy of GARCH-type models for the seriesunder study. In other words, the series are morelikely being generated by a non-linear processthat is of a form in addition to, or instead ofGARCH-type.
28 PertanikaJ. Soc. Sci. & Hum. Vol. 13 No.1 2005
Non-linear Dependence in the Malaysian Stock Market
The Data
In this study, we utilize the daily closing valuesof the Kuala Lumpur Composite Index (KLCI)obtained from the Daily Diary at Bursa Malaysiafor the sample period of2/1/90 to 31/10/200l.
The price series obtained from the databaseare used to compute a set of continuouslycompounded percentage returns for the KLCI,using the relationship:
(1)
where P, is the closing price of the stock on dayt, and p.
1the rate on the previous trading day.
One possible justification for using returnsrather than raw data is that the raw data is likelyto be non-stationary. Stationarity is a pre-requisitefor both the BDS and Hinich bispectrum tests.Hsieh (1991) pointed out that non-stationarityin the data series can cause a rejection of thenull hypothesis of independent and identicaldistribution (i.i.d.) on the basis of the BDS test.On the other hand, non-stationarity may cause aspurious rejection of the null of linearity in thebispectrum test (Hinich and Patterson 1985).
Brock-Dechert-Scheinkman (BDS) Test
Brock, Dechert and Scheinkman (Brock et aL1987) developed a statistical test and the BDSstatistic. The original BDS paper took the conceptof the correlation integral8 and transformed itinto a formal test statistic which is asymptoticallydistributed as a normal variable under the nullhypothesis of independent and identicallydistributed (i.i.d.) against an unspecifiedalternative. In principle, no distributionalassumption on the underlying data generatingprocess is needed in using the BDS test as a teststatistic for i.i.d. random variables. Though theestimation is non-parametric, the test statistic isasymptotically distributed as a standard normalvariable, with zero mean and unit variance.Hence, the significance of the test statistic isreadily determined from standard normal tables.A revision of this original paper has been donein Brock et aL (1996).
The BDS test is based on the correlationintegral as the test statistic. Given a sample ofi.i.d. observations, {x,: t = 1, 2, ... , nJ, Brock et aL(1987, 1996) showed that:
(2)
has a limiting standard normal distribution,where W.,)£) is the BDS statistic. n is the samplesize, m is the embedding dimension, and themetric bound, e, is the maximum differencebetween pairs of observations counted incomputing the correlation integral. T (£)measures the difference between the dispe;;ionof the observed data series in a number ofspaces with the dispersion that an i.i.d. processwould generate in these same spaces, that isCm)£) -C1.n(e)m. Tm)e) has an asymptotic normaldistribution with zero mean and variance Vi (£).9
This BDS test has an intuitive explan;tion.The correlation integral C
m)£) is an estimate of
the probability that the distance between anytwo mrhistories, x/m= (x" X'+l' ••• , xl+m) and x,m =
(x" X,.l' ..••.. , X,.m) of the series {x/lis less than e,that is, Cm)e) ~ prob{lx'+i - X'+ik e, for all i = 0,1, mr1}, as n ~ 00.
If the series {x,} are independent, then, for
m-l
It-sl>m, e.)£:) ~ Ilprob{lx,+i-xS+il<e}, as n ~ 00.
i=O
Furthermore, if the series {x,} are also identicallydistributed, then Cm..<e)~ C
1(e) m, as n ~ 00. The
BDS statistic therefore tests the null hypothesisthat Cm)e) = C})e)m, which is the null hypothesisof i.i.d. 1O
The need to choose the values of e and mcan be a complication in using the BDS test. Fora given m, e cannot be too small because C (£)
....n
will capture too few points. On the other hand,£ cannot be too large because C....n(e) will capturetoo many points. For this reason, we adopt theapproach used by advocates of this test. Inparticular, we set e as a proportion of standarddeviation of the data, CJ. Hsieh and LeBaron
8 In Grassberger and Procaccia (1983), the correlation integral was introduced as a measure of the frequency withwhich temporal patterns are repeated in the data. For example, the correlation integral C(e) measures the fractionof pairs of points of a time series {x,) that are within a distance of e from each other.V.(e) can be estimated consistently by V...(e). For details, refer to Brock et aL (1987, 1996).
10 The null of i.i.d. implies that C...(e) = C/.•(e)· but the converse is not true.
PertanikaJ. Soc. Sci. & Hum. Vol. 13 No.1 2005 29
Kian-Ping Lim, Muzafar Shah Habibullah & Hock-Ann Lee
r=--s=-
F(}~ k) = X(f) X(h) X* v;..) 1 N (4)
If a square has points outside the principaldomain, those points are not included in theaverage.i3,oalf.,,fJ is a consistent and asymptoticallycomplex normal estimator of the bispectrumB=(I;, h) in Equation (3) if the sequence (1m' I,,)converges to (1;, h)·
(5)F(j,k)
nM-l
LmM-l
Li3 (f f) M-2xxxV"" I n
i=(m-l)M k=(n-l)M
where X(f) = L~l XI exp (-i2n ict) and *denotes the complex conjugate.
A consistent estimator of the bispectrum isformed by averaging the F(j, k) in a square of Mpoints whose centers are defined by the lattice L= {(2mrl)M/2, (2c-l)M/2: m = 1, .... , c and m $.
NI2M - cl2 + 314} in the principal domain. Forsquares that lie completely inside the principledomain, a consistent estimator of the bispectrumis:
assuming that IC=(r, s)1 is summable. Thesymmetries of C=(r, s) translate into symmetriesof B"",,(I;, h) that yield a principal domain forthe bispectrum, which is the triangular set Q =
{(I;,J;): 0 < ~ < 1/2, h <~, 2J; +h < I}.The use of the bispectrum has an intuitive
explanation. If {x,l is linear and Gaussian, thebispectrum is flat at zero over all frequencies (1;,h) E Q. However, if {x,! is linear but not Gaussian,then the bispectrum is non-zero, and is insteada constant independent of frequency. Hence, ifthe bispectrum is non-eonstant and a functionoffrequency, then a non-linear process is implied.In this regard, Brillinger (1965) proved that oncea consistent estimator of the bispectrum iscalculated, linearity and Gaussianity tests can beperformed.
Instead of estimating the bispectrurn as givenin Equation (3), Hinich (1982) provided anequivalent approach that yields a consistentestimator of the bispectrum. Suppose we have asample of N observations: {xo' XI' •.• xN). Letfc =clN for c = 0, 1, , N - 1. For each pair ofintegers j and k, define:
(1988a, b) have performed a number of MonteCarlo simulation tests regarding the size of theBDS statistics under the null of i.i.d. and thealternative hypotheses. The Monte Carlo evidenceshowed that the 'best' choice of e is between0.50 and 1.50 times the standard deviation.
On the other hand, at our chosen setting ofe, we produce the BDS test statistics, W.je) forall settings of embedding dimensions from 2 to5. Though most researchers computed the BDSstatistics for embedding dimensions varying from2 to 10 (see, for example, Hsieh 1989; De Grauweet al. 1993; Brooks 1996; Mahajan and Wagner1999; Opong et al. 1999), it is important to takenote that the small samples properties of BDStest degrade as one increases the embeddingdimension. Specifically the Monte Carlo simulations in Brock et al. (1991) demonstrated thatas the dimension goes beyond 5, the smallsamples properties of BDS degrade, mainly dueto the reduction of non-overlapping observationsas m grows. Thus, only BDS test statistics forembedding dimensions of 2 to 5 are given muchconsideration in this study.
Hinich Bispectrum Test
Hinich (1982) laid out a statistical test fordetermining whether an observed stationary timeseries {x,} is linear. It is possible that {x,} is linearwithout being Gaussian, but all of the stationaryGaussian time series are linear. The Hinich(1982) test involves estimating the bispectrum ofthe observed time series to test for the nullhypothesis of Gaussianity and linearity.
In this section, we provide a brief descriptionof the testing procedures presented by Hinich(1982). Let {x,} denote a third order stationarytime series, where the time unit t is an integer.The third-order cumulant function of {x,l in thetime domain is defined to be C=(r, s) = E[x,.,x,.,x,] for each (r, s) when E[x,] = 0, in which s $. rand r = 0, 1, 2, ...
Since third-order cumulants are hard tointerpret, and their estimates are even harder tofathom, the bispectrum in the frequency domainis calculated, which is the double Fouriertransform of the third-order cumulant (orbicovariance) function.
The bispectrum at frequency pair (1;, h),denoted as B=(I;, h), is the double Fouriertransform of C=(r, s):
30 PertanikaJ. Soc. Sci. & Hum. Vol. 13 No.1 2005
on-linear Dependence in the Malaysian Stock Market
s=-oo
where gu = (2u-1)M /2N for each integer u.
The ((.) in Equation (6) are estimates of theregular power spectrum, which is the Fouriertransform of the second-order moment (orautocovariance) and is a function of only onefrequency. The power spectrum of {x,} atfrequency g is given by:
(8)
RESULTS AND ANALYSIS
Descriptive Statistics
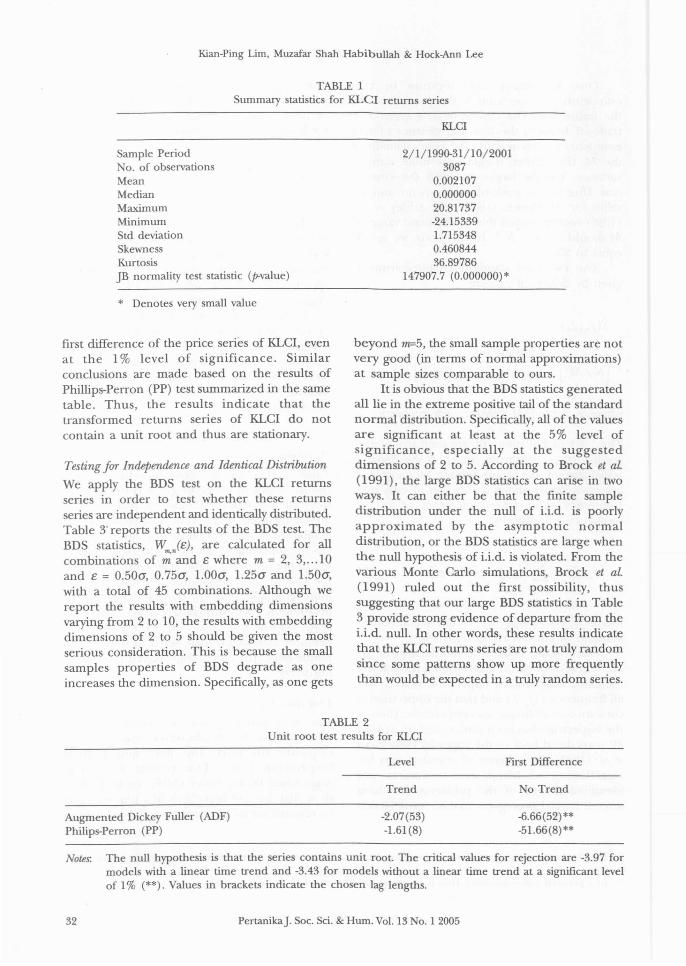
Table 1 provides summary statIstIcs for thereturns series in order to get a better view ofsome of the important statistical features. Themeans are quite small. The KLCI returns seriesexhibit some degree of positive or right-skewness.On the other hand, the distributions of returnsfor all the series are highly leptokurtic, in whichthe tails of its distribution taper down to zeromore gradually than do the tails of a normaldistribution. Not surprisingly, given the nonzero skewness levels and excess kurtosisdemonstrated within these series of returns, theJarque-Bera UB) test strongly rejects the null ofnormality.
m n
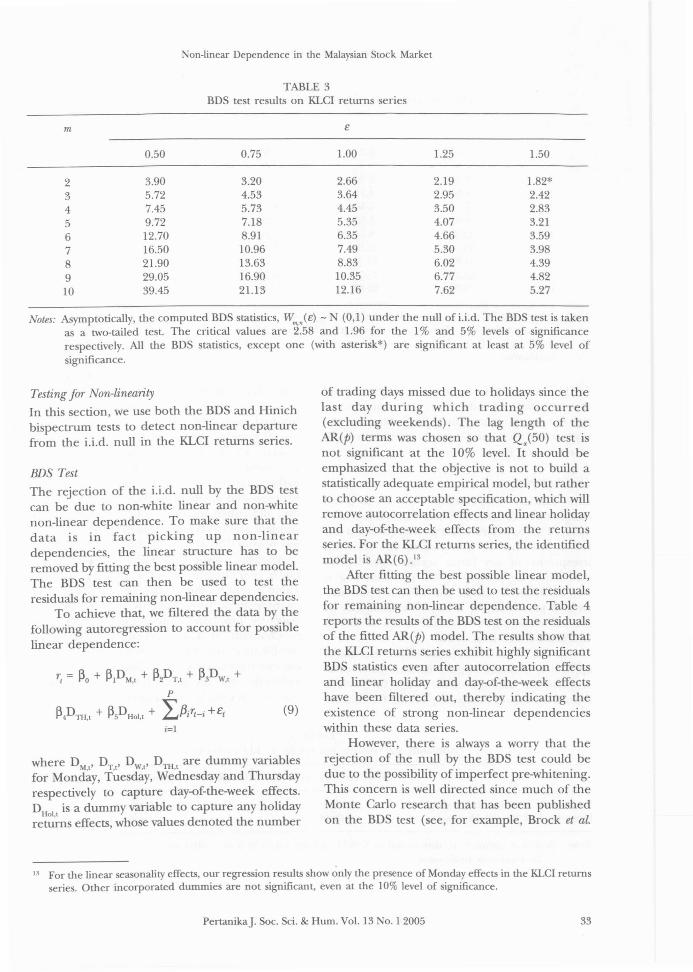
Unit Root Tests
One area that deserves our attention is thestationarity of the returns series, which is a prerequisite for both the BDS and Hinichbispectrum tests. The results from theAugmented Dickey Fuller (ADF) test in Table 2show that the null hypothesis of a unit root canbe rejected for KLCI returns series, which is the
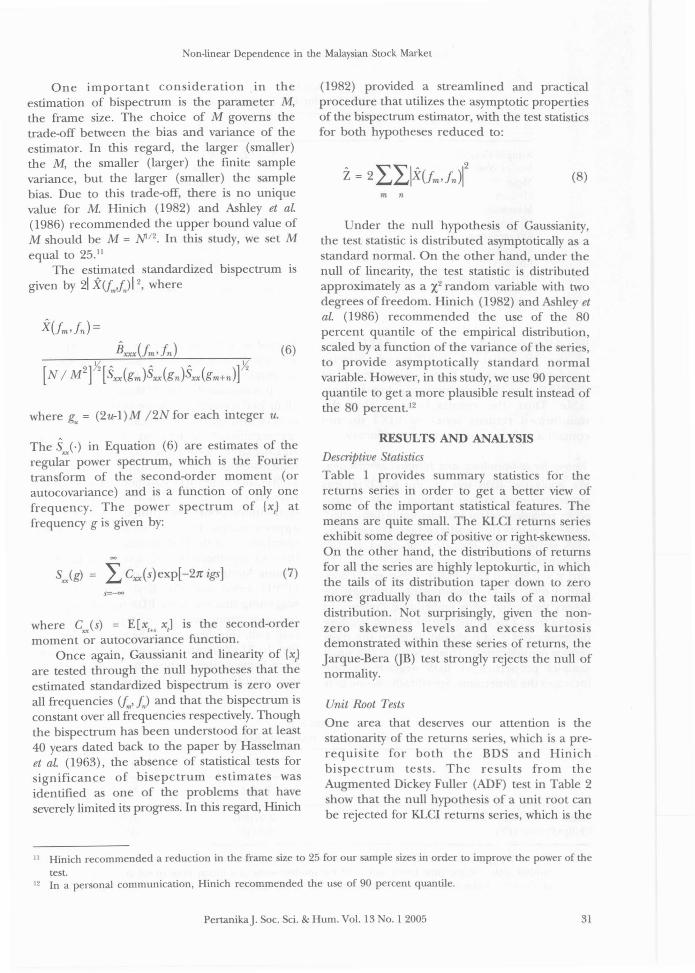
Under the null hypothesis of Gaussianity,the test statistic is distributed asymptotically as astandard normal. On the other hand, under thenull of linearity, the test statistic is distributedapproximately as a X2 random variable with twodegrees of freedom. Hinich (1982) and Ashley etai. (1986) recommended the use of the 80percent quantile of the empirical distribution,scaled by a function of the variance of the series,to provide asymptotically standard normalvariable. However, in this study, we use 90 percentquantile to get a more plausible result instead ofthe 80 percent. 12
(1982) provided a streamlined and practicalprocedure that utilizes the asymptotic propertiesof the bispectrum estimator, with the test statisticsfor both hypotheses reduced to:
(7)
where Cu(s) = E[x,+! x,] is the second-ordermoment or autocovariance function.
Once again, Gaussianit and linearity of {x,}are tested through the null hypotheses that theestimated standardized bispectrum is zero overall frequencies (fm'!') and that the bispectrum isconstant over all frequencies respectively. Thoughthe bispectrum has been understood for at least40 years dated back to the paper by Hasselmanet aL (1963), the absence of statistical tests forsignificance of bisepctrum estimates wasidentified as one of the problems that haveseverely limited its progress. In this regard, Hinich
One important consideration in theestimation of bispectrum is the parameter M,the frame size. The choice of M governs thetrade-off between the bias and variance of theestimator. In this regard, the larger (smaller)the M, the smaller (larger) the finite samplevariance, but the larger (smaller) the samplebias. Due to this trade-off, there is no uniquevalue for M. Hinich (1982) and Ashley et ai.(1986) recommended the upper bound value ofM should be M = N'/2. In this study, we set Mequal to 25. 11
The estimated standardized bispectrum isgiven by 21 X(f,J) 12, where
11 Hinich recommended a reduction in the frame size to 25 for our sample sizes in order to improve the power of the
test.I' In a personal communication, Hinich recommended the use of 90 percent quantile.
PertanikaJ. Soc. Sci. & Hum. Vol. 13 0.1 2005 31
Kian-Ping Lim, Muzafar Shah Habibullah & Hock-Ann Lee
TABLE 1Summary statistics for KLeI returns series
KLCI
Sample Periodo. of observations
MeanMedianMaximumMinimumStd deviationSkewnessKurtosisJB normality test statistic (p-value)
* Denotes very small value
first difference of the price series of KLCI, evenat the 1% level of significance. Similarconclusions are made based on the results ofPhillips-Perron (PP) test summarized in the sametable. Thus, the results indicate that thetransformed returns series of KLCI do notcontain a unit root and thus are stationary.
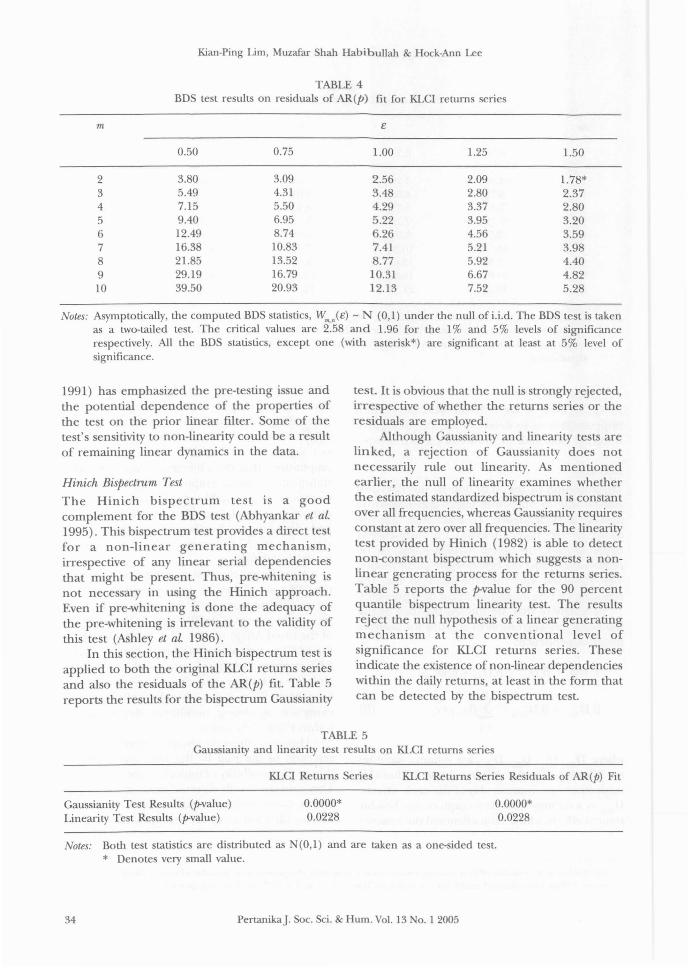
Testing for Independence and Identical Distrilmtion
We apply the BDS test on the KLCI returnsseries in order to test whether these returnsseries are independent and identically distributed.Table 3· reports the results of the BDS test. TheBDS statistics, w,.,.(e), are calculated for allcombinations of m and e where m = 2, 3, ... 10and e = 0.500", 0.750", 1.000", 1.250" and 1.500",with a total of 45 combinations. Although wereport the results with embedding dimensionsvarying from 2 to 10, the results with embeddingdimensions of 2 to 5 should be given the mostserious consideration. This is because the smallsamples properties of BDS degrade as oneincreases the dimension. Specifically, as one gets
2/1/199~31/10/2001
30870.0021070.00000020.81737-24.153391.7153480.46084436.89786
147907.7 (0.000000)*
beyond m=5, the small sample properties are notvery good (in terms of normal approximations)at sample sizes comparable to ours.
It is obvious that the BDS statistics generatedall lie in the extreme positive tail of the standardnormal distribution. Specifically, all of the valuesare significant at least at the 5% level ofsignificance, especially at the suggesteddimensions of 2 to 5. According to Brock et aL(1991), the large BDS statistics can arise in twoways. It can either be that the finite sampledistribution under the null of i.i.d. is poorlyapproximated by the asymptotic normaldistribution, or the BDS statistics are large whenthe null hypothesis of Li.d. is violated. From thevarious Monte Carlo simulations, Brock et aL(1991) ruled out the first possibility, thussuggesting that our large BDS statistics in Table3 provide strong evidence of departure from thei.i.d. null. In other words, these results indicatethat the KLCI returns series are not truly randomsince some patterns show up more frequentlythan would be expected in a truly random series.
Augmented Dickey Fuller (ADF)Philips-Perron (PP)
TABLE 2Unit root test results for KLCI
Level
Trend
-2.07(53)-1.61 (8)
First Difference
No Trend
-6.66(52)**-51.66(8)**
Notes: The null hypothesis is that the series contains unit root. The critical values for rejection are -3.97 formodels with a linear time trend and -3.43 for models without a linear time trend at a significant levelof 1% (**). Values in brackets indicate the chosen lag lengths.
32 PertanikaJ. Soc. Sci. & Hum. Vol. 13 No.1 2005
Non-linear Dependence in the Malaysian Stock Market
TABLE 3BDS test results on KLCI returns series
m e
0.50 0.75 1.00 1.25 1.50
2 3.90 3.20 2.66 2.19 1.82*3 5.72 4.53 3.64 2.95 2.424 7.45 5.73 4.45 3.50 2.835 9.72 7.18 5.35 4.07 3.216 12.70 8.91 6.35 4.66 3.597 16.50 10.96 7.49 5.30 3.988 21.90 13.63 8.83 6.02 4.399 29.05 16.90 10.35 6.77 4.8210 39.45 21.13 12.16 7.62 5.27
Notes: Asymptotically, the computed BDS statistics, W.,)e) - N (0,1) under the null of i.i.d. The BDS test is takenas a two-tailed test. The critical values are 2.58 and 1.96 for the 1% and 5% levels of significancerespectively. All the BDS statistics, except one (with asterisk*) are significant at least at 5% level ofsignificance.
Testing for Non-linearity
In this section, we use both the BDS and HinichbispectIum tests to detect non-linear departurefrom the i.i.d. null in the KLCI returns series.
BDS TestThe rejection of the i.i.d. null by the BDS testcan be due to non-white linear and non-whitenon-linear dependence. To make sure that thedata is in fact picking up non-lineardependencies, the linear structure has to beremoved by fitting the best possible linear model.The BDS test can then be used to test theresiduals for remaining non-linear dependencies.
To achieve that, we filtered the data by thefollowing autoregression to account for possiblelinear dependence:
r, = ~o + ~PM,t + ~2DT,t + ~3DW,t +P
~PTH" + ~PH01,t + L.Bi1i-i +£/ (9)i=1
where DM,t' DT,t' DW,t' DTH,t are dummy variablesfor Monday, Tuesday, Wednesday and Thursdayrespectively to capture day-of-the-week effects.DHo1,t is a dummy variable to capture any holidayreturns effects, whose values denoted the number
of trading days missed due to holidays since thelast day during which trading occurred(excluding weekends). The lag length of theAR(P) terms was chosen so that Q,(50) test isnot significant at the 10% level. It should beemphasized that the objective is not to build astatistically adequate empirical model, but ratherto choose an acceptable specification, which willremove autocorrelation effects and linear holidayand day-of-the-week effects from the returnsseries. For the KLCI returns series, the identifiedmodel is AR(6).13
Mter fitting the best possible linear model,the BDS test can then be used to test the residualsfor remaining non-linear dependence. Table 4reports the results of the BDS test on the residualsof the fitted AR(P) model. The results show thatthe KLCI returns series exhibit highly significantBDS statistics even after autocorrelation effectsand linear holiday and day-of-the-week effectshave been filtered out, thereby indicating theexistence of strong non-linear dependencieswithin these data series.
However, there is always a worry that therejection of the null by the BDS test could bedue to the possibility of imperfect pre-whitening.This concern is well directed since much of theMonte Carlo research that has been publishedon the BDS test (see, for example, Brock et aL
" For the linear seasonality effects, our regression results show ~nly the presence of Monday effects in the KLCI returnsseries. Other incorporated dummies are not significant, even at the 10% level of significance.
PertanikaJ. Soc. Sci. & Hum. Vol. 13 No.1 2005 33
Kian-Ping Lim, Muzafar Shah Habibullah & Hock-Ann Lee
TABLE 4BDS test results on residuals of AR(P) fit for KLCI returns series
m e
0.50 0.75 1.00 1.25 1.50
2 3.80 3.09 2.56 2.09 1.78*3 5.49 4.31 3.48 2.80 2.374 7.15 5.50 4.29 3.37 2.805 9.40 6.95 5.22 3.95 3.206 12.49 8.74 6.26 4.56 3.597 16.38 10.83 7.41 5.21 3.988 21.85 13.52 8.77 5.92 4.409 29.19 16.79 10.31 6.67 4.8210 39.50 20.93 12.13 7.52 5.28
Notes: Asymptotically, the computed BDS statistics, Wm)e) - N (0,1) under the null of i.i.d. The BDS test is takenas a two-tailed test. The critical values are 2.58 and 1.96 for the 1% and 5% levels of significancerespectively. All the BDS statistics, except one (with asterisk*) are significant at least at 5% level ofsignificance.
1991) has emphasized the pre-testing issue andthe potential dependence of the properties ofthe test on the prior linear filter. Some of thetest's sensitivity to non-linearity could be a resultof remaining linear dynamics in the data.
Hinich Bispectrum Test
The Hinich bispectrum test is a goodcomplement for the BDS test (Abhyankar et aL1995). This bispectrum test provides a direct testfor a non-linear generating mechanism,irrespective of any linear serial dependenciesthat might be present. Thus, pre-whitening isnot necessary in using the Hinich approach.Even if pre-whitening is done the adequacy ofthe pre-whitening is irrelevant to the validity ofthis test (Ashley et aL 1986).
In this section, the Hinich bispectrum test isapplied to both the original KLCI returns seriesand also the residuals of the AR(P) fit. Table 5reports the results for the bispectrum Gaussianity
test. It is obvious that the null is strongly rejected,irrespective of whether the returns series or theresiduals are employed.
Although Gaussianity and linearity tests arelinked, a rejection of Gaussianity does notnecessarily rule out linearity. As mentionedearlier, the null of linearity examines whetherthe estimated standardized bispectrum is constantover all frequencies, whereas Gaussianity requiresconstant at zero over all frequencies. The linearitytest provided by Hinich (1982) is able to detectnon-eonstant bispectrum which suggests a nonlinear generating process for the returns series.Table 5 reports the p.value for the 90 percentquantile bispectrum linearity test. The resultsreject the null hypothesis of a linear generatingmechanism at the conventional level ofsignificance for KLCI returns series. Theseindicate the existence of non-linear dependencieswithin the daily returns, at least in the form thatcan be detected by the bispectrum test.
TABLE 5Gaussianity and linearity test results on KLCI returns series
Gaussianity Test Results (P.value)Linearity Test Results (p.value)
KLCI Returns Series
0.0000*0.0228
KLCI Returns Series Residuals of AR(P) Fit
0.0000*0.0228
Notes: Both test statistics are distributed as N(O,I) and are taken as a one-sided test.* Denotes very small value.
34 PertanikaJ. Soc. Sci. & Hum. Vol. 13 No.1 2005
Non-linear Dependence in the Malaysian Stock Market
CONCLUDING REMARKS
The outcomes of our econometric investigationsupport the presence of non-linearity in the datagenerating process of KLCI returns series. In thefirst run test, the BDS results reveal that there isin fact a non-linear mechanism that drives thereturns series under investigation. Subsequentapplication of the Hinich bispectrum testconfirms the results of the earlier BDS test. It isimportant to note that the rejection of the nullof linearity in the bispectrum test is a strongsupport for the presence of non-linearity (Barnettet at. 1997). Moreover, the Hinich bispectrumtest is able to provide a direct test for a nonlinear generating mechanism, irrespective of anylinear serial dependencies that might be present.Consequently, when this test rejects the null,one need not worry about the possibility that thelinear pre-whitening model has failed to removeall linear serial dependence in the data (Ashleyand Patterson 2001). This has helped us to castaway our worries that the rejection of the null inthe BDS test could be due to the possibility ofimperfect pre-whitening.
These bispectrum test results, however, doyield additional information beyond merelyconfirming the results of the earlier BDS test.Since the bispectrum test has relatively low poweragainst GARCH-type models (Hsieh 1989; Brooks1996; Barnett et aL 1997), the results not onlysuggest the inadequacy of linear models for theunderlying KLCI returns series, but providefurther insight into the types of non-linearprocess, or at least determine the adequacy ofthe GARCH models that are widely employed inthe financial world. In particular, the findingsreveal that the returns series are more likelybeing generated by a process that is of a form inaddition to, or instead of GARCH-type.Furthermore, the present study has strongimplications on the empirical work involving theMalaysian stock market as the existence of nonlinearity highlights the risk of drawing wronginferences from linear methods.
ACKNOWLEDGEMENTS
The authors would like to thank two anonymousreferees of the journal for constructive commentsthat greatly improve the final version of thepaper. The authors are grateful to B. LeBaronfor sharing his BDS C-Source code in the web.The generosity of MJ. Hinich in sharing hiscomputer codes and some helpful comments in
conducting this study is highly appreciated. Theusual disclaimer applies to any remaining errorsor omissions.
REFERENCES
ABHYANKAR, A.H., L.S. COPElAND and W. WONG. 1995.onlinear dynamics in real-time equity market
indices: evidence from the United Kingdom.Economic Journal 105: 864-880.
AL-LOUGHANl, . and D. CHAPPELL. 1997. On thevalidity of the weak-form efficient marketshypothesis applied to the London stockexchange. Applied Financial Economics 7: 173176.
AMMERMANN, P.A. and D.M. PATTERSON. 2003. Thecross-sectional and cross-temporal universalityof nonlinear serial dependencies: evidencefrom world stock indices and the Taiwan StockExchange. Pacific-Basin FinanceJournal 11: 175195.
ANDRADA-FELIX, J., F. FERNADEZ-RoDRlGUEZ, M.D.GARCIA-ARTlLES and S. SOSVIUA-RrvERO. 2003. Anempirical evaluation of non-linear trading rules.Studies in Nonlinear Dynamics and Econometrics7(3): Article 4.
AR, M.., M. ARIFF and M. SHAMSHER. 1991.Technical analysis, unit root and weak-formefficiency of the KLSE. Banker'sJournal Malaysia64 (April): 55-58.
ANNUAR, M. ., M. AJuFF and M. SHAMSHER. 1993.Weak-form efficiency of the Kuala LumpurStock Exchange: an application of unit rootanalysis. Pertanika Journal of Social Sciences andHumanities 1: 57-62.
ANTONIOU, A., N. ERGUL and P. HOLMES. 1997. Marketefficiency, thin trading and non-linearbehaviour: evidence from an emerging market.European Financial Management 3(2): 175-190.
AsHLEY, R.A. and D.M. PATTERSON. 1989. Linearversus nonlinear macroeconomies: a statisticaltest. International Economic Review 30(3): 685704.
AsHLEY, R.A. and D.M. PATTERSON. 2001. onlinearmodel specification/diagnostics: insights froma battery of nonlinearity tests. Working PaperE99-05. Department of Economics, VirginiaPolytechnic Institute and State University.
AsHLEY, R.A., D.M. PATTERSO and MJ. HINICH. 1986.A diagnostic test for nonlinear serial dependencein time series fitting errors. Journal of TimeSeries Analysis 7(3): 165-178.
PertanikaJ. Soc. Sci. & Hum. Vol. 13 o. 1 2005 35
Kian-Ping Lim, Muzafar Shah Habibullah & Hock-Ann Lee
BAEK, E. and W. BROCK. 1992. A general test fornon-linear Granger causality: bivariate model.Working Paper. Iowa State University andUniversity of Wisconsin at Madison.
BARKOULAS, J. and . TRAVLOs. 1998. Chaos in anemerging capital market? The case of theAthens Stock Exchange. Applied FinancialEconomics 8: 231-243.
BARNES, P. 1986. Thin trading and stock marketefficiency: the case of the Kuala Lumpur StockExchange. Journal of Banking Finance andAccounting 13: 609-617.
BARNETT, W.A., A.R. GALLANT, MJ. HINICH, J.JUNGEIl.GES, D. KAPLAN and MJ. JENSEN. 1995.Robustness of nonlinearity and chaos tests tomeasurement error, inference method, andsample size. Journal of Economic Behavior andOrganization 27: 301-320.
BARNETT, W.A., A.R. GALLANT, MJ. HI ICH, J.JUNGEILGES, D. KAPLAN and MJ. JENSEN. 1997. Asingle-blind controlled competition among testsfor nonlinearity and chaos. Journal ofEconometrics82: 157-192.
BARNETT, WA and A. SERLETIS. 2000. Martingales,nonlinearity, and chaos. Journal of EconomicDynamics and Control 24: 703-724.
BIERE s, HJ. 1997. onparametric cointegrationanalysis. Journal of Econometrics 77: 379-404.
BREIT G, J. 2002. onparametric tests for unitroots and cointegration. Journal ofEconometrics108: 343-363.
BRILUNGER, D. 1965. An introduction to polyspectrurn.Annals of Mathematical Statistics 36: 1351-1374.
BROCK, W.A. 1987. Notes on nuisance parameterproblems in BDS type tests for lID. WorkingPaper. University of Wisconsin at Madison.
BROCK, W.A., W.D. DECHERT and J.A. SCHEINKMAN.1987. A test for independence based on thecorrelation dimension. Working Paper.University of Wisconsin at Madison, Universityof Houston, and University of Chicago.
BROCK, WA, W.D. DECHERT,J.A. SCHEINKMAN and B.LEBARo . 1996. A test for independence basedon the correlation dimension. EconometricReviews 15: 197-235.
BROCK, WA, DA HSIEH and B. LEBARo . 1991.Nonlinear Dynamics, Chaos, and Instability:Statistical Theory and Economic Evidence.Cambridge: MIT Press.
BROOKS, C. 1996. Testing for non-linearity in dailysterling exchange rates. Applied FinancialEconomics 6: 307-317.
BROOKS, C. and M.J. HI ICH. 1998. Episodicnonstationarity in exchange rates. AppliedEconomics Letters 5: 719-722.
BROOKS, C. and MJ. HOOCH. 1999. Cross-eorrelationsand cross-bicorrelations in Sterling exchangerates. Journal ofEmpirical Finance 6(4): 385-404.
BROOKS, C., MJ. HOOCH and R. MOLYNEUX. 2000.Episodic nonlinear event detection: politicalepochs in exchange rates. In Political Complexity:Political Epochs in Exchange Rates, ed. D. Richards,p.83-98. University of Michigan Press.
CAPORALE, G.M., C. NTANTAMIS, T. PANTELIDIS and N.PITTIS. 2005. The BDS test as a test for theadequacy of a GARCH(l,l) specification: aMonte Carlo study. Journal of FinancialEconometrics 3(2): 282-309.
CHORTAREAS, G.E., G. KAPETANIOS and Y.C. SHIN.2002. on-linear mean reversion in realexchange rates. Economic Letters 77: 411-417.
Cum, W.C. and C.L. OSLER. 1997. Charting: chaostheory in disguise? Journal ofFutures Markets 17:489-514.
DE GoOIJER, J.G. 1989. Testing non-linearities inworld stock market prices. Economics Letters 31:31-35.
DE GRAUWE, P., H. DEWACHTER and M. EMBRJ:.cHTs.1993. Exchange Rate Theory: Chaotic Models ofForeign Exchange Markets. Oxford: Blackwell.
ENGLE, R.F. 2002. New frontiers for ARCH models.Journal of Applied Econometrics 17: 425-446.
FAMA, E.F. 1970. Efficient capital markets: a reviewof theory and empirical work. Journal ofFinance25: 383-417.
GRASSBERGER, P. and I. PROCACCIA. 1983. Measuringthe strangeness of strange attractors. Physica9D: 189-208.
HAssELMAN, K, W. Mu Kand G. MAcDONALD. 1963.Bispectra of ocean waves. In Time Series Analysis,ed. M. Rosenblatt, p.125-139. ew York: JohnWiley.
HI lCH, MJ. 1982. Testing for gaussianity andlinearity of a stationary time series. Journal ofTime Series Analysis 3: 169-176.
HINICH, MJ. and D.M. PATTERSO . 1985. Evidence ofnonlinearity in daily stock returns. Journal ofBusiness and Economic Statistics 3(1): 69-77.
36 PertanikaJ. Soc. Sci. & Hum. Vol. 13 No.1 2005
on-linear Dependence in the Malaysian Stock Market
HINICH, MJ. and D.M. PATIERSON. 1989. Evidence ofnonlinearity in the trade-by-trade stock marketreturn generating process. In EconomicComplexity: Chaos, Sunspots, Bubbles andNonlinearity- International Symposium in EconomicTheory and Econometrics, ed. W.A. Barnett, J.Geweke and K Shell, p. 383-409. Cambridge:Cambridge University Press.
HINICH, MJ. and D.M. PATIERSON. 1995. Detectingepochs of transient dependence in white noise.Mimeo. University of Texas at Austin.
HSIEH, DA. 1989. Testing for nonlinear dependencein daily foreign exchange rates. Journal ofBusiness 62: 339-368.
HSIEH, DA. 1991. Chaos and nonlinear dynamics:application to financial markets. Journal ofFinance 46: 1839-1877.
HSIEH, D.A. and B. LEBARON. 1988a. Finite sampleproperties of the BDS-statistics I: distributionunder the null hypothesis. Mimeo. Universityof Chicago, and University of Wisconsin atMadison.
HSIEH, D.A. and B. LEBARON. 1988b. Finite sampleproperties of the BDS-statistics II: distributionunder the alternative hypothesis. Mimeo.University of Chicago, and University ofWisconsin at Madison.
JOE, AK and K. MENYAH. 2003. Return predictabilityin African stock markets. Review of FinancialEconomics 12: 247-270.
KAPETANIOS, G. 2003. Bootstrap neural networkcointegration tests against nonlinear alternativehypotheses. Studies in Nonlinear Dynamics andEconometrics 7(2): Article 2.
KAPETANIOS, G., YC. SHIN and A SNElL. 2003. Testingfor a unit root in the nonlinear STARframework. Journal ofEconometrics 112: 359-379.
KoK, KL. and KL. CoH. 1995. Malaysian SecuritiesMarket. Petaling Jaya, Selangor: PelandukPublications.
KOK, KL. and F.F. LEE. 1994. Malaysian secondboard stock market and the efficient markethypothesis. MalaysianJournal ofEconomic Studies31(2): 1-13.
KOSFELD, R. and S. ROBE. 2001. Testing fornonlinearities in German bank stock returns.Empirical Economics 26: 581-597.
KRAGER, H. and P. KUGLER. 1993. Non-linearities inforeign exchange markets: a different
perspective. Journal of International Money andFinance 12: 195-208.
LAI, M.M., KG. BALACHANDHER and M.N. FAuzIAS.2003. An examination of the random walkmodel and technical trading rules in theMalaysian stock market. QJ1.arterly Journal ofBUSInesS and Economics 41(1/2): 81-103.
LAURENCE, M. 1986. Weak-form efficiency in theKuala Lumpur and Singapore stock markets.Journal of Banking and Finance 10: 431-445.
LEBARO , B. 1997. A fast algorithm for the BDSstatistic. Studies in Nonlinear Dynamics andEconometrics 2(2): 53-59.
LEE, T.H., H. WHITE and C.WJ. GRANGER. 1993.Testing for neglected nonlinearity in time seriesmodels: a comparison of neural networkmethods and alternative tests. Journal ofEconometrics 56: 269-290.
LI, W.K, S. LING and M. McALEER. 2002. Recenttheoretical results for time series models withGARCH errors. Journal of Economic Suroeys 16:245-269.
LIEw, Y.KS., A.Z. BAHARUMSHAH and TT.L. CHONG,2004. Are Asian real exchange rates stationary?Economics Letters 83: 313-316.
LIEw, V.KS., TT.L. CHO G and KP. LIM. 2003. Theinadequacy of linear autoregressive model forreal exchange rates: empirical evidence fromAsian economies. Applied Economics 35: 13871392.
LIM, KP., M. AzAu and M.S. HABIBULLAH. 2003a.Non-linear dynamics in bilateral Malaysianringgit- U.S. dollar spot rate. Jurnal Analisis10(2): 97-117.
LIM, KP., MJ. HINICH and V.KS. LIEW. 2003b.Episodic non-linearity and non-stationarity inASEAN exchange rates returns series. LabuanBulletin ofInternational Business and Finance 1(2):79-93.
LIU, T., C.WJ. GRANGER and WP. HELLER. 1992.Using the correlation exponent to decidewhether an economic series is chaotic. Journalof Applied Econometrics 7 Supplement: S25-S39.
MAHAJAN, A and AJ. WAG ER. 1999. Nonlineardynamics in foreign exchange rates. GlobalFinance Journal 10: 1-23.
McMILLAN, D.G. and A.E.H. SPEIGHT. 2001.Nonlinearities in the black market zloty-dollarexchange rate: some further evidence. AppliedFinancial Economics 11: 209-220.
PertanikaJ. So/=. Sci. & Hum. Vol. 13 No.1 2005 37
Kian-Ping Lim, Muzafar Shah Habibullah & Hock-Ann Lee
OPONG, KK, G. MULHOlLAND, A.F. Fox and KFARAHMAND. 1999. The behavior of some UKequity indices: an application of Hurst andBDS tests. Journal oj Empirical Finance 6: 267282.
PANAS, E. 2001. Estimating fractal dimension usingstable distributions and exploring long memory
through ARFIMA models in Athens StockExchange. Applied Financial Economics 11: 395402.
PATIERSON, D.M. and R.A. AsHLEY. 2000. A NonlinearTime Series WorksMp: A Toolkit Jor Detecting andIdentifying Nonlinear Serial Dependence. Boston:Kluwer Academic Publishers.
SARANTIS, N. 2001. Nonlinearities, cyclical behaviourand predictability in stock markets: internationalevidence. International Journal ojForecasting 17:459-482.
SARNO, L. 2000. Real exchange rate behaviour inhigh inflation countries: empirical evidencefrom Turkey, 1980-1997. Applied Economics Letters7: 285-291.
SARNO, L. 2001. The behavior of US public debt: anonlinear perspective. Economics Letters 74: 119125.
SAW, S.H. and KC. TAN. 1989. Test of random walkhypothesis in the Malaysian stock market.Securities Industry Review 15(1): 45-50.
SCHEINKMAN, J. and B. LEBARo . 1989. onlineardynamics and stock returns. Journal oj Business62: 311-337.
SERLETIS, A. and M. SHINTANI. 2003. No evidence ofchaos but some evidence of dependence inthe US stock market. Chaos, Solitons and Fractals17: 449-454.
SKALI ,J. and T. TERAsvrRTA. 1999. Another look atSwedish business cycles, 1861-1988. Journal ojApplied Econometrics 14: 359-378.
STEURER, E. 1995. onlinear modeling of the DEM/USD exchange rate. In Neural Networks in theCapital Markets, ed. A.P. Refenes, p.199-211.New York: John Wiley & Sons.
VAN DijK, D., T. TERAsvJRTA and P.H. FRANsES. 2001.Smooth Transition Autoregressive models: asurvey of recent developments. EconometricReviews 21(1): 1-47.
VILASUSO, J. and S. CUNNINGHAM. 1996. Tests fornonlinearity in EMS exchange rates. Studies inNonlinear Dynamics and Econometrics 1(3): 155168.
Yo G, O. 1989. The price behaviour of Malaysianstocks. Malaysian Management Review 24(3): 2334.
Yo G, O. 1993. Market efficiency (weak-form) ofthe Malaysian stock exchange. In Understandingthe &havioural Patterns ojStock Prices: A Collectionoj Readings on Selected Far Eastern Stock Markets,ed. 1. Ibrahim and O. Yong, p.73-95. KualaLumpur: Leeds Publications.
(Received: 19 May 2003)
38 PertanikaJ. Soc. Sci. & Hum. Vol. 13 No.1 2005