penunjuk sosioekonomi terpilih-2011 · bilangan kenderaan bermotor setiap 100 penduduk menunjukkan...
TRANSCRIPT
Penunjuk Sosioekonomi
Selected S
Nisbah penduduk bagi setiap doktor menurun kepada 914 orang
Ratio of people to a doctor reduced
0
200
400
600
800
1,000
1,200
1,400
1,600
1,800
2,000
1,4
94
1,4
18
1,3
92
1,4
20
1,3
17
Bilangan
Number
0
100
200
300
400
500
345 333 342 343 350
Bilangan
Number
Perangkaan Sosial Terpilih, Malaysia / Selected Social Indicator, Malaysia
Penunjuk Sosioekonomi Terpilih
Selected Socio-economic Indicator
MALAYSIA, 2010
Nisbah penduduk bagi setiap doktor menurun kepada 914 orang
Ratio of people to a doctor reduced to 914 persons
Bilangan penduduk bagi setiap doktor
1,2
23
1,1
45
1,0
97
91
4
366 365 382 381
Pada 2009, nisbah
setiap orang doktor
didapati semakin baik iaitu
orang, penurunan
orang) berbanding 2008.
The ratio of population per doctor in
Malaysia for
improvement i.e.
slipped 16.7 per cent
compared to 2008.
Didapati tiada perubahan ketara
pada bilangan penubuhan
hospitaldi Malaysia pada 2009
melibatkan satu penurunan
There were no significant changes
in the number of hospital
Malaysia in 2009 with
decreased.
KESIHATAN
HEALTH
Perangkaan Sosial Terpilih, Malaysia / Selected Social Indicator, Malaysia
Terpilih
ators
Bilangan penduduk bagi setiap doktor (a)
Population per doctor
Bilangan hospital (b)
Number of hospital
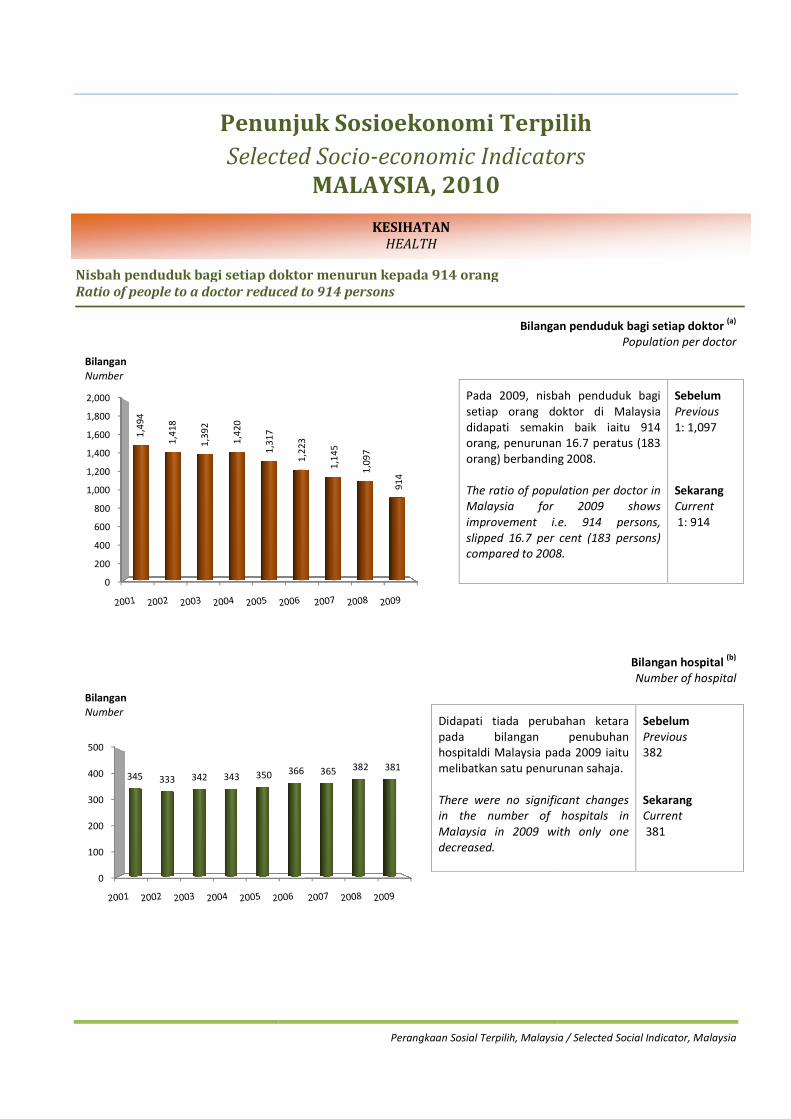
Pada 2009, nisbah penduduk bagi
doktor di Malaysia
semakin baik iaitu 914
penurunan 16.7 peratus (183
orang) berbanding 2008.
population per doctor in
Malaysia for 2009 shows
i.e. 914 persons,
16.7 per cent (183 persons)
2008.
Sebelum
Previous
1: 1,097
Sekarang
Current
1: 914
Didapati tiada perubahan ketara
pada bilangan penubuhan
pada 2009 iaitu
satu penurunan sahaja.
no significant changes
in the number of hospitals in
in 2009 with only one
Sebelum
Previous
382
Sekarang
Current
381
Kadar enrolmen sekolah rendah menurun
Primary enrolment rate reduced slightly w
Bilangan murid di peringkat rendah, menengah serta penuntut di institusi pengajian tinggi awam
Number of students in primary level, secondary level and public institutions of higher learning
94
.1
94
.7
95
.3
95
.6
94
.4
92
.7
92
.6
79.6 78.6 78.6 79.2 80.5 80.8 81.8
0.0
20.0
40.0
60.0
80.0
100.0
120.0
Peratus
Per cent
Sekolah Rendah/
Sekolah Menengah/
2.922.96
3.01 3.043.04
3.03
2.042.05 2.10
2.16 2.222.23
0.30 0.28 0.29 0.29 0.31 0.33
0.00
0.50
1.00
1.50
2.00
2.50
3.00
3.50
4.00
Rendah /
Menengah /
Institusi pengajian tinggi awam /
Secondary
Primary
Bilangan (Juta)
Number (Million)
Public institutions of higher learning
Primary school
Secondary school
Perangkaan Sosial Terpilih, Malaysia / Selected Social Indicator, Malaysia
rendah menurun sedikit namun sekolah menengah terus meningkat
Primary enrolment rate reduced slightly while secondary remain increasing
Percentage of population enrolled in school
Bilangan murid di peringkat rendah, menengah serta penuntut di institusi pengajian tinggi awam
Number of students in primary level, secondary level and public institutions of higher learning
92
.6
92
.4
92
.2
91
.881.8 83.6 83.7 84.5
3.03 3.04 3.00 2.96
2.23 2.252.31 2.33
0.33 0.38 0.42 0.44
Public institutions of higher learning
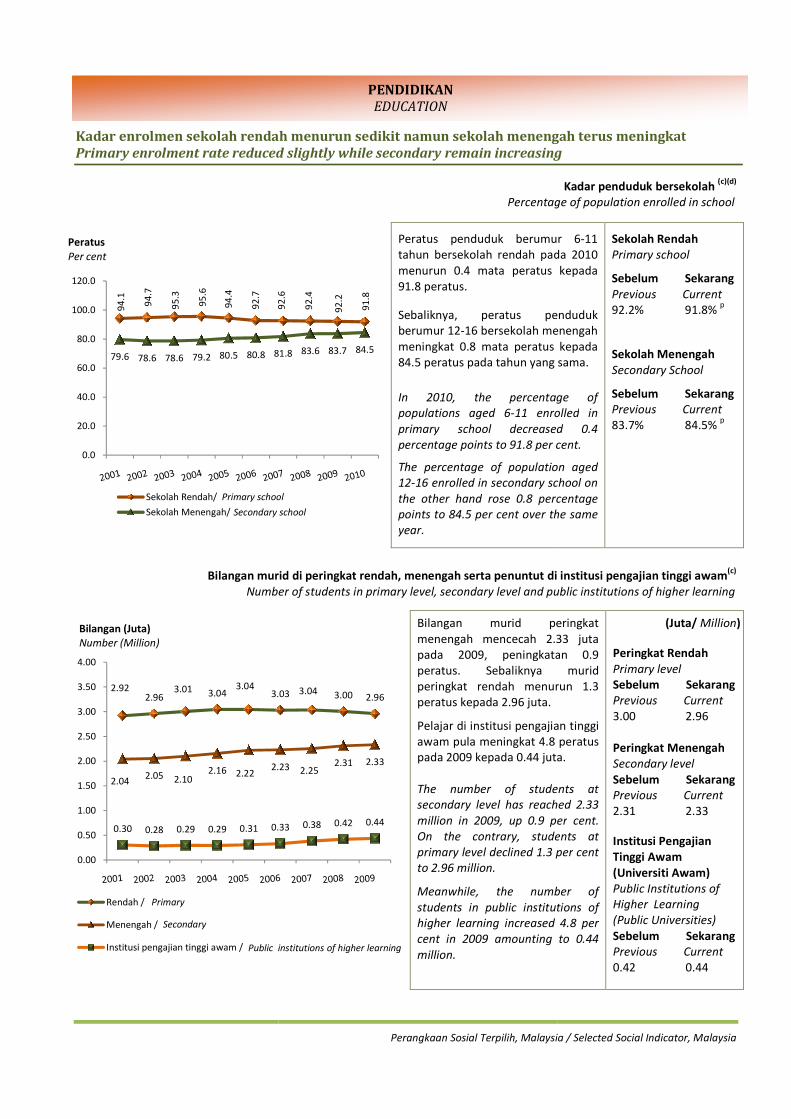
Peratus penduduk berumur
tahun bersekolah rendah pada 2010
menurun 0.4 mata peratus kepada
91.8 peratus.
Sebaliknya, peratus penduduk
berumur 12-16 bersekolah menengah
meningkat 0.8 mata peratus kepada
84.5 peratus pada tahun yang sama
In 2010, the percentage of
populations aged 6-11 enrolled
primary school decreased 0.4
percentage points to 91.8 per cent.
The percentage of population age
12-16 enrolled in secondary school
the other hand rose 0.8 percentage
points to 84.5 per cent over the same
year.
Bilangan murid peringkat
menengah mencecah 2.33 juta
pada 2009, peningkatan 0.9
peratus. Sebaliknya murid
peringkat rendah menurun 1.
peratus kepada 2.96 juta.
Pelajar di institusi pengajian ti
awam pula meningkat 4.8
pada 2009 kepada 0.44 juta.
The number of students
secondary level has reached 2
million in 2009, up 0.9 per
On the contrary, students
primary level declined 1.3 per
to 2.96 million.
Meanwhile, the number of
students in public institutions of
higher learning increased 4.
cent in 2009 amounting to 0.44
million.
PENDIDIKAN
EDUCATION
Primary school
Secondary school
Perangkaan Sosial Terpilih, Malaysia / Selected Social Indicator, Malaysia
namun sekolah menengah terus meningkat
g
Kadar penduduk bersekolah (c)(d)
Percentage of population enrolled in school
Bilangan murid di peringkat rendah, menengah serta penuntut di institusi pengajian tinggi awam(c)
Number of students in primary level, secondary level and public institutions of higher learning
Peratus penduduk berumur 6-11
tahun bersekolah rendah pada 2010
menurun 0.4 mata peratus kepada
eratus penduduk
16 bersekolah menengah
meningkat 0.8 mata peratus kepada
pada tahun yang sama.
ercentage of
11 enrolled in
primary school decreased 0.4
percentage points to 91.8 per cent.
he percentage of population aged
16 enrolled in secondary school on
rose 0.8 percentage
over the same
Sekolah Rendah
Primary school
Sebelum Sekarang
Previous Current
92.2% 91.8% p
Sekolah Menengah
Secondary School
Sebelum Sekarang
Previous Current
83.7% 84.5% p
Bilangan murid peringkat
menengah mencecah 2.33 juta
pada 2009, peningkatan 0.9
peratus. Sebaliknya murid
peringkat rendah menurun 1.3
institusi pengajian tinggi
4.8 peratus
juta.
students at
reached 2.33
0.9 per cent.
contrary, students at
per cent
he number of
students in public institutions of
increased 4.8 per
in 2009 amounting to 0.44
(Juta/ Million)
Peringkat Rendah
Primary level
Sebelum Sekarang
Previous Current
3.00 2.96
Peringkat Menengah
Secondary level
Sebelum Sekarang
Previous Current
2.31 2.33
Institusi Pengajian
Tinggi Awam
(Universiti Awam)
Public Institutions of
Higher Learning
(Public Universities)
Sebelum Sekarang
Previous Current
0.42 0.44
Perkembangan positif nisbah guru kepada murid
Positive improvement in ratio of teacher to students
Bilangan kenderaan bermotor di Malaysia
Number of vehicles in Malaysia is
18.2 17.917.2 16.7
16.0 15.5
17.216.5 16.4 16.3 16.2 16.1
0.0
5.0
10.0
15.0
20.0
25.0
Bilangan
Number
Rendah / Menengah / Primary
46.9 48.6 50.6 53.1 56.0
0.0
10.0
20.0
30.0
40.0
50.0
60.0
70.0
80.0
90.0
100.0
Bilangan
Number
Perangkaan Sosial Terpilih, Malaysia / Selected Social Indicator, Malaysia
Perkembangan positif nisbah guru kepada murid
atio of teacher to students
di Malaysia semakin meningkat
is increasing
Bilangan kenderaan bermotor bagi 100 penduduk
Number of mo
15.5 15.114.2
13.3
16.1 15.514.5
13.7
Menengah / Secondary
58.9 61.865.3 68.2
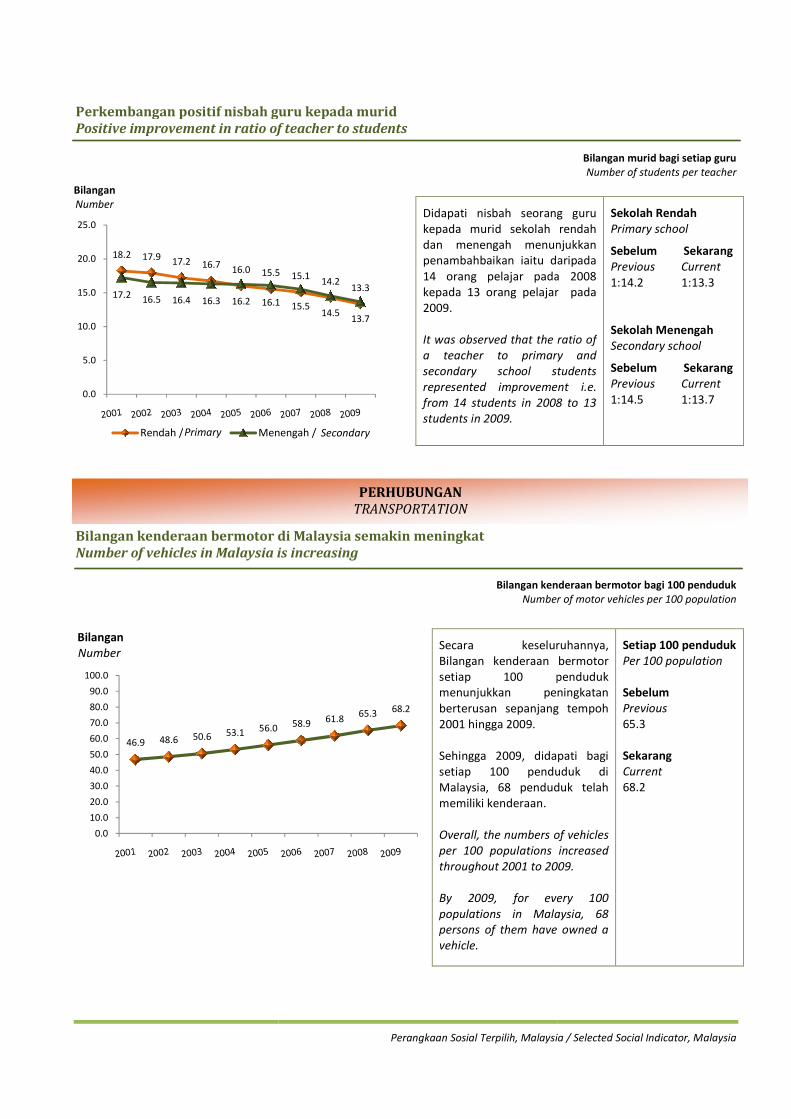
Didapati nisbah seorang
kepada murid sekolah rendah
dan menengah menunjukkan
penambahbaikan iaitu daripada
14 orang pelajar pada 2008
kepada 13 orang pelajar
2009.
It was observed that the ratio of
a teacher to primary and
secondary school students
represented improvement
from 14 students in 2008 to 13
students in 2009.
Secara keseluruhannya,
Bilangan kenderaan bermotor
setiap 100 penduduk
menunjukkan peningkatan
berterusan sepanjang tempoh
2001 hingga 2009.
Sehingga 2009, didapati bagi
setiap 100 penduduk di
Malaysia, 68 penduduk telah
memiliki kenderaan.
Overall, the numbers of vehicles
per 100 populations increase
throughout 2001 to 2009.
By 2009, for every
populations in Malaysia,
persons of them have owned
vehicle.
PERHUBUNGAN
TRANSPORTATION
Perangkaan Sosial Terpilih, Malaysia / Selected Social Indicator, Malaysia
Bilangan murid bagi setiap guru
Number of students per teacher
Bilangan kenderaan bermotor bagi 100 penduduk
Number of motor vehicles per 100 population
seorang guru
murid sekolah rendah
menunjukkan
daripada
pada 2008
pelajar pada
observed that the ratio of
teacher to primary and
students
improvement i.e.
from 14 students in 2008 to 13
Sekolah Rendah
Primary school
Sebelum Sekarang
Previous Current
1:14.2 1:13.3
Sekolah Menengah
Secondary school
Sebelum Sekarang
Previous Current
1:14.5 1:13.7
Secara keseluruhannya,
Bilangan kenderaan bermotor
100 penduduk
menunjukkan peningkatan
berterusan sepanjang tempoh
didapati bagi
setiap 100 penduduk di
Malaysia, 68 penduduk telah
Overall, the numbers of vehicles
opulations increased
throughout 2001 to 2009.
every 100
in Malaysia, 68
have owned a
Setiap 100 penduduk
Per 100 population
Sebelum
Previous
65.3
Sekarang
Current
68.2
Jumlah kematian semakin meningkat ekoran dari
The number of deaths increased
250.4
279.7298.7
324.8 328.3
44.6 43.7 46.5 47.9 40.8
5.8 5.9 6.3 6.2 6.20.0
50.0
100.0
150.0
200.0
250.0
300.0
350.0
400.0
450.0
Bilangan kemalangan /
Kecederaan /
Kematian /
Bilangan ('000)
Number
Number of accidents
Injury
Death
Perangkaan Sosial Terpilih, Malaysia / Selected Social Indicator, Malaysia
Jumlah kematian semakin meningkat ekoran dari peningkatan kemalangan jalan raya
ed due to the increased in road accidents
Bilangan kemalangan jalan raya, kecederaan dan kematian yang dilaporkan
Number of road accidents, injuries and
341.3363.3 373.1
397.3
29.1 27.7 25.7 24.7
6.36.3 6.5 6.7
of accidents
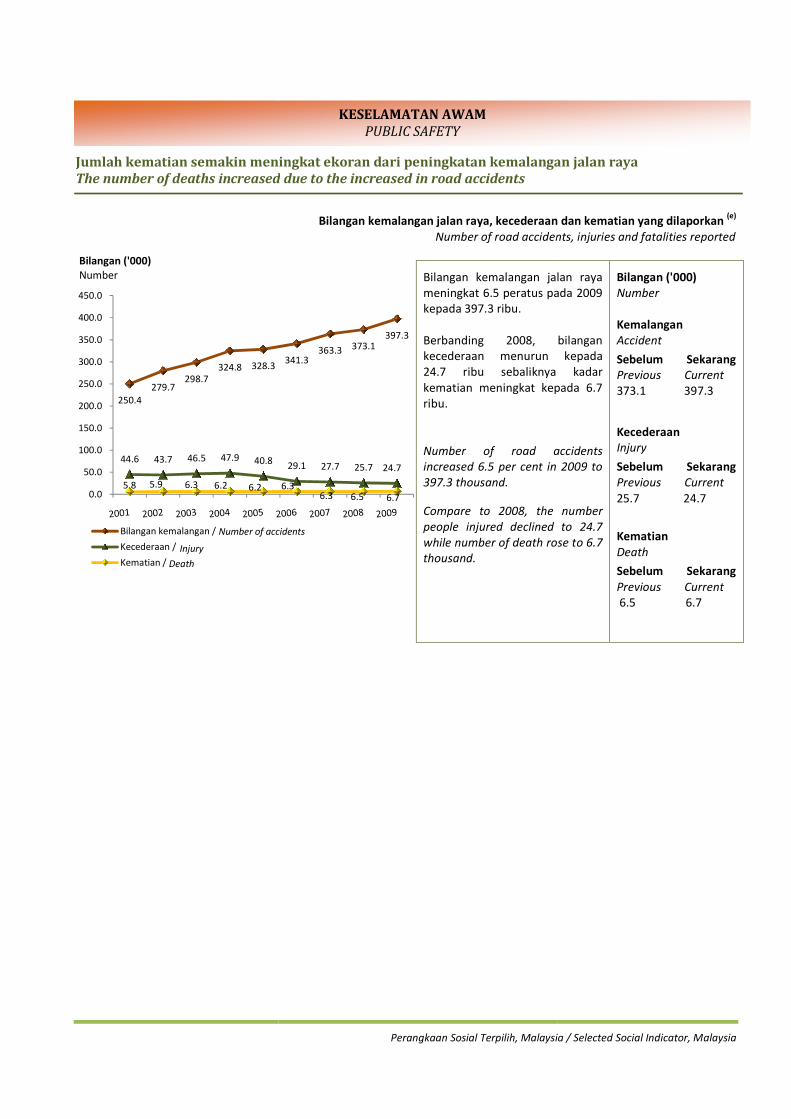
Bilangan kemalangan jalan raya
meningkat 6.5 peratus pada 2009
kepada 397.3 ribu.
Berbanding 2008, bilangan
kecederaan menurun kepada
24.7 ribu sebaliknya kadar
kematian meningkat kepada 6.7
ribu.
Number of road accidents
increased 6.5 per cent in 2009 to
397.3 thousand.
Compare to 2008, the number
people injured declined to
while number of death rose to 6.7
thousand.
KESELAMATAN AWAM
PUBLIC SAFETY
Perangkaan Sosial Terpilih, Malaysia / Selected Social Indicator, Malaysia
peningkatan kemalangan jalan raya
kemalangan jalan raya, kecederaan dan kematian yang dilaporkan (e)
Number of road accidents, injuries and fatalities reported
Bilangan kemalangan jalan raya
ada 2009
Berbanding 2008, bilangan
kecederaan menurun kepada
sebaliknya kadar
kematian meningkat kepada 6.7
Number of road accidents
in 2009 to
2008, the number
people injured declined to 24.7
f death rose to 6.7
Bilangan ('000)
Number
Kemalangan
Accident
Sebelum Sekarang
Previous Current
373.1 397.3
Kecederaan
Injury
Sebelum Sekarang
Previous Current
25.7 24.7
Kematian
Death
Sebelum Sekarang
Previous Current
6.5 6.7
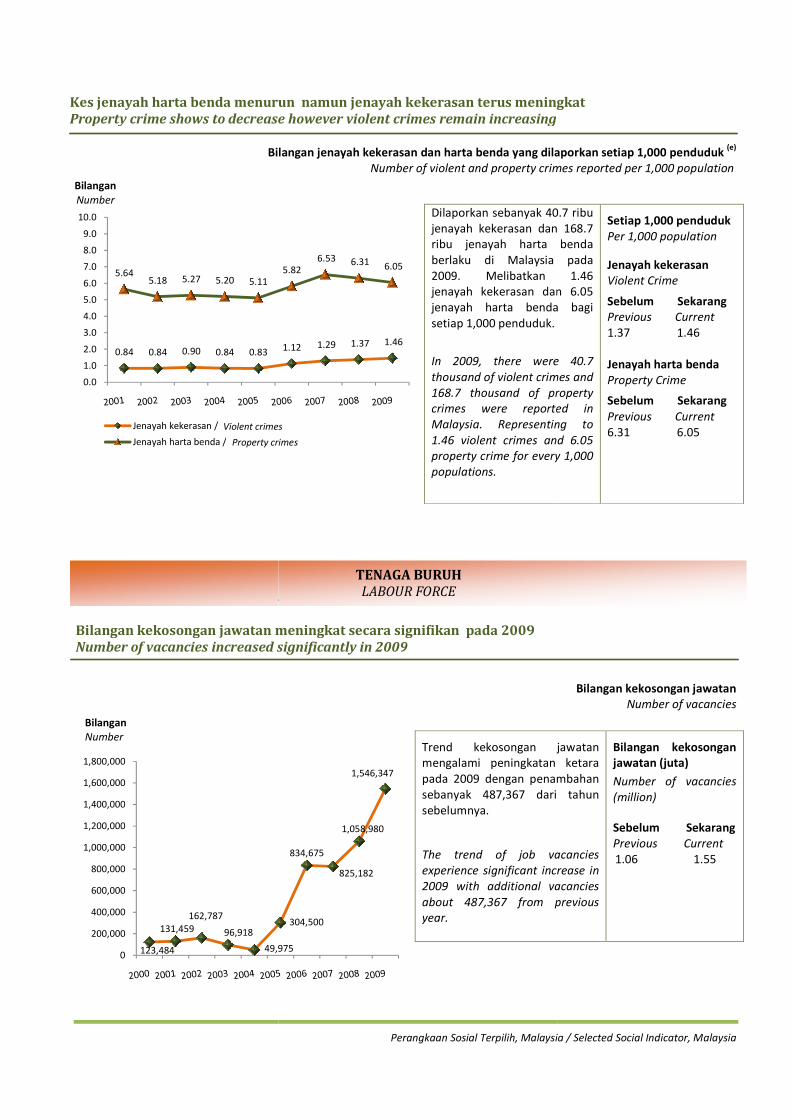
Kes jenayah harta benda menurun
Property crime shows to decrease however violent crimes remain increasing
Bilangan jenayah kekerasan dan harta benda yang dilaporkan
Bilangan kekosongan jawatan meningkat secara signifikan pada 2009
Number of vacancies increased significantly in 2009
0.84 0.84 0.90 0.84 0.83
5.645.18 5.27 5.20 5.11
0.0
1.0
2.0
3.0
4.0
5.0
6.0
7.0
8.0
9.0
10.0
Bilangan
Number
Jenayah kekerasan /
Jenayah harta benda /
Violent crimes
Property crimes
123,484
131,459
162,787
96,918
49,9750
200,000
400,000
600,000
800,000
1,000,000
1,200,000
1,400,000
1,600,000
1,800,000
Bilangan
Number
Perangkaan Sosial Terpilih, Malaysia / Selected Social Indicator, Malaysia
menurun namun jenayah kekerasan terus meningkat
Property crime shows to decrease however violent crimes remain increasing
Bilangan jenayah kekerasan dan harta benda yang dilaporkan
Number of violent and property crimes
Bilangan kekosongan jawatan meningkat secara signifikan pada 2009
Number of vacancies increased significantly in 2009
1.12 1.29 1.37 1.46
5.82
6.53 6.31 6.05
Violent crimes
Property crimes
49,975
304,500
834,675
825,182
1,058,980
1,546,347
Dilaporkan sebanyak 40.7 ribu
jenayah kekerasan dan 168.7
ribu jenayah harta benda
berlaku di Malaysia pada
2009. Melibatkan 1
jenayah kekerasan dan 6.05
jenayah harta benda
setiap 1,000 penduduk.
In 2009, there were 40.7
thousand of violent crimes and
168.7 thousand of property
crimes were reported in
Malaysia. Representing to
1.46 violent crimes and 6.05
property crime for every 1,000
populations.
Trend kekosongan ja
mengalami peningkatan ketara
pada 2009 dengan penambahan
sebanyak 487,367 dari tahun
sebelumnya.
The trend of job vacancies
experience significant increase in
2009 with additional vacancies
about 487,367 from previous
year.
TENAGA BURUH
LABOUR FORCE
Perangkaan Sosial Terpilih, Malaysia / Selected Social Indicator, Malaysia
kekerasan terus meningkat
Bilangan jenayah kekerasan dan harta benda yang dilaporkan setiap 1,000 penduduk (e)
of violent and property crimes reported per 1,000 population
Bilangan kekosongan jawatan
Number of vacancies
Dilaporkan sebanyak 40.7 ribu
jenayah kekerasan dan 168.7
ribu jenayah harta benda
berlaku di Malaysia pada
2009. Melibatkan 1.46
jenayah kekerasan dan 6.05
jenayah harta benda bagi
setiap 1,000 penduduk.
In 2009, there were 40.7
thousand of violent crimes and
168.7 thousand of property
reported in
Malaysia. Representing to
1.46 violent crimes and 6.05
property crime for every 1,000
Setiap 1,000 penduduk
Per 1,000 population
Jenayah kekerasan
Violent Crime
Sebelum Sekarang
Previous Current
1.37 1.46
Jenayah harta benda
Property Crime
Sebelum Sekarang
Previous Current
6.31 6.05
Trend kekosongan jawatan
mengalami peningkatan ketara
pada 2009 dengan penambahan
sebanyak 487,367 dari tahun
The trend of job vacancies
increase in
2009 with additional vacancies
from previous
Bilangan kekosongan
jawatan (juta)
Number of vacancies
(million)
Sebelum Sekarang
Previous Current
1.06 1.55
11
2,8
35
11
3,8
61
11
7,9
50
10
4,1
49
88
,75
3
14
3,2
46
24
,73
8
17
,94
7
19
,27
7
16
,26
7
6,1
92
17
,45
9
0
50,000
100,000
150,000
200,000
250,000
300,000
350,000
Pencari kerja baru
Penempatan pendaftar
Bilangan
Number
/ New job
/ Placement
Perangkaan Sosial Terpilih, Malaysia / Selected Social Indicator, Malaysia
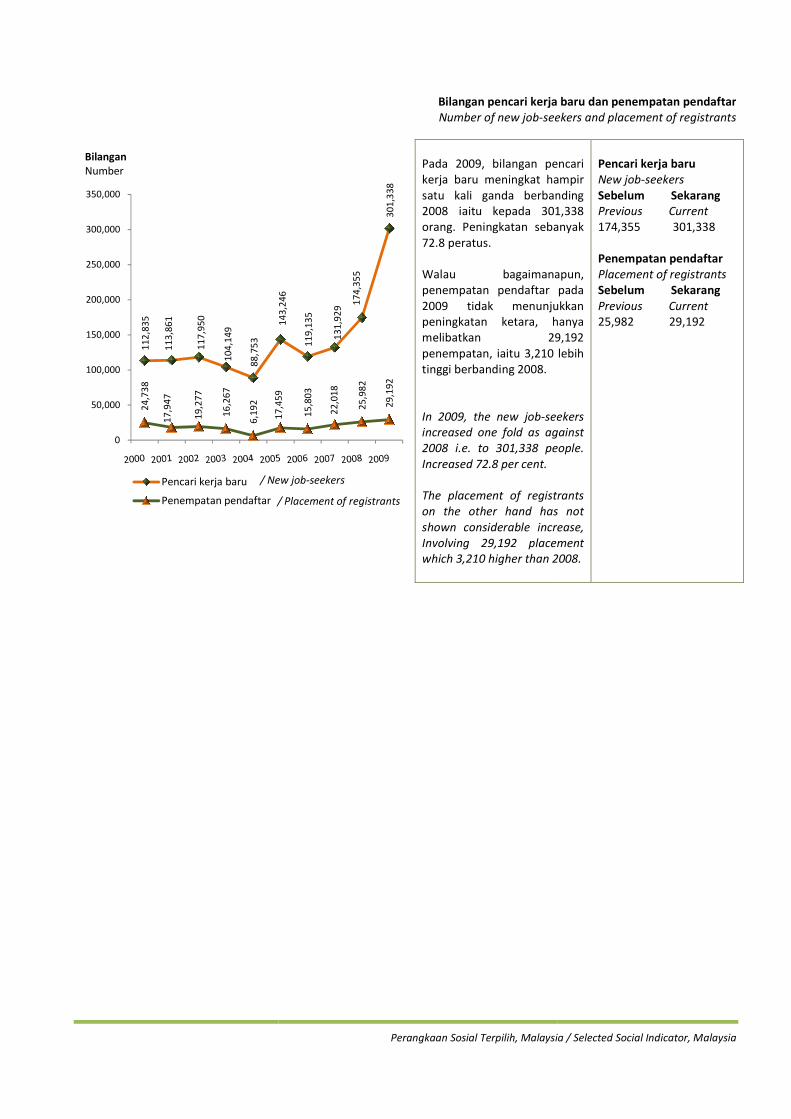
Bilangan pencari kerja baru dan penempatan pendaftar
Number of new job-seekers and placement of registrants
14
3,2
46
11
9,1
35
13
1,9
29
17
4,3
55
30
1,3
38
17
,45
9
15
,80
3
22
,01
8
25
,98
2
29
,19
2
/ New job-seekers
/ Placement of registrants
Pada 2009, bilangan pencari
kerja baru meningkat hampir
satu kali ganda berbanding
2008 iaitu kepada 301,338
orang. Peningkatan sebanyak
72.8 peratus.
Walau bagaimanapun,
penempatan pendaftar pada
2009 tidak menunjukkan
peningkatan ketara, h
melibatkan 29,192
penempatan, iaitu 3,210 lebih
tinggi berbanding 2008.
In 2009, the new job-seekers
increased one fold as against
2008 i.e. to 301,338 people.
Increased 72.8 per cent.
The placement of registrants
on the other hand has not
shown considerable increase
Involving 29,192 placement
which 3,210 higher than 2008.
Perangkaan Sosial Terpilih, Malaysia / Selected Social Indicator, Malaysia
Bilangan pencari kerja baru dan penempatan pendaftar
seekers and placement of registrants
Pada 2009, bilangan pencari
kerja baru meningkat hampir
satu kali ganda berbanding
2008 iaitu kepada 301,338
orang. Peningkatan sebanyak
Walau bagaimanapun,
penempatan pendaftar pada
nunjukkan
peningkatan ketara, hanya
n 29,192
penempatan, iaitu 3,210 lebih
seekers
increased one fold as against
2008 i.e. to 301,338 people.
The placement of registrants
on the other hand has not
crease,
Involving 29,192 placement
3,210 higher than 2008.
Pencari kerja baru
New job-seekers
Sebelum Sekarang
Previous Current
174,355 301,338
Penempatan pendaftar
Placement of registrants
Sebelum Sekarang
Previous Current
25,982 29,192
Perangkaan Sosial Terpilih, Malaysia / Selected Social Indicator, Malaysia
Nota:
Note:
(a) Bilangan doktor merujuk kepada doktor yang berdaftar. Termasuk perkhidmatan awam dan swasta.
The number of doctors refers to registered doctors. Include public and private practices.
(b) Bilangan hospital merujuk kepada hospital kerajaan, institusi perubatan khas, hospital swasta, rumah rawatan dan
bersalin yang telah diberi lesen pada tahun tersebut.
The number of hospitals refers to government hospitals, special medical institutions, private hospitals, nursing and
maternity homes which are licensed in the respective year.
(c) Data murid sekolah rendah dan sekolah menengah (tidak termasuk tingkatan 6 dan ke atas) merujuk kepada
sekolah kerajaan dan bantuan kerajaan sahaja.
Data on primary schools and secondary (not includes form 6 and above) schools refers to government and
government assisted schools only.
(d) Pengiraan kadar enrolmen adalah menggunakan bilangan unjuran penduduk berdasarkan Banci Penduduk dan
Perumahan 2000.
The calculation of enrolment rate is used the population projection based on the 2000 Population and Housing
Census.
(e) Bilangan kematian merujuk kepada kematian serta-merta atau dalam masa 30 hari disebabkan kecederaan dalam
kemalangan tersebut.
The number of deaths refers only to cases where death occurred on the spot or dying within 30 days as a result of
an injury incident.
Punca:
Source:
Kementerian Kesihatan Malaysia/ Ministry of Health, Malaysia
Kementerian Pelajaran Malaysia/ Ministry of Education, Malaysia
Kementerian Pengajian Tinggi Malaysia/ Ministry of Higher Education, Malaysia
Jabatan Pengangkutan Jalan Malaysia/ Road Transport Department, Malaysia
Polis Diraja Malaysia/ Royal Malaysia Police
Kementerian Sumber Manusia/ Ministry of Human Resources