ng wei nyap - eprints.utm.myeprints.utm.my/id/eprint/3981/1/ngweinyapmfke2005.pdfkaeadah...
TRANSCRIPT

DEVELOPMENT OF ULTRASONIC TOMOGRAPHY FOR
COMPOSITION DETERMINATION OF WATER AND OIL FLOW
NG WEI NYAP
A thesis submitted in fulfilment of the
requirements for the award of the degree of
Master of Engineering (Electrical)
Faculty of Electrical Engineering
Universiti Teknologi Malaysia
OCTOBER 2005

iii
To my dearest parents, Ng Siew Sui and Voon Moi Fah,
my dearest brothers and sister, my friends,
whoever help and support me in the thesis.

iv
ACKNOWLEDGEMENT
First of all, I would like to express my gratitude to all those who give helps
and support to me in doing this thesis. I wish to thank my supervisor, P.M. Dr
Ruzairi Hj Abdul Rahim, for his advice, guidance and encouragement throughout the
process of doing the project and writing this thesis.
Special thanks also to Mr. Chan Kok San for his advice and helps throughout
the project.
Not forgetting, thanks to all my friends and staffs from Faculty of Electrical
Engineering for their support and encouragement.

v
ABSTRACT
This project presents an implementation of the ultrasonic tomography to
determine the composition of the water and oil flow. The transmission method of
ultrasonic tomography is implemented in this project as the ultrasonic waves can
propagate through both the medium of water and oil. This method is also one of the
non-invasive methods that do not disturb the internal flow of the pipeline. The
velocity of ultrasonic waves varies in water, oil and different composition of water
and oil. The composition of water and oil can be determined from the measurement
of this propagation time. Therefore, the design of the electronic circuits is to
measure the propagation time of the ultrasonic waves through the medium. There
are sixteen pairs of ultrasonic sensor mounted non-invasively around the periphery of
an acrylic pipe. The grease is used as the coupling material to mount these ultrasonic
sensors. The ultrasonic sensor used is 40 kHz of its frequency and 125o of its beam
angle. The beam angle of the ultrasonic sensor is preferred to be wider to provide
wider visualization area. In this project, different composition of water and oil are
used and the propagation times of the ultrasonic waves through the medium are then
measured. These measurements are read into the computer through the data
acquisition system (DAS) card. The cross-sectional-image is reconstructed by a
custom-created software using Microsoft Visual Basic 6.0. The image reconstruction
algorithm that used in the software is linear back projection (LBP) algorithm. The
composition of the water and oil of the flow is determined from the reconstructed
image. The composition of the water and oil will be shown in numerical forms and
their distribution in the flow could be seen from the image. In this thesis, the results
obtained from the project are presented. The implementation method, reconstructed
images and analysis of the results are also presented in this thesis. This system can
be implemented and bring benefits to the oil production industries.

vi
ABSTRAK
Projek ini adalah berkaitan dengan penggunaan tomografi ultrasonik untuk
mengukur komposisi air dan minyak dalam paip. Kaedah penghantaran tomografi
ultrasonik digunakan dalam projek ini kerana gelombang ultrasonik boleh merambat
melalui air dan minyak. Kaedah ini tidak memerlukan penebukan lubang dilakukan
ke atas paip. Halaju gelombang ultrasonik adalah berlainan dalam air, minyak serta
campuran air dan minyak yang berlainan komposisinya. Komposisi air dan minyak
boleh diketahui dengan mengukur masa perambatan ini. Maka, rekaan litar
elektronik adalah bertujuan untuk mengukur masa perambatan gelombang ultrasonik
ini. Terdapat enam belas pasang sensor ultrasonik dilekat di sekeliling bahagian luar
paip. Gris digunakan sebagai bahan pelekat di antara sensor ultrasonik dan
permukaan paip. Frekuensi sensor ultrasonik yang digunakan adalah 40 kHz, dan
sudut gelombangnya adalah 125o. Sudut gelombang yang lebih luas membolehkan
kawasan yang lebih luas dapat dikesan. Dalam projek ini, komposisi air dan minyak
yang berlainan digunakan dan masa perambatan gelombang ultrasonik melaluinya
diukur. Pengukuran ini dibaca ke dalam komputer dengan menggunakan kad DAS.
Imej keratan rentas adalah dihasilkan dengan menggunakan perisian Microsoft
Visual Basic 6.0. Algoritma yang digunakan untuk membina imej adalah algoritma
‘Linear Back Projection’. Komposisi air dan minyak adalah ditentukan daripada
imej keratan rentas yang dihasilkan. Pengagihan air dan minyak dalam paip juga
dapat diperhatikan daripada imej itu. Dalam tesis ini, keputusan yang diperolehi
daripada projek ditunjukkan. Kaeadah pelaksanaan, imej keratan rentas yang
dihasilkan dan analisis daripada keputusan juga dibincangkan dalam tesis ini. Sistem
ini boleh dilaksanakan dan membawa faedah kepada industri pengeluaran minyak.
vii
TABLE OF CONTENTS
CHAPTER TITLE PAGE
DECLARATION ii
DEDICATION iii
ACKNOWLEDGEMENT iv
ABSTRACT v
ABSTRAK vi
TABLE OF CONTENTS vii
LIST OF TABLES xiv
LIST OF FIGURES xv
LIST OF ABBREVIATION / SYMBOLS xix
LIST OF APPENDICES xxii
1 INTRODUCTION 1
1.1 An Overview of Process Tomography 1
1.2 Background Problems 2
1.3 Problem Statements 4
1.4 Importance of Study 5
1.5 Research Objectives 6
1.6 Research Scopes 7
1.7 Thesis Structures 10

viii
2 PROCESS TOMOGRAPHY SYSTEM 11
2.1 Introduction 11
2.2 Type of Tomography Sensor 12
2.2.1 Electrical Capacitance Tomography (ECT) 13
2.2.2 Electrical Impedance Tomography (EIT) 14
2.2.3 Electrical Charge Tomography 15
2.2.4 Optical Tomography 15
2.2.5 X-Ray Tomography 16
2.2.6 Nuclear Magnetic Resonance (NMR) 17
2.2.7 Positron Emission Tomography (PET) 18
2.2.8 Ultrasonic Tomography 19
2.3 Component Concentration Measurement 19
2.3.1 Radioactive Attenuation Method 20
2.3.2 Capacitance Method 20
2.3.3 Ultrasound Absorption Method 21
2.3.4 Optical Absorption Method 21
3 ULTRASONIC TOMOGRAPHY 22
3.1 Introduction of Ultrasound 22
3.2 Fundamentals of Ultrasound 24
3.2.1 Frequency, Period and Wavelength
of Ultrasound 24
3.2.2 Attenuation of Ultrasound 25
3.2.3 Acoustic Impedance 27
3.3 Propagation of Ultrasound 28
3.3.1 Longitudinal Wave 30
3.3.2 Shear Wave 30
3.3.3 Surface (Rayleigh) Wave 31
3.3.4 Plate (Lamb) Wave 32

ix
3.4 Sensing Modes of Ultrasonic Tomography 33
3.4.1 Transmission Sensing Mode 33
3.4.2 Reflection Sensing Mode 33
3.4.3 Diffraction Sensing Mode 34
3.5 Summary 34
4 SENSOR ARRAY MODELING AND
HARDWARE DESIGN 35
4.1 Sensor Array Modeling 35
4.2 Ultrasonic Path Modeling 40
4.3 Sensitivity Map 42
4.4 Hardware and Circuit Design 49
4.4.1 Selection of Transmitter and Receiver 49
4.4.2 Mounting of Ultrasonic Sensor 51
4.4.3 Design of Transmitter Circuits 52
4.4.3.1 Switching Circuit 53
4.4.3.2 Driving Circuits 56
4.4.4 Design of Receiver Circuits 59
4.4.4.1 Amplifier Circuits 59
4.4.4.2 Zero-crossing Detector Circuit 62
4.4.4.3 Signal Holding Circuits 63
4.4.4.4 Binary Counter 67
4.4.4.5 Buffer 71
4.4.4.6 Crystal Oscillator 71
4.4.5 Master Controller 73
4.5 Printed Circuit Board (PCB) Design 76
4.6 Connection from Sensors to Circuits 78
4.7 Data Acquisition System (DAS) Card 79
4.8 Summary 83

x
5 DATA ACQUISITION AND SOFTWARE
IMPLEMENTATION 84
5.1 Image Reconstruction Algorithm 84
5.1.1 Linear Back Projection Algorithm 84
5.1.2 Implementation of Linear Back
Projection Algorithm 85
5.1.3 Composition Determination from
Concentration Profile 88
5.2 Software Development 95
5.2.1 Introduction to Software Development 95
5.2.2 Graphical User Interface Development 97
5.2.3 Color Schemes 102
5.2.4 Programming Structures 104
5.2.4.1 DAS Operation 105
5.2.4.2 Measurement Process 107
5.3 Image Enhancement 109
5.4 Programming Techniques 112
5.5 Flow Simulation 113
5.5.1 Dual Segment Flow Model 117
5.5.2 Water Flow with Oil Bubbles Model 119
5.5.3 Oil Flow with Water Bubbles Model 121
5.6 Summary 123
xi
6 RESULTS AND ANALYSIS 124
6.1 Performance of Flow Monitoring System 125
6.1.1 Discussion of Performance of Flow
Monitoring System 126
6.2 Simulation Results and Analysis using
Flow Model 128
6.2.1 Implementation of Image Enhancement
Technique 131
6.2.1.1 Discussion of Image
Enhancement Technique 134
6.2.2 Dual Segment Flow Model 135
6.2.2.1 Analysis and Results of Dual
Segment Flow Model 136
6.2.2.2 Discussion of Dual Segment
Flow Model 141
6.2.3 Water Flow with Oil Bubbles Model 142
6.2.3.1 Single Oil Bubble 143
6.2.3.2 Two Oil Bubbles 146
6.2.3.3 Three Oil Bubbles 149
6.2.3.4 Four Oil Bubbles 152
6.2.3.5 Discussion of Water Flow
with Oil Bubbles Model 155
6.2.4 Conclusion of Simulation using
Flow Model 156
6.3 Experiment Implementation 157
6.4 Results and Analysis for Dual Segment
Flow 159
6.4.1 Results and Analysis for Corn Oil
and Water Flow 160
6.4.1.1 Discussion for Analysis of
Corn Oil and Water Flow 163
6.4.2 Results and Analysis for Soybean Oil
and Water Flow 164

xii
6.4.2.1 Discussion for Analysis of
Soybean Oil and Water Flow 167
6.4.3 Results and Analysis for Palm Oil
and Water Flow 168
6.4.3.1 Discussion for Analysis of
Palm Oil and Water Flow 171
6.4.4 Concentration and Delay Measurements
of the Dual Segment Flow 172
6.4.5 Tomogram of the Dual Segment Flow 173
6.4.5.1 Discussion for Tomogram of
the Dual Segment Flow 176
6.4.6 Conclusion of the Dual Segment Flow 177
6.5 Results and Analysis for Water Flow
with Oil Bubbles 178
6.5.1 Conclusion of Water Flow
with Oil Bubbles 179
6.6 Conclusion of Results from Simulation
and Experiment 180
6.7 Summary 181
7 CONCLUSION AND RECOMMENDATION 182
7.1 Achievements and Conclusions 182
7.2 Significant Contribution from the Research 183
7.3 Recommendations for Future Work 184

xiii
REFERENCES 187
APPENDICES
APPENDIX A 194
APPENDIX B 196
APPENDIX C 200
APPENDIX D 202
APPENDIX E 207
APPENDIX F 211
APPENDIX G 212
APPENDIX H 213
APPENDIX I 219
APPENDIX J 221
APPENDIX K 223

xiv
LIST OF TABLES
TABLE TITLE PAGE
3.1 Acoustic velocity and Acoustic Impedance of Ultrasound
in some Materials 29
4.1 Nodes of Transmitter (Tx0, Tx1) and Receivers (Rx0, Rx1) 39
4.2 Colors Represent the 21 Lines 44
4.3 Specification of Ultrasonic Sensor 49
4.4 Transmitter Channel Selection Control 56
4.5 Function Table of S - R flip-flop 64
4.6 Function of the Pins of Microcontroller 73
4.7 Hardware Description 77
4.8 Function of each Port of PIO-D144 82
5.1 Descriptions of Flow Monitoring System 99
5.2 Descriptions of Flow Simulation Program 114
6.1 Velocity of Ultrasonic Waves in the Oils and Water 126
6.2 Composition Measurements of Corn Oil and Water Flow 160
6.3 Results of Analysis Measurements for Corn Oil and Water Flow 160
6.4 Composition Measurements of Soybean Oil and Water Flow 164
6.5 Results of Analysis Measurements for Soybean Oil and Water Flow 164
6.6 Composition Measurements of Palm Oil and Water Flow 168
6.7 Results of Analysis Measurements for Palm Oil and Water Flow 168
6.8 TotalC and ∆Delay Measurements of the Oils 172
6.9 Summary of Analysis Measurements (I) 177
6.10 Summary of Analysis Measurements (II) 177
xv
LIST OF FIGURES
FIGURE TITLE PAGE
1.1 Scope of the Project 7
1.2 Layout of Signal Conditioning Circuit 8
2.1 Basic Tomography System and Applications 11
2.2 Basic of an Electrical Capacitance Tomography System 14
2.3 System of an X-ray Tomography 17
3.1 Classification of Sound 22
3.2 Application of Ultrasound 23
3.3 Continuous Wave of Ultrasound 24
3.4 Attenuation of Ultrasound 26
3.5 Longitudinal Wave 30
3.6 Shear Wave 31
3.7 Rayleigh Wave 31
3.8 Plate Wave 32
4.1 Outline of Ultrasonic Sensor 35
4.2 Arrangement of Ultrasonic Sensor around the Pipe 36
4.3 Coordination of 896 Nodes with Scale (0,0)-(640,640) 37
4.4 Path Modeling of Ultrasonic Waves 41
4.5 Individual View from Tx0 to Rx6 42
4.6 Sensitivity Map for Tx0 to Rx6 47
4.7 Weight Balance Map 48
4.8 Ultrasonic Sensor 50
4.9 Beam Angle of the Ultrasonic Sensor 50
4.10 Mounting Technique of Ultrasonic Sensor 51
4.11 Mounting of Ultrasonic Sensor 52

xvi
4.12 ECIO Mode Connection 53
4.13 Control Signals to the Decoder 54
4.14 Switching Circuit 55
4.15 Driving Circuit for Ultrasonic Transmitter 57
4.16 Signal of Driving Circuit When Not Connected 58
4.17 Signal of Driving Circuit When Connected 58
4.18 Inverting Amplifier Circuit 60
4.19 Amplified Ultrasonic Wave (Time Scale: 200µs/div) 61
4.20 Amplified Ultrasonic Wave (Time Scale: 50µs/div) 61
4.21 Zero-Crossing Detector Circuit 62
4.22 Signal from Zero-Crossing Detector 63
4.23 Signal Holding Circuits 64
4.24 Operation of Signal Holding Circuits 65
4.25 Signal from Signal Holding Circuits 66
4.26 8 bit Binary Counter 68
4.27 Operation Diagram of Binary Counter 69
4.28 Signal of Binary Counter 70
4.29 Buffer 71
4.30 Layout and Connection Pins of Crystal Oscillator 72
4.31 Clock of Crystal Oscillator 72
4.32 Timing Diagram of Microcontroller 74
4.33 Transmitter and Receiver Boards 76
4.34 DAS Connection 76
4.35 Cross-sectional View of the Coaxial Cable 78
4.36 DAS Card (PIO-D144) 79
4.37 Adapters of DAS Card 80
4.38 Pin Assignment of ADP-37/PCI 80
4.39 Layout of PIO-D144 81
5.1 Implementation of Image Reconstruction Algorithm 87
5.2 Ultrasonic Tomography using Parallel Projection 88
5.3 Concentration Profile of Water and Oil Flow 90
5.4 Flow Monitoring System 98
5.5 Complete List of Sensors’ Values 100
5.6 Sensitivity Maps Computation 100

xvii
5.7 Color Setting Form 102
5.8 Color Schemes 103
5.9 Start Up of Main Program 104
5.10 Function Call into DLL Driver 105
5.11 Operation of DAS Card 106
5.12 Measurement Process 108
5.13 Concentration Profile 110
5.14 Image Enhancement Technique 111
5.15 Flow Simulation Program 113
5.16 Dual Segment Flow Model 117
5.17 Tomogram of Dual Segment Flow Model 118
5.18 Concentration Profile of Dual Segment Flow Model 118
5.19 Water Flow with Oil Bubbles Model 119
5.20 Tomogram of Water Flow with Oil Bubbles Model 120
5.21 Concentration Profile of Water Flow with Oil Bubbles Model 120
5.22 Oil Flow with Water Bubbles Model 121
5.23 Tomogram of Oil Flow with Water Bubbles Model 122
5.24 Concentration Profile of Oil Flow with Water Bubbles Model 122
6.1 Image Enhancement Technique (I) 132
6.2 Image Enhancement Technique (II) 133
6.3 Color Representation Scheme 134
6.4 Tomogram of Dual Segment Flow Model (I) 137
6.5 Tomogram of Dual Segment Flow Model (II) 138
6.6 Graph of Comparison of Oil Measurements 139
6.7 Graph of Comparison of Oil Measurements’ Difference 139
6.8 Graph of Comparison of Oil Measurement’s Error 139
6.9 Graph of Comparison of Water Measurements 140
6.10 Graph of Comparison of Water Measurements’ Difference 140
6.11 Graph of Comparison of Water Measurements’ Error 140
6.12 Analysis of 1 Pixel Single Oil Bubble 143
6.13 Analysis of 4 Pixels Single Oil Bubble 144
6.14 Analysis of 16 Pixels Single Oil Bubble 145
6.15 Analysis of 1 Pixel Two Oil Bubbles 146
6.16 Analysis of 4 Pixel Two Oil Bubbles 147

xviii
6.17 Analysis of 16 Pixels Two Oil Bubbles 148
6.18 Analysis of 1 Pixel Three Oil Bubbles 149
6.19 Analysis of 4 Pixels Three Oil Bubbles 150
6.20 Analysis of 16 Pixels Three Oil Bubbles 151
6.21 Analysis of 1 Pixel Four Oil Bubbles 152
6.22 Analysis of 4 Pixels Four Oil Bubbles 153
6.23 Analysis of 16 Pixels Four Oil Bubbles 154
6.24 Comparison of Corn Oil Measurements 161
6.25 Comparison of Corn Oil Measurements’ Difference 161
6.26 Comparison of Corn Oil Measurements’ Error 161
6.27 Comparison of Water Measurements (Corn Oil) 162
6.28 Comparison of Water Measurements’ Difference 162
6.29 Comparison of Water Measurements’ Error 162
6.30 Comparison of Soybean Oil Measurements 165
6.31 Comparison of Soybean Oil Measurements’ Difference 165
6.32 Comparison of Soybean Oil Measurements’ Error 165
6.33 Comparison of Water Measurements (Soybean Oil) 166
6.34 Comparison of Water Measurements’ Difference (Soybean Oil) 166
6.35 Comparison of Water Measurements’ Error (Soybean Oil) 166
6.36 Comparison of Palm Oil Measurements 169
6.37 Comparison of Palm Oil Measurements’ Difference 169
6.38 Comparison of Palm Oil Measurements’ Error 169
6.39 Comparison of Water Measurements (Palm Oil) 170
6.40 Comparison of Water Measurements’ Difference (Palm Oil) 170
6.41 Comparison of Water Measurements’ Error (Palm Oil) 170
6.42 Tomogram of Corn Oil (I) 174
6.43 Tomogram of Corn Oil (II) 175
6.44 Tomogram of Water Flow with Oil Bubble 178
6.45 Concentration Profile of Tomogram of Water Flow with Oil Bubble 179
xix
LIST OF ABBREVIATIONS / SYMBOLS
A - Attenuation of the ultrasound
AV - Amplification gain of amplifier
c - Speed of ultrasound
CSV - Comma separated value
CT - Computed tomography
),(max RxTxD - Maximum propagation time of ultrasound
),(min RxTxD - Minimum propagation time of ultrasound
DAS - Data acquisition system
DDB - Device dependent bitmap
DIB - Device independent bitmap
),( yxDLBP - Concentration profile
DLL - Dynamic link libraries
e - Napier’s constant, 2.71828
ECT - Electrical capacitance tomography
ECIO - External clock with I/O pins enabled
EIT - Electrical impedance tomography
f - Frequency of ultrasound
Fr - Repetition frequency of microcontroller
f/s - Frame per second
GHz - Gigahertz
GUI - Graphical user interface
Hz - Hertz
IC - Integrated circuit
IDE - Integrated Development Environment
i/o - Input and output pins
kHz - Kilohertz
xx
km/s - Kilometer per second
LBP - Linear back projection
l/min - Liter per minute
MHz - Megahertz
mm - Millimeter
MOSFET - Metal-oxide-semiconductor field-effect-transistor
MRI - Magnetic resonance imaging
m/s - Meter per second
m/µs - Meter per microsecond
mm/µs - Millimeter per microsecond
NMR - Nuclear magnetic resonance
ns - Nanosecond
ρ - Density of materials
rP - Reflection coefficient
tP - Transmission coefficient
PCB - Printed circuit board
PCI - Peripheral Component Interconnect
PET - Positron emission tomography
PVC - Polyvinyl chloride
RAM - Random Access Memory
Rx - Receiver
RxTxS , - Signal loss or difference of propagation time
SNR - Signal to noise ratio
T - Period of ultrasound
Tcy - Instruction cycle
Tr - Time resolution of binary counter
Tx - Transmitter
TOF - Time of flight
TotalC - Total concentration
µs - Microsecond
V - Volt(s)
Vp-p. - Peak to peak voltage

xxi
Win32 API - Microsoft® 32 bit Windows™ Application
Programming Interface
z - Acoustic impedance
α - Attenuation coefficient
ε - Permittivity
λ - Wavelength of ultrasound
D∆ - Difference of the propagation time
< - Less than

xxii
LIST OF APPENDICES
APPENDIX TITLE PAGE
A Ultrasonic Sensor Datasheet 194
B 896 Coordinates in Scale (0,0) – (640,640) 196
C Nodes of Transmitter and Receiver 200
D Sensitivity Map of Tx 0 202
E Pictures of Ultrasonic Tomography System 207
F Program Code of DAS Operation 211
G Program Code of Image Reconstruction Function 212
H Acoustic Properties of Liquids 213
I Measurements from Flow Simulation Program 219
J Calibration Data for Flow Monitoring System 221
K Published Papers 223

CHAPTER 1
INTRODUCTION 1.1 An Overview of Process Tomography
Tomography can be defined as making cross-sectional images of an object, as
the Greek word ‘tomos’ means ‘to slice’ and ‘graph’ means ‘image’ (William and
Beck, 1995). A cross-sectional image of the object monitored is called a tomogram,
while the equipment that generates the image is a tomography. Process tomography
is analogous to the application of medical tomographic scanners that examine the
human body, but is applied at industries to examine the industrial process such as
pipelines, stirred reactors, fluidized beds, mixers and separators.
The tomographic imaging is first used in medical field, which is then applied
in the industrial processes. A number of applications of tomographic imaging of
process equipment were described in the 1970s but generally these involved using
ionizing radiation from X-ray or isotope sources (Plaskowski et al., 1995). However,
these were not satisfactory because of the high cost and safety constraints. These
radiation-based methods also used long exposure times which meant that dynamic
measurement of the real-time behavior of flow inside pipelines and process systems
were not feasible. The equipment of the tomography for the industrial application
must also be relatively low cost and able to make measurements rapidly.
In the mid-1980s, there were works started that led to the present generation
of process tomography systems. A project on electrical capacitance tomography
(ECT) for imaging multi-components flow from oil wells and pneumatic conveyors
2
was carried out at the University of Manchester Institute of Science and Technology
(UMIST) in England (William and Beck, 1995). About the same time, a group at the
Morgantown Energy Technology Center in the USA was designing a capacitance
tomography system for measuring the void distribution in gas fluidized beds
(William and Beck, 1995). Hoyle and Xu (1995) had carried out a research about the
design and application of ultrasonic sensor in tomography. Since then, there were
many researches about tomography for the industrial and medical applications
carried out in the United Kingdom (UK) and United States of America (USA).
Until today, there are many researches about tomography carried out at
universities worldwide such as University of Leeds (UK), University of Aberdeen
(UK), University of Pittsburgh (US), University of Melbourne (Australia), Universiti
Teknologi Malaysia and Universiti Sains Malaysia. Besides this, there are
companies that develop and sell commercial tomographic products. Process
Tomography Limited (PTL) is one of the companies that have been supplying
electrical capacitance tomography (ECT) imaging system since 1994. Its partner
company, Tomoflow Ltd was established in 2001 to develop commercial
tomographic multiphase flow meters. There are also many international
symposiums, seminars and world congress on tomography held every year that
attract the participation of many researchers.
1.2 Background Problems
In the 1990s, industry is under pressure to utilize resources more efficiently,
and to satisfy demand and legislation for product quality and reduced environmental
emissions (Plaskowski et al., 1995). Since then, there is a need for a monitoring
instrument that could monitor the industrial processes and provide information to
improve yields, quality, efficiency and overall control of the processes. Often, this
must be done non-invasively by tomographic instruments because the conventional
measuring instrument maybe unsuitable to be exposed to the harsh internal condition
of the pipe or by their presence, the flow inside the pipes is interrupted.

3
In ultrasonic tomography, several researches have been done on gas and
liquid two phase flow regime. Xu et al. (1997) had implemented a gas and liquid
two phase flow regime system by using ultrasonic tomography. The system was
based on a binary logic algorithm and a method of time-of-propagation along straight
path. Yang et al. (1999) had presented a paper on real-time ultrasonic tomography
for two phase flow imaging using a reduced number of transducers. The system
employed a relatively small number of transducers that produced fan-shaped beam
profile to effectively visualize the cross-sectional of the pipe. A better reconstruction
quality was achieved by combining the transmission and reflection mode of
ultrasound. An investigation on cross-sectional distributions of gas and solid
holdups in slurry bubble column using ultrasonic tomography was carried out by
Warsito et al. (1999). The results showed the time-averaged cross-sectional
distribution of gas and solid holdups in slurry bubble column.
At Universiti Teknologi Malaysia, Khor (2002) had done project on
comparison between air and liquid using ultrasonic sensor in process tomography.
Mohd Hafiz (2003) had implemented water and particles flow system using
transmission mode of ultrasonic tomography. The attenuation of the ultrasound was
taken as the measurements to reconstruct the cross-sectional image. No ultrasonic
tomography system for the imaging of two liquids such as water and oil has been
studied so far.
In optical tomography, Sallehuddin (2000) has used optical fibers for
measurement of gas bubbles in a vertical water column. Sallehuddin (2000) showed
that optical fibers are capable of making concentration measurements of small
bubbles of diameter 1 to 10 mm in water with volumetric flow rates up to 1 l/min,
and large bubbles of diameter 15 to 20 mm in water with volumetric flow rates up to
3 l/min on a hydraulic conveyor. However, if optical tomography is to be applied,
the material of the pipe should be transparent or holes should be made around the
pipe to accommodate the optical sensors so that the optical beam could penetrate
through the flow. At Universiti Teknologi Malaysia (UTM), the invasive optical
tomography system developed by Chan (2002) and Pang (2004) are intended for
imaging solid particles in the air.

4
1.3 Problem Statements
The oil industries today such as cooking oil and palm oil industries face the
problem to monitor the efficiency of their oil production. A monitoring system
which can be applied non-invasively is much needed to monitor their oil production.
Besides, the monitoring system should be able to provide the information about the
composition of the oil. The composition of water that is mixed in the oil should be
computed to find the efficiency of the oil production. In this situation, tomography is
the technology that can be applied to solve the problem.
The major target of this project is to implement a monitoring system for water
and oil flow using ultrasonic tomography. The system must able to provide
information about the composition profile of the water and oil as well as the cross-
sectional image of the flow. Studies need to be carried out, which included the
hardware’s fixture design, mounting technique, transmitter circuit design, receiver
circuit design, hardware interfacing, image reconstruction algorithm and software
programming.
5
1.4 Importance of Study
The ultrasonic tomography is one of the non-invasive techniques that can be
used in the industry for monitoring the flow composition of two liquids flow such as
water and oil. The non-invasive method provides the ultrasonic tomography with
easy installation and portable convenience. The ultrasonic sensors are very easy to
be mounted around the pipeline compared with other sensors. The installation of the
ultrasonic tomography system also does not require the shut down of the industry’s
process. Moreover, this monitoring system does not disturb the internal flow of the
pipe. All this benefits support the ultrasonic tomography to be chosen over the other
invasive system. It is obvious that the ultrasonic tomography of this research has the
potential to contribute to the cooking oil, palm oil and petroleum industries. In this
case, the ultrasonic tomography can be applied to determine the composition of the
water and oil for the palm oil and the petroleum.
There are several inventions using the ultrasonic techniques for determining
the fluid composition that have already obtained the United States Patent such as
U.S. Patent 5,473,934 by Cobb (1995), U.S. Patent 4,059,987 by Dowling et al.
(1977) and U.S. Patent 4,656,869 by Zacharias (1987). However, those inventions
required fluid samples taken from the pipelines or predetermined reference data
saved in computer. Some of the inventions also used invasive techniques. Most
obviously, those inventions did not display the cross-sectional image showing the
composition of the fluid because they were not tomography systems. One of the
inventions for monitoring the fluid composition is by Cobb (1995) using ultrasonic
non-intrusive technique. Cobb (1995)’s invention involved measurements from the
fluid, by which the fluid composition was then determined based on the calibrated
data from analytical measurements of fluid samples. Another invention by Urmson
et al. (1991) was an apparatus for determining the composition of fluid mixture by
comparing acoustic travel-time of both changing and reference fluid samples.
Invention by Tavlarides et al. (1989) was for measuring fractional volumetric holdup
in a two liquids phase based on the acoustic velocities. Zacharias (1987) in his
invention described a method of measuring the amount of water in crude oil pipeline
by extracting a sample from the pipeline. Inventions by Smith (1985) and Dowling

6
et al. (1977) were also used for determining the fluid composition that based on
measurements of acoustic velocity. In short, those inventions used the same
ultrasonic sensors as the ultrasonic tomography system, but the ultrasonic
tomography system can display cross-sectional images of the pipeline in real time,
determine the fluid composition based on concentration profile, required no samples
taken from the fluids and non-invasive.
1.5 Research Objectives
The primary objective of this project is to determine the concentration of
water and oil flow using ultrasonic tomography. The system must also provide the
information about the concentration and display the cross-sectional image of the pipe
in real time. The research objectives cover the development of sensor’s fixture,
excitation circuits, and signal conditioning circuits, hardware interfacing and
development of software using Microsoft Visual Basic 6.0. The summary of the
objectives of this project are listed as follows:
(i) To determine the composition of water and oil flow by implementing
the transmission mode of ultrasonic tomography.
(ii) To study the characteristic of ultrasound and make use of it in
monitoring the process of water and oil flow.
(iii) To search material for ultrasonic sensors and its hardware fabrication.
(iv) To design and implement signal conditioning circuits that can
measure the time of flight (TOF) of ultrasonic wave and process the
signals.
(v) To use the microcontroller as the switching device to control the
signal generator, signal conditioning circuits and the data acquisition
system (DAS) card.
(vi) To implement the principle of flow imaging by creating a custom
software using Microsoft Visual Basic 6.0 that can provide
information about the concentration of the water and oil flow.
7
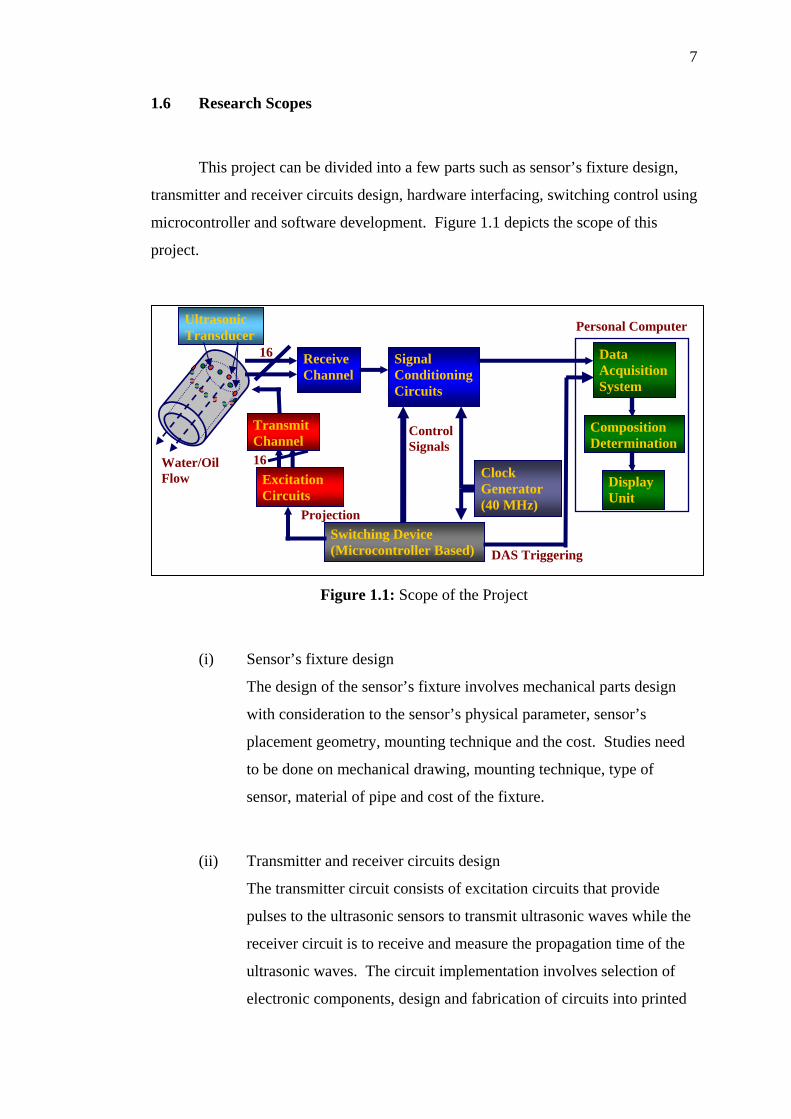
1.6 Research Scopes
This project can be divided into a few parts such as sensor’s fixture design,
transmitter and receiver circuits design, hardware interfacing, switching control using
microcontroller and software development. Figure 1.1 depicts the scope of this
project.
Ultrasonic Transducer
Personal Computer
Figure 1.1: Scope of the Project
(i) Sensor’s fixture design
The design of the sensor’s fixture involves mechanical parts design
with consideration to the sensor’s physical parameter, sensor’s
placement geometry, mounting technique and the cost. Studies need
to be done on mechanical drawing, mounting technique, type of
sensor, material of pipe and cost of the fixture.
(ii) Transmitter and receiver circuits design
The transmitter circuit consists of excitation circuits that provide
pulses to the ultrasonic sensors to transmit ultrasonic waves while the
receiver circuit is to receive and measure the propagation time of the
ultrasonic waves. The circuit implementation involves selection of
electronic components, design and fabrication of circuits into printed
Switching Device (Microcontroller Based)
Water/Oil Flow
Signal ConditioningCircuits
Receive Channel
16 Data AcquisitionSystem
Composition Determination
Display Unit
Control Signals
Excitation Circuits
Transmit Channel 16
Projection
Clock Generator (40 MHz)
DAS Triggering

8
circuit board (PCB), noise reduction and consideration of signals
interfacing with the data acquisition system. The design of the signal
conditioning circuit involves an amplifier circuit to amplify the
received signal, a zero-crossing detector to detect the first arriving
signal, a signal holding circuit to hold the first signal from the zero-
crossing detector and a binary counter to measure the propagation
time. Figure 1.2 below shows the layout design of the signal
conditioning circuits.
Figure 1.2: Layout of Signal Conditioning Circuit
(iii) Switching control using microcontroller
The microcontroller is used for timing control purpose to control the
excitation circuits, signal holding circuits and data sampling of the
data acquisition system (DAS) card. Handshaking is established
between the hardware system and the computer by the
microcontroller. Programming of the microcontroller involves
accurate timing calculation so as to provide the control signals at the
right time.
Zero-crossing detector
Received Signal
Amplifier
Clock 40 MHz
Reset Control
Holding Control
Signal HoldingBinary counter
8 Counting Enable

9
(iv) Hardware interfacing
The hardware interfacing is implemented by using a data acquisition
system (DAS) card. Before doing the interfacing, the input range of
the signals, method to trigger the DAS, method of sampling
measurements, setup and configuration of the DAS in the computer
need to be taken into consideration. 128 signals from the 16 binary
counters should be sampled into the computer at one time. Checking
must be done to make sure that the sampled measurements by using
the DAS are correct.
(v) Software development
Software development includes the graphical user interface (GUI)
design using Microsoft Visual Basic 6.0, implementation of image
reconstruction algorithm, tomogram drawing, DAS configuration and
operation, sensor modeling, sensitivity maps finding, solution of
forward problem and data transferring. When writing the software,
consideration is given to make sure that better performance and faster
speed are achieved. The purpose of the software development is of
course is to obtain the concentration profile and cross-sectional image
of the water and oil flow. Visual Basic 6.0 is chosen because it is
easier to learn Visual Basic 6.0 than other programming languages
such as Visual C++ 6.0. A lot of resources about Visual Basic 6.0 can
also be found from the internet.

10
1.7 Thesis Structures
Chapter I of the thesis presents an overview of process tomography,
background problems that lead to the implementation of this research and problem
statements that this research is going to solve. The importance of this study, research
objectives and scope of the research is also included.
Chapter II provides more introductions to process tomography system, type
of tomography sensors and several measurement methods of component
concentrations.
Chapter III introduces more on ultrasound, several wave propagation methods
of ultrasound and sensing modes of ultrasonic tomography.
Chapter IV describes the sensor modeling, sensitivity maps computation,
computer interfacing using DAS card and hardware design of the ultrasonic
tomography system. The purpose of the sensor modeling is to solve the forward
problem and to compute the sensitivity maps. The design of the transmitter and
receiver circuits will be described in details in this chapter.
Chapter V describes the implementation of the image reconstruction
algorithm, composition determination based on concentration profile, operation of
the DAS card, software development, programming structure and techniques as well
as flow simulation program for several flow models.
Chapter VI includes all the results obtained from the experiments and the
results’ analysis. The error of the measurements and performance of the flow
monitoring system will be found out. Comparison between the results obtained from
experiments and results obtained from the flow model is also shown in this chapter.
Chapter VII is written to discuss the conclusion and important contributions
from this research and suggestion for the future work.

REFERENCES
Barshan, B (2000). “Fast Processing Techniques for Accurate Ultrasonic Range
Measurements.” Meas. Sci. Technol., Vol. 11, 45-50.
Bidin, A.R., Green, R.G., Shackleton, M.E., Stott, A.L. and Taylor, R.W. (1995).
“Electrodynamic Sensors for Process Tomography.” In Williams, R.A. and
Beck, M.S. (1995). “Process Tomography - Principles, Techniques and
Application.” Jordan Hill: Butterworth Heinemann Ltd. 101-117.
Blitz, J. (1967). “Fundamentals of Ultrasonics.” 2nd ed. Butterworth: Butterworth
& Co (Publishers) Ltd.
Blitz, J. (1971). “Ultrasonics: Methods and Applications.” Butterworth:
Butterworth & Co (Publishers) Ltd.
Boylestad, R.L. and Nashelsky, L. (1999). “Electronic Devices and Circuit
Theory.” 7th ed. United States of America: Prentice Hall Inc.
Bray, D.E. and McBride D. (1992). “Nondestructive Testing Techniques.” United
States of America: John Wiley & Sons.
Brown, G.J., Reilly, D. and Mills, D. (1996). “Development of an Ultrasonic
Tomography System for Application in Pneumatic Conveying.” Meas. Sci.
Technol., Vol. 7, 396-405.

188
Buchanan, W. (1999). “PC Interfacing, Communications and Windows
Programming.” Great Britain: Addison-Wesley.
Chan Kok San (2001). “Image Reconstruction for Optical Tomography.” Universiti
Teknologi Malaysia: B.Sc. Thesis.
Chan Kok San (2002). “Real Time Image Reconstruction for Fan Beam Optical
Tomography System.” Universiti Teknologi Malaysia: M.Sc. Thesis.
Cheeke, J.D.N. (2002). “Fundamentals and Applications of Ultrasonic Waves.”
United States of America: CRC Press LLC.
Cobb, W. (1995). “Ultrasonic Fluid Composition Monitor.” (U.S. Patent
5,473,934).
Deitel, H.M., Deitel, P.J. and Nieto, T.R. (1999). “Visual Basic 6.0 – How to
Program.” New Jersey: Prentice Hall.
Dowling, D.J., and Schoen, W. (1977). “Apparatus and Method for Measuring the
Water Content of Oil Flowing in a Pipe.” (U.S. Patent 4,059,987).
Floyd, T.L. (2000). “Digital Fundamentals.” 7th ed. Upper Saddle River, New
Jersey: Prentice Hall Inc.
Gamio, J.C. and Ortiz-Aleman, C. (2003). “An Interpretation of the Linear Back
Projection Algorithm used in Capacitance Tomography.” 3rd World Congress on
Industrial Process Tomography. Canada: The Virtual Centre for Industrial
Process Tomography. 427-432.
Gooberman, G. L. (1968). “Ultrasonics – Theory and Application.” London: The
English Universities Press Ltd.

189
Hall, I.D., McNab, A. and Hayward, G. (1999). “Improved Ultrasonic Image
Generation through Tomographic Image Fusion.” Ultrasonics, Elsevier, Vol. 37,
No. 433-443.
Halmshaw, R. (1993). “Non-Destructive Testing.” 2nd ed. Great Britain: Edward
Arnold, Hodder & Stoughton Ltd.
Holstein, P., Raabe, A., Muller, R., Barth, M., Mackenzia, D. and Starke, E. (2004).
“Acoustic Tomography on the Basis of Travel-time Measurement.” Meas. Sci.
Technol., Vol. 15, 1420-1428.
Hoyle, B.S. (1996). “Process Tomography using Ultrasonic Sensor.” Meas. Sci.
Technol., Vol. 7, 272-280.
Hoyle, B.S., Xu, L.A. (1995). “Ultrasonic Sensors.” In Williams, R.A. and Beck,
M.S. (1995). “Process Tomography - Principles, Techniques and Application.”
Jordan Hill: Butterworth Heinemann Ltd. 119-149.
Hull, J.B. and John, V.B. (1988). “Non-destructive Testing.” Hampshire:
Macmillan Education Ltd.
ICP DAS Co. (2003). “PIO-D144/D168A – User’s Manual.” Taiwan: ICP DAS
Co. Ltd..
Ingleby, P. and Wright, W.M.D. (2002). “Ultrasonic Imaging in Air using Fan-beam
Tomography and Electrostatic Transducers.” Ultrasonics, Elsevier, Vol. 40, 507-
511.
Kak, A.C. and Slaney, M. (1988). “Principles of Computerized Tomographic
Imaging.” USA: IEEE Press.

190
Khor Kah Yen (2002). “Comparison between Air and Liquid using Ultrasonic
Sensor in Process Tomography.” Universiti Teknologi Malaysia: B.Sc. Thesis.
Kinsler, L.E., Frey, A.R., Coppens, A.B. and Sanders, J.V. (1982). “Fundamentals
of Acoustics.” 3rd ed. Singapore: John Wiley & Sons.
Krautkramer, J. and Krautkramer, H. (1983). “Ultrasonic Testing of Materials.”
3rd ed. New York: Springer-Verlag.
Li, W. and Hoyle, B.S. (1997). “Ultrasonic Process Tomography using Multiple
Active Sensors for Maximum Real-time Performance.” Chemical Engineering
Science, Vol. 52, No. 13, 2161-2170.
Malyarenko, E.V. and Hinders, M.K. (2001). “Ultrasonic Lamb Wave Diffraction
Tomography.” Ultrasonics, Elsevier, Vol. 39, 269-281.
McKee, S.L. (1995). “Applications of Nuclear Magnetic Resonance Tomography.”
In Williams, R.A. and Beck, M.S. (1995). “Process Tomography - Principles,
Techniques and Application.” Jordan Hill: Butterworth Heinemann Ltd. 539-
548.
Microchip (2000). “Analog / Interface Handbook.” United States of America:
Microchip Technology Inc.
Microchip (2001). “PIC16F87X Data Sheet.” United States of America: Microchip
Technology Inc.
Mohd. Hafiz bin Fazalul Rahiman (2003). “Image Reconstruction using
Transmission Mode of Ultrasonic Tomography in Water-particles Flow.”
Universiti Teknologi Malaysia: B.Sc. Thesis.

191
Mohd. Hezri bin Fazalul Rahiman (2002). “Real-time Velocity Profile Generation of
Powder Conveying using Electrical Charge Tomography.” Universiti Teknologi
Malaysia: M.Sc. Thesis.
Myers, P.E., Beesley, M. and Martin, P.D. (1994). “Ultrasound Imaging In Large
Gas and Liquid Processing Vessels.” ECAPT’94, 354-358.
Naidu, P.S., Vasuki, A., Satyamurthy, P. and Anand, L. (1995). “Diffraction
Tomographic Imaging with a Circular Array.” IEEE Transactions on Ultrasonic,
Ferroelectrics and Frequency Control, July 1995: IEEE, Vol. 42, No. 4.
Opielinski, K.J. and Gudra, T. (2000). “Ultrasound Transmission Tomography
Image Distortions caused by the Refraction Effect.” Elsevier, Vol. 38, 424-429.
Pang Jon Fea (2004). “Real-time Velocity and Mass Flow Rate Measurement using
Optical Tomography.” Universiti Teknologi Malaysia: M.Sc. Thesis.
Perry, G. (1998). “Sams Teach Yourself Visual Basic 6.0 in 21 Days.” Indianapolis:
Macmillan Computer Publishing.
Pintavirooj, C., Romputtal, A., Ngamlamiad, A., Withayachumnankul, W. and
Hamamoto, K. (2003). “Ultrasonic Refractive Index Tomography.” Journal of
WSCG, Vol. 12, No.1-3.
Plaskowski, A., Beck, M.S., Thorn, R. and Dyaskowki, T. (1995). “Imaging
Industrial Flows - Application of Electrical Process Tomography.” Institute of
Physics Publishing Bristol and Philadelphia.
Rozenberg, L. D. (1973). “Physical Principles of Ultrasonic Technology.” New
York: Plenum Press.

192
Ruzairi Abdul Rahim (1996). “A Tomography Imaging System for Pneumatic
Conveyors using Optical Fibers.” Sheffield Hallam University: Ph.D. Thesis.
Sallehuddin Ibrahim (2000). “Measurements of Gas Bubbles in a Vertical Water
Column using Optical Tomography.” Sheffield Hallam University: Ph.D. Thesis.
Sanderson, M.L. and Yeung, H. (2002). “Guidelines for the Use of Ultrasonic Non-
invasive Metering Techniques.” Flow Measurement and Instrumentation,
Elsevier, Vol. 13, No. 125-142.
Schlaberg, H.I., Yang, M., Hoyle, B.S., Beck, M.S. and Lenn, C. (1997). “Wide-
angle Transducers for Real-time Ultrasonic Process Tomography Imaging
Applications.” Ultrasonics, Elsevier, Vol. 35, No. 213-221.
Smith, G.E., (1985). “Ultrasonic Densitometer for Liquid Slurries.” (U.S. Patent
4,522,068).
Stamnes, J.J. and Wedberg, T.C. (1994). “Diffraction Tomography Applications in
Geophysics, Ultrasonics and Optics.” ECAPT’94, 244-255.
Szilard, J. (1982). “Ultrasonic Testing - Non-conventional Testing Techniques.”
New York: John Wiley & Sons.
Tavlarides, L.L., and Bonnet, J.C. (1989). “Self-Calibrating Ultrasonic
Measurement of Dispersed Phase Volumetric Holdup in Liquid/Liquid
Dispersions.” (U.S. Patent 4,852,396).
Urmson, J., Pearson, A. and Gidwani, S. (1991). “Method and Apparatus for Fluid
Mixture Monitoring, Constituent Analysis and Composition Control.” (U.S.
Patent 5,060,507).

193
Warsito, Ohkawa, M., Kawata N. and Uchida S. (1999). “Cross-sectional
Distributions of Gas and Solid Holdups in Slurry Bubble Column Investigated by
Ultrasonic Computed Tomography.” Chemical Engineering Science, Vol. 54,
4711-4728.
Williams, R.A. and Beck, M.S. (1995). “Process Tomography - Principles,
Techniques and Application.” Jordan Hill: Butterworth Heinemann Ltd.
Wojnar, L. (1999). “Image Analysis: Application in Materials Engineering.”
United States of America: CRC Press LLC.
Xie, C.G. (1995). “Image Reconstruction.” In Williams, R.A. and Beck, M.S.
(1995). “Process Tomography - Principles, Techniques and Application.”
Jordan Hill: Butterworth Heinemann Ltd. 281-323.
Xu, L.J. and Xu, L.A. (1997). “Ultrasound Tomography System used for Monitoring
Bubbly Gas/Liquid Two Phase Flow.” IEEE Transactions on Ultrasonic,
Ferroelectrics and Frequency Control, January 1997: IEEE, Vol. 44, No. 1.
Xu, L.J., Han, Y.T., Xu, L.A. and Yang J.S. (1997). “Application of Ultrasonic
Tomography to Monitoring Gas/Liquid Flow.” Chemical Engineering Science,
Vol. 52, No. 13.
Yang, M., Schlaberg, H.I., Hoyle, B.S., Beck, M.S. and Lenn, C. (1999). “Real-time
Ultrasound Process Tomography for Two-phase Flow Imaging using a Reduced
Number of Transducers.” IEEE Transactions on Ultrasonic, Ferroelectrics and
Frequency Control, May 1999: IEEE, Vol. 46, No. 3.
Zacharias, E.M. (1987). “Method of Measuring the Amount of Water Flowing in a
Crude Oil Pipeline.” (U.S. Patent 4,656,869).