malaysia keluaran dalam negeri kasar suku...
TRANSCRIPT
MALAYSIA
KELUARAN DALAM NEGERI KASAR SUKU TAHUNAN
QUARTERLY GROSS DOMESTIC PRODUCT
Suku Kedua Second Quarter
Dikeluarkan pada: Released on:
Jabatan Perangkaan Malaysia
Department of Statistics, Malaysia
Ogos August
15 2014
2014

i
KATA PENGANTAR
Penerbitan ini membentangkan anggaran Akaun Pengeluaran dan
Perbelanjaan Malaysia bagi suku kedua 2014 dan anggaran suku tahunan
dari tahun 2011 hingga 2013. Anggaran disusun mengikut aktiviti pengeluaran
dan jenis perbelanjaan berdasarkan saranan daripada Sistem Akaun Negara
1993 dan 2008, Pertubuhan Bangsa-Bangsa Bersatu.
Data pelarasan musim dimuatkan dalam penerbitan ini. Pelarasan musim
menyingkirkan faktor musim dalam siri masa dan ia adalah selaras dengan
amalan negara-negara lain. Data-data ini amat berguna untuk ahli ekonomi,
pembuat dasar dan penganalisis siri masa.
Inti sari ekonomi Malaysia untuk suku kedua 2014 disediakan dalam bahagian
pertama penerbitan ini. Nota ringkas berkenaan kaedah, konsep, definisi,
sumber data dan indikator-indikator ekonomi makro terpilih disediakan dalam
penerbitan ini bagi membantu meningkatkan pemahaman ke atas anggaran
akaun negara.
Jabatan ingin merakamkan setinggi penghargaan atas kerjasama semua
pihak dalam membekalkan data yang diperlukan. Sebarang pandangan dan
cadangan ke arah memperbaiki penerbitan ini pada masa hadapan amatlah
dihargai.
Datuk Dr. Haji Abdul Rahman Hasan
Ketua Perangkawan
Malaysia
Ogos 2014
ii
PREFACE
This publication presents the estimates of National Production and
Expenditure Accounts for the second quarter of 2014 and the quarterly
estimates from the year 2011 to 2013. The estimates are compiled by
production activity and type of expenditure based on the recommendations of
System of National Accounts 1993 and 2008, United Nations.
Seasonal adjustment data are included in this publication. The seasonal
adjustment eliminates seasonal factors within the time series and it is in line
with other countries’ practices. These data will be useful for economists,
policy & decision makers and time series analysts.
Highlights of Malaysia’s economy for the second quarter 2014 are provided in
the first part of this publication. Brief notes on methodology, concepts,
definitions, sources of data and selected macroeconomic indicators are
available in the publication to facilitate greater understanding of national
accounts estimates.
The Department acknowledges the cooperation of all parties in providing the
required data. All comments and suggestions towards improving future
publications are greatly appreciated.
Datuk Dr. Haji Abdul Rahman Hasan
Chief Statistician
Malaysia
August 2014
iii
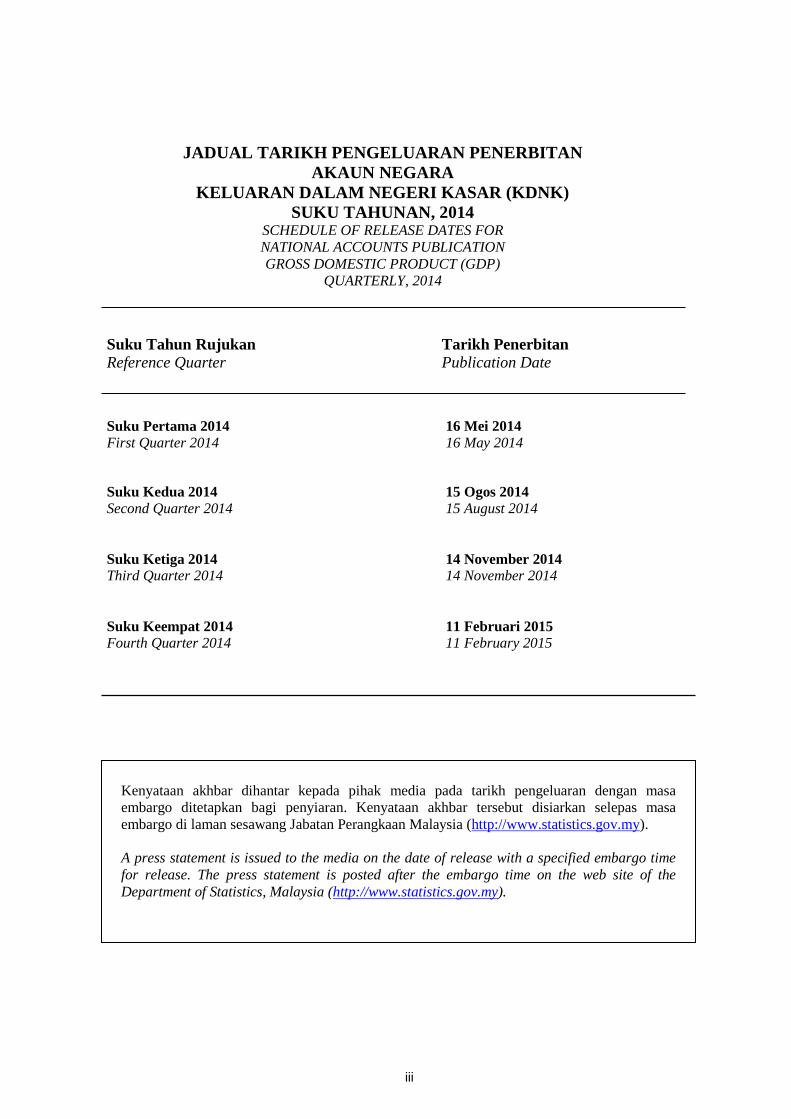
JADUAL TARIKH PENGELUARAN PENERBITAN
AKAUN NEGARA
KELUARAN DALAM NEGERI KASAR (KDNK)
SUKU TAHUNAN, 2014 SCHEDULE OF RELEASE DATES FOR
NATIONAL ACCOUNTS PUBLICATION
GROSS DOMESTIC PRODUCT (GDP)
QUARTERLY, 2014
Suku Tahun Rujukan Tarikh Penerbitan
Reference Quarter Publication Date
Suku Pertama 2014 16 Mei 2014
First Quarter 2014 16 May 2014
Suku Kedua 2014 15 Ogos 2014
Second Quarter 2014 15 August 2014
Suku Ketiga 2014 14 November 2014
Third Quarter 2014 14 November 2014
Suku Keempat 2014 11 Februari 2015
Fourth Quarter 2014 11 February 2015
Kenyataan akhbar dihantar kepada pihak media pada tarikh pengeluaran dengan masa
embargo ditetapkan bagi penyiaran. Kenyataan akhbar tersebut disiarkan selepas masa
embargo di laman sesawang Jabatan Perangkaan Malaysia (http://www.statistics.gov.my).
A press statement is issued to the media on the date of release with a specified embargo time
for release. The press statement is posted after the embargo time on the web site of the
Department of Statistics, Malaysia (http://www.statistics.gov.my).
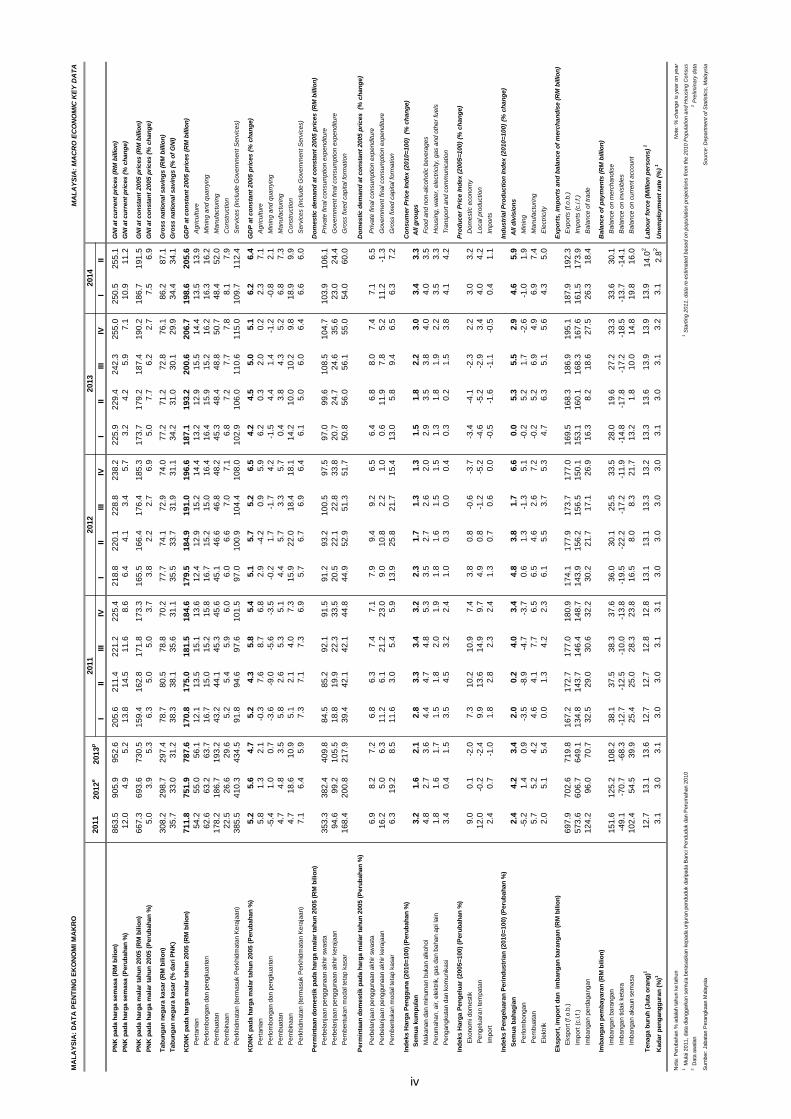
MA
LA
YS
IA:
MA
CR
O E
CO
NO
MIC
KE
Y D
AT
A
III
III
IVI
IIIII
IVI
IIIII
IVI
II
PN
K p
ad
a h
arg
a s
em
asa (
RM
bilio
n)
86
3.5
90
5.9
95
2.6
20
5.6
21
1.4
22
1.2
22
5.4
21
8.8
22
0.1
22
8.8
23
8.2
22
5.9
22
9.4
24
2.3
25
5.0
25
0.5
25
5.1
GN
I at
cu
rren
t p
rices (
RM
billio
n)
PN
K p
ad
a h
arg
a s
em
asa (
Peru
bah
an
%)
12
.04
.95
.21
3.8
14
.51
1.6
8.6
6.4
4.1
3.4
5.7
3.2
4.2
5.9
7.1
10
.91
1.2
GN
I at
cu
rren
t p
rices (
% c
han
ge)
PN
K p
ad
a h
arg
a m
ala
r ta
hu
n 2
005 (
RM
bilio
n)
66
7.3
69
3.6
73
0.5
15
9.4
16
2.8
17
1.8
17
3.3
16
5.5
16
6.4
17
6.4
18
5.3
17
3.7
17
9.2
18
7.4
19
0.2
18
6.7
19
1.5
GN
I at
co
nsta
nt
2005 p
rices (
RM
billio
n)
PN
K p
ad
a h
arg
a m
ala
r ta
hu
n 2
005 (
Peru
bah
an
%)
5.0
3.9
5.3
6.3
5.0
5.0
3.7
3.8
2.2
2.7
6.9
5.0
7.7
6.2
2.7
7.5
6.9
GN
I at
co
nsta
nt
2005 p
rices (
% c
han
ge)
Tab
un
gan
neg
ara
kasar
(RM
bilio
n)
30
8.2
29
8.7
29
7.4
78
.78
0.5
78
.87
0.2
77
.77
4.1
72
.97
4.0
77
.27
1.2
72
.87
6.1
86
.28
7.1
Gro
ss n
ati
on
al savin
gs (
RM
billio
n)
Tab
un
gan
neg
ara
kasar
(% d
ari
PN
K)
35
.73
3.0
31
.23
8.3
38
.13
5.6
31
.13
5.5
33
.73
1.9
31
.13
4.2
31
.03
0.1
29
.93
4.4
34
.1G
ross n
ati
on
al savin
gs (
% o
f G
NI)
KD
NK
pad
a h
arg
a m
ala
r ta
hu
n 2
005 (
RM
bilio
n)
71
1.8
75
1.9
78
7.6
17
0.8
17
5.0
18
1.5
18
4.6
17
9.5
18
4.9
19
1.0
19
6.6
18
7.1
19
3.2
20
0.6
20
6.7
19
8.6
20
5.6
GD
P a
t co
nsta
nt
2005 p
rices (
RM
billio
n)
P
ert
ania
n5
4.2
55
.05
6.1
12
.11
3.5
15
.11
3.6
12
.41
2.9
15
.21
4.4
13
.21
2.9
15
.51
4.4
13
.51
3.9
A
griculture
P
erlom
bongan d
an p
engkuarian
62
.66
3.2
63
.71
6.7
15
.01
5.2
15
.81
6.7
15
.21
5.0
16
.41
6.4
15
.91
5.2
16
.21
6.3
16
.2 M
inin
g a
nd q
uarr
yin
g
P
em
buata
n1
78
.21
86
.71
93
.24
3.2
44
.14
5.3
45
.64
5.1
46
.64
6.8
48
.24
5.3
48
.44
8.8
50
.74
8.4
52
.0 M
anufa
ctu
ring
P
em
bin
aan
22
.52
6.6
29
.65
.25
.45
.96
.06
.06
.67
.07
.16
.87
.27
.77
.88
.17
.9 C
onstr
uction
P
erk
hid
mata
n (
term
asuk P
erk
hid
mata
n K
era
jaan)
38
5.5
41
0.3
43
4.5
91
.89
4.6
97
.61
01
.59
7.0
10
0.9
10
4.4
10
8.0
10
2.9
10
6.0
11
0.6
11
5.0
10
9.7
11
2.4
S
erv
ices (
inclu
de G
overn
ment S
erv
ices)
KD
NK
pad
a h
arg
a m
ala
r ta
hu
n 2
005 (
Peru
bah
an
%)
5.2
5.6
4.7
5.2
4.3
5.8
5.4
5.1
5.7
5.2
6.5
4.2
4.5
5.0
5.1
6.2
6.4
GD
P a
t co
nsta
nt
2005 p
rices (
% c
han
ge)
P
ert
ania
n5
.81
.32
.1-0
.37
.68
.76
.82
.9-4
.20
.95
.96
.20
.32
.00
.22
.37
.1 A
griculture
P
erlom
bongan d
an p
engkuarian
-5.4
1.0
0.7
-3.6
-9.0
-5.6
-3.5
-0.2
1.7
-1.7
4.2
-1.5
4.4
1.4
-1.2
-0.8
2.1
M
inin
g a
nd q
uarr
yin
g
P
em
buata
n4
.74
.83
.55
.82
.65
.35
.14
.45
.73
.35
.70
.43
.84
.35
.26
.87
.3 M
anufa
ctu
ring
P
em
bin
aan
4.7
18
.61
0.9
5.1
2.1
4.0
7.3
15
.92
2.0
18
.41
8.1
14
.21
0.0
10
.29
.81
8.9
9.9
C
onstr
uction
P
erk
hid
mata
n (
term
asuk P
erk
hid
mata
n K
era
jaan)
7.1
6.4
5.9
7.3
7.1
7.3
6.9
5.7
6.7
6.9
6.4
6.1
5.0
6.0
6.4
6.6
6.0
S
erv
ices (
inclu
de G
overn
ment S
erv
ices)
Perm
inta
an
do
mesti
k p
ad
a h
arg
a m
ala
r ta
hu
n 2
005 (
RM
bilio
n)
Do
mesti
c d
em
an
d a
t co
nsta
nt
2005 p
rices (
RM
billio
n)
P
erb
ela
nja
an p
enggunaan a
khir s
wasta
3
53
.33
82
.44
09
.88
4.5
85
.29
2.1
91
.59
1.2
93
.21
00
.59
7.5
97
.09
9.6
10
8.5
10
4.7
10
3.9
10
6.1
P
rivate
fin
al consum
ption e
xpenditure
P
erb
ela
nja
an p
enggunaan a
khir k
era
jaan
94
.69
9.2
10
5.5
18
.81
9.9
22
.33
3.5
20
.52
2.1
22
.83
3.8
20
.72
4.7
24
.63
5.6
23
.02
4.4
G
overn
ment final consum
ption e
xpenditure
P
em
bentu
kan m
odal te
tap k
asar
16
8.4
20
0.8
21
7.9
39
.44
2.1
42
.14
4.8
44
.95
2.9
51
.35
1.7
50
.85
6.0
56
.15
5.0
54
.06
0.0
G
ross fix
ed c
apital fo
rmation
Perm
inta
an
do
mesti
k p
ad
a h
arg
a m
ala
r ta
hu
n 2
005 (
Peru
bah
an
%)
Do
mesti
c d
em
an
d a
t co
nsta
nt
2005 p
rices (%
ch
an
ge)
P
erb
ela
nja
an p
enggunaan a
khir s
wasta
6
.98
.27
.26
.86
.37
.47
.17
.99
.49
.26
.56
.46
.88
.07
.47
.16
.5 P
rivate
fin
al consum
ption e
xpenditure
P
erb
ela
nja
an p
enggunaan a
khir k
era
jaan
16
.25
.06
.31
1.2
6.1
21
.22
3.0
9.0
10
.82
.21
.00
.61
1.9
7.8
5.2
11
.2-1
.3 G
overn
ment final consum
ption e
xpenditure
P
em
bentu
kan m
odal te
tap k
asar
6.3
19
.28
.51
1.6
3.0
5.4
5.9
13
.92
5.8
21
.71
5.4
13
.05
.89
.46
.56
.37
.2 G
ross fix
ed c
apital fo
rmation
Ind
eks H
arg
a P
en
gg
un
a (
2010=
100) (P
eru
bah
an
%)
Co
nsu
mer
Pri
ce In
dex (
2010=
100)
(%
ch
an
ge)
S
em
ua k
um
pu
lan
3.2
1.6
2.1
2.8
3.3
3.4
3.2
2.3
1.7
1.3
1.3
1.5
1.8
2.2
3.0
3.4
3.3
A
ll g
rou
ps
M
akanan d
an m
inum
an b
ukan a
lkohol
4.8
2.7
3.6
4.4
4.7
4.8
5.3
3.5
2.7
2.6
2.0
2.9
3.5
3.8
4.0
4.0
3.5
F
ood a
nd n
on-a
lcoholic
bevera
ges
P
eru
mahan, air, ele
ktr
ik, gas d
an b
ahan a
pi la
in
1.8
1.6
1.7
1.5
1.8
2.0
1.9
1.8
1.6
1.5
1.5
1.3
1.8
1.9
2.2
3.5
3.3
H
ousin
g, w
ate
r, e
lectr
icity, gas a
nd o
ther
fuels
P
engangkuta
n d
an k
om
unik
asi
3.4
0.4
1.5
3.5
4.5
3.2
2.4
1.0
0.3
0.0
0.4
0.3
0.2
1.5
3.8
4.1
4.2
T
ransport
and c
om
munic
ation
Ind
eks H
arg
a P
en
gelu
ar
(2005=
100)
(Peru
bah
an
%)
Pro
du
cer
Pri
ce In
dex (
2005=
100)
(% c
han
ge)
E
konom
i dom
estik
9.0
0.1
-2.0
7.3
10
.21
0.9
7.4
3.8
0.8
-0.6
-3.7
-3.4
-4.1
-2.3
2.2
3.0
3.2
D
om
estic e
conom
y
P
engelu
ara
n tem
pata
n
12
.0-0
.2-2
.49
.91
3.6
14
.99
.74
.90
.8-1
.2-5
.2-4
.6-5
.2-2
.93
.44
.04
.2 L
ocal pro
duction
Im
port
2
.40
.7-1
.01
.82
.82
.32
.41
.30
.70
.60
.0-0
.5-1
.6-1
.1-0
.50
.41
.1 Im
port
s
Ind
eks P
en
gelu
ara
n P
eri
nd
ustr
ian
(2010=
100)
(Peru
bah
an
%)
Ind
ustr
ial P
rod
ucti
on
In
dex (
2010=
100)
(% c
han
ge)
S
em
ua b
ah
ag
ian
2
.44
.23
.42
.00
.24
.03
.44
.83
.81
.76
.60
.05
.35
.52
.94
.65
.9 A
ll d
ivis
ion
s
P
erlom
bongan
-5.2
1.4
0.9
-3.5
-8.9
-4.7
-3.7
0.6
1.3
-1.3
5.1
-0.2
5.2
1.7
-2.6
-1.0
1.9
M
inin
g
P
em
buata
n
5.7
5.2
4.2
4.6
4.1
7.7
6.5
6.5
4.6
2.6
7.2
-0.2
5.2
6.9
4.9
6.9
7.4
M
anufa
ctu
ring
E
lektr
ik
2.0
5.1
5.4
0.0
1.3
4.2
2.3
6.1
5.5
3.7
5.3
4.7
6.3
5.1
5.6
4.3
5.0
E
lectr
icity
Eksp
ort
, im
po
rt d
an
im
ban
gan
bara
ng
an
(R
M b
ilio
n)
Exp
ort
s, im
po
rts a
nd
bala
nce o
f m
erc
han
dis
e (
RM
billio
n)
E
ksport
(f.
o.b
.)6
97
.97
02
.67
19
.81
67
.21
72
.71
77
.01
80
.91
74
.11
77
.91
73
.71
77
.01
69
.51
68
.31
86
.91
95
.11
87
.91
92
.3 E
xport
s (
f.o.b
.)
Im
port
(c.i.f
.)5
73
.66
06
.76
49
.11
34
.81
43
.71
46
.41
48
.71
43
.91
56
.21
56
.51
50
.11
53
.11
60
.11
68
.31
67
.61
61
.51
73
.9 Im
port
s (
c.i.f.)
Im
bangan p
erd
agangan
12
4.2
96
.07
0.7
32
.52
9.0
30
.63
2.2
30
.22
1.7
17
.12
6.9
16
.38
.21
8.6
27
.52
6.3
18
.4 B
ala
nce o
f tr
ade
Imb
an
gan
pem
bayara
n (
RM
bilio
n)
Bala
nce o
f p
aym
en
ts (
RM
billio
n)
Im
bangan b
ara
ngan
15
1.6
12
5.2
10
8.2
38
.13
7.5
38
.33
7.6
36
.03
0.1
25
.53
3.5
28
.01
9.6
27
.23
3.3
33
.63
0.1
B
ala
nce o
n m
erc
handis
e
Im
bangan tid
ak k
eta
ra-4
9.1
-70
.7-6
8.3
-12
.7-1
2.5
-10
.0-1
3.8
-19
.5-2
2.2
-17
.2-1
1.9
-14
.8-1
7.8
-17
.2-1
8.5
-13
.7-1
4.1
B
ala
nce o
n invis
ible
s
Im
bangan a
kaun s
em
asa
10
2.4
54
.53
9.9
25
.42
5.0
28
.32
3.8
16
.58
.08
.32
1.7
13
.21
.81
0.0
14
.81
9.8
16
.0 B
ala
nce o
n c
urr
ent account
Ten
ag
a b
uru
h (
Ju
ta o
ran
g)1
12
.71
3.1
13
.61
2.7
12
.71
2.8
12
.81
3.1
13
.11
3.3
13
.21
3.3
13
.61
3.9
13
.91
3.9
14
.02
Lab
ou
r fo
rce (
Millio
n p
ers
on
s)
1
Kad
ar
pen
gan
gg
ura
n (
%)1
3.1
3.0
3.1
3.0
3.0
3.1
3.1
3.0
3.0
3.0
3.0
3.1
3.0
3.1
3.2
3.1
2.8
2U
nem
plo
ym
en
t ra
te (
%)
1
No
te: %
ch
an
ge
is y
ea
r o
n y
ea
r
1 M
ula
i 2
01
1, data
dia
nggark
an
sem
ula
bera
saskan
kepada u
nju
ran
pen
du
du
k d
aripada B
an
ci P
en
du
du
k d
an
Peru
mah
an
20
10
1 S
tart
ing
20
11
, d
ata
re
-estim
ate
d b
ase
d o
n p
op
ula
tio
n p
roje
ctio
ns fro
m th
e 2
01
0 P
op
ula
tio
n a
nd
Ho
usin
g C
en
su
s2
P
relim
ina
ry d
ata
So
urc
e: D
ep
art
me
nt o
f S
tatistics, M
ala
ysia
iv
2 D
ata
aw
ala
n
Su
mber:
Jabata
n P
era
ngkaan
Mala
ysia
2013
2014
Nota
: P
eru
bah
an
% a
dala
h tah
un
ke tah
un
MA
LA
YS
IA:
DA
TA
PE
NT
ING
EK
ON
OM
I M
AK
RO
2011
2013
p2011
2012
2012
e
SINGKATAN
ABBREVIATIONS
v
c.i.f : Cost, insurance and freight
COFC : Consumption of Fixed Capital
COFOG : Classification of the Functions of Government
COICOP : Classification of Individual Consumption by Purpose
CPI : Consumer Price Index
DOSM : Department of Statistics, Malaysia
etc. : Others
f.o.b : Free on board
FISIM : Financial Intermediation Services Indirectly Measured
GDP : Gross Domestic Product
GNI : Gross National Income
IHP : Indeks Harga Pengguna
IHPR : Indeks Harga Pengeluar
KDNK : Keluaran Dalam Negeri Kasar
MSIC : Malaysia Standard Industrial Classification
n.a : Not available
NPIs : Non-Profit Institutions
NPISHs : Non-Profit Institutions Serving Households
PNK : Pendapatan Negara Kasar
PNP : Private Non-Profit
PPI : Producer Price Index
RM : Ringgit Malaysia
ST : Suku Tahun
SP : Separuh Pertama
SUT 2005 : Supply and Use Tables 2005
UNSO : United Nations Statistical Office
1H : First Half
1993 SNA : System of National Accounts 1993
2008 SNA : System of National Accounts 2008
SIMBOL/ SYMBOLS
.. : tidak berkenaan/ not applicable
e : anggaran/ estimate
p : permulaan/ preliminary
NOTA/ NOTE
Jumlah angka-angka komponen mungkin tidak bersamaan dengan angka jumlah kecil atau jumlah besar
disebabkan pembulatan.
The sum of the component figures may not tally with the sub-total or total figures due to rounding.
Muka surat
Pages
KANDUNGAN
CONTENTS
vi
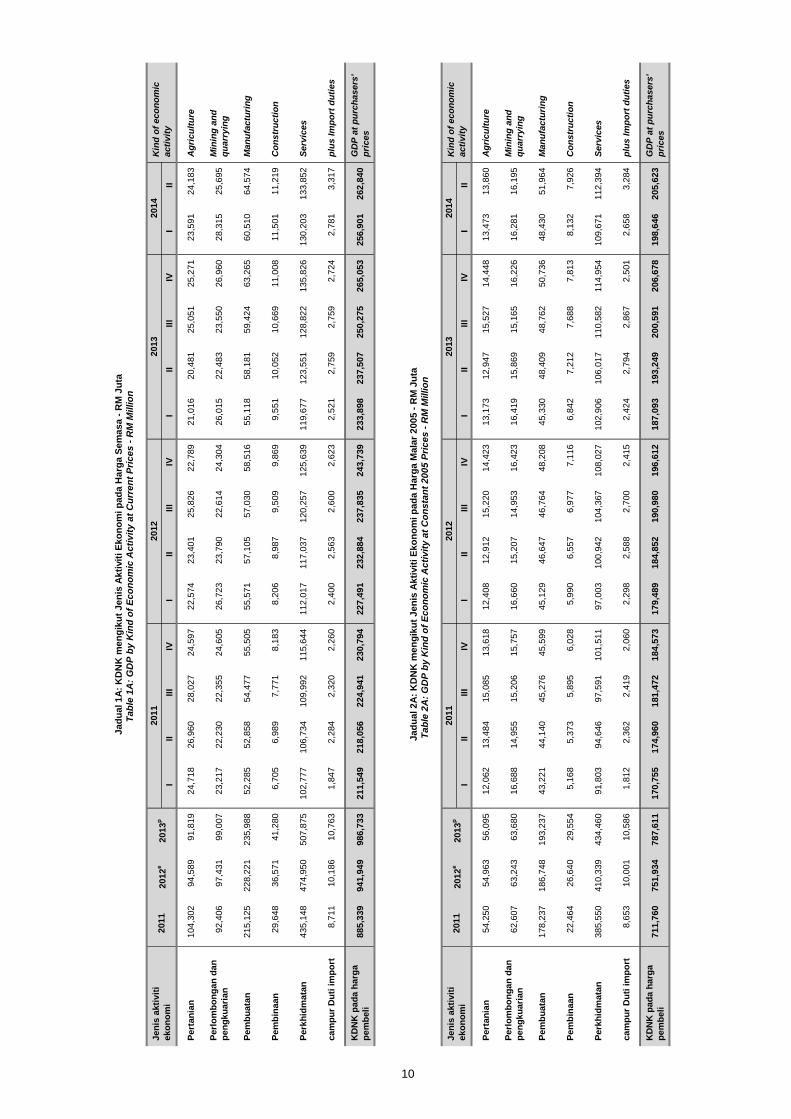
Kata Pengantar Preface Jadual Tarikh Pengeluaran Penerbitan Akaun Negara Keluaran Dalam Negeri Kasar (KDNK) Suku Tahunan, 2014 Schedule of Release Dates for National Accounts Publication Gross Domestic Product (GDP) Quarterly, 2014 Malaysia : Data Penting Ekonomi Makro Malaysia : Macro Economic Key Data Singkatan/ Simbol Abbreviations/ Symbols Inti Sari Highlights SEKSYEN 1 - Jadual Ringkasan SECTION 1 - Summary Tables 1A KDNK mengikut Jenis Aktiviti Ekonomi pada Harga Semasa - RM Juta GDP by Kind of Economic Activity at Current Prices - RM Million 2A KDNK mengikut Jenis Aktiviti Ekonomi pada Harga Malar 2005 - RM Juta GDP by Kind of Economic Activity at Constant 2005 Prices - RM Million 1B KDNK mengikut Jenis Aktiviti Ekonomi pada Harga Semasa - Peratus perubahan dari
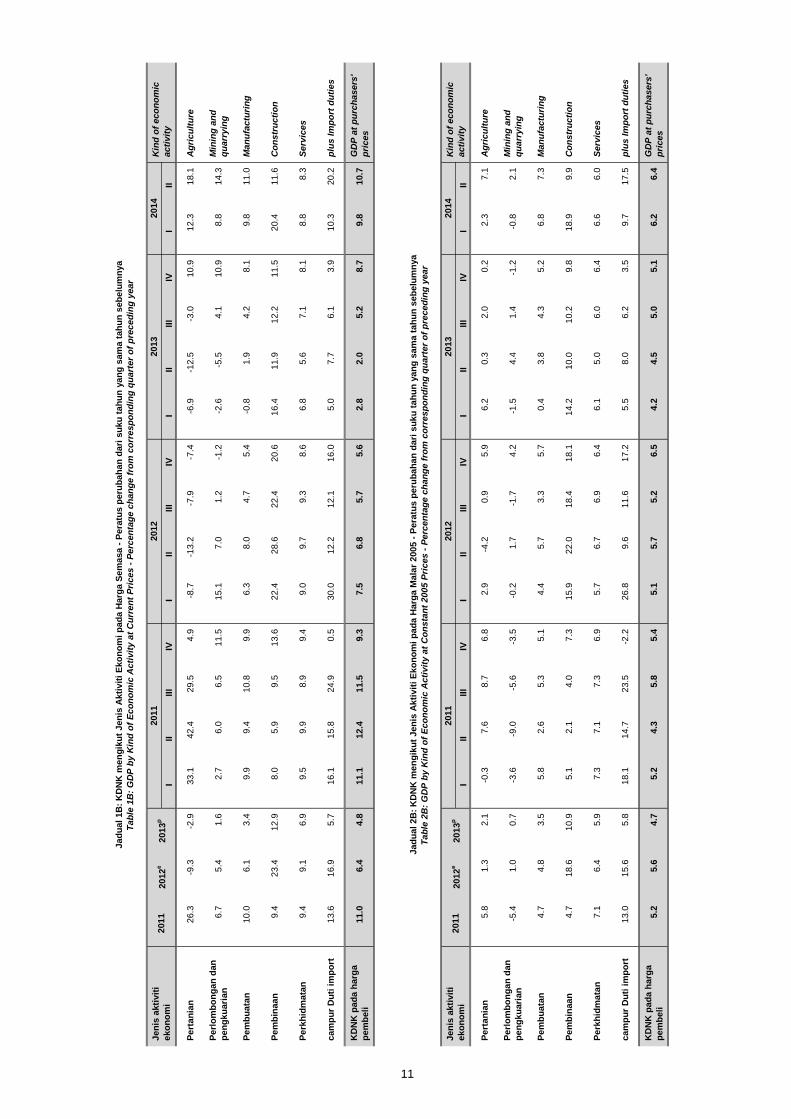
suku tahun yang sama tahun sebelumnya GDP by Kind of Economic Activity at Current Prices - Percentage change from
corresponding quarter of preceding year 2B KDNK mengikut Jenis Aktiviti Ekonomi pada Harga Malar 2005 - Peratus perubahan
dari suku tahun yang sama tahun sebelumnya GDP by Kind of Economic Activity at Constant 2005 Prices - Percentage change
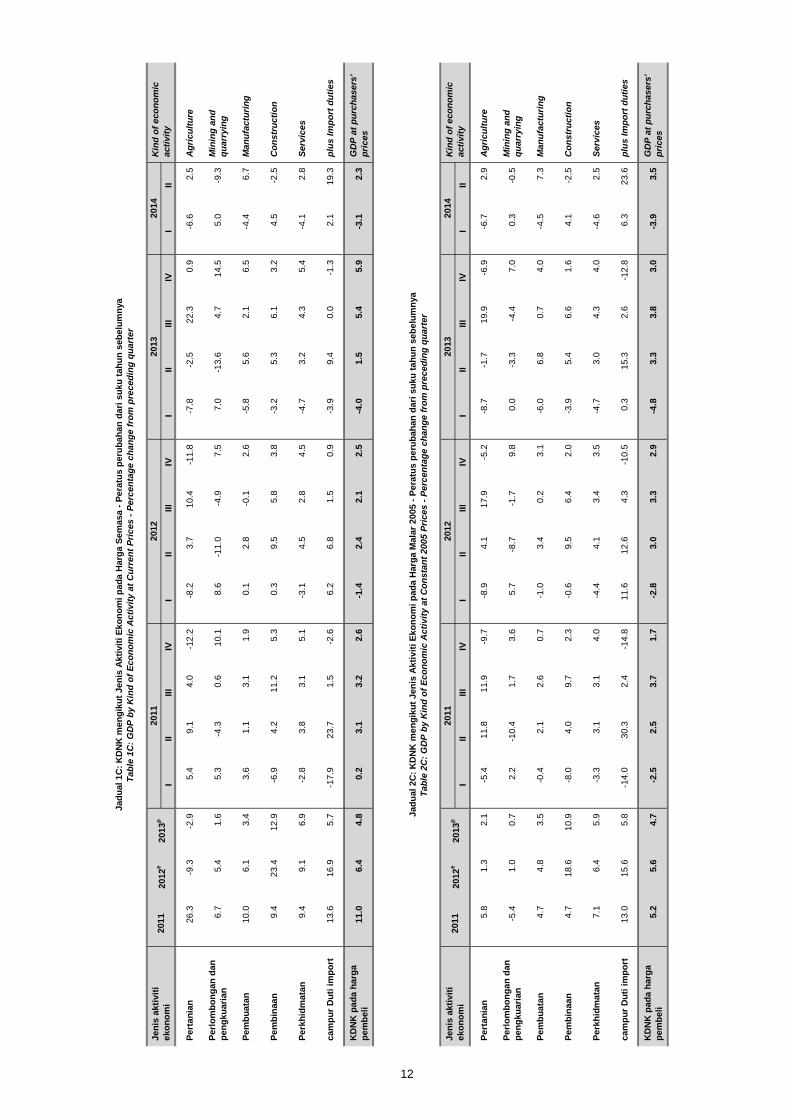
from corresponding quarter of preceding year 1C KDNK mengikut Jenis Aktiviti Ekonomi pada Harga Semasa - Peratus perubahan dari
suku tahun sebelumnya GDP by Kind of Economic Activity at Current Prices - Percentage change from
preceding quarter 2C KDNK mengikut Jenis Aktiviti Ekonomi pada Harga Malar 2005 - Peratus perubahan dari suku tahun sebelumnya GDP by Kind of Economic Activity at Constant 2005 Prices - Percentage change
from preceding quarter 1D KDNK mengikut Jenis Aktiviti Ekonomi pada Harga Semasa - Pembahagian peratus
kepada KDNK GDP by Kind of Economic Activity at Current Prices - Percentage share
to GDP 2D KDNK mengikut Jenis Aktiviti Ekonomi pada Harga Malar 2005 - Pembahagian
peratus kepada KDNK GDP by Kind of Economic Activity at Constant 2005 Prices - Percentage
share to GDP
i iii iv v 1 9 10 10 11 11 12 12 13 13
Muka surat
Pages
KANDUNGAN
CONTENTS
vii
14 14 15 15 16 16 17 17 18 18 19 19
3A KDNK mengikut Jenis Perbelanjaan pada Harga Semasa - RM Juta GDP by Type of Expenditure at Current Prices - RM Million 4A KDNK mengikut Jenis Perbelanjaan pada Harga Malar 2005 - RM Juta GDP by Type of Expenditure at Constant 2005 Prices - RM Million 3B KDNK mengikut Jenis Perbelanjaan pada Harga Semasa - Peratus perubahan dari suku tahun yang sama tahun sebelumnya GDP by Type of Expenditure at Current Prices - Percentage change from corresponding quarter of preceding year 4B KDNK mengikut Jenis Perbelanjaan pada Harga Malar 2005 - Peratus perubahan dari suku tahun yang sama tahun sebelumnya GDP by Type of Expenditure at Constant 2005 Prices - Percentage change from corresponding quarter of preceding year 3C KDNK mengikut Jenis Perbelanjaan pada Harga Semasa - Peratus perubahan dari suku tahun sebelumnya GDP by Type of Expenditure at Current Prices - Percentage change from preceding quarter 4C KDNK mengikut Jenis Perbelanjaan pada Harga Malar 2005 - Peratus perubahan dari suku tahun sebelumnya GDP by Type of Expenditure at Constant 2005 Prices - Percentage change from preceding quarter 3D KDNK mengikut Jenis Perbelanjaan pada Harga Semasa - Pembahagian peratus kepada KDNK GDP by Type of Expenditure at Current Prices - Percentage share to GDP 4D KDNK mengikut Jenis Perbelanjaan pada Harga Malar 2005 - Pembahagian peratus kepada KDNK GDP by Type of Expenditure at Constant 2005 Prices - Percentage share to GDP 5A KDNK mengikut Jenis Perbelanjaan dan Data Penting Ekonomi Makro pada Harga Semasa - RM Juta GDP by Type of Expenditure and Macro Economic Key Data at Current Prices - RM Million 5B KDNK mengikut Jenis Perbelanjaan dan Data Penting Ekonomi Makro pada Harga Semasa - Peratus perubahan dari suku tahun yang sama tahun sebelumnya GDP by Type of Expenditure and Macro Economic Key Data at Current Prices - Percentage change from corresponding quarter of preceding year 5C KDNK mengikut Jenis Perbelanjaan dan Data Penting Ekonomi Makro pada Harga Semasa - Peratus perubahan dari suku tahun sebelumnya GDP by Type of Expenditure and Macro Economic Key Data at Current Prices - Percentage change from preceding quarter 5D KDNK mengikut Jenis Perbelanjaan dan Data Penting Ekonomi Makro pada Harga Semasa - Pembahagian peratus kepada KDNK GDP by Type of Expenditure and Macro Economic Key Data at Current Prices - Percentage share to GDP
Muka surat
Pages
KANDUNGAN
CONTENTS
viii
6A KDNK Pelarasan Musim mengikut Jenis Aktiviti Ekonomi pada Harga Malar 2005 - RM Juta Seasonally Adjusted GDP by Kind of Economic Activity at Constant 2005 Prices - RM Million 6B KDNK Pelarasan Musim mengikut Jenis Aktiviti Ekonomi pada Harga Malar 2005 - Peratus perubahan dari suku tahun sebelumnya Seasonally Adjusted GDP by Kind of Economic Activity at Constant 2005 Prices - Percentage change from preceding quarter 7A KDNK Pelarasan Musim mengikut Jenis Perbelanjaan pada Harga Malar 2005 - RM Juta Seasonally Adjusted GDP by Type of Expenditure at Constant 2005 Prices - RM Million 7B KDNK Pelarasan Musim mengikut Jenis Perbelanjaan pada Harga Malar 2005 - Peratus perubahan dari suku tahun sebelumnya Seasonally Adjusted GDP by Type of Expenditure at Constant 2005 Prices - Percentage change from preceding quarter SEKSYEN 2 – Jadual Pengeluaran SECTION 2 – Production Tables 8A KDNK mengikut Jenis Aktiviti Ekonomi pada Harga Semasa - RM Juta GDP by Kind of Economic Activity at Current Prices - RM Million 8B KDNK mengikut Jenis Aktiviti Ekonomi pada Harga Malar 2005 - RM Juta GDP by Kind of Economic Activity at Constant 2005 Prices - RM Million 9A KDNK mengikut Jenis Aktiviti Ekonomi pada Harga Semasa - Peratus perubahan dari suku tahun yang sama tahun sebelumnya GDP by Kind of Economic Activity at Current Prices - Percentage change from corresponding quarter of preceding year 9B KDNK mengikut Jenis Aktiviti Ekonomi pada Harga Malar 2005 - Peratus perubahan dari suku tahun yang sama tahun sebelumnya GDP by Kind of Economic Activity at Constant 2005 Prices - Percentage change from corresponding quarter of preceding year 10A KDNK mengikut Jenis Aktiviti Ekonomi pada Harga Semasa - Peratus perubahan dari suku tahun sebelumnya GDP by Kind of Economic Activity at Current Prices - Percentage change from preceding quarter 10B KDNK mengikut Jenis Aktiviti Ekonomi pada Harga Malar 2005 - Peratus perubahan dari suku tahun sebelumnya GDP by Kind of Economic Activity at Constant 2005 Prices - Percentage change from preceding quarter 11A KDNK mengikut Jenis Aktiviti Ekonomi pada Harga Semasa - Pembahagian peratus
kepada Sektor GDP by Kind of Economic Activity at Current Prices - Percentage share to Sector
20 20 21 21 23 24 25 26 27 28 29 30
Muka surat
Pages
KANDUNGAN
CONTENTS
ix
11B KDNK mengikut Jenis Aktiviti Ekonomi pada Harga Malar 2005 - Pembahagian peratus kepada Sektor
GDP by Kind of Economic Activity at Constant 2005 Prices - Percentage share to Sector
12A KDNK mengikut Jenis Aktiviti Ekonomi pada Harga Semasa - Pembahagian peratus kepada KDNK GDP by Kind of Economic Activity at Current Prices - Percentage share to GDP 12B KDNK mengikut Jenis Aktiviti Ekonomi pada Harga Malar 2005 - Pembahagian peratus kepada KDNK GDP by Kind of Economic Activity at Constant 2005 Prices - Percentage share to GDP 13 Pendeflasi Harga Tersirat atas KDNK Mengikut Jenis Aktiviti Ekonomi - Tahun Asas 2005=100 Implicit Price Deflators on GDP by Kind of Economic Activity - Base Year 2005=100 SEKSYEN 3 – Jadual Perbelanjaan SECTION 3 – Expenditure Tables 14A KDNK mengikut Jenis Perbelanjaan pada Harga Semasa - RM Juta GDP by Type of Expenditure at Current Prices - RM Million 14B KDNK mengikut Jenis Perbelanjaan pada Harga Malar 2005 - RM Juta GDP by Type of Expenditure at Constant 2005 Prices - RM Million 15A KDNK mengikut Jenis Perbelanjaan pada Harga Semasa - Peratus perubahan dari suku tahun yang sama tahun sebelumnya GDP by Type of Expenditure at Current Prices - Percentage change from corresponding quarter of preceding year 15B KDNK mengikut Jenis Perbelanjaan pada Harga Malar 2005 - Peratus perubahan dari suku tahun yang sama tahun sebelumnya GDP by Type of Expenditure at Constant 2005 Prices - Percentage change from corresponding quarter of preceding year 16A KDNK mengikut Jenis Perbelanjaan pada Harga Semasa - Peratus perubahan dari suku tahun sebelumnya GDP by Type of Expenditure at Current Prices - Percentage change from preceding quarter 16B KDNK mengikut Jenis Perbelanjaan pada Harga Malar 2005 - Peratus perubahan dari suku tahun sebelumnya GDP by Type of Expenditure at Constant 2005 Prices - Percentage change from preceding quarter 17A KDNK mengikut Jenis Perbelanjaan pada Harga Semasa - Pembahagian peratus kepada Sektor GDP by Type of Expenditure at Current Prices - Percentage share to Sector 17B KDNK mengikut Jenis Perbelanjaan pada Harga Malar 2005 - Pembahagian peratus kepada Sektor GDP by Type of Expenditure at Constant 2005 Prices - Percentage share to Sector
31 32 33 34 35 36 36
37
37 38 38 39 39
Muka surat
Pages
KANDUNGAN
CONTENTS
x
18A KDNK mengikut Jenis Perbelanjaan pada Harga Semasa - Pembahagian peratus kepada KDNK GDP by Type of Expenditure at Current Prices - Percentage share to GDP 18B KDNK mengikut Jenis Perbelanjaan pada Harga Malar 2005 - Pembahagian peratus kepada KDNK GDP by Type of Expenditure at Constant 2005 Prices - Percentage share to GDP 19 Pendeflasi Harga Tersirat atas KDNK mengikut Jenis Perbelanjaan - Tahun Asas 2005=100 Implicit Price Deflators on GDP by Type of Expenditure - Base Year 2005=100 SEKSYEN 4 – Nota Teknikal SECTION 4 – Technical Notes SEKSYEN 5 – Glosari SECTION 5 – Glossary
40 40 41
43 65
INTI SARI
HIGHLIGHTS

INTI SARI SUKU KEDUA 2014 HIGHLIGHTS OF SECOND QUARTER 2014
1
PERTUMBUHAN EKONOMI ECONOMIC GROWTH
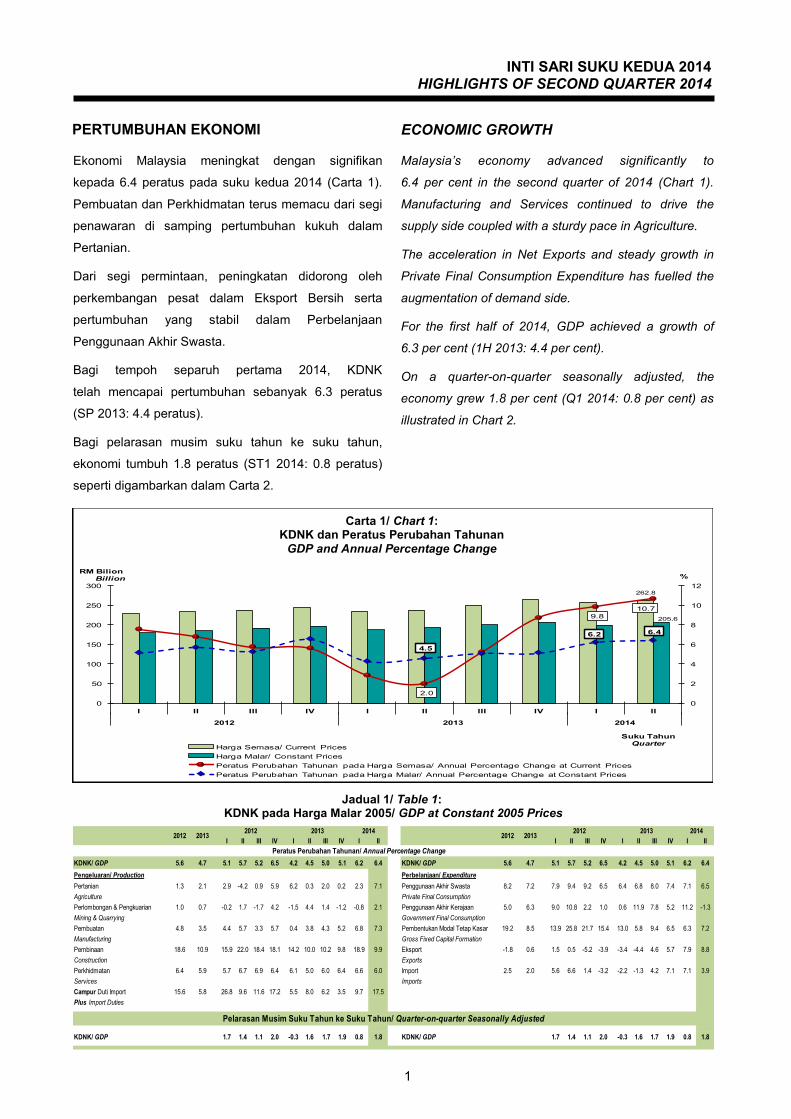
Malaysia’s economy advanced significantly to
6.4 per cent in the second quarter of 2014 (Chart 1).
Manufacturing and Services continued to drive the
supply side coupled with a sturdy pace in Agriculture.
The acceleration in Net Exports and steady growth in
Private Final Consumption Expenditure has fuelled the
augmentation of demand side.
For the first half of 2014, GDP achieved a growth of
6.3 per cent (1H 2013: 4.4 per cent).
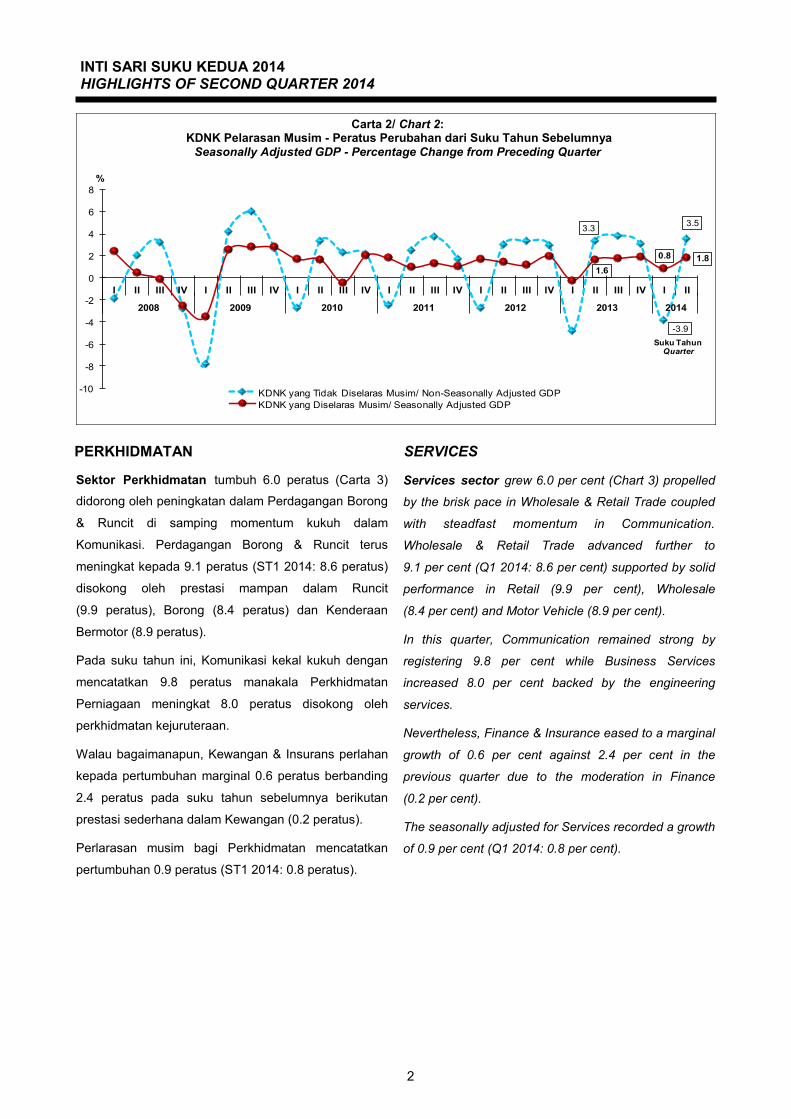
On a quarter-on-quarter seasonally adjusted, the
economy grew 1.8 per cent (Q1 2014: 0.8 per cent) as
illustrated in Chart 2.
Ekonomi Malaysia meningkat dengan signifikan
kepada 6.4 peratus pada suku kedua 2014 (Carta 1).
Pembuatan dan Perkhidmatan terus memacu dari segi
penawaran di samping pertumbuhan kukuh dalam
Pertanian.
Dari segi permintaan, peningkatan didorong oleh
perkembangan pesat dalam Eksport Bersih serta
pertumbuhan yang stabil dalam Perbelanjaan
Penggunaan Akhir Swasta.
Bagi tempoh separuh pertama 2014, KDNK
telah mencapai pertumbuhan sebanyak 6.3 peratus
(SP 2013: 4.4 peratus).
Bagi pelarasan musim suku tahun ke suku tahun,
ekonomi tumbuh 1.8 peratus (ST1 2014: 0.8 peratus)
seperti digambarkan dalam Carta 2.
Jadual 1/ Table 1: KDNK pada Harga Malar 2005/ GDP at Constant 2005 Prices
Carta 1/ Chart 1: KDNK dan Peratus Perubahan Tahunan
GDP and Annual Percentage Change
262.8
205.6
2.0
9.8
10.7
4.5
6.2 6.4
0
2
4
6
8
10
12
0
50
100
150
200
250
300
I II III IV I II III IV I II
2012 2013 2014
%RM Bilion
Billion
Suku TahunQuarter
Harga Semasa/ Current Prices
Harga Malar/ Constant Prices
Peratus Perubahan Tahunan pada Harga Semasa/ Annual Percentage Change at Current Prices
Peratus Perubahan Tahunan pada Harga Malar/ Annual Percentage Change at Constant Prices
I II III IV I II III IV I II I II III IV I II III IV I II
KDNK/ GDP 5.6 4.7 5.1 5.7 5.2 6.5 4.2 4.5 5.0 5.1 6.2 6.4 KDNK/ GDP 5.6 4.7 5.1 5.7 5.2 6.5 4.2 4.5 5.0 5.1 6.2 6.4
Pengeluaran/ Production Perbelanjaan/ Expenditure
Pertanian 1.3 2.1 2.9 -4.2 0.9 5.9 6.2 0.3 2.0 0.2 2.3 7.1 Penggunaan Akhir Swasta 8.2 7.2 7.9 9.4 9.2 6.5 6.4 6.8 8.0 7.4 7.1 6.5
Agriculture Private Final Consumption
Perlombongan & Pengkuarian 1.0 0.7 -0.2 1.7 -1.7 4.2 -1.5 4.4 1.4 -1.2 -0.8 2.1 Penggunaan Akhir Kerajaan 5.0 6.3 9.0 10.8 2.2 1.0 0.6 11.9 7.8 5.2 11.2 -1.3
Mining & Quarrying Government Final Consumption
Pembuatan 4.8 3.5 4.4 5.7 3.3 5.7 0.4 3.8 4.3 5.2 6.8 7.3 Pembentukan Modal Tetap Kasar 19.2 8.5 13.9 25.8 21.7 15.4 13.0 5.8 9.4 6.5 6.3 7.2
Manufacturing Gross Fixed Capital Formation
Pembinaan 18.6 10.9 15.9 22.0 18.4 18.1 14.2 10.0 10.2 9.8 18.9 9.9 Eksport -1.8 0.6 1.5 0.5 -5.2 -3.9 -3.4 -4.4 4.6 5.7 7.9 8.8
Construction Exports
Perkhidmatan 6.4 5.9 5.7 6.7 6.9 6.4 6.1 5.0 6.0 6.4 6.6 6.0 Import 2.5 2.0 5.6 6.6 1.4 -3.2 -2.2 -1.3 4.2 7.1 7.1 3.9
Services Imports
Campur Duti Import 15.6 5.8 26.8 9.6 11.6 17.2 5.5 8.0 6.2 3.5 9.7 17.5
Plus Import Duties
KDNK/ GDP 1.7 1.4 1.1 2.0 -0.3 1.6 1.7 1.9 0.8 1.8 KDNK/ GDP 1.7 1.4 1.1 2.0 -0.3 1.6 1.7 1.9 0.8 1.8
2012 2013
Peratus Perubahan Tahunan/ Annual Percentage Change
20132012 20132012 2013
20142012
Pelarasan Musim Suku Tahun ke Suku Tahun/ Quarter-on-quarter Seasonally Adjusted
2014
INTI SARI SUKU KEDUA 2014 HIGHLIGHTS OF SECOND QUARTER 2014
2
3.3
-3.9
3.5
1.6
0.8 1.8
-10
-8
-6
-4
-2
0
2
4
6
8
I II III IV I II III IV I II III IV I II III IV I II III IV I II III IV I II
2008 2009 2010 2011 2012 2013 2014
%
KDNK yang Tidak Diselaras Musim/ Non-Seasonally Adjusted GDP
KDNK yang Diselaras Musim/ Seasonally Adjusted GDP
Suku TahunQuarter
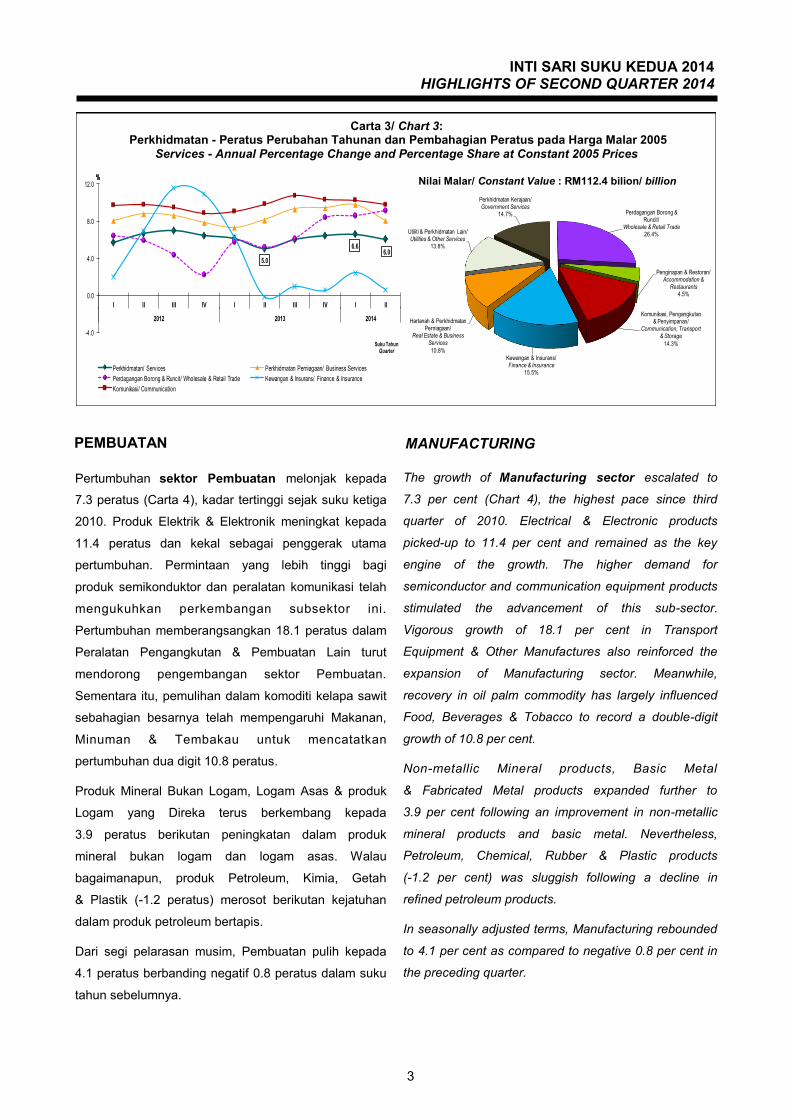
Services sector grew 6.0 per cent (Chart 3) propelled
by the brisk pace in Wholesale & Retail Trade coupled
with steadfast momentum in Communication.
Wholesale & Retail Trade advanced further to
9.1 per cent (Q1 2014: 8.6 per cent) supported by solid
performance in Retail (9.9 per cent), Wholesale
(8.4 per cent) and Motor Vehicle (8.9 per cent).
In this quarter, Communication remained strong by
registering 9.8 per cent while Business Services
increased 8.0 per cent backed by the engineering
services.
Nevertheless, Finance & Insurance eased to a marginal
growth of 0.6 per cent against 2.4 per cent in the
previous quarter due to the moderation in Finance
(0.2 per cent).
The seasonally adjusted for Services recorded a growth
of 0.9 per cent (Q1 2014: 0.8 per cent).
Sektor Perkhidmatan tumbuh 6.0 peratus (Carta 3)
didorong oleh peningkatan dalam Perdagangan Borong
& Runcit di samping momentum kukuh dalam
Komunikasi. Perdagangan Borong & Runcit terus
meningkat kepada 9.1 peratus (ST1 2014: 8.6 peratus)
disokong oleh prestasi mampan dalam Runcit
(9.9 peratus), Borong (8.4 peratus) dan Kenderaan
Bermotor (8.9 peratus).
Pada suku tahun ini, Komunikasi kekal kukuh dengan
mencatatkan 9.8 peratus manakala Perkhidmatan
Perniagaan meningkat 8.0 peratus disokong oleh
perkhidmatan kejuruteraan.
Walau bagaimanapun, Kewangan & Insurans perlahan
kepada pertumbuhan marginal 0.6 peratus berbanding
2.4 peratus pada suku tahun sebelumnya berikutan
prestasi sederhana dalam Kewangan (0.2 peratus).
Perlarasan musim bagi Perkhidmatan mencatatkan
pertumbuhan 0.9 peratus (ST1 2014: 0.8 peratus).
SERVICES PERKHIDMATAN
Carta 2/ Chart 2: KDNK Pelarasan Musim - Peratus Perubahan dari Suku Tahun Sebelumnya
Seasonally Adjusted GDP - Percentage Change from Preceding Quarter
INTI SARI SUKU KEDUA 2014 HIGHLIGHTS OF SECOND QUARTER 2014
3
Perdagangan Borong & Runcit/
Wholesale & Retail Trade26.4%
Penginapan & Restoran/ Accommodation &
Restaurants4.5%
Komunikasi, Pengangkutan & Penyimpanan/
Communication, Transport & Storage
14.3%
Kewangan & Insurans/ Finance & Insurance
15.5%
Hartanah & Perkhidmatan Perniagaan/
Real Estate & Business Services
10.8%
Utiliti & Perkhidmatan Lain/ Utilities & Other Services
13.8%
Perkhidmatan Kerajaan/ Government Services
14.7%
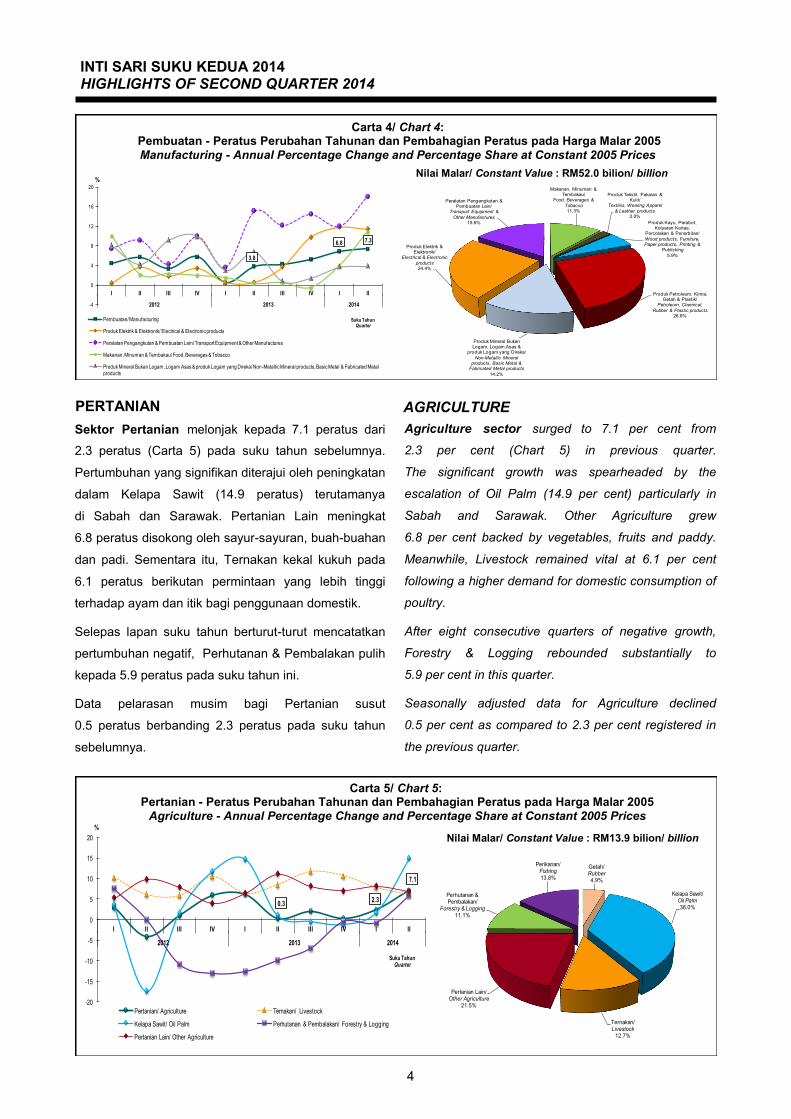
Pertumbuhan sektor Pembuatan melonjak kepada
7.3 peratus (Carta 4), kadar tertinggi sejak suku ketiga
2010. Produk Elektrik & Elektronik meningkat kepada
11.4 peratus dan kekal sebagai penggerak utama
pertumbuhan. Permintaan yang lebih tinggi bagi
produk semikonduktor dan peralatan komunikasi telah
mengukuhkan perkembangan subsektor ini.
Pertumbuhan memberangsangkan 18.1 peratus dalam
Peralatan Pengangkutan & Pembuatan Lain turut
mendorong pengembangan sektor Pembuatan.
Sementara itu, pemulihan dalam komoditi kelapa sawit
sebahagian besarnya telah mempengaruhi Makanan,
Minuman & Tembakau untuk mencatatkan
pertumbuhan dua digit 10.8 peratus.
Produk Mineral Bukan Logam, Logam Asas & produk
Logam yang Direka terus berkembang kepada
3.9 peratus berikutan peningkatan dalam produk
mineral bukan logam dan logam asas. Walau
bagaimanapun, produk Petroleum, Kimia, Getah
& Plastik (-1.2 peratus) merosot berikutan kejatuhan
dalam produk petroleum bertapis.
Dari segi pelarasan musim, Pembuatan pulih kepada
4.1 peratus berbanding negatif 0.8 peratus dalam suku
tahun sebelumnya.
PEMBUATAN MANUFACTURING
Carta 3/ Chart 3: Perkhidmatan - Peratus Perubahan Tahunan dan Pembahagian Peratus pada Harga Malar 2005
Services - Annual Percentage Change and Percentage Share at Constant 2005 Prices
Nilai Malar/ Constant Value : RM112.4 bilion/ billion
The growth of Manufacturing sector escalated to
7.3 per cent (Chart 4), the highest pace since third
quarter of 2010. Electrical & Electronic products
picked-up to 11.4 per cent and remained as the key
engine of the growth. The higher demand for
semiconductor and communication equipment products
stimulated the advancement of this sub-sector.
Vigorous growth of 18.1 per cent in Transport
Equipment & Other Manufactures also reinforced the
expansion of Manufacturing sector. Meanwhile,
recovery in oil palm commodity has largely influenced
Food, Beverages & Tobacco to record a double-digit
growth of 10.8 per cent.
Non-metallic Mineral products, Basic Metal
& Fabricated Metal products expanded further to
3.9 per cent following an improvement in non-metallic
mineral products and basic metal. Nevertheless,
Petroleum, Chemical, Rubber & Plastic products
(-1.2 per cent) was sluggish following a decline in
refined petroleum products.
In seasonally adjusted terms, Manufacturing rebounded
to 4.1 per cent as compared to negative 0.8 per cent in
the preceding quarter.
5.0
6.66.0
-4.0
0.0
4.0
8.0
12.0
I II III IV I II III IV I II
2012 2013 2014
Perkhidmatan/ Services Perkhidmatan Perniagaan/ Business Services
Perdagangan Borong & Runcit/ Wholesale & Retail Trade Kewangan & Insurans/ Finance & Insurance
Komunikasi/ Communication
%%
Suku TahunQuarter
INTI SARI SUKU KEDUA 2014 HIGHLIGHTS OF SECOND QUARTER 2014
4
0.32.3
7.1
-20
-15
-10
-5
0
5
10
15
20
I II III IV I II III IV I II
2012 2013 2014
%
Pertanian/ Agriculture Ternakan/ Livestock
Kelapa Sawit/ Oil Palm Perhutanan & Pembalakan/ Forestry & Logging
Pertanian Lain/ Other Agriculture
Suku TahunQuarter
Makanan, Minuman & Tembakau/
Food, Beverages &
Tobacco11.3%
Produk Tekstil, Pakaian & Kulit/
Textiles, Wearing Apparel
& Leather products 2.0%
Produk Kayu, Perabot, Keluaran Kertas,
Percetakan & Penerbitan/
Wood products, Furniture, Paper products, Printing &
Publishing
5.9%
Produk Petroleum, Kimia, Getah & Plastik/
Petroleum, Chemical,
Rubber & Plastic products26.6%
Produk Mineral Bukan Logam, Logam Asas &
produk Logam yang Direka/
Non-Metallic Mineral products, Basic Metal &
Fabricated Metal products
14.2%
Produk Elektrik & Elektronik/
Electrical & Electronic
products24.4%
Peralatan Pengangkutan & Pembuatan Lain/
Transport Equipment &
Other Manufactures15.6%
PERTANIAN AGRICULTURE
Agriculture sector surged to 7.1 per cent from
2.3 per cent (Chart 5) in previous quarter.
The significant growth was spearheaded by the
escalation of Oil Palm (14.9 per cent) particularly in
Sabah and Sarawak. Other Agriculture grew
6.8 per cent backed by vegetables, fruits and paddy.
Meanwhile, Livestock remained vital at 6.1 per cent
following a higher demand for domestic consumption of
poultry.
After eight consecutive quarters of negative growth,
Forestry & Logging rebounded substantially to
5.9 per cent in this quarter.
Seasonally adjusted data for Agriculture declined
0.5 per cent as compared to 2.3 per cent registered in
the previous quarter.
Sektor Pertanian melonjak kepada 7.1 peratus dari
2.3 peratus (Carta 5) pada suku tahun sebelumnya.
Pertumbuhan yang signifikan diterajui oleh peningkatan
dalam Kelapa Sawit (14.9 peratus) terutamanya
di Sabah dan Sarawak. Pertanian Lain meningkat
6.8 peratus disokong oleh sayur-sayuran, buah-buahan
dan padi. Sementara itu, Ternakan kekal kukuh pada
6.1 peratus berikutan permintaan yang lebih tinggi
terhadap ayam dan itik bagi penggunaan domestik.
Selepas lapan suku tahun berturut-turut mencatatkan
pertumbuhan negatif, Perhutanan & Pembalakan pulih
kepada 5.9 peratus pada suku tahun ini.
Data pelarasan musim bagi Pertanian susut
0.5 peratus berbanding 2.3 peratus pada suku tahun
sebelumnya.
Carta 4/ Chart 4: Pembuatan - Peratus Perubahan Tahunan dan Pembahagian Peratus pada Harga Malar 2005
Manufacturing - Annual Percentage Change and Percentage Share at Constant 2005 Prices
Nilai Malar/ Constant Value : RM52.0 bilion/ billion
Carta 5/ Chart 5: Pertanian - Peratus Perubahan Tahunan dan Pembahagian Peratus pada Harga Malar 2005
Agriculture - Annual Percentage Change and Percentage Share at Constant 2005 Prices
Nilai Malar/ Constant Value : RM13.9 bilion/ billion
Getah/ Rubber4.9%
Kelapa Sawit/ Oil Palm36.0%
Ternakan/ Livestock
12.7%
Pertanian Lain/ Other Agriculture
21.5%
Perhutanan & Pembalakan/
Forestry & Logging11.1%
Perikanan/ Fishing13.8%
3.8
6.8 7.3
-4
0
4
8
12
16
20
I II III IV I II III IV I II
2012 2013 2014
%
Pembuatan/ Manufacturing
Produk Elektrik & Elektronik/ Electrical & Electronic products
Peralatan Pengangkutan & Pembuatan Lain/ Transport Equipment & Other Manufactures
Makanan, Minuman & Tembakau/ Food, Beverages & Tobacco
Produk Mineral Bukan Logam, Logam Asas & produk Logam yang Direka/ Non-Metallic Mineral products, Basic Metal & Fabricated Metalproducts
Suku TahunQuarter
INTI SARI SUKU KEDUA 2014 HIGHLIGHTS OF SECOND QUARTER 2014
5
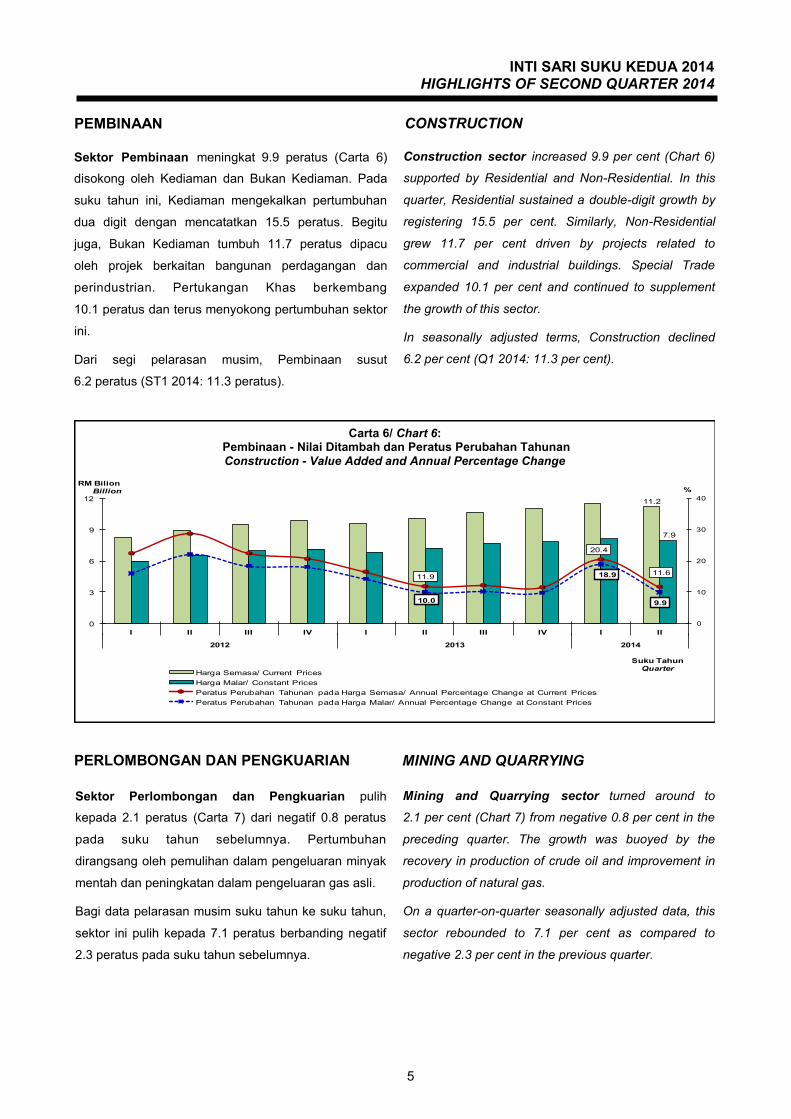
Sektor Pembinaan meningkat 9.9 peratus (Carta 6)
disokong oleh Kediaman dan Bukan Kediaman. Pada
suku tahun ini, Kediaman mengekalkan pertumbuhan
dua digit dengan mencatatkan 15.5 peratus. Begitu
juga, Bukan Kediaman tumbuh 11.7 peratus dipacu
oleh projek berkaitan bangunan perdagangan dan
perindustrian. Pertukangan Khas berkembang
10.1 peratus dan terus menyokong pertumbuhan sektor
ini.
Dari segi pelarasan musim, Pembinaan susut
6.2 peratus (ST1 2014: 11.3 peratus).
CONSTRUCTION PEMBINAAN
MINING AND QUARRYING PERLOMBONGAN DAN PENGKUARIAN
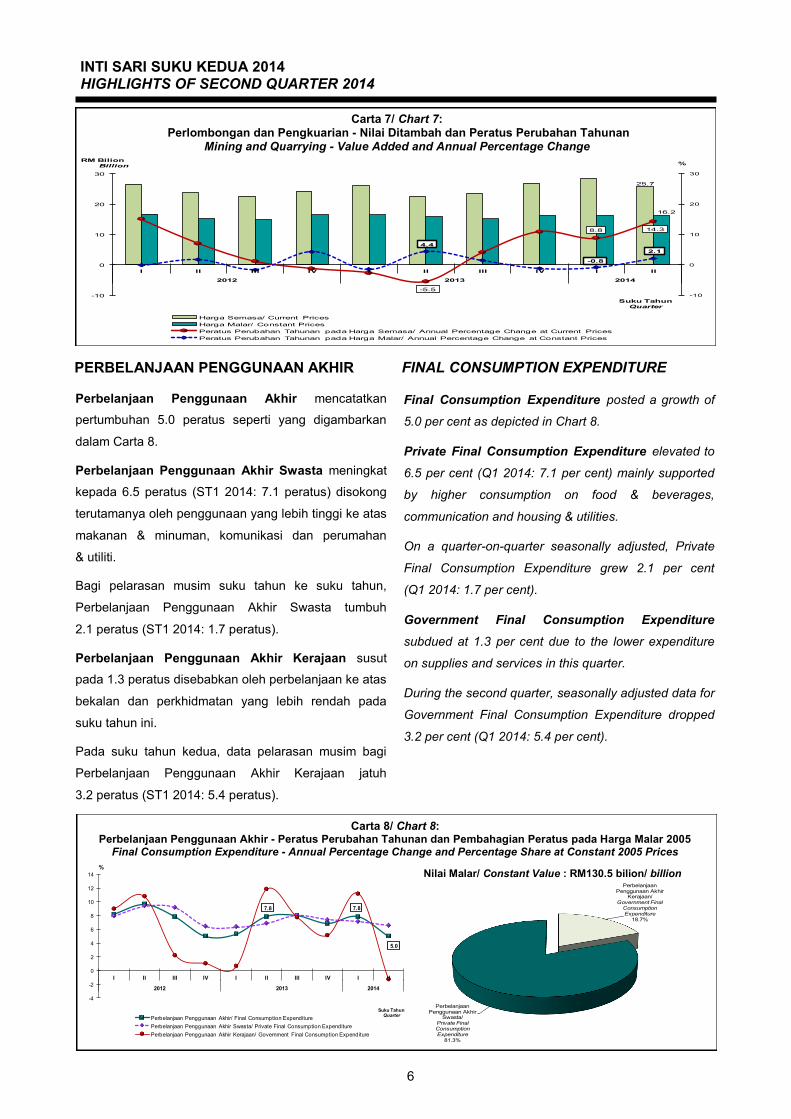
Mining and Quarrying sector turned around to
2.1 per cent (Chart 7) from negative 0.8 per cent in the
preceding quarter. The growth was buoyed by the
recovery in production of crude oil and improvement in
production of natural gas.
On a quarter-on-quarter seasonally adjusted data, this
sector rebounded to 7.1 per cent as compared to
negative 2.3 per cent in the previous quarter.
Sektor Perlombongan dan Pengkuarian pulih
kepada 2.1 peratus (Carta 7) dari negatif 0.8 peratus
pada suku tahun sebelumnya. Pertumbuhan
dirangsang oleh pemulihan dalam pengeluaran minyak
mentah dan peningkatan dalam pengeluaran gas asli.
Bagi data pelarasan musim suku tahun ke suku tahun,
sektor ini pulih kepada 7.1 peratus berbanding negatif
2.3 peratus pada suku tahun sebelumnya.
Construction sector increased 9.9 per cent (Chart 6)
supported by Residential and Non-Residential. In this
quarter, Residential sustained a double-digit growth by
registering 15.5 per cent. Similarly, Non-Residential
grew 11.7 per cent driven by projects related to
commercial and industrial buildings. Special Trade
expanded 10.1 per cent and continued to supplement
the growth of this sector.
In seasonally adjusted terms, Construction declined
6.2 per cent (Q1 2014: 11.3 per cent).
11.2
7.9
11.9
20.4
11.6
10.0
18.9
9.9
0
10
20
30
40
0
3
6
9
12
I II III IV I II III IV I II
2012 2013 2014
%RM Bilion
Billion
Suku TahunQuarter
Harga Semasa/ Current Prices
Harga Malar/ Constant Prices
Peratus Perubahan Tahunan pada Harga Semasa/ Annual Percentage Change at Current Prices
Peratus Perubahan Tahunan pada Harga Malar/ Annual Percentage Change at Constant Prices
Carta 6/ Chart 6: Pembinaan - Nilai Ditambah dan Peratus Perubahan Tahunan
Construction - Value Added and Annual Percentage Change
INTI SARI SUKU KEDUA 2014 HIGHLIGHTS OF SECOND QUARTER 2014
6
25.7
16.2
-5.5
8.8 14.3
4.4
-0.8
2.1
-10
0
10
20
30
-10
0
10
20
30
I II III IV I II III IV I II
2012 2013 2014
%RM Bilion
Billion
Suku TahunQuarter
Harga Semasa/ Current Prices
Harga Malar/ Constant Prices
Peratus Perubahan Tahunan pada Harga Semasa/ Annual Percentage Change at Current Prices
Peratus Perubahan Tahunan pada Harga Malar/ Annual Percentage Change at Constant Prices
FINAL CONSUMPTION EXPENDITURE PERBELANJAAN PENGGUNAAN AKHIR
Final Consumption Expenditure posted a growth of
5.0 per cent as depicted in Chart 8.
Private Final Consumption Expenditure elevated to
6.5 per cent (Q1 2014: 7.1 per cent) mainly supported
by higher consumption on food & beverages,
communication and housing & utilities.
On a quarter-on-quarter seasonally adjusted, Private
Final Consumption Expenditure grew 2.1 per cent
(Q1 2014: 1.7 per cent).
Government Final Consumption Expenditure
subdued at 1.3 per cent due to the lower expenditure
on supplies and services in this quarter.
During the second quarter, seasonally adjusted data for
Government Final Consumption Expenditure dropped
3.2 per cent (Q1 2014: 5.4 per cent).
Perbelanjaan Penggunaan Akhir mencatatkan
pertumbuhan 5.0 peratus seperti yang digambarkan
dalam Carta 8.
Perbelanjaan Penggunaan Akhir Swasta meningkat
kepada 6.5 peratus (ST1 2014: 7.1 peratus) disokong
terutamanya oleh penggunaan yang lebih tinggi ke atas
makanan & minuman, komunikasi dan perumahan
& utiliti.
Bagi pelarasan musim suku tahun ke suku tahun,
Perbelanjaan Penggunaan Akhir Swasta tumbuh
2.1 peratus (ST1 2014: 1.7 peratus).
Perbelanjaan Penggunaan Akhir Kerajaan susut
pada 1.3 peratus disebabkan oleh perbelanjaan ke atas
bekalan dan perkhidmatan yang lebih rendah pada
suku tahun ini.
Pada suku tahun kedua, data pelarasan musim bagi
Perbelanjaan Penggunaan Akhir Kerajaan jatuh
3.2 peratus (ST1 2014: 5.4 peratus).
Carta 7/ Chart 7: Perlombongan dan Pengkuarian - Nilai Ditambah dan Peratus Perubahan Tahunan
Mining and Quarrying - Value Added and Annual Percentage Change
Carta 8/ Chart 8: Perbelanjaan Penggunaan Akhir - Peratus Perubahan Tahunan dan Pembahagian Peratus pada Harga Malar 2005
Final Consumption Expenditure - Annual Percentage Change and Percentage Share at Constant 2005 Prices
Nilai Malar/ Constant Value : RM130.5 bilion/ billion
7.8 7.8
5.0
-4
-2
0
2
4
6
8
10
12
14
I II III IV I II III IV I II
2012 2013 2014
%
Perbelanjaan Penggunaan Akhir/ Final Consumption Expenditure
Perbelanjaan Penggunaan Akhir Swasta/ Private Final Consumption Expenditure
Perbelanjaan Penggunaan Akhir Kerajaan/ Government Final Consumption Expenditure
Suku TahunQuarter
Perbelanjaan Penggunaan Akhir
Kerajaan/ Government Final
Consumption Expenditure
18.7%
Perbelanjaan Penggunaan Akhir
Swasta/ Private Final Consumption Expenditure
81.3%
INTI SARI SUKU KEDUA 2014 HIGHLIGHTS OF SECOND QUARTER 2014
7
GROSS FIXED CAPITAL FORMATION PEMBENTUKAN MODAL TETAP KASAR
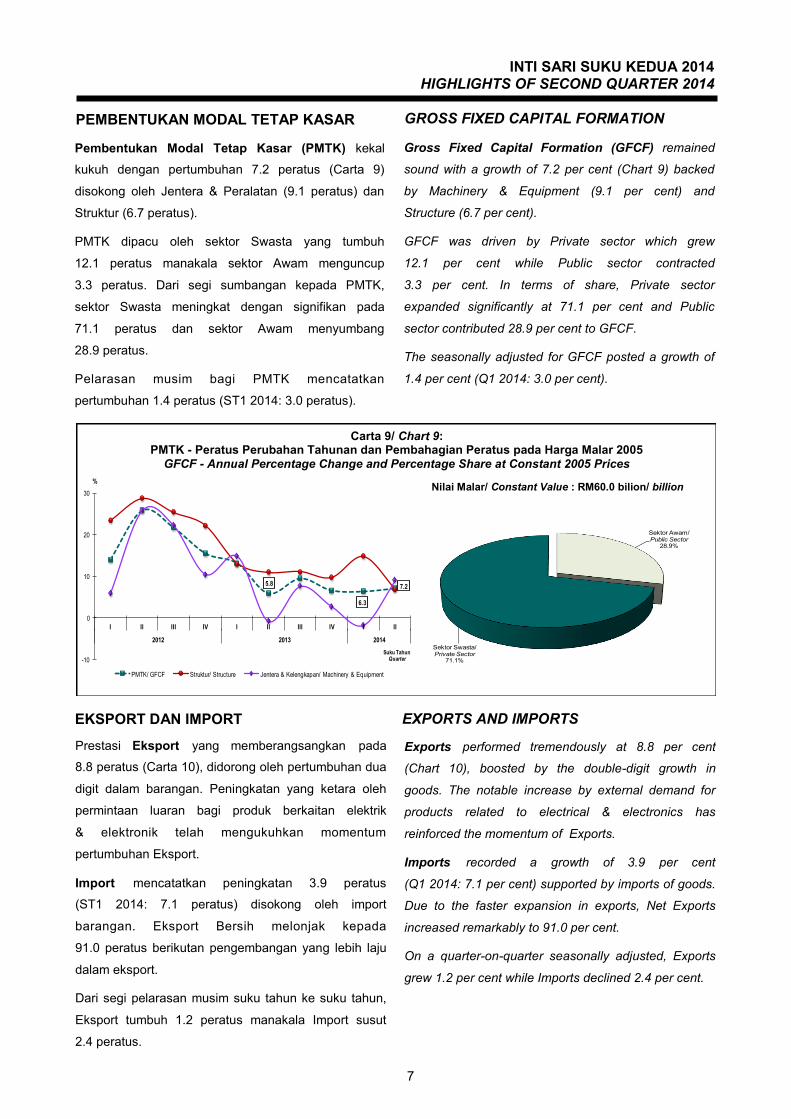
Gross Fixed Capital Formation (GFCF) remained
sound with a growth of 7.2 per cent (Chart 9) backed
by Machinery & Equipment (9.1 per cent) and
Structure (6.7 per cent).
GFCF was driven by Private sector which grew
12.1 per cent while Public sector contracted
3.3 per cent. In terms of share, Private sector
expanded significantly at 71.1 per cent and Public
sector contributed 28.9 per cent to GFCF.
The seasonally adjusted for GFCF posted a growth of
1.4 per cent (Q1 2014: 3.0 per cent).
Pembentukan Modal Tetap Kasar (PMTK) kekal
kukuh dengan pertumbuhan 7.2 peratus (Carta 9)
disokong oleh Jentera & Peralatan (9.1 peratus) dan
Struktur (6.7 peratus).
PMTK dipacu oleh sektor Swasta yang tumbuh
12.1 peratus manakala sektor Awam menguncup
3.3 peratus. Dari segi sumbangan kepada PMTK,
sektor Swasta meningkat dengan signifikan pada
71.1 peratus dan sektor Awam menyumbang
28.9 peratus.
Pelarasan musim bagi PMTK mencatatkan
pertumbuhan 1.4 peratus (ST1 2014: 3.0 peratus).
5.8
6.3
7.2
-10
0
10
20
30
I II III IV I II III IV I II
2012 2013 2014
%
PMTK/ GFCF Struktur/ Structure Jentera & Kelengkapan/ Machinery & Equipment
Suku TahunQuarter
Sektor Awam/ Public Sector
28.9%
Sektor Swasta/ Private Sector
71.1%
Carta 9/ Chart 9: PMTK - Peratus Perubahan Tahunan dan Pembahagian Peratus pada Harga Malar 2005
GFCF - Annual Percentage Change and Percentage Share at Constant 2005 Prices
Nilai Malar/ Constant Value : RM60.0 bilion/ billion
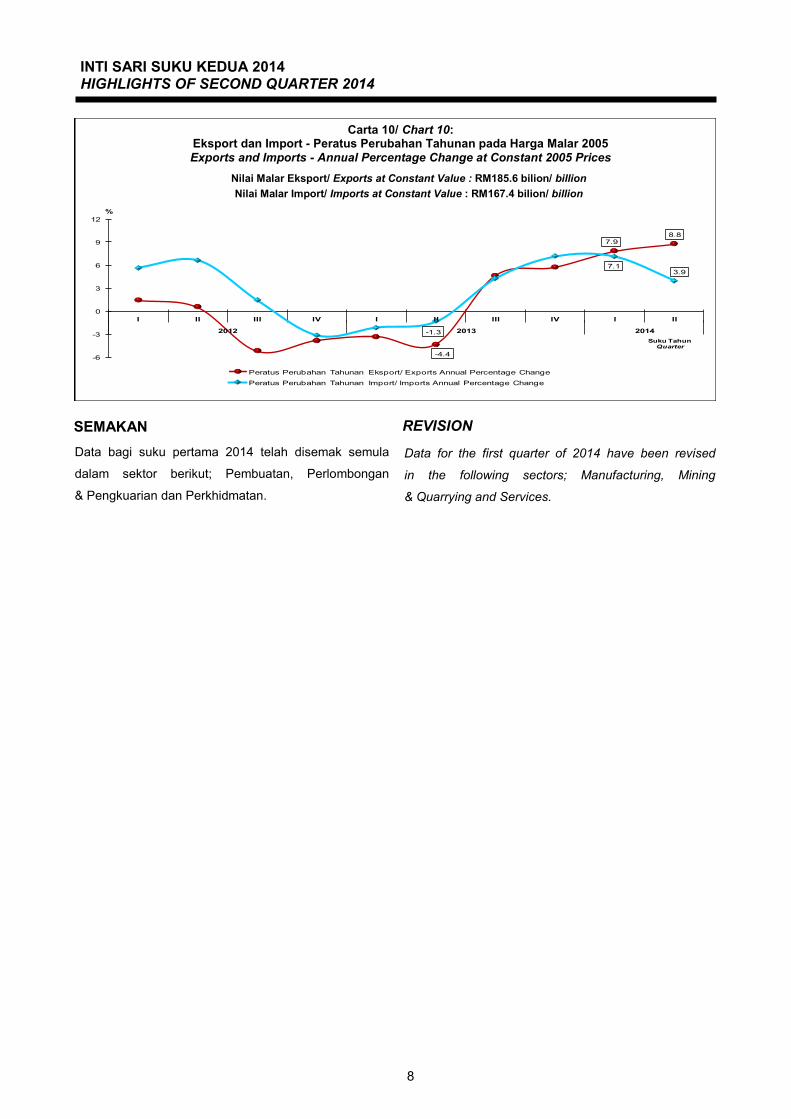
EKSPORT DAN IMPORT EXPORTS AND IMPORTS
Prestasi Eksport yang memberangsangkan pada
8.8 peratus (Carta 10), didorong oleh pertumbuhan dua
digit dalam barangan. Peningkatan yang ketara oleh
permintaan luaran bagi produk berkaitan elektrik
& elektronik telah mengukuhkan momentum
pertumbuhan Eksport.
Import mencatatkan peningkatan 3.9 peratus
(ST1 2014: 7.1 peratus) disokong oleh import
barangan. Eksport Bersih melonjak kepada
91.0 peratus berikutan pengembangan yang lebih laju
dalam eksport.
Dari segi pelarasan musim suku tahun ke suku tahun,
Eksport tumbuh 1.2 peratus manakala Import susut
2.4 peratus.
Exports performed tremendously at 8.8 per cent
(Chart 10), boosted by the double-digit growth in
goods. The notable increase by external demand for
products related to electrical & electronics has
reinforced the momentum of Exports.
Imports recorded a growth of 3.9 per cent
(Q1 2014: 7.1 per cent) supported by imports of goods.
Due to the faster expansion in exports, Net Exports
increased remarkably to 91.0 per cent.
On a quarter-on-quarter seasonally adjusted, Exports
grew 1.2 per cent while Imports declined 2.4 per cent.
INTI SARI SUKU KEDUA 2014 HIGHLIGHTS OF SECOND QUARTER 2014
8
-4.4
7.98.8
-1.3
7.13.9
-6
-3
0
3
6
9
12
I II III IV I II III IV I II
2012 2013 2014
%
Peratus Perubahan Tahunan Eksport/ Exports Annual Percentage Change
Peratus Perubahan Tahunan Import/ Imports Annual Percentage Change
Suku TahunQuarter
Data for the first quarter of 2014 have been revised
in the following sectors; Manufacturing, Mining
& Quarrying and Services.
REVISION SEMAKAN
Data bagi suku pertama 2014 telah disemak semula
dalam sektor berikut; Pembuatan, Perlombongan
& Pengkuarian dan Perkhidmatan.
Carta 10/ Chart 10: Eksport dan Import - Peratus Perubahan Tahunan pada Harga Malar 2005
Exports and Imports - Annual Percentage Change at Constant 2005 Prices
Nilai Malar Eksport/ Exports at Constant Value : RM185.6 bilion/ billion
Nilai Malar Import/ Imports at Constant Value : RM167.4 bilion/ billion
SEKSYEN 1:
JADUAL RINGKASAN
SECTION 1: SUMMARY TABLES

Jadual Ringkasan
Summary Tables
III
III
IVI
IIII
IIV
III
III
IVI
II
Pe
rta
nia
n1
04
,302
94,5
89
91,8
19
24,7
18
26,9
60
28,0
27
24,5
97
22,5
74
23,4
01
25,8
26
22,7
89
21,0
16
20,4
81
25,0
51
25,2
71
23,5
91
24,1
83
Ag
ric
ult
ure
Pe
rlo
mb
on
ga
n d
an
pe
ng
ku
ari
an
92,4
06
97,4
31
99,0
07
23,2
17
22,2
30
22,3
55
24,6
05
26,7
23
23,7
90
22,6
14
24,3
04
26,0
15
22,4
83
23,5
50
26,9
60
28,3
15
25,6
95
Min
ing
an
d
qu
arr
yin
g
Pe
mb
ua
tan
215
,125
228
,221
235
,988
52,2
85
52,8
58
54,4
77
55,5
05
55,5
71
57,1
05
57,0
30
58,5
16
55,1
18
58,1
81
59,4
24
63,2
65
60,5
10
64,5
74
Ma
nu
factu
rin
g
Pe
mb
ina
an
29,6
48
36,5
71
41,2
80
6,7
05
6,9
89
7,7
71
8,1
83
8,2
06
8,9
87
9,5
09
9,8
69
9,5
51
10,0
52
10,6
69
11,0
08
11,5
01
11,2
19
Co
ns
tru
cti
on
Pe
rkh
idm
ata
n4
35
,148
474
,950
507
,875
102
,777
106
,734
109
,992
115
,644
112
,017
117
,037
120
,257
125
,639
119
,677
123
,551
128
,822
135
,826
130
,203
133
,852
Se
rvic
es
cam
pu
r D
uti
im
po
rt8
,711
10,1
86
10,7
63
1,8
47
2,2
84
2,3
20
2,2
60
2,4
00
2,5
63
2,6
00
2,6
23
2,5
21
2,7
59
2,7
59
2,7
24
2,7
81
3,3
17
plu
s I
mp
ort
du
tie
s
KD
NK
pa
da
ha
rga
pe
mb
eli
885
,339
941
,949
986
,733
211
,549
218
,056
224
,941
230
,794
227
,491
232
,884
237
,835
243
,739
233
,898
237
,507
250
,275
265
,053
256
,901
262
,840
GD
P a
t p
urc
ha
se
rs'
pri
ces
III
III
IVI
IIII
IIV
III
III
IVI
II
Pe
rta
nia
n5
4,2
50
54,9
63
56,0
95
12,0
62
13,4
84
15,0
85
13,6
18
12,4
08
12,9
12
15,2
20
14,4
23
13,1
73
12,9
47
15,5
27
14,4
48
13,4
73
13,8
60
Ag
ric
ult
ure
Pe
rlo
mb
on
ga
n d
an
pe
ng
ku
ari
an
62,6
07
63,2
43
63,6
80
16,6
88
14,9
55
15,2
06
15,7
57
16,6
60
15,2
07
14,9
53
16,4
23
16,4
19
15,8
69
15,1
65
16,2
26
16,2
81
16,1
95
Min
ing
an
d
qu
arr
yin
g
Pe
mb
ua
tan
178
,237
186
,748
193
,237
43,2
21
44,1
40
45,2
76
45,5
99
45,1
29
46,6
47
46,7
64
48,2
08
45,3
30
48,4
09
48,7
62
50,7
36
48,4
30
51,9
64
Ma
nu
factu
rin
g
Pe
mb
ina
an
22,4
64
26,6
40
29,5
54
5,1
68
5,3
73
5,8
95
6,0
28
5,9
90
6,5
57
6,9
77
7,1
16
6,8
42
7,2
12
7,6
88
7,8
13
8,1
32
7,9
26
Co
ns
tru
cti
on
Pe
rkh
idm
ata
n3
85
,550
410
,339
434
,460
91,8
03
94,6
46
97,5
91
101
,511
97,0
03
100
,942
104
,367
108
,027
102
,906
106
,017
110
,582
114
,954
109
,671
112
,394
Se
rvic
es
cam
pu
r D
uti
im
po
rt8
,653
10,0
01
10,5
86
1,8
12
2,3
62
2,4
19
2,0
60
2,2
98
2,5
88
2,7
00
2,4
15
2,4
24
2,7
94
2,8
67
2,5
01
2,6
58
3,2
84
plu
s I
mp
ort
du
tie
s
KD
NK
pa
da
ha
rga
pe
mb
eli
711
,760
751
,934
787
,611
170
,755
174
,960
181
,472
184
,573
179
,489
184
,852
190
,980
196
,612
187
,093
193
,249
200
,591
206
,678
198
,646
205
,623
GD
P a
t p
urc
ha
se
rs'
pri
ces
Ja
du
al 1
A:
KD
NK
me
ng
iku
t J
en
is A
kti
vit
i E
ko
no
mi p
ad
a H
arg
a S
em
as
a -
RM
Ju
ta
Ta
ble
1A
: G
DP
by
Kin
d o
f E
co
no
mic
Ac
tiv
ity
at
Cu
rre
nt
Pri
ce
s -
RM
Millio
n
Jen
is a
kti
vit
i
eko
no
mi
2011
2012
e2011
2012
Kin
d o
f e
co
no
mic
acti
vit
y2013
p2014
2013
2013
10
Ja
du
al 2
A:
KD
NK
me
ng
iku
t J
en
is A
kti
vit
i E
ko
no
mi p
ad
a H
arg
a M
ala
r 2
00
5 -
RM
Ju
ta
Ta
ble
2A
: G
DP
by
Kin
d o
f E
co
no
mic
Ac
tiv
ity
at
Co
ns
tan
t 2
00
5 P
ric
es
- R
M M
illio
n
Jen
is a
kti
vit
i
eko
no
mi
2011
2012
e2011
2012
Kin
d o
f e
co
no
mic
acti
vit
y
2014
2013
p
III
III
IVI
IIII
IIV
III
III
IVI
II
Pe
rta
nia
n2
6.3
-9.3
-2.9
33.1
42.4
29.5
4.9
-8.7
-13.2
-7.9
-7.4
-6.9
-12.5
-3.0
10.9
12.3
18.1
Ag
ric
ult
ure
Pe
rlo
mb
on
ga
n d
an
pe
ng
ku
ari
an
6.7
5.4
1.6
2.7
6.0
6.5
11.5
15.1
7.0
1.2
-1.2
-2.6
-5.5
4.1
10.9
8.8
14.3
Min
ing
an
d
qu
arr
yin
g
Pe
mb
ua
tan
10.0
6.1
3.4
9.9
9.4
10.8
9.9
6.3
8.0
4.7
5.4
-0.8
1.9
4.2
8.1
9.8
11.0
Ma
nu
factu
rin
g
Pe
mb
ina
an
9.4
23.4
12.9
8.0
5.9
9.5
13.6
22.4
28.6
22.4
20.6
16.4
11.9
12.2
11.5
20.4
11.6
Co
ns
tru
cti
on
Pe
rkh
idm
ata
n9
.49
.16
.99
.59
.98
.99
.49
.09
.79
.38
.66
.85
.67
.18
.18
.88
.3S
erv
ices
cam
pu
r D
uti
im
po
rt1
3.6
16.9
5.7
16.1
15.8
24.9
0.5
30.0
12.2
12.1
16.0
5.0
7.7
6.1
3.9
10.3
20.2
plu
s I
mp
ort
du
tie
s
KD
NK
pa
da
ha
rga
pe
mb
eli
11.0
6.4
4.8
11.1
12.4
11.5
9.3
7.5
6.8
5.7
5.6
2.8
2.0
5.2
8.7
9.8
10.7
GD
P a
t p
urc
ha
se
rs'
pri
ces
III
III
IVI
IIII
IIV
III
III
IVI
II
Pe
rta
nia
n5
.81
.32
.1-0
.37
.68
.76
.82
.9-4
.20
.95
.96
.20
.32
.00
.22
.37
.1A
gri
cu
ltu
re
Pe
rlo
mb
on
ga
n d
an
pe
ng
ku
ari
an
-5.4
1.0
0.7
-3.6
-9.0
-5.6
-3.5
-0.2
1.7
-1.7
4.2
-1.5
4.4
1.4
-1.2
-0.8
2.1
Min
ing
an
d
qu
arr
yin
g
Pe
mb
ua
tan
4.7
4.8
3.5
5.8
2.6
5.3
5.1
4.4
5.7
3.3
5.7
0.4
3.8
4.3
5.2
6.8
7.3
Ma
nu
factu
rin
g
Pe
mb
ina
an
4.7
18.6
10.9
5.1
2.1
4.0
7.3
15.9
22.0
18.4
18.1
14.2
10.0
10.2
9.8
18.9
9.9
Co
ns
tru
cti
on
Pe
rkh
idm
ata
n7
.16
.45
.97
.37
.17
.36
.95
.76
.76
.96
.46
.15
.06
.06
.46
.66
.0S
erv
ices
cam
pu
r D
uti
im
po
rt1
3.0
15.6
5.8
18.1
14.7
23.5
-2.2
26.8
9.6
11.6
17.2
5.5
8.0
6.2
3.5
9.7
17.5
plu
s I
mp
ort
du
tie
s
KD
NK
pa
da
ha
rga
pe
mb
eli
5.2
5.6
4.7
5.2
4.3
5.8
5.4
5.1
5.7
5.2
6.5
4.2
4.5
5.0
5.1
6.2
6.4
GD
P a
t p
urc
ha
se
rs'
pri
ces
Jad
ua
l 1
B:
KD
NK
me
ng
iku
t J
en
is A
kti
vit
i E
ko
no
mi
pa
da
Ha
rga S
em
asa
- P
era
tus
pe
rub
ah
an
da
ri s
uk
u t
ah
un
ya
ng
sam
a t
ah
un
seb
elu
mn
ya
Ta
ble
1B
: G
DP
by
Kin
d o
f E
co
no
mic
Ac
tiv
ity
at
Cu
rre
nt
Pri
ces
- P
erc
en
tag
e c
ha
ng
e f
rom
co
rre
sp
on
din
g q
ua
rte
r o
f p
rece
din
g y
ea
r
Jen
is a
kti
vit
i
eko
no
mi
2011
2012
e2011
2012
Kin
d o
f e
co
no
mic
acti
vit
y
2013
2014
2013
11
Jad
ua
l 2
B:
KD
NK
me
ng
iku
t J
en
is A
kti
vit
i E
ko
no
mi
pa
da
Ha
rga M
ala
r 2
00
5 -
Pe
ratu
s p
eru
ba
ha
n d
ari
su
ku
ta
hu
n y
an
g s
am
a t
ah
un
seb
elu
mn
ya
Ta
ble
2B
: G
DP
by
Kin
d o
f E
co
no
mic
Ac
tiv
ity
at
Co
ns
tan
t 2
00
5 P
ric
es
- P
erc
en
tag
e c
ha
ng
e f
rom
co
rre
sp
on
din
g q
ua
rte
r o
f p
rece
din
g y
ea
r
Jen
is a
kti
vit
i
eko
no
mi
2011
2012
e2011
2012
Kin
d o
f e
co
no
mic
acti
vit
y
2013
p
2013
p2014
III
III
IVI
IIII
IIV
III
III
IVI
II
Pe
rta
nia
n2
6.3
-9.3
-2.9
5.4
9.1
4.0
-12.2
-8.2
3.7
10.4
-11.8
-7.8
-2.5
22.3
0.9
-6.6
2.5
Ag
ric
ult
ure
Pe
rlo
mb
on
ga
n d
an
pe
ng
ku
ari
an
6.7
5.4
1.6
5.3
-4.3
0.6
10.1
8.6
-11.0
-4.9
7.5
7.0
-13.6
4.7
14.5
5.0
-9.3
Min
ing
an
d
qu
arr
yin
g
Pe
mb
ua
tan
10.0
6.1
3.4
3.6
1.1
3.1
1.9
0.1
2.8
-0.1
2.6
-5.8
5.6
2.1
6.5
-4.4
6.7
Ma
nu
factu
rin
g
Pe
mb
ina
an
9.4
23.4
12.9
-6.9
4.2
11.2
5.3
0.3
9.5
5.8
3.8
-3.2
5.3
6.1
3.2
4.5
-2.5
Co
ns
tru
cti
on
Pe
rkh
idm
ata
n9
.49
.16
.9-2
.83
.83
.15
.1-3
.14
.52
.84
.5-4
.73
.24
.35
.4-4
.12
.8S
erv
ices
cam
pu
r D
uti
im
po
rt1
3.6
16.9
5.7
-17.9
23.7
1.5
-2.6
6.2
6.8
1.5
0.9
-3.9
9.4
0.0
-1.3
2.1
19.3
plu
s I
mp
ort
du
tie
s
KD
NK
pa
da
ha
rga
pe
mb
eli
11.0
6.4
4.8
0.2
3.1
3.2
2.6
-1.4
2.4
2.1
2.5
-4.0
1.5
5.4
5.9
-3.1
2.3
GD
P a
t p
urc
ha
se
rs'
pri
ces
III
III
IVI
IIII
IIV
III
III
IVI
II
Pe
rta
nia
n5
.81
.32
.1-5
.41
1.8
11.9
-9.7
-8.9
4.1
17.9
-5.2
-8.7
-1.7
19.9
-6.9
-6.7
2.9
Ag
ric
ult
ure
Pe
rlo
mb
on
ga
n d
an
pe
ng
ku
ari
an
-5.4
1.0
0.7
2.2
-10.4
1.7
3.6
5.7
-8.7
-1.7
9.8
0.0
-3.3
-4.4
7.0
0.3
-0.5
Min
ing
an
d
qu
arr
yin
g
Pe
mb
ua
tan
4.7
4.8
3.5
-0.4
2.1
2.6
0.7
-1.0
3.4
0.2
3.1
-6.0
6.8
0.7
4.0
-4.5
7.3
Ma
nu
factu
rin
g
Pe
mb
ina
an
4.7
18.6
10.9
-8.0
4.0
9.7
2.3
-0.6
9.5
6.4
2.0
-3.9
5.4
6.6
1.6
4.1
-2.5
Co
ns
tru
cti
on
Pe
rkh
idm
ata
n7
.16
.45
.9-3
.33
.13
.14
.0-4
.44
.13
.43
.5-4
.73
.04
.34
.0-4
.62
.5S
erv
ices
cam
pu
r D
uti
im
po
rt1
3.0
15.6
5.8
-14.0
30.3
2.4
-14.8
11.6
12.6
4.3
-10.5
0.3
15.3
2.6
-12.8
6.3
23.6
plu
s I
mp
ort
du
tie
s
KD
NK
pa
da
ha
rga
pe
mb
eli
5.2
5.6
4.7
-2.5
2.5
3.7
1.7
-2.8
3.0
3.3
2.9
-4.8
3.3
3.8
3.0
-3.9
3.5
GD
P a
t p
urc
ha
se
rs'
pri
ces
Jad
ua
l 1
C:
KD
NK
me
ng
iku
t J
en
is A
kti
vit
i E
ko
no
mi
pa
da
Ha
rga S
em
asa
- P
era
tus
pe
rub
ah
an
da
ri s
uk
u t
ah
un
seb
elu
mn
ya
Ta
ble
1C
: G
DP
by
Kin
d o
f E
co
no
mic
Ac
tiv
ity
at
Cu
rre
nt
Pri
ces
- P
erc
en
tag
e c
ha
ng
e f
rom
pre
ce
din
g q
ua
rte
r
Jen
is a
kti
vit
i
eko
no
mi
2011
2012
Kin
d o
f e
co
no
mic
acti
vit
y2012
e2013
p2014
2011
2012
e2013
p2013
12
Jad
ua
l 2
C:
KD
NK
me
ng
iku
t J
en
is A
kti
vit
i E
ko
no
mi
pa
da
Ha
rga M
ala
r 2
00
5 -
Pe
ratu
s p
eru
ba
ha
n d
ari
su
ku
ta
hu
n s
eb
elu
mn
ya
Ta
ble
2C
: G
DP
by
Kin
d o
f E
co
no
mic
Ac
tiv
ity
at
Co
ns
tan
t 2
00
5 P
ric
es
- P
erc
en
tag
e c
ha
ng
e f
rom
pre
ce
din
g q
ua
rte
r
Jen
is a
kti
vit
i
eko
no
mi
2011
2012
Kin
d o
f e
co
no
mic
acti
vit
y
2013
2011
2014

III
III
IVI
IIII
IIV
III
III
IVI
II
Pe
rta
nia
n1
1.8
10.0
9.3
11.7
12.4
12.5
10.7
9.9
10.0
10.9
9.3
9.0
8.6
10.0
9.5
9.2
9.2
Ag
ric
ult
ure
Pe
rlo
mb
on
ga
n d
an
pe
ng
ku
ari
an
10.4
10.3
10.0
11.0
10.2
9.9
10.7
11.7
10.2
9.5
10.0
11.1
9.5
9.4
10.2
11.0
9.8
Min
ing
an
d
qu
arr
yin
g
Pe
mb
ua
tan
24.3
24.2
23.9
24.7
24.2
24.2
24.0
24.4
24.5
24.0
24.0
23.6
24.5
23.7
23.9
23.6
24.6
Ma
nu
factu
rin
g
Pe
mb
ina
an
3.3
3.9
4.2
3.2
3.2
3.5
3.5
3.6
3.9
4.0
4.0
4.1
4.2
4.3
4.2
4.5
4.3
Co
ns
tru
cti
on
Pe
rkh
idm
ata
n4
9.2
50.4
51.5
48.6
48.9
48.9
50.1
49.2
50.3
50.6
51.5
51.2
52.0
51.5
51.2
50.7
50.9
Se
rvic
es
cam
pu
r D
uti
im
po
rt1
.01
.11
.10
.91
.01
.01
.01
.11
.11
.11
.11
.11
.21
.11
.01
.11
.3p
lus
Im
po
rt d
uti
es
KD
NK
pa
da
ha
rga
pe
mb
eli
100
.01
00
.01
00
.01
00
.01
00
.01
00
.01
00
.01
00
.01
00
.01
00
.01
00
.01
00
.01
00
.01
00
.01
00
.01
00
.01
00
.0G
DP
at
pu
rch
ase
rs'
pri
ces
III
III
IVI
IIII
IIV
III
III
IVI
II
Pe
rta
nia
n7
.67
.37
.17
.17
.78
.37
.46
.97
.08
.07
.37
.06
.77
.77
.06
.86
.7A
gri
cu
ltu
re
Pe
rlo
mb
on
ga
n d
an
pe
ng
ku
ari
an
8.8
8.4
8.1
9.8
8.5
8.4
8.5
9.3
8.2
7.8
8.4
8.8
8.2
7.6
7.9
8.2
7.9
Min
ing
an
d
qu
arr
yin
g
Pe
mb
ua
tan
25.0
24.8
24.5
25.3
25.2
24.9
24.7
25.1
25.2
24.5
24.5
24.2
25.1
24.3
24.5
24.4
25.3
Ma
nu
factu
rin
g
Pe
mb
ina
an
3.2
3.5
3.8
3.0
3.1
3.2
3.3
3.3
3.5
3.7
3.6
3.7
3.7
3.8
3.8
4.1
3.9
Co
ns
tru
cti
on
Pe
rkh
idm
ata
n5
4.2
54.6
55.2
53.8
54.1
53.8
55.0
54.0
54.6
54.6
54.9
55.0
54.9
55.1
55.6
55.2
54.7
Se
rvic
es
cam
pu
r D
uti
im
po
rt1
.21
.31
.31
.11
.41
.31
.11
.31
.41
.41
.21
.31
.41
.41
.21
.31
.6p
lus
Im
po
rt d
uti
es
KD
NK
pa
da
ha
rga
pe
mb
eli
100
.01
00
.01
00
.01
00
.01
00
.01
00
.01
00
.01
00
.01
00
.01
00
.01
00
.01
00
.01
00
.01
00
.01
00
.01
00
.01
00
.0G
DP
at
pu
rch
ase
rs'
pri
ces
Jad
ua
l 1
D:
KD
NK
me
ng
iku
t J
en
is A
kti
vit
i E
ko
no
mi
pa
da
Ha
rga S
em
asa
- P
em
bah
ag
ian
pe
ratu
s k
ep
ad
a K
DN
K
Ta
ble
1D
: G
DP
by
Kin
d o
f E
co
no
mic
Ac
tiv
ity
at
Cu
rre
nt
Pri
ces
- P
erc
en
tag
e s
ha
re t
o G
DP
Jen
is a
kti
vit
i
eko
no
mi
2011
2012
Kin
d o
f e
co
no
mic
acti
vit
y2012
e2013
p2014
2011
2012
e2013
p2013
13
Jad
ua
l 2
D:
KD
NK
me
ng
iku
t J
en
is A
kti
vit
i E
ko
no
mi
pa
da
Ha
rga M
ala
r 2
00
5 -
Pe
mb
ah
ag
ian
pe
ratu
s k
ep
ad
a K
DN
K
Ta
ble
2D
: G
DP
by
Kin
d o
f E
co
no
mic
Ac
tiv
ity
at
Co
ns
tan
t 2
00
5 P
ric
es
- P
erc
en
tag
e s
ha
re t
o G
DP
Jen
is a
kti
vit
i
eko
no
mi
2011
2012
Kin
d o
f e
co
no
mic
acti
vit
y
2013
2011
2014
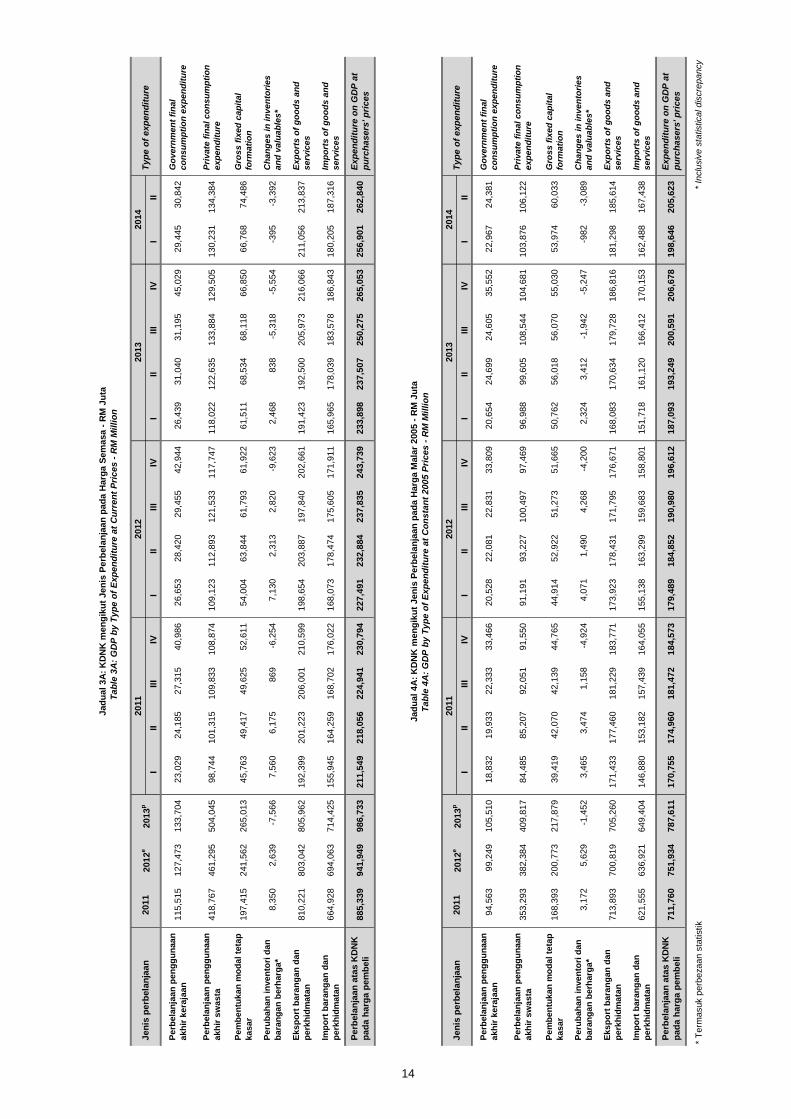
III
III
IVI
IIII
IIV
III
III
IVI
II
Perb
ela
nja
an
pen
gg
un
aan
akh
ir k
era
jaan
115
,515
127
,473
133
,704
23,0
29
24,1
85
27,3
15
40,9
86
26,6
53
28,4
20
29,4
55
42,9
44
26,4
39
31,0
40
31,1
95
45,0
29
29,4
45
30,8
42
Go
vern
men
t fi
nal
co
nsu
mp
tio
n e
xp
en
dit
ure
Perb
ela
nja
an
pen
gg
un
aan
akh
ir s
wasta
418
,767
461
,295
504
,045
98,7
44
101
,315
109
,833
108
,874
109
,123
112
,893
121
,533
117
,747
118
,022
122
,635
133
,884
129
,505
130
,231
134
,384
Pri
vate
fin
al co
nsu
mp
tio
n
exp
en
dit
ure
Pem
ben
tukan
mo
dal te
tap
kasar
197
,415
241
,562
265
,013
45,7
63
49,4
17
49,6
25
52,6
11
54,0
04
63,8
44
61,7
93
61,9
22
61,5
11
68,5
34
68,1
18
66,8
50
66,7
68
74,4
86
Gro
ss f
ixed
cap
ital
form
ati
on
Peru
bah
an
in
ven
tori
dan
ba
ran
ga
n b
erh
arg
a*
8,3
50
2,6
39
-7,5
66
7,5
60
6,1
75
869
-6,2
54
7,1
30
2,3
13
2,8
20
-9,6
23
2,4
68
838
-5,3
18
-5,5
54
-395
-3,3
92
Ch
an
ges in
in
ven
tori
es
an
d v
alu
ab
les*
Eksp
ort
bara
ng
an
dan
pe
rkh
idm
ata
n8
10
,221
803
,042
805
,962
192
,399
201
,223
206
,001
210
,599
198
,654
203
,887
197
,840
202
,661
191
,423
192
,500
205
,973
216
,066
211
,056
213
,837
Exp
ort
s o
f g
oo
ds a
nd
serv
ices
Imp
ort
bara
ng
an
dan
pe
rkh
idm
ata
n6
64
,928
694
,063
714
,425
155
,945
164
,259
168
,702
176
,022
168
,073
178
,474
175
,605
171
,911
165
,965
178
,039
183
,578
186
,843
180
,205
187
,316
Imp
ort
s o
f g
oo
ds a
nd
serv
ices
Pe
rbela
nja
an
ata
s K
DN
K
pa
da
ha
rga p
em
beli
885
,339
941
,949
986
,733
211
,549
218
,056
224
,941
230
,794
227
,491
232
,884
237
,835
243
,739
233
,898
237
,507
250
,275
265
,053
256
,901
262
,840
Ex
pe
nd
itu
re o
n G
DP
at
pu
rch
ase
rs' p
ric
es
III
III
IVI
IIII
IIV
III
III
IVI
II
Perb
ela
nja
an
pen
gg
un
aan
akh
ir k
era
jaan
94,5
63
99,2
49
105
,510
18,8
32
19,9
33
22,3
33
33,4
66
20,5
28
22,0
81
22,8
31
33,8
09
20,6
54
24,6
99
24,6
05
35,5
52
22,9
67
24,3
81
Go
vern
men
t fi
nal
co
nsu
mp
tio
n e
xp
en
dit
ure
Perb
ela
nja
an
pen
gg
un
aan
akh
ir s
wasta
353
,293
382
,384
409
,817
84,4
85
85,2
07
92,0
51
91,5
50
91,1
91
93,2
27
100
,497
97,4
69
96,9
88
99,6
05
108
,544
104
,681
103
,876
106
,122
Pri
vate
fin
al co
nsu
mp
tio
n
exp
en
dit
ure
Pem
ben
tukan
mo
dal te
tap
kasar
168
,393
200
,773
217
,879
39,4
19
42,0
70
42,1
39
44,7
65
44,9
14
52,9
22
51,2
73
51,6
65
50,7
62
56,0
18
56,0
70
55,0
30
53,9
74
60,0
33
Gro
ss f
ixed
cap
ital
form
ati
on
Peru
bah
an
in
ven
tori
dan
ba
ran
ga
n b
erh
arg
a*
3,1
72
5,6
29
-1,4
52
3,4
65
3,4
74
1,1
58
-4,9
24
4,0
71
1,4
90
4,2
68
-4,2
00
2,3
24
3,4
12
-1,9
42
-5,2
47
-982
-3,0
89
Ch
an
ges in
in
ven
tori
es
an
d v
alu
ab
les*
Eksp
ort
bara
ng
an
dan
pe
rkh
idm
ata
n7
13
,893
700
,819
705
,260
171
,433
177
,460
181
,229
183
,771
173
,923
178
,431
171
,795
176
,671
168
,083
170
,634
179
,728
186
,816
181
,298
185
,614
Exp
ort
s o
f g
oo
ds a
nd
serv
ices
Imp
ort
bara
ng
an
dan
pe
rkh
idm
ata
n6
21
,555
636
,921
649
,404
146
,880
153
,182
157
,439
164
,055
155
,138
163
,299
159
,683
158
,801
151
,718
161
,120
166
,412
170
,153
162
,488
167
,438
Imp
ort
s o
f g
oo
ds a
nd
serv
ices
Pe
rbela
nja
an
ata
s K
DN
K
pa
da
ha
rga p
em
beli
711
,760
751
,934
787
,611
170
,755
174
,960
181
,472
184
,573
179
,489
184
,852
190
,980
196
,612
187
,093
193
,249
200
,591
206
,678
198
,646
205
,623
Ex
pe
nd
itu
re o
n G
DP
at
pu
rch
ase
rs' p
ric
es
* T
erm
asuk p
erb
eza
an
sta
tistik
2014
2014
2013
2013
2011
2012
2011
2012
e2013
p
2011
2012
e2013
p
14
* In
clu
siv
e s
tatistica
l d
iscre
pa
ncy
Jad
ua
l 3
A:
KD
NK
me
ng
iku
t J
en
is P
erb
ela
nja
an
pa
da
Ha
rga S
em
asa
- R
M J
uta
Ta
ble
3A
: G
DP
by
Ty
pe
of
Ex
pe
nd
itu
re a
t C
urr
en
t P
ric
es
- R
M M
illi
on
Jen
is p
erb
ela
nja
an
2011
2012
Ty
pe
of
exp
en
dit
ure
Jad
ua
l 4
A:
KD
NK
me
ng
iku
t J
en
is P
erb
ela
nja
an
pa
da
Ha
rga M
ala
r 2
00
5 -
RM
Ju
ta
Ta
ble
4A
: G
DP
by
Ty
pe
of
Ex
pe
nd
itu
re a
t C
on
sta
nt
200
5 P
ric
es
- R
M M
illi
on
Jen
is p
erb
ela
nja
an
T
yp
e o
f e
xp
en
dit
ure
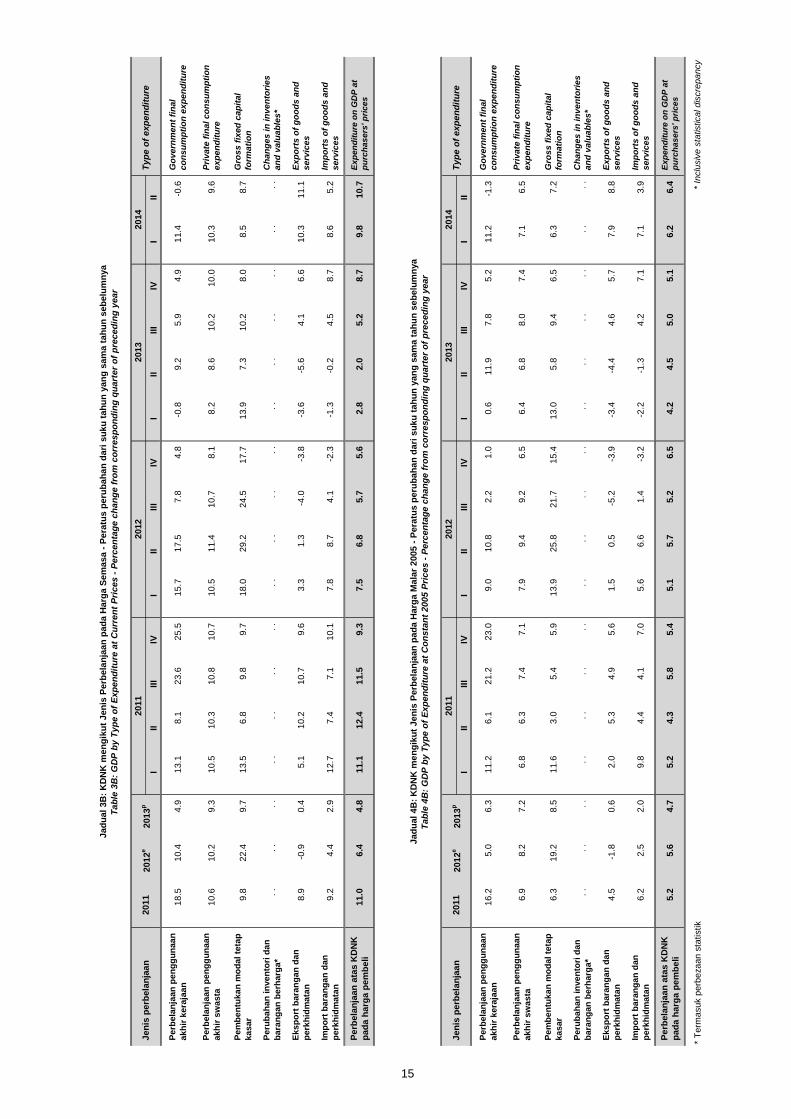
III
III
IVI
IIII
IIV
III
III
IVI
II
Perb
ela
nja
an
pen
gg
un
aan
akh
ir k
era
jaan
18.5
10.4
4.9
13.1
8.1
23.6
25.5
15.7
17.5
7.8
4.8
-0.8
9.2
5.9
4.9
11.4
-0.6
Go
vern
men
t fi
nal
co
nsu
mp
tio
n e
xp
en
dit
ure
Perb
ela
nja
an
pen
gg
un
aan
akh
ir s
wasta
10.6
10.2
9.3
10.5
10.3
10.8
10.7
10.5
11.4
10.7
8.1
8.2
8.6
10.2
10.0
10.3
9.6
Pri
vate
fin
al co
nsu
mp
tio
n
exp
en
dit
ure
Pem
ben
tukan
mo
dal te
tap
kasar
9.8
22.4
9.7
13.5
6.8
9.8
9.7
18.0
29.2
24.5
17.7
13.9
7.3
10.2
8.0
8.5
8.7
Gro
ss f
ixed
cap
ital
form
ati
on
Peru
bah
an
in
ven
tori
dan
ba
ran
ga
n b
erh
arg
a*
. .
. .
. .
. .
. .
. .
. .
. .
. .
. .
. .
. .
. .
. .
. .
. .
. .
Ch
an
ges in
in
ven
tori
es
an
d v
alu
ab
les*
Eksp
ort
bara
ng
an
dan
pe
rkh
idm
ata
n8
.9-0
.90
.45
.11
0.2
10.7
9.6
3.3
1.3
-4.0
-3.8
-3.6
-5.6
4.1
6.6
10.3
11.1
Exp
ort
s o
f g
oo
ds a
nd
serv
ices
Imp
ort
bara
ng
an
dan
pe
rkh
idm
ata
n9
.24
.42
.91
2.7
7.4
7.1
10.1
7.8
8.7
4.1
-2.3
-1.3
-0.2
4.5
8.7
8.6
5.2
Imp
ort
s o
f g
oo
ds a
nd
serv
ices
Pe
rbela
nja
an
ata
s K
DN
K
pa
da
ha
rga p
em
beli
11.0
6.4
4.8
11.1
12.4
11.5
9.3
7.5
6.8
5.7
5.6
2.8
2.0
5.2
8.7
9.8
10.7
Ex
pe
nd
itu
re o
n G
DP
at
pu
rch
as
ers
' p
ric
es
III
III
IVI
IIII
IIV
III
III
IVI
II
Perb
ela
nja
an
pen
gg
un
aan
akh
ir k
era
jaan
16.2
5.0
6.3
11.2
6.1
21.2
23.0
9.0
10.8
2.2
1.0
0.6
11.9
7.8
5.2
11.2
-1.3
Go
vern
men
t fi
nal
co
nsu
mp
tio
n e
xp
en
dit
ure
Perb
ela
nja
an
pen
gg
un
aan
akh
ir s
wasta
6.9
8.2
7.2
6.8
6.3
7.4
7.1
7.9
9.4
9.2
6.5
6.4
6.8
8.0
7.4
7.1
6.5
Pri
vate
fin
al co
nsu
mp
tio
n
exp
en
dit
ure
Pem
ben
tukan
mo
dal te
tap
kasar
6.3
19.2
8.5
11.6
3.0
5.4
5.9
13.9
25.8
21.7
15.4
13.0
5.8
9.4
6.5
6.3
7.2
Gro
ss f
ixed
cap
ital
form
ati
on
Peru
bah
an
in
ven
tori
dan
ba
ran
ga
n b
erh
arg
a*
. .
. .
. .
. .
. .
. .
. .
. .
. .
. .
. .
. .
. .
. .
. .
. .
. .
Ch
an
ges in
in
ven
tori
es
an
d v
alu
ab
les*
Eksp
ort
bara
ng
an
dan
pe
rkh
idm
ata
n4
.5-1
.80
.62
.05
.34
.95
.61
.50
.5-5
.2-3
.9-3
.4-4
.44
.65
.77
.98
.8E
xp
ort
s o
f g
oo
ds a
nd
serv
ices
Imp
ort
bara
ng
an
dan
pe
rkh
idm
ata
n6
.22
.52
.09
.84
.44
.17
.05
.66
.61
.4-3
.2-2
.2-1
.34
.27
.17
.13
.9Im
po
rts o
f g
oo
ds a
nd
serv
ices
Pe
rbela
nja
an
ata
s K
DN
K
pa
da
ha
rga p
em
beli
5.2
5.6
4.7
5.2
4.3
5.8
5.4
5.1
5.7
5.2
6.5
4.2
4.5
5.0
5.1
6.2
6.4
Ex
pe
nd
itu
re o
n G
DP
at
pu
rch
as
ers
' p
ric
es
* T
erm
asuk p
erb
eza
an
sta
tistik
2012
2013
2013
Ty
pe
of
exp
en
dit
ure
15
2012
e2013
p
2011
2012
e2013
p
2014
2014
* In
clu
siv
e s
tatistica
l d
iscre
pa
ncy
Jad
ua
l 3
B:
KD
NK
me
ng
iku
t J
en
is P
erb
ela
nja
an
pa
da
Ha
rga S
em
asa
- P
era
tus
pe
rub
ah
an
da
ri s
uk
u t
ah
un
ya
ng
sam
a t
ah
un
seb
elu
mn
ya
Ta
ble
3B
: G
DP
by
Ty
pe
of
Ex
pe
nd
itu
re a
t C
urr
en
t P
ric
es
- P
erc
en
tag
e c
ha
ng
e f
rom
co
rre
sp
on
din
g q
ua
rte
r o
f p
rece
din
g y
ea
r
Jen
is p
erb
ela
nja
an
2011
2012
Ty
pe
of
exp
en
dit
ure
Jad
ua
l 4
B:
KD
NK
me
ng
iku
t J
en
is P
erb
ela
nja
an
pa
da
Ha
rga M
ala
r 2
00
5 -
Pe
ratu
s p
eru
ba
ha
n d
ari
su
ku
ta
hu
n y
an
g s
am
a t
ah
un
seb
elu
mn
ya
Ta
ble
4B
: G
DP
by
Ty
pe
of
Ex
pe
nd
itu
re a
t C
on
sta
nt
200
5 P
ric
es
- P
erc
en
tag
e c
ha
ng
e f
rom
co
rre
sp
on
din
g q
ua
rte
r o
f p
rece
din
g y
ea
r
Jen
is p
erb
ela
nja
an
2011
2011
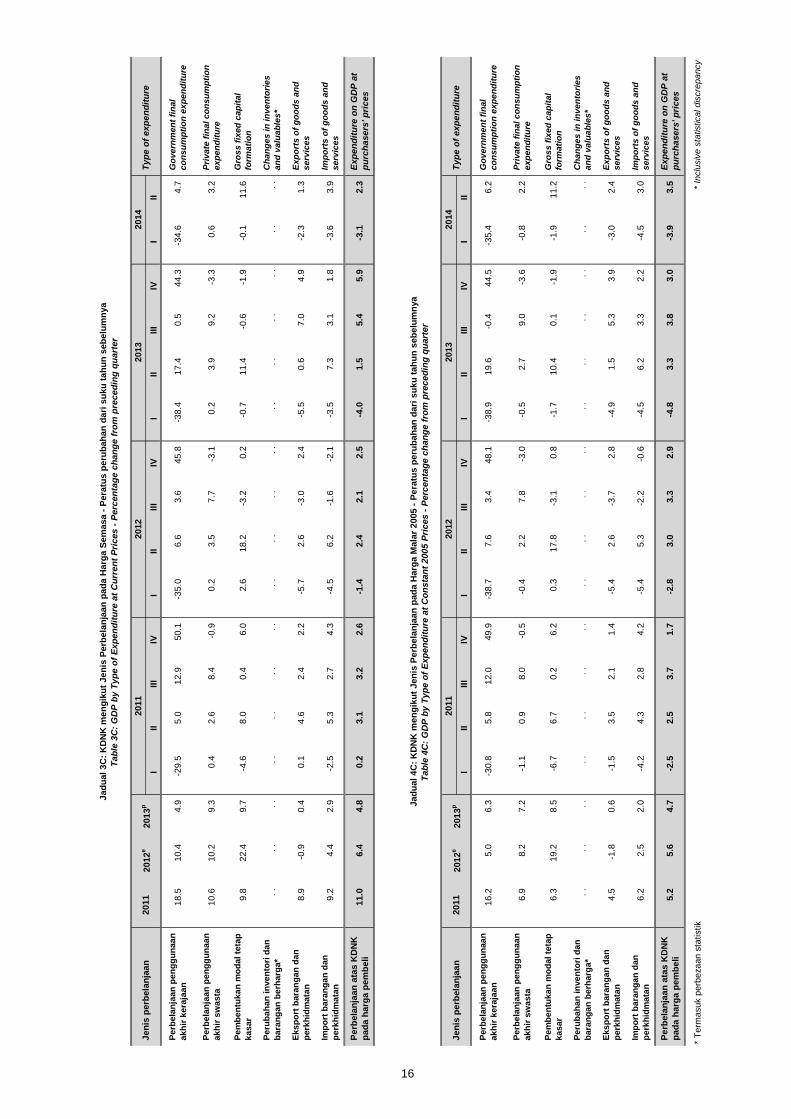
III
III
IVI
IIII
IIV
III
III
IVI
II
Perb
ela
nja
an
pen
gg
un
aan
akh
ir k
era
jaan
18.5
10.4
4.9
-29.5
5.0
12.9
50.1
-35.0
6.6
3.6
45.8
-38.4
17.4
0.5
44.3
-34.6
4.7
Go
vern
men
t fi
nal
co
nsu
mp
tio
n e
xp
en
dit
ure
Perb
ela
nja
an
pen
gg
un
aan
akh
ir s
wasta
10.6
10.2
9.3
0.4
2.6
8.4
-0.9
0.2
3.5
7.7
-3.1
0.2
3.9
9.2
-3.3
0.6
3.2
Pri
vate
fin
al co
nsu
mp
tio
n
exp
en
dit
ure
Pem
ben
tukan
mo
dal te
tap
kasar
9.8
22.4
9.7
-4.6
8.0
0.4
6.0
2.6
18.2
-3.2
0.2
-0.7
11.4
-0.6
-1.9
-0.1
11.6
Gro
ss f
ixed
cap
ital
form
ati
on
Peru
bah
an
in
ven
tori
dan
ba
ran
ga
n b
erh
arg
a*
. .
. .
. .
. .
. .
. .
. .
. .
. .
. .
. .
. .
. .
. .
. .
. .
. .
Ch
an
ges in
in
ven
tori
es
an
d v
alu
ab
les*
Eksp
ort
bara
ng
an
dan
pe
rkh
idm
ata
n8
.9-0
.90
.40
.14
.62
.42
.2-5
.72
.6-3
.02
.4-5
.50
.67
.04
.9-2
.31
.3E
xp
ort
s o
f g
oo
ds a
nd
serv
ices
Imp
ort
bara
ng
an
dan
pe
rkh
idm
ata
n9
.24
.42
.9-2
.55
.32
.74
.3-4
.56
.2-1
.6-2
.1-3
.57
.33
.11
.8-3
.63
.9Im
po
rts o
f g
oo
ds a
nd
serv
ices
Pe
rbela
nja
an
ata
s K
DN
K
pa
da
ha
rga p
em
beli
11.0
6.4
4.8
0.2
3.1
3.2
2.6
-1.4
2.4
2.1
2.5
-4.0
1.5
5.4
5.9
-3.1
2.3
Ex
pe
nd
itu
re o
n G
DP
at
pu
rch
ase
rs' p
ric
es
III
III
IVI
IIII
IIV
III
III
IVI
II
Perb
ela
nja
an
pen
gg
un
aan
akh
ir k
era
jaan
16.2
5.0
6.3
-30.8
5.8
12.0
49.9
-38.7
7.6
3.4
48.1
-38.9
19.6
-0.4
44.5
-35.4
6.2
Go
vern
men
t fi
nal
co
nsu
mp
tio
n e
xp
en
dit
ure
Perb
ela
nja
an
pen
gg
un
aan
akh
ir s
wasta
6.9
8.2
7.2
-1.1
0.9
8.0
-0.5
-0.4
2.2
7.8
-3.0
-0.5
2.7
9.0
-3.6
-0.8
2.2
Pri
vate
fin
al co
nsu
mp
tio
n
exp
en
dit
ure
Pem
ben
tukan
mo
dal te
tap
kasar
6.3
19.2
8.5
-6.7
6.7
0.2
6.2
0.3
17.8
-3.1
0.8
-1.7
10.4
0.1
-1.9
-1.9
11.2
Gro
ss f
ixed
cap
ital
form
ati
on
Peru
bah
an
in
ven
tori
dan
ba
ran
ga
n b
erh
arg
a*
. .
. .
. .
. .
. .
. .
. .
. .
. .
. .
. .
. .
. .
. .
. .
. .
. .
Ch
an
ges in
in
ven
tori
es
an
d v
alu
ab
les*
Eksp
ort
bara
ng
an
dan
pe
rkh
idm
ata
n4
.5-1
.80
.6-1
.53
.52
.11
.4-5
.42
.6-3
.72
.8-4
.91
.55
.33
.9-3
.02
.4E
xp
ort
s o
f g
oo
ds a
nd
serv
ices
Imp
ort
bara
ng
an
dan
pe
rkh
idm
ata
n6
.22
.52
.0-4
.24
.32
.84
.2-5
.45
.3-2
.2-0
.6-4
.56
.23
.32
.2-4
.53
.0Im
po
rts o
f g
oo
ds a
nd
serv
ices
Pe
rbela
nja
an
ata
s K
DN
K
pa
da
ha
rga p
em
beli
5.2
5.6
4.7
-2.5
2.5
3.7
1.7
-2.8
3.0
3.3
2.9
-4.8
3.3
3.8
3.0
-3.9
3.5
Ex
pe
nd
itu
re o
n G
DP
at
pu
rch
ase
rs' p
ric
es
* T
erm
asuk p
erb
eza
an
sta
tistik
2012
2013
2013
Ty
pe
of
exp
en
dit
ure
16
2012
e2013
p
2011
2012
e2013
p
2014
2014
* In
clu
siv
e s
tatistica
l d
iscre
pa
ncy
Jad
ua
l 3
C:
KD
NK
me
ng
iku
t J
en
is P
erb
ela
nja
an
pa
da
Ha
rga S
em
asa
- P
era
tus
pe
rub
ah
an
da
ri s
uk
u t
ah
un
seb
elu
mn
ya
Ta
ble
3C
: G
DP
by
Ty
pe
of
Ex
pe
nd
itu
re a
t C
urr
en
t P
ric
es
- P
erc
en
tag
e c
ha
ng
e f
rom
pre
ce
din
g q
ua
rte
r
Jen
is p
erb
ela
nja
an
2011
2012
Ty
pe
of
exp
en
dit
ure
Jad
ua
l 4
C:
KD
NK
me
ng
iku
t J
en
is P
erb
ela
nja
an
pa
da
Ha
rga M
ala
r 2
00
5 -
Pe
ratu
s p
eru
ba
ha
n d
ari
su
ku
ta
hu
n s
eb
elu
mn
ya
Ta
ble
4C
: G
DP
by
Ty
pe
of
Ex
pe
nd
itu
re a
t C
on
sta
nt
200
5 P
ric
es
- P
erc
en
tag
e c
ha
ng
e f
rom
pre
ce
din
g q
ua
rte
r
Jen
is p
erb
ela
nja
an
2011
2011
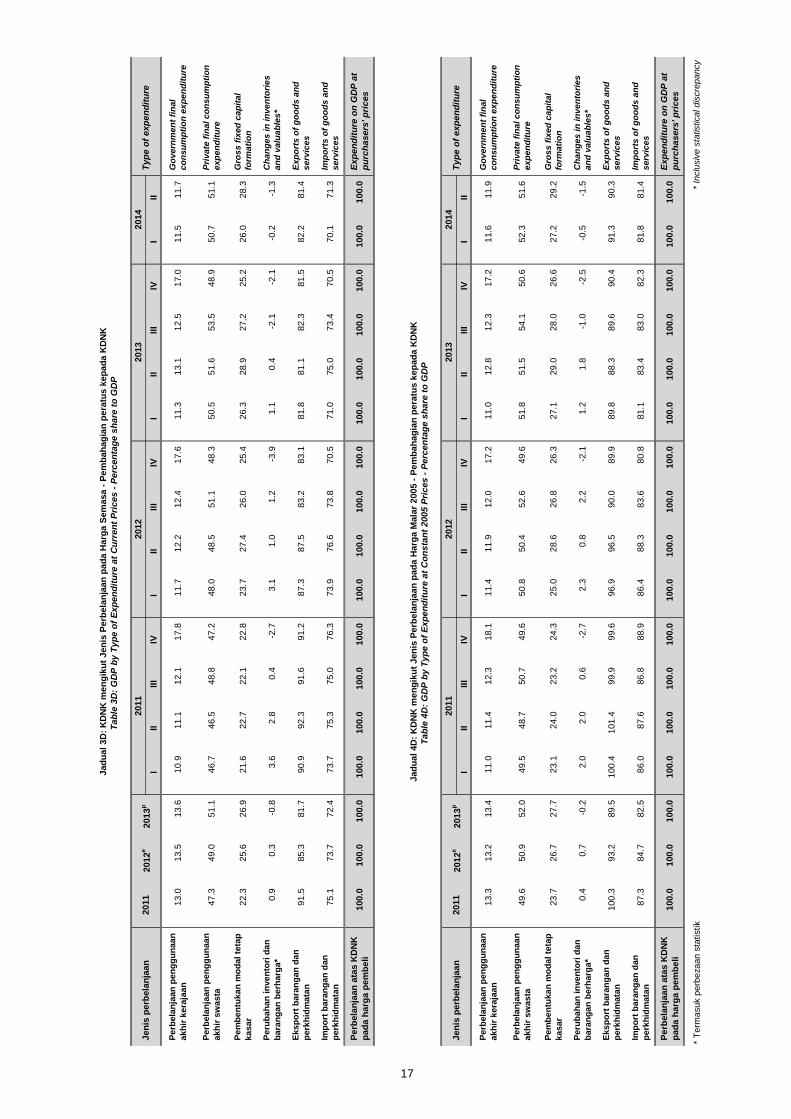
III
III
IVI
IIII
IIV
III
III
IVI
II
Perb
ela
nja
an
pen
gg
un
aan
akh
ir k
era
jaan
13.0
13.5
13.6
10.9
11.1
12.1
17.8
11.7
12.2
12.4
17.6
11.3
13.1
12.5
17.0
11.5
11.7
Go
vern
men
t fi
nal
co
nsu
mp
tio
n e
xp
en
dit
ure
Perb
ela
nja
an
pen
gg
un
aan
akh
ir s
wasta
47.3
49.0
51.1
46.7
46.5
48.8
47.2
48.0
48.5
51.1
48.3
50.5
51.6
53.5
48.9
50.7
51.1
Pri
vate
fin
al co
nsu
mp
tio
n
exp
en
dit
ure
Pem
ben
tukan
mo
dal te
tap
kasar
22.3
25.6
26.9
21.6
22.7
22.1
22.8
23.7
27.4
26.0
25.4
26.3
28.9
27.2
25.2
26.0
28.3
Gro
ss f
ixed
cap
ital
form
ati
on
Peru
bah
an
in
ven
tori
dan
ba
ran
ga
n b
erh
arg
a*
0.9
0.3
-0.8
3.6
2.8
0.4
-2.7
3.1
1.0
1.2
-3.9
1.1
0.4
-2.1
-2.1
-0.2
-1.3
Ch
an
ges in
in
ven
tori
es
an
d v
alu
ab
les*
Eksp
ort
bara
ng
an
dan
pe
rkh
idm
ata
n9
1.5
85.3
81.7
90.9
92.3
91.6
91.2
87.3
87.5
83.2
83.1
81.8
81.1
82.3
81.5
82.2
81.4
Exp
ort
s o
f g
oo
ds a
nd
serv
ices
Imp
ort
bara
ng
an
dan
pe
rkh
idm
ata
n7
5.1
73.7
72.4
73.7
75.3
75.0
76.3
73.9
76.6
73.8
70.5
71.0
75.0
73.4
70.5
70.1
71.3
Imp
ort
s o
f g
oo
ds a
nd
serv
ices
Pe
rbela
nja
an
ata
s K
DN
K
pa
da
ha
rga p
em
beli
100
.01
00
.01
00
.01
00
.01
00
.01
00
.01
00
.01
00
.01
00
.01
00
.01
00
.01
00
.01
00
.01
00
.01
00
.01
00
.01
00
.0E
xp
en
dit
ure
on
GD
P a
t
pu
rch
ase
rs' p
ric
es
III
III
IVI
IIII
IIV
III
III
IVI
II
Perb
ela
nja
an
pen
gg
un
aan
akh
ir k
era
jaan
13.3
13.2
13.4
11.0
11.4
12.3
18.1
11.4
11.9
12.0
17.2
11.0
12.8
12.3
17.2
11.6
11.9
Go
vern
men
t fi
nal
co
nsu
mp
tio
n e
xp
en
dit
ure
Perb
ela
nja
an
pen
gg
un
aan
akh
ir s
wasta
49.6
50.9
52.0
49.5
48.7
50.7
49.6
50.8
50.4
52.6
49.6
51.8
51.5
54.1
50.6
52.3
51.6
Pri
vate
fin
al co
nsu
mp
tio
n
exp
en
dit
ure
Pem
ben
tukan
mo
dal te
tap
kasar
23.7
26.7
27.7
23.1
24.0
23.2
24.3
25.0
28.6
26.8
26.3
27.1
29.0
28.0
26.6
27.2
29.2
Gro
ss f
ixed
cap
ital
form
ati
on
Peru
bah
an
in
ven
tori
dan
ba
ran
ga
n b
erh
arg
a*
0.4
0.7
-0.2
2.0
2.0
0.6
-2.7
2.3
0.8
2.2
-2.1
1.2
1.8
-1.0
-2.5
-0.5
-1.5
Ch
an
ges in
in
ven
tori
es
an
d v
alu
ab
les*
Eksp
ort
bara
ng
an
dan
pe
rkh
idm
ata
n1
00
.39
3.2
89.5
100
.41
01
.49
9.9
99.6
96.9
96.5
90.0
89.9
89.8
88.3
89.6
90.4
91.3
90.3
Exp
ort
s o
f g
oo
ds a
nd
serv
ices
Imp
ort
bara
ng
an
dan
pe
rkh
idm
ata
n8
7.3
84.7
82.5
86.0
87.6
86.8
88.9
86.4
88.3
83.6
80.8
81.1
83.4
83.0
82.3
81.8
81.4
Imp
ort
s o
f g
oo
ds a
nd
serv
ices
Pe
rbela
nja
an
ata
s K
DN
K
pa
da
ha
rga p
em
beli
100
.01
00
.01
00
.01
00
.01
00
.01
00
.01
00
.01
00
.01
00
.01
00
.01
00
.01
00
.01
00
.01
00
.01
00
.01
00
.01
00
.0E
xp
en
dit
ure
on
GD
P a
t
pu
rch
ase
rs' p
ric
es
* T
erm
asuk p
erb
eza
an
sta
tistik
2012
2013
2013
Ty
pe
of
exp
en
dit
ure
17
2012
e2013
p
2011
2012
e2013
p
2014
2014
* In
clu
siv
e s
tatistica
l d
iscre
pa
ncy
Jad
ua
l 3
D:
KD
NK
me
ng
iku
t J
en
is P
erb
ela
nja
an
pa
da
Ha
rga S
em
asa
- P
em
bah
ag
ian
pe
ratu
s k
ep
ad
a K
DN
K
Ta
ble
3D
: G
DP
by
Ty
pe
of
Ex
pe
nd
itu
re a
t C
urr
en
t P
ric
es
- P
erc
en
tag
e s
ha
re t
o G
DP
Jen
is p
erb
ela
nja
an
2011
2012
Ty
pe
of
exp
en
dit
ure
Jad
ua
l 4
D:
KD
NK
me
ng
iku
t J
en
is P
erb
ela
nja
an
pa
da
Ha
rga M
ala
r 2
00
5 -
Pe
mb
ah
ag
ian
pe
ratu
s k
ep
ad
a K
DN
K
Ta
ble
4D
: G
DP
by
Ty
pe
of
Ex
pe
nd
itu
re a
t C
on
sta
nt
200
5 P
ric
es
- P
erc
en
tag
e s
ha
re t
o G
DP
Jen
is p
erb
ela
nja
an
2011
2011
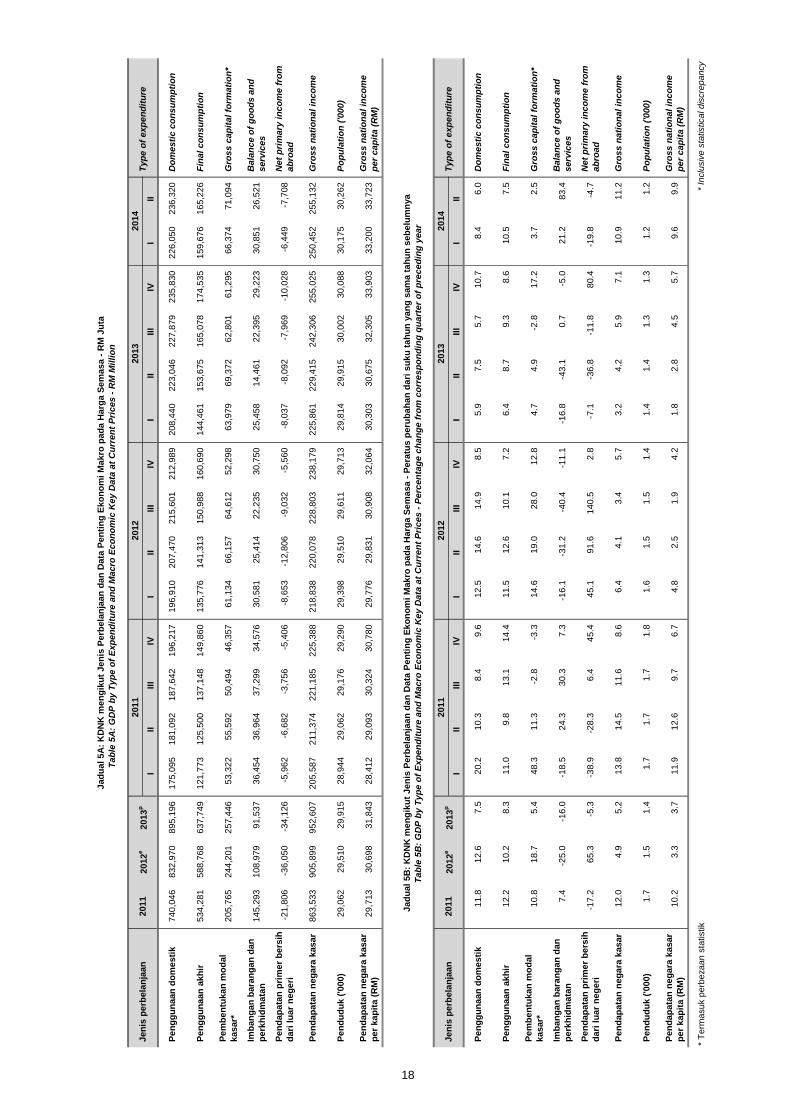
III
III
IVI
IIII
IIV
III
III
IVI
II
Pe
ng
gu
na
an
do
me
sti
k7
40
,046
832
,970
895
,196
175
,095
181
,092
187
,642
196
,217
196
,910
207
,470
215
,601
212
,989
208
,440
223
,046
227
,879
235
,830
226
,050
236
,320
Do
me
sti
c c
on
su
mp
tio
n
Pe
ng
gu
na
an
akh
ir5
34
,281
588
,768
637
,749
121
,773
125
,500
137
,148
149
,860
135
,776
141
,313
150
,988
160
,690
144
,461
153
,675
165
,078
174
,535
159
,676
165
,226
Fin
al
co
ns
um
pti
on
Pe
mb
en
tuk
an
mo
da
l
kas
ar*
205
,765
244
,201
257
,446
53,3
22
55,5
92
50,4
94
46,3
57
61,1
34
66,1
57
64,6
12
52,2
98
63,9
79
69,3
72
62,8
01
61,2
95
66,3
74
71,0
94
Gro
ss c
ap
ita
l fo
rma
tio
n*
Imb
an
ga
n b
ara
ng
an
da
n
pe
rkh
idm
ata
n1
45
,293
108
,979
91,5
37
36,4
54
36,9
64
37,2
99
34,5
76
30,5
81
25,4
14
22,2
35
30,7
50
25,4
58
14,4
61
22,3
95
29,2
23
30,8
51
26,5
21
Ba
lan
ce o
f g
oo
ds
an
d
serv
ices
Pe
nd
ap
ata
n p
rim
er
be
rsih
da
ri l
ua
r n
eg
eri
-21,8
06
-36,0
50
-34,1
26
-5,9
62
-6,6
82
-3,7
56
-5,4
06
-8,6
53
-12,8
06
-9,0
32
-5,5
60
-8,0
37
-8,0
92
-7,9
69
-10,0
28
-6,4
49
-7,7
08
Ne
t p
rim
ary
in
co
me
fro
m
ab
roa
d
Pe
nd
ap
ata
n n
eg
ara
kas
ar
863
,533
905
,899
952
,607
205
,587
211
,374
221
,185
225
,388
218
,838
220
,078
228
,803
238
,179
225
,861
229
,415
242
,306
255
,025
250
,452
255
,132
Gro
ss n
ati
on
al
inc
om
e
Pe
nd
ud
uk
('0
00
)2
9,0
62
29,5
10
29,9
15
28,9
44
29,0
62
29,1
76
29,2
90
29,3
98
29,5
10
29,6
11
29,7
13
29,8
14
29,9
15
30,0
02
30,0
88
30,1
75
30,2
62
Po
pu
lati
on
('0
00
)
Pe
nd
ap
ata
n n
eg
ara
kas
ar
pe
r k
ap
ita
(R
M)
29,7
13
30,6
98
31,8
43
28,4
12
29,0
93
30,3
24
30,7
80
29,7
76
29,8
31
30,9
08
32,0
64
30,3
03
30,6
75
32,3
05
33,9
03
33,2
00
33,7
23
Gro
ss n
ati
on
al
inc
om
e
pe
r c
ap
ita
(R
M)
III
III
IVI
IIII
IIV
III
III
IVI
II
Pe
ng
gu
na
an
do
me
sti
k1
1.8
12.6
7.5
20.2
10.3
8.4
9.6
12.5
14.6
14.9
8.5
5.9
7.5
5.7
10.7
8.4
6.0
Do
me
sti
c c
on
su
mp
tio
n
Pe
ng
gu
na
an
akh
ir1
2.2
10.2
8.3
11.0
9.8
13.1
14.4
11.5
12.6
10.1
7.2
6.4
8.7
9.3
8.6
10.5
7.5
Fin
al
co
ns
um
pti
on
Pe
mb
en
tuk
an
mo
da
l
kas
ar*
10.8
18.7
5.4
48.3
11.3
-2.8
-3.3
14.6
19.0
28.0
12.8
4.7
4.9
-2.8
17.2
3.7
2.5
Gro
ss c
ap
ita
l fo
rma
tio
n*
Imb
an
ga
n b
ara
ng
an
da
n
pe
rkh
idm
ata
n7
.4-2
5.0
-16.0
-18.5
24.3
30.3
7.3
-16.1
-31.2
-40.4
-11.1
-16.8
-43.1
0.7
-5.0
21.2
83.4
Ba
lan
ce o
f g
oo
ds
an
d
serv
ices
Pe
nd
ap
ata
n p
rim
er
be
rsih
da
ri l
ua
r n
eg
eri
-17.2
65.3
-5.3
-38.9
-28.3
6.4
45.4
45.1
91.6
140
.52
.8-7
.1-3
6.8
-11.8
80.4
-19.8
-4.7
Ne
t p
rim
ary
in
co
me
fro
m
ab
roa
d
Pe
nd
ap
ata
n n
eg
ara
kas
ar
12.0
4.9
5.2
13.8
14.5
11.6
8.6
6.4
4.1
3.4
5.7
3.2
4.2
5.9
7.1
10.9
11.2
Gro
ss n
ati
on
al
inc
om
e
Pe
nd
ud
uk
('0
00
)1
.71
.51
.41
.71
.71
.71
.81
.61
.51
.51
.41
.41
.41
.31
.31
.21
.2P
op
ula
tio
n (
'000
)
Pe
nd
ap
ata
n n
eg
ara
kas
ar
pe
r k
ap
ita
(R
M)
10.2
3.3
3.7
11.9
12.6
9.7
6.7
4.8
2.5
1.9
4.2
1.8
2.8
4.5
5.7
9.6
9.9
Gro
ss n
ati
on
al
inc
om
e
pe
r c
ap
ita
(R
M)
* T
erm
asuk p
erb
eza
an
sta
tistik
Jad
ua
l 5
B:
KD
NK
me
ng
iku
t J
en
is P
erb
ela
nja
an
da
n D
ata
Pe
nti
ng
Ek
on
om
i M
akro
pa
da
Ha
rga S
em
asa
- P
era
tus
pe
rub
ah
an
da
ri s
uk
u t
ah
un
ya
ng
sam
a t
ah
un
seb
elu
mn
ya
Ta
ble
5B
: G
DP
by
Ty
pe
of
Ex
pe
nd
itu
re a
nd
Ma
cro
Ec
on
om
ic K
ey D
ata
at
Cu
rre
nt
Pri
ces
- P
erc
en
tag
e c
ha
ng
e f
rom
co
rre
sp
on
din
g q
ua
rte
r o
f p
rece
din
g y
ea
r
2011
2012
Ty
pe
of
exp
en
dit
ure
J
en
is p
erb
ela
nja
an
2014
2011
2012
e2013
p
* In
clu
siv
e s
tatistica
l d
iscre
pa
ncy
Jad
ua
l 5
A:
KD
NK
me
ng
iku
t J
en
is P
erb
ela
nja
an
da
n D
ata
Pe
nti
ng
Ek
on
om
i M
akro
pad
a H
arg
a S
em
asa
- R
M J
uta
Ta
ble
5A
: G
DP
by
Ty
pe
of
Ex
pe
nd
itu
re a
nd
Ma
cro
Ec
on
om
ic K
ey D
ata
at
Cu
rre
nt
Pri
ces
- R
M M
illi
on
Jen
is p
erb
ela
nja
an
2011
2012
Ty
pe
of
exp
en
dit
ure
2013
2014
2013
18
2011
2012
e2013
p
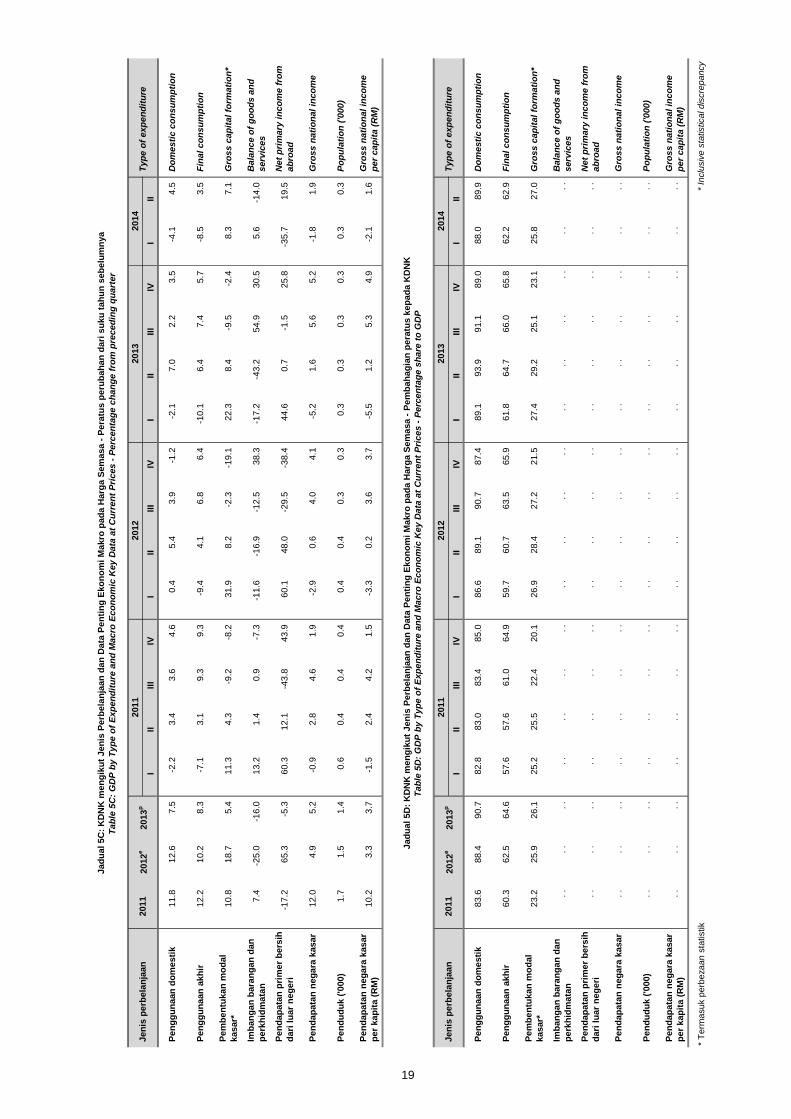
III
III
IVI
IIII
IIV
III
III
IVI
II
Pe
ng
gu
na
an
do
me
sti
k1
1.8
12.6
7.5
-2.2
3.4
3.6
4.6
0.4
5.4
3.9
-1.2
-2.1
7.0
2.2
3.5
-4.1
4.5
Do
me
sti
c c
on
su
mp
tio
n
Pe
ng
gu
na
an
akh
ir1
2.2
10.2
8.3
-7.1
3.1
9.3
9.3
-9.4
4.1
6.8
6.4
-10.1
6.4
7.4
5.7
-8.5
3.5
Fin
al
co
ns
um
pti
on
Pe
mb
en
tuk
an
mo
da
l
kas
ar*
10.8
18.7
5.4
11.3
4.3
-9.2
-8.2
31.9
8.2
-2.3
-19.1
22.3
8.4
-9.5
-2.4
8.3
7.1
Gro
ss c
ap
ita
l fo
rma
tio
n*
Imb
an
ga
n b
ara
ng
an
da
n
pe
rkh
idm
ata
n7
.4-2
5.0
-16.0
13.2
1.4
0.9
-7.3
-11.6
-16.9
-12.5
38.3
-17.2
-43.2
54.9
30.5
5.6
-14.0
Ba
lan
ce o
f g
oo
ds
an
d
serv
ices
Pe
nd
ap
ata
n p
rim
er
be
rsih
da
ri l
ua
r n
eg
eri
-17.2
65.3
-5.3
60.3
12.1
-43.8
43.9
60.1
48.0
-29.5
-38.4
44.6
0.7
-1.5
25.8
-35.7
19.5
Ne
t p
rim
ary
in
co
me
fro
m
ab
roa
d
Pe
nd
ap
ata
n n
eg
ara
kas
ar
12.0
4.9
5.2
-0.9
2.8
4.6
1.9
-2.9
0.6
4.0
4.1
-5.2
1.6
5.6
5.2
-1.8
1.9
Gro
ss n
ati
on
al
inc
om
e
Pe
nd
ud
uk
('0
00
)1
.71
.51
.40
.60
.40
.40
.40
.40
.40
.30
.30
.30
.30
.30
.30
.30
.3P
op
ula
tio
n (
'000
)
Pe
nd
ap
ata
n n
eg
ara
kas
ar
pe
r k
ap
ita
(R
M)
10.2
3.3
3.7
-1.5
2.4
4.2
1.5
-3.3
0.2
3.6
3.7
-5.5
1.2
5.3
4.9
-2.1
1.6
Gro
ss n
ati
on
al
inc
om
e
pe
r c
ap
ita
(R
M)
III
III
IVI
IIII
IIV
III
III
IVI
II
Pe
ng
gu
na
an
do
me
sti
k8
3.6
88.4
90.7
82.8
83.0
83.4
85.0
86.6
89.1
90.7
87.4
89.1
93.9
91.1
89.0
88.0
89.9
Do
me
sti
c c
on
su
mp
tio
n
Pe
ng
gu
na
an
akh
ir6
0.3
62.5
64.6
57.6
57.6
61.0
64.9
59.7
60.7
63.5
65.9
61.8
64.7
66.0
65.8
62.2
62.9
Fin
al
co
ns
um
pti
on
Pe
mb
en
tuk
an
mo
da
l
kas
ar*
23.2
25.9
26.1
25.2
25.5
22.4
20.1
26.9
28.4
27.2
21.5
27.4
29.2
25.1
23.1
25.8
27.0
Gro
ss c
ap
ita
l fo
rma
tio
n*
Imb
an
ga
n b
ara
ng
an
da
n
pe
rkh
idm
ata
n.
..
..
..
..
..
..
..
..
..
..
..
..
..
..
..
..
.B
ala
nc
e o
f g
oo
ds
an
d
serv
ices
Pe
nd
ap
ata
n p
rim
er
be
rsih
da
ri l
ua
r n
eg
eri
. .
. .
. .
. .
. .
. .
. .
. .
. .
. .
. .
. .
. .
. .
. .
. .
. .
Ne
t p
rim
ary
in
co
me
fro
m
ab
roa
d
Pe
nd
ap
ata
n n
eg
ara
kas
ar
. .
. .
. .
. .
. .
. .
. .
. .
. .
. .
. .
. .
. .
. .
. .
. .
. .
Gro
ss n
ati
on
al
inc
om
e
Pe
nd
ud
uk
('0
00
).
..
..
..
..
..
..
..
..
..
..
..
..
..
..
..
..
.P
op
ula
tio
n (
'000
)
Pe
nd
ap
ata
n n
eg
ara
kas
ar
pe
r k
ap
ita
(R
M)
. .
. .
. .
. .
. .
. .
. .
. .
. .
. .
. .
. .
. .
. .
. .
. .
. .
Gro
ss n
ati
on
al
inc
om
e
pe
r c
ap
ita
(R
M)
* T
erm
asuk p
erb
eza
an
sta
tistik
2014
2011
2012
Jen
is p
erb
ela
nja
an
* In
clu
siv
e s
tatistica
l d
iscre
pa
ncy
Ty
pe
of
exp
en
dit
ure
2013
2012
Ty
pe
of
exp
en
dit
ure
2013
2011
2012
e2013
p
2011
2012
e2013
p
2014
19
Ta
ble
5D
: G
DP
by
Ty
pe
of
Ex
pe
nd
itu
re a
nd
Ma
cro
Ec
on
om
ic K
ey D
ata
at
Cu
rre
nt
Pri
ces
- P
erc
en
tag
e s
ha
re t
o G
DP
Jen
is p
erb
ela
nja
an
Jad
ua
l 5
C:
KD
NK
me
ng
iku
t J
en
is P
erb
ela
nja
an
da
n D
ata
Pe
nti
ng
Ek
on
om
i M
akro
pa
da
Ha
rga S
em
asa
- P
era
tus
pe
rub
ah
an
da
ri s
uk
u t
ah
un
seb
elu
mn
ya
Ta
ble
5C
: G
DP
by
Ty
pe
of
Ex
pe
nd
itu
re a
nd
Ma
cro
Ec
on
om
ic K
ey D
ata
at
Cu
rre
nt
Pri
ces
- P
erc
en
tag
e c
ha
ng
e f
rom
pre
ce
din
g q
ua
rte
r
Jad
ua
l 5
D:
KD
NK
me
ng
iku
t J
en
is P
erb
ela
nja
an
da
n D
ata
Pe
nti
ng
Ek
on
om
i M
akro
pa
da
Ha
rga S
em
asa
- P
em
bah
ag
ian
pe
ratu
s k
ep
ad
a K
DN
K
2011
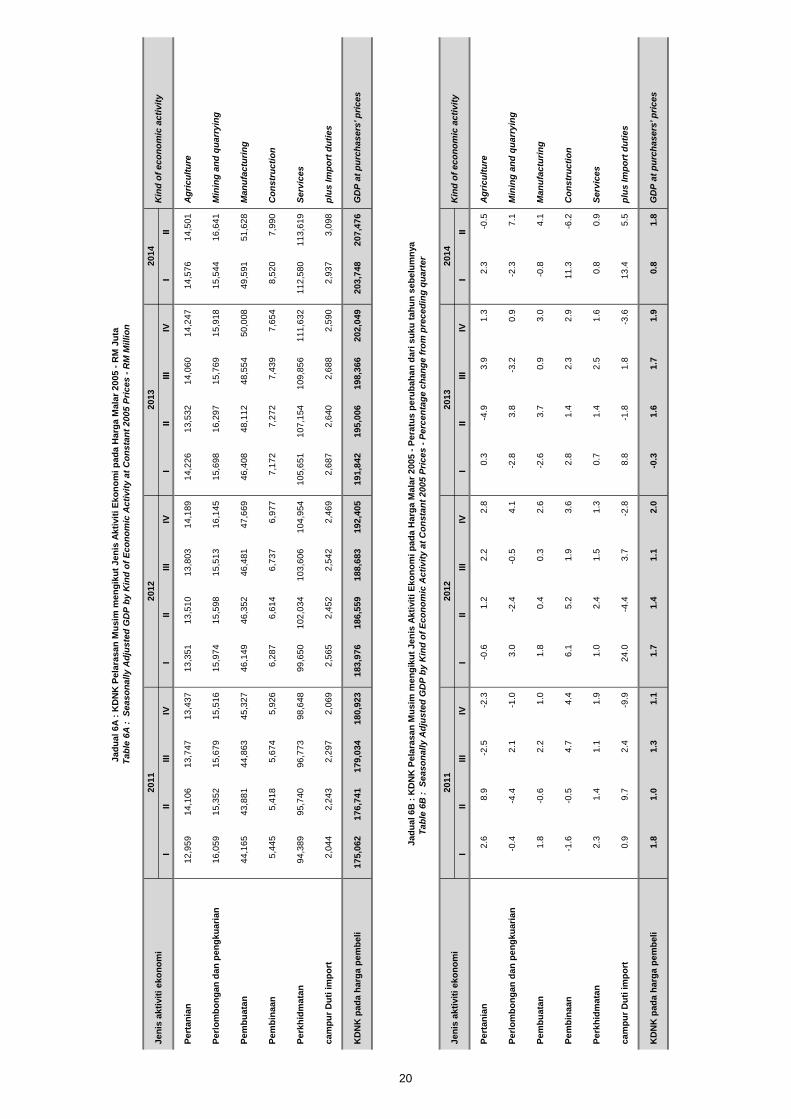
III
III
IVI
IIII
IIV
III
III
IVI
II
Pe
rta
nia
n1
2,9
59
14
,10
61
3,7
47
13
,43
71
3,3
51
13
,51
01
3,8
03
14
,18
91
4,2
26
13
,53
21
4,0
60
14
,24
71
4,5
76
14
,50
1A
gri
cu
ltu
re
Pe
rlo
mb
on
ga
n d
an
pe
ng
ku
ari
an
16
,05
91
5,3
52
15
,67
91
5,5
16
15
,97
41
5,5
98
15
,51
31
6,1
45
15
,69
81
6,2
97
15
,76
91
5,9
18
15
,54
41
6,6
41
Min
ing
an
d q
ua
rry
ing
Pe
mb
ua
tan
44
,16
54
3,8
81
44
,86
34
5,3
27
46
,14
94
6,3
52
46
,48
14
7,6
69
46
,40
84
8,1
12
48
,55
45
0,0
08
49
,59
15
1,6
28
Ma
nu
fac
turi
ng
Pe
mb
ina
an
5,4
45
5,4
18
5,6
74
5,9
26
6,2
87
6,6
14
6,7
37
6,9
77
7,1
72
7,2
72
7,4
39
7,6
54
8,5
20
7,9
90
Co
ns
tru
cti
on
Pe
rkh
idm
ata
n9
4,3
89
95
,74
09
6,7
73
98
,64
89
9,6
50
10
2,0
34
10
3,6
06
10
4,9
54
10
5,6
51
10
7,1
54
10
9,8
56
11
1,6
32
11
2,5
80
11
3,6
19
Se
rvic
es
ca
mp
ur
Du
ti i
mp
ort
2,0
44
2,2
43
2,2
97
2,0
69
2,5
65
2,4
52
2,5
42
2,4
69
2,6
87
2,6
40
2,6
88
2,5
90
2,9
37
3,0
98
plu
s I
mp
ort
du
tie
s
KD
NK
pa
da
ha
rga
pe
mb
eli
17
5,0
62
17
6,7
41
17
9,0
34
18
0,9
23
18
3,9
76
18
6,5
59
18
8,6
83
19
2,4
05
19
1,8
42
19
5,0
06
19
8,3
66
20
2,0
49
20
3,7
48
20
7,4
76
GD
P a
t p
urc
ha
se
rs' p
ric
es
III
III
IVI
IIII
IIV
III
III
IVI
II
Pe
rta
nia
n2
.68
.9-2
.5-2
.3-0
.61
.22
.22
.80
.3-4
.93
.91
.32
.3-0
.5A
gri
cu
ltu
re
Pe
rlo
mb
on
ga
n d
an
pe
ng
ku
ari
an
-0.4
-4.4
2.1
-1.0
3.0
-2.4
-0.5
4.1
-2.8
3.8
-3.2
0.9
-2.3
7.1
Min
ing
an
d q
ua
rry
ing
Pe
mb
ua
tan
1.8
-0.6
2.2
1.0
1.8
0.4
0.3
2.6
-2.6
3.7
0.9
3.0
-0.8
4.1
Ma
nu
fac
turi
ng
Pe
mb
ina
an
-1.6
-0.5
4.7
4.4
6.1
5.2
1.9
3.6
2.8
1.4
2.3
2.9
11
.3-6
.2C
on
str
uc
tio
n
Pe
rkh
idm
ata
n2
.31
.41
.11
.91
.02
.41
.51
.30
.71
.42
.51
.60
.80
.9S
erv
ice
s
ca
mp
ur
Du
ti i
mp
ort
0.9
9.7
2.4
-9.9
24
.0-4
.43
.7-2
.88
.8-1
.81
.8-3
.61
3.4
5.5
plu
s I
mp
ort
du
tie
s
KD
NK
pa
da
ha
rga
pe
mb
eli
1.8
1.0
1.3
1.1
1.7
1.4
1.1
2.0
-0.3
1.6
1.7
1.9
0.8
1.8
GD
P a
t p
urc
ha
se
rs' p
ric
es
Ja
du
al
6A
: K
DN
K P
ela
ras
an
Mu
sim
me
ng
iku
t J
en
is A
kti
vit
i E
ko
no
mi
pa
da
Ha
rga
Ma
lar
20
05
- R
M J
uta
Ta
ble
6A
:
Se
as
on
all
y A
dju
ste
d G
DP
by
Kin
d o
f E
co
no
mic
Ac
tiv
ity
at
Co
ns
tan
t 2
00
5 P
ric
es
- R
M M
illi
on
20
13
Kin
d o
f e
co
no
mic
ac
tiv
ity
20
Je
nis
ak
tivit
i e
ko
no
mi
20
11
20
12
Ja
du
al
6B
: K
DN
K P
ela
ras
an
Mu
sim
me
ng
iku
t J
en
is A
kti
vit
i E
ko
no
mi
pa
da
Ha
rga
Ma
lar
20
05
- P
era
tus
pe
rub
ah
an
da
ri s
uk
u t
ah
un
se
be
lum
nya
Ta
ble
6B
:
Se
as
on
all
y A
dju
ste
d G
DP
by
Kin
d o
f E
co
no
mic
Ac
tiv
ity
at
Co
ns
tan
t 2
00
5 P
ric
es
- P
erc
en
tag
e c
ha
ng
e f
rom
pre
ce
din
g q
ua
rte
r
Je
nis
ak
tivit
i e
ko
no
mi
20
11
20
12
20
13
Kin
d o
f e
co
no
mic
ac
tiv
ity
20
14
20
14
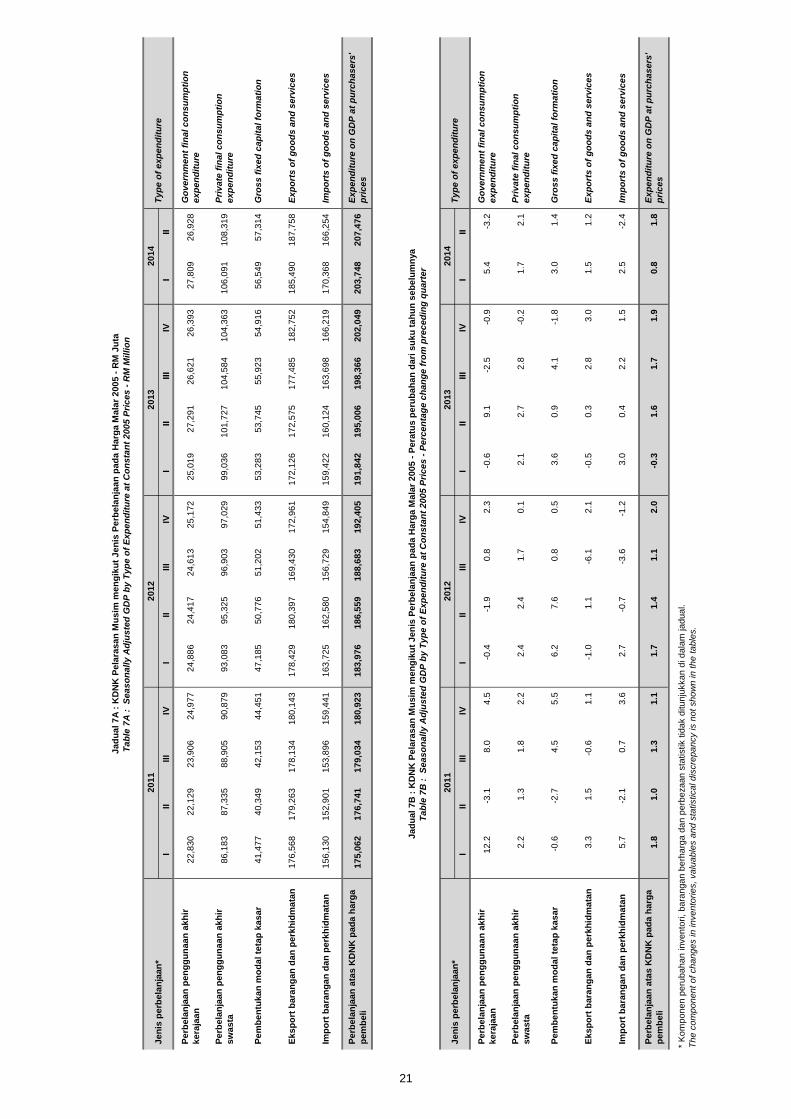
III
III
IVI
IIII
IIV
III
III
IVI
II
Pe
rbe
lan
jaa
n p
en
gg
un
aa
n a
kh
ir
ke
raja
an
22
,83
02
2,1
29
23
,90
62
4,9
77
24
,88
62
4,4
17
24
,61
32
5,1
72
25
,01
92
7,2
91
26
,62
12
6,3
93
27
,80
92
6,9
28
Go
ve
rnm
en
t fi
na
l c
on
su
mp
tio
n
ex
pe
nd
itu
re
Pe
rbe
lan
jaa
n p
en
gg
un
aa
n a
kh
ir
sw
as
ta8
6,1
83
87
,33
58
8,9
05
90
,87
99
3,0
83
95
,32
59
6,9
03
97
,02
99
9,0
36
10
1,7
27
10
4,5
84
10
4,3
63
10
6,0
91
10
8,3
19
Pri
va
te f
ina
l c
on
su
mp
tio
n
ex
pe
nd
itu
re
Pe
mb
en
tuk
an
mo
da
l te
tap
ka
sa
r4
1,4
77
40
,34
94
2,1
53
44
,45
14
7,1
85
50
,77
65
1,2
02
51
,43
35
3,2
83
53
,74
55
5,9
23
54
,91
65
6,5
49
57
,31
4G
ros
s f
ixe
d c
ap
ita
l fo
rma
tio
n
Ek
sp
ort
ba
ran
ga
n d
an
pe
rkh
idm
ata
n1
76
,56
81
79
,26
31
78
,13
41
80
,14
31
78
,42
91
80
,39
71
69
,43
01
72
,96
11
72
,12
61
72
,57
51
77
,48
51
82
,75
21
85
,49
01
87
,75
8E
xp
ort
s o
f g
oo
ds
an
d s
erv
ice
s
Imp
ort
ba
ran
ga
n d
an
pe
rkh
idm
ata
n1
56
,13
01
52
,90
11
53
,89
61
59
,44
11
63
,72
51
62
,58
01
56
,72
91
54
,84
91
59
,42
21
60
,12
41
63
,69
81
66
,21
91
70
,36
81
66
,25
4Im
po
rts
of
go
od
s a
nd
se
rvic
es
Pe
rbe
lan
jaa
n a
tas
KD
NK
pa
da
ha
rga
pe
mb
eli
17
5,0
62
17
6,7
41
17
9,0
34
18
0,9
23
18
3,9
76
18
6,5
59
18
8,6
83
19
2,4
05
19
1,8
42
19
5,0
06
19
8,3
66
20
2,0
49
20
3,7
48
20
7,4
76
Ex
pe
nd
itu
re o
n G
DP
at
pu
rch
as
ers
'
pri
ce
s
III
III
IVI
IIII
IIV
III
III
IVI
II
Pe
rbe
lan
jaa
n p
en
gg
un
aa
n a
kh
ir
ke
raja
an
12
.2-3
.18
.04
.5-0
.4-1
.90
.82
.3-0
.69
.1-2
.5-0
.95
.4-3
.2G
ov
ern
me
nt
fin
al
co
ns
um
pti
on
ex
pe
nd
itu
re
Pe
rbe
lan
jaa
n p
en
gg
un
aa
n a
kh
ir
sw
as
ta2
.21
.31
.82
.22
.42
.41
.70
.12
.12
.72
.8-0
.21
.72
.1P
riv
ate
fin
al
co
ns
um
pti
on
ex
pe
nd
itu
re
Pe
mb
en
tuk
an
mo
da
l te
tap
ka
sa
r-0
.6-2
.74
.55
.56
.27
.60
.80
.53
.60
.94
.1-1
.83
.01
.4G
ros
s f
ixe
d c
ap
ita
l fo
rma
tio
n
Ek
sp
ort
ba
ran
ga
n d
an
pe
rkh
idm
ata
n3
.31
.5-0
.61
.1-1
.01
.1-6
.12
.1-0
.50
.32
.83
.01
.51
.2E
xp
ort
s o
f g
oo
ds
an
d s
erv
ice
s
Imp
ort
ba
ran
ga
n d
an
pe
rkh
idm
ata
n5
.7-2
.10
.73
.62
.7-0
.7-3
.6-1
.23
.00
.42
.21
.52
.5-2
.4Im
po
rts
of
go
od
s a
nd
se
rvic
es
Pe
rbe
lan
jaa
n a
tas
KD
NK
pa
da
ha
rga
pe
mb
eli
1.8
1.0
1.3
1.1
1.7
1.4
1.1
2.0
-0.3
1.6
1.7
1.9
0.8
1.8
Ex
pe
nd
itu
re o
n G
DP
at
pu
rch
as
ers
'
pri
ce
s
* K
om
po
ne
n p
eru
ba
ha
n in
ve
nto
ri,
ba
ran
ga
n b
erh
arg
a d
an
pe
rbe
za
an
sta
tistik t
ida
k d
itu
nju
kka
n d
i d
ala
m ja
du
al.
Th
e c
om
po
ne
nt
of
ch
an
ge
s in
in
ve
nto
rie
s,
va
lua
ble
s a
nd
sta
tistica
l d
iscre
pa
ncy is n
ot
sh
ow
n in
th
e t
ab
les.
Ta
ble
7B
:
Se
as
on
all
y A
dju
ste
d G
DP
by
Ty
pe
of
Ex
pe
nd
itu
re a
t C
on
sta
nt
20
05
Pri
ce
s -
Pe
rce
nta
ge
ch
an
ge
fro
m p
rec
ed
ing
qu
art
er
Je
nis
pe
rbe
lan
jaa
n*
20
11
20
12
20
13
Ty
pe
of
ex
pe
nd
itu
re
20
14
Ja
du
al
7A
: K
DN
K P
ela
ras
an
Mu
sim
me
ng
iku
t J
en
is P
erb
ela
nja
an
pa
da
Ha
rga
Ma
lar
20
05
- R
M J
uta
Ta
ble
7A
:
Se
as
on
all
y A
dju
ste
d G
DP
by
Ty
pe
of
Ex
pe
nd
itu
re a
t C
on
sta
nt
20
05
Pri
ce
s -
RM
Mil
lio
n
21
Je
nis
pe
rbe
lan
jaa
n*
20
11
20
12
20
13
Ty
pe
of
ex
pe
nd
itu
re
Ja
du
al
7B
: K
DN
K P
ela
ras
an
Mu
sim
me
ng
iku
t J
en
is P
erb
ela
nja
an
pa
da
Ha
rga
Ma
lar
20
05
- P
era
tus
pe
rub
ah
an
da
ri s
uk
u t
ah
un
se
be
lum
nya
20
14

22
This page is deliberately left blank.
Muka surat ini sengaja dibiarkan kosong.
SEKSYEN 2:
JADUAL PENGELUARAN
KDNK MENGIKUT JENIS AKTIVITI EKONOMI PADA HARGA SEMASA KDNK MENGIKUT JENIS AKTIVITI EKONOMI PADA HARGA MALAR 2005
SECTION 2: PRODUCTION TABLES
GDP BY KIND OF ECONOMIC ACTIVITY AT CURRENT PRICES GDP BY KIND OF ECONOMIC ACTIVITY AT CONSTANT 2005 PRICES

Jadual Pengeluaran
Production Tables
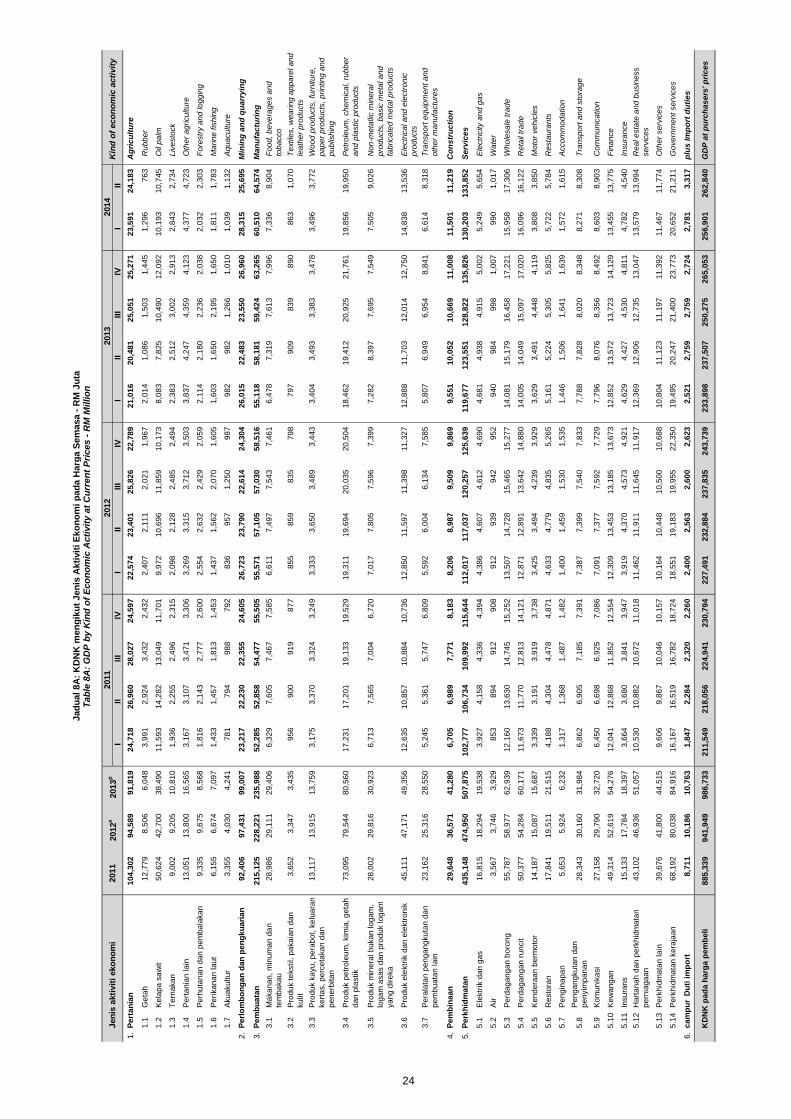
III
III
IVI
IIII
IIV
III
III
IVI
II
1.
10
4,3
02
94
,58
99
1,8
19
24
,71
82
6,9
60
28
,02
72
4,5
97
22
,57
42
3,4
01
25
,82
62
2,7
89
21
,01
62
0,4
81
25
,05
12
5,2
71
23
,59
12
4,1
83
Ag
ric
ult
ure
1.1
Ge
tah
12
,77
98
,50
66
,04
83
,99
12
,92
43
,43
22
,43
22
,40
72
,11
12
,02
11
,96
72
,01
41
,08
61
,50
31
,44
51
,29
67
63
Ru
bb
er
1.2
Ke
lap
a s
aw
it5
0,6
24
42
,70
03
8,4
90
11
,59
31
4,2
82
13
,04
91
1,7
01
9,9
72
10
,69
61
1,8
59
10
,17
38
,08
37
,82
51
0,4
90
12
,09
21
0,1
93
10
,74
5O
il p
alm
1.3
Te
rna
ka
n9
,00
29
,20
51
0,8
10
1,9
36
2,2
55
2,4
96
2,3
15
2,0
98
2,1
28
2,4
85
2,4
94
2,3
83
2,5
12
3,0
02
2,9
13
2,8
43
2,7
34
Liv
esto
ck
1.4
Pe
rta
nia
n la
in1
3,0
51
13
,80
01
6,5
65
3,1
67
3,1
07
3,4
71
3,3
06
3,2
69
3,3
15
3,7
12
3,5
03
3,8
37
4,2
47
4,3
59
4,1
23
4,3
77
4,7
23
Oth
er
ag
ricu
ltu
re
1.5
Pe
rhu
tan
an
da
n p
em
ba
laka
n9
,33
59
,67
58
,56
81
,81
62
,14
32
,77
72
,60
02
,55
42
,63
22
,42
92
,05
92
,11
42
,18
02
,23
62
,03
82
,03
22
,30
3F
ore
str
y a
nd
lo
gg
ing
1.6
Pe
rika
na
n la
ut
6,1
55
6,6
74
7,0
97
1,4
33
1,4
57
1,8
13
1,4
53
1,4
37
1,5
62
2,0
70
1,6
05
1,6
03
1,6
50
2,1
95
1,6
50
1,8
11
1,7
83
Ma
rin
e f
ish
ing
1.7
Aku
aku
ltu
r 3
,35
54
,03
04
,24
17
81
79
49
88
79
28
36
95
71
,25
09
87
98
29
82
1,2
66
1,0
10
1,0
39
1,1
32
Aqu
acu
ltu
re
2.
92
,40
69
7,4
31
99
,00
72
3,2
17
22
,23
02
2,3
55
24
,60
52
6,7
23
23
,79
02
2,6
14
24
,30
42
6,0
15
22
,48
32
3,5
50
26
,96
02
8,3
15
25
,69
5M
inin
g a
nd
qu
arr
yin
g
3.
21
5,1
25
22
8,2
21
23
5,9
88
52
,28
55
2,8
58
54
,47
75
5,5
05
55
,57
15
7,1
05
57
,03
05
8,5
16
55
,11
85
8,1
81
59
,42
46
3,2
65
60
,51
06
4,5
74
Ma
nu
fac
turi
ng
3.1
Ma
ka
na
n,
min
um
an
da
n
tem
ba
ka
u
28
,98
62
9,1
11
29
,40
66
,32
97
,60
57
,46
77
,58
56
,61
17
,49
77
,54
37
,46
16
,47
87
,31
97
,61
37
,99
67
,33
68
,90
4F
oo
d,
be
ve
rag
es a
nd
tob
acco
3.2
Pro
du
k t
ekstil, p
aka
ian
da
n
ku
lit
3,6
52
3,3
47
3,4
35
95
69
00
91
98
77
85
58
59
83
57
98
79
79
09
83
98
90
86
31
,07
0T
extile
s,
we
arin
g a
pp
are
l a
nd
lea
the
r p
rod
ucts
3.3
Pro
du
k k
ayu
, p
era
bo
t, k
elu
ara
n
ke
rta
s,
pe
rce
taka
n d
an
pe
ne
rbita
n
13
,11
71
3,9
15
13
,75
93
,17
53
,37
03
,32
43
,24
93
,33
33
,65
03
,48
93
,44
33
,40
43
,49
33
,38
33
,47
83
,49
63
,77
2W
oo
d p
rod
ucts
, fu
rnitu
re,
pa
pe
r p
rod
ucts
, p
rin
tin
g a
nd
pu
blis
hin
g
3.4
Pro
du
k p
etr
ole
um
, kim
ia,
ge
tah
da
n p
lastik
73
,09
57
9,5
44
80
,56
01
7,2
31
17
,20
11
9,1
33
19
,52
91
9,3
11
19
,69
42
0,0
35
20
,50
41
8,4
62
19
,41
22
0,9
25
21
,76
11
9,8
56
19
,95
0P
etr
ole
um
, ch
em
ica
l, r
ub
be
r
an
d p
lastic p
rod
ucts
3.5
Pro
du
k m
ine
ral b
uka
n lo
ga
m,
log
am
asa
s d
an
pro
du
k lo
ga
m
ya
ng
dir
eka
28
,00
22
9,8
16
30
,92
36
,71
37
,56
57
,00
46
,72
07
,01
77
,80
57
,59
67
,39
97
,28
28
,39
77
,69
57
,54
97
,50
59
,02
6N
on
-me
talli
c m
ine
ral
pro
du
cts
, b
asic
me
tal a
nd
fab
rica
ted
me
tal p
rod
ucts
3.6
Pro
du
k e
lektr
ik d
an
ele
ktr
on
ik
4
5,1
11
47
,17
14
9,3
56
12
,63
51
0,8
57
10
,88
41
0,7
36
12
,85
01
1,5
97
11
,39
81
1,3
27
12
,88
81
1,7
03
12
,01
41
2,7
50
14
,83
81
3,5
36
Ele
ctr
ica
l a
nd
ele
ctr
on
ic
pro
du
cts
3.7
Pe
rala
tan
pe
ng
an
gku
tan
da
n
pe
mb
ua
tan
la
in
23
,16
22
5,3
16
28
,55
05
,24
55
,36
15
,74
76
,80
95
,59
26
,00
46
,13
47
,58
55
,80
76
,94
96
,95
48
,84
16
,61
48
,31
8T
ran
sp
ort
equ
ipm
en
t a
nd
oth
er
ma
nu
factu
res
4.
29
,64
83
6,5
71
41
,28
06
,70
56
,98
97
,77
18
,18
38
,20
68
,98
79
,50
99
,86
99
,55
11
0,0
52
10
,66
91
1,0
08
11
,50
11
1,2
19
Co
ns
tru
cti
on
5.
43
5,1
48
47
4,9
50
50
7,8
75
10
2,7
77
10
6,7
34
10
9,9
92
11
5,6
44
11
2,0
17
11
7,0
37
12
0,2
57
12
5,6
39
11
9,6
77
12
3,5
51
12
8,8
22
13
5,8
26
13
0,2
03
13
3,8
52
Se
rvic
es
5.1
Ele
ktr
ik d
an
ga
s
16
,81
51
8,2
94
19
,53
83
,92
74
,15
84
,33
64
,39
44
,38
64
,60
74
,61
24
,69
04
,68
14
,93
84
,91
55
,00
25
,24
95
,65
4E
lectr
icity a
nd
ga
s
5.2
Air
3,5
67
3,7
46
3,9
29
85
38
94
91
29
08
91
29
39
94
29
52
94
09
84
99
81
,00
79
90
1,0
17
Wa
ter
5.3
Pe
rda
ga
ng
an
bo
ron
g
55
,78
75
8,9
77
62
,93
91
2,1
60
13
,63
01
4,7
45
15
,25
21
3,5
07
14
,72
81
5,4
65
15
,27
71
4,0
81
15
,17
91
6,4
58
17
,22
11
5,9
58
17
,30
6W
ho
lesa
le t
rad
e
5.4
Pe
rda
ga
ng
an
ru
ncit
5
0,3
77
54
,28
46
0,1
71
11
,67
31
1,7
70
12
,81
31
4,1
21
12
,87
11
2,8
91
13
,64
21
4,8
80
14
,00
51
4,0
49
15
,09
71
7,0
20
16
,09
61
6,1
22
Re
tail
tra
de
5.5
Ke
nd
era
an
be
rmo
tor
14
,18
71
5,0
87
15
,68
73
,33
93
,19
13
,91
93
,73
83
,42
53
,49
44
,23
93
,92
93
,62
93
,49
14
,44
84
,11
93
,80
83
,85
0M
oto
r ve
hic
les
5.6
Re
sto
ran
1
7,8
41
19
,51
12
1,5
15
4,1
88
4,3
04
4,4
78
4,8
71
4,6
33
4,7
79
4,8
35
5,2
65
5,1
61
5,2
24
5,3
05
5,8
25
5,7
22
5,7
84
Re
sta
ura
nts
5.7
Pe
ng
ina
pa
n5
,65
35
,92
46
,23
21
,31
71
,36
81
,48
71
,48
21
,40
01
,45
91
,53
01
,53
51
,44
61
,50
61
,64
11
,63
91
,57
21
,61
5A
cco
mm
od
atio
n
5.8
Pe
ng
an
gku
tan
da
n
pe
nyim
pa
na
n
2
8,3
43
30
,16
03
1,9
84
6,8
62
6,9
05
7,1
85
7,3
91
7,3
87
7,3
99
7,5
40
7,8
33
7,7
88
7,8
28
8,0
20
8,3
48
8,2
71
8,3
08
Tra
nsp
ort
an
d s
tora
ge
5.9
Ko
mu
nik
asi
27
,15
82
9,7
90
32
,72
06
,45
06
,69
86
,92
57
,08
67
,09
17
,37
77
,59
27
,72
97
,79
68
,07
68
,35
68
,49
28
,60
38
,90
3C
om
mu
nic
atio
n
5.1
0K
ew
an
ga
n
49
,31
45
2,6
19
54
,27
61
2,0
41
12
,86
81
1,8
52
12
,55
41
2,3
09
13
,45
31
3,1
85
13
,67
31
2,8
52
13
,57
21
3,7
23
14
,12
91
3,4
55
13
,77
5F
ina
nce
5.1
1In
su
ran
s
15
,13
31
7,7
84
18
,39
73
,66
43
,68
03
,84
13
,94
73
,91
94
,37
04
,57
34
,92
14
,62
94
,42
74
,53
04
,81
14
,78
24
,54
0In
su
ran
ce
5.1
2H
art
an
ah
da
n p
erk
hid
ma
tan
pe
rnia
ga
an
43
,10
24
6,9
36
51
,05
71
0,5
30
10
,88
21
0,6
72
11
,01
81
1,4
62
11
,91
11
1,6
45
11
,91
71
2,3
69
12
,90
61
2,7
35
13
,04
71
3,5
79
13
,99
4R
ea
l e
sta
te a
nd
bu
sin
ess
se
rvic
es
5.1
3P
erk
hid
ma
tan
la
in3
9,6
76
41
,80
04
4,5
15
9,6
06
9,8
67
10
,04
61
0,1
57
10
,16
41
0,4
48
10
,50
01
0,6
88
10
,80
41
1,1
23
11
,19
71
1,3
92
11
,46
71
1,7
74
Oth
er
se
rvic
es
5.1
4P
erk
hid
ma
tan
ke
raja
an
68
,19
28
0,0
38
84
,91
61
6,1
67
16
,51
91
6,7
82
18
,72
41
8,5
51
19
,18
31
9,9
55
22
,35
01
9,4
95
20
,24
72
1,4
00
23
,77
32
0,6
52
21
,21
1G
ove
rnm
en
t se
rvic
es
6.
8,7
11
10
,18
61
0,7
63
1,8
47
2,2
84
2,3
20
2,2
60
2,4
00
2,5
63
2,6
00
2,6
23
2,5
21
2,7
59
2,7
59
2,7
24
2,7
81
3,3
17
plu
s Im
po
rt d
uti
es
88
5,3
39
94
1,9
49
98
6,7
33
21
1,5
49
21
8,0
56
22
4,9
41
23
0,7
94
22
7,4
91
23
2,8
84
23
7,8
35
24
3,7
39
23
3,8
98
23
7,5
07
25
0,2
75
26
5,0
53
25
6,9
01
26
2,8
40
GD
P a
t p
urc
ha
se
rs' p
ric
es
24
Pe
rkh
idm
ata
n
ca
mp
ur
Du
ti i
mp
ort
KD
NK
pa
da
ha
rga
pe
mb
eli
Pe
rta
nia
n
Pe
rlo
mb
on
ga
n d
an
pe
ng
ku
ari
an
Pe
mb
ua
tan
Pe
mb
ina
an
Jad
ual 8A
: K
DN
K m
en
gik
ut
Jen
is A
kti
vit
i E
ko
no
mi p
ad
a H
arg
a S
em
asa -
RM
Ju
taT
ab
le 8
A:
GD
P b
y K
ind
of
Eco
no
mic
Acti
vit
y a
t C
urr
en
t P
rices -
RM
Millio
n
Kin
d o
f eco
no
mic
acti
vit
y2012
Jen
is a
kti
vit
i eko
no
mi
2011
2013
2011
2013
p2012
e2014
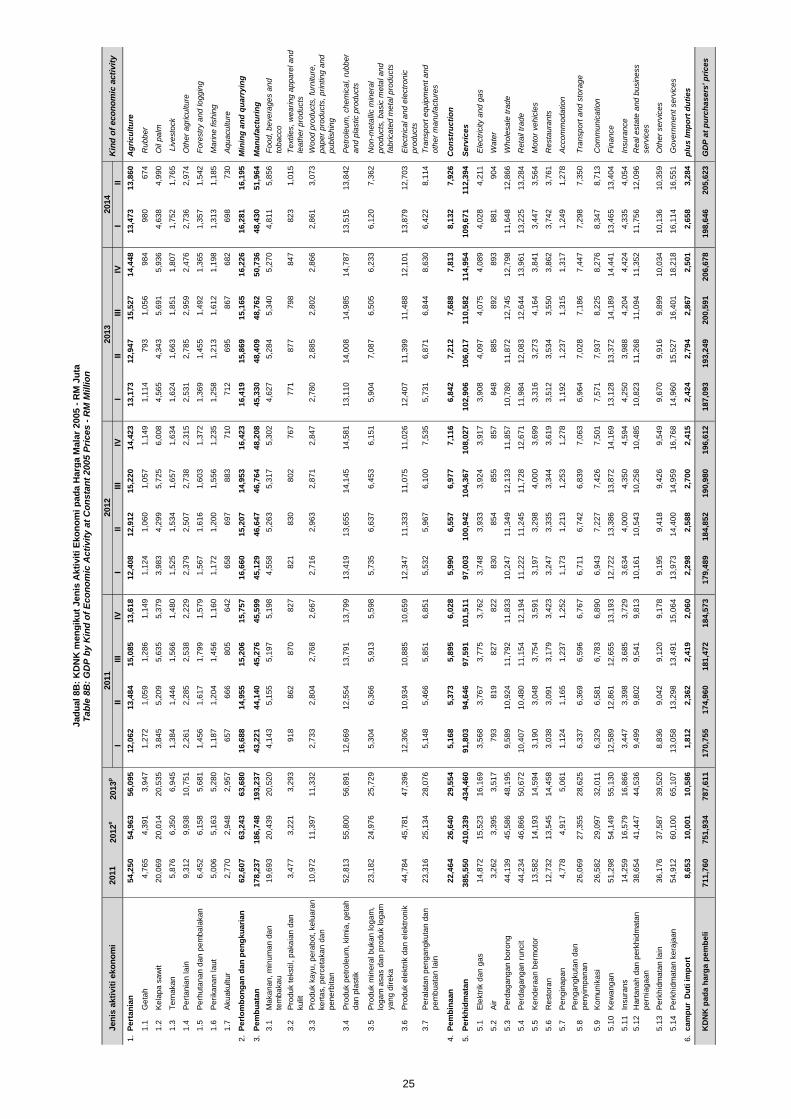
III
III
IVI
IIII
IIV
III
III
IVI
II
1.
54
,25
05
4,9
63
56
,09
51
2,0
62
13
,48
41
5,0
85
13
,61
81
2,4
08
12
,91
21
5,2
20
14
,42
31
3,1
73
12
,94
71
5,5
27
14
,44
81
3,4
73
13
,86
0A
gri
cu
ltu
re
1.1
Ge
tah
4,7
65
4,3
91
3,9
47
1,2
72
1,0
59
1,2
86
1,1
49
1,1
24
1,0
60
1,0
57
1,1
49
1,1
14
79
31
,05
69
84
98
06
74
Ru
bb
er
1.2
Ke
lap
a s
aw
it2
0,0
69
20
,01
42
0,5
35
3,8
45
5,2
09
5,6
35
5,3
79
3,9
83
4,2
99
5,7
25
6,0
08
4,5
65
4,3
43
5,6
91
5,9
36
4,6
38
4,9
90
Oil
pa
lm
1.3
Te
rna
ka
n5
,87
66
,35
06
,94
51
,38
41
,44
61
,56
61
,48
01
,52
51
,53
41
,65
71
,63
41
,62
41
,66
31
,85
11
,80
71
,75
21
,76
5 L
ive
sto
ck
1.4
Pe
rta
nia
n la
in9
,31
29
,93
81
0,7
51
2,2
61
2,2
85
2,5
38
2,2
29
2,3
79
2,5
07
2,7
38
2,3
15
2,5
31
2,7
85
2,9
59
2,4
76
2,7
36
2,9
74
Oth
er
ag
ricu
ltu
re
1.5
Pe
rhu
tan
an
da
n p
em
ba
laka
n6
,45
26
,15
85
,68
11
,45
61
,61
71
,79
91
,57
91
,56
71
,61
61
,60
31
,37
21
,36
91
,45
51
,49
21
,36
51
,35
71
,54
2F
ore
str
y a
nd
lo
gg
ing
1.6
Pe
rika
na
n la
ut
5,0
06
5,1
63
5,2
80
1,1
87
1,2
04
1,4
56
1,1
60
1,1
72
1,2
00
1,5
56
1,2
35
1,2
58
1,2
13
1,6
12
1,1
98
1,3
13
1,1
85
Ma
rin
e f
ish
ing
1.7
Aku
aku
ltu
r 2
,77
02
,94
82
,95
76
57
66
68
05
64
26
58
69
78
83
71
07
12
69
58
67
68
26
98
73
0A
qu
acu
ltu
re
2.
62
,60
76
3,2
43
63
,68
01
6,6
88
14
,95
51
5,2
06
15
,75
71
6,6
60
15
,20
71
4,9
53
16
,42
31
6,4
19
15
,86
91
5,1
65
16
,22
61
6,2
81
16
,19
5M
inin
g a
nd
qu
arr
yin
g
3.
17
8,2
37
18
6,7
48
19
3,2
37
43
,22
14
4,1
40
45
,27
64
5,5
99
45
,12
94
6,6
47
46
,76
44
8,2
08
45
,33
04
8,4
09
48
,76
25
0,7
36
48
,43
05
1,9
64
Ma
nu
fac
turi
ng
3.1
Ma
ka
na
n,
min
um
an
da
n
tem
ba
ka
u
19
,69
32
0,4
39
20
,52
04
,14
35
,15
55
,19
75
,19
84
,55
85
,26
35
,31
75
,30
24
,62
75
,28
45
,34
05
,27
04
,81
15
,85
6F
oo
d,
be
ve
rag
es a
nd
tob
acco
3.2
Pro
du
k t
ekstil, p
aka
ian
da
n
ku
lit
3,4
77
3,2
21
3,2
93
91
88
62
87
08
27
82
18
30
80
27
67
77
18
77
79
88
47
82
31
,01
5T
extile
s,
we
arin
g a
pp
are
l a
nd
lea
the
r p
rod
ucts
3.3
Pro
du
k k
ayu
, p
era
bo
t, k
elu
ara
n
ke
rta
s,
pe
rce
taka
n d
an
pe
ne
rbita
n
10
,97
21
1,3
97
11
,33
22
,73
32
,80
42
,76
82
,66
72
,71
62
,96
32
,87
12
,84
72
,78
02
,88
52
,80
22
,86
62
,86
13
,07
3W
oo
d p
rod
ucts
, fu
rnitu
re,
pa
pe
r p
rod
ucts
, p
rin
tin
g a
nd
pu
blis
hin
g
3.4
Pro
du
k p
etr
ole
um
, kim
ia,
ge
tah
da
n p
lastik
52
,81
35
5,8
00
56
,89
11
2,6
69
12
,55
41
3,7
91
13
,79
91
3,4
19
13
,65
51
4,1
45
14
,58
11
3,1
10
14
,00
81
4,9
85
14
,78
71
3,5
15
13
,84
2P
etr
ole
um
, ch
em
ica
l, r
ub
be
r
an
d p
lastic p
rod
ucts
3.5
Pro
du
k m
ine
ral b
uka
n lo
ga
m,
log
am
asa
s d
an
pro
du
k lo
ga
m
ya
ng
dir
eka
23
,18
22
4,9
76
25
,72
95
,30
46
,36
65
,91
35
,59
85
,73
56
,63
76
,45
36
,15
15
,90
47
,08
76
,50
56
,23
36
,12
07
,36
2N
on
-me
talli
c m
ine
ral
pro
du
cts
, b
asic
me
tal a
nd
fab
rica
ted
me
tal p
rod
ucts
3.6
Pro
du
k e
lektr
ik d
an
ele
ktr
on
ik
4
4,7
84
45
,78
14
7,3
96
12
,30
61
0,9
34
10
,88
51
0,6
59
12
,34
71
1,3
33
11
,07
51
1,0
26
12
,40
71
1,3
99
11
,48
81
2,1
01
13
,87
91
2,7
03
Ele
ctr
ica
l a
nd
ele
ctr
on
ic
pro
du
cts
3.7
Pe
rala
tan
pe
ng
an
gku
tan
da
n
pe
mb
ua
tan
la
in
23
,31
62
5,1
34
28
,07
65
,14
85
,46
65
,85
16
,85
15
,53
25
,96
76
,10
07
,53
55
,73
16
,87
16
,84
48
,63
06
,42
28
,11
4T
ran
sp
ort
equ
ipm
en
t a
nd
oth
er
ma
nu
factu
res
4.
22
,46
42
6,6
40
29
,55
45
,16
85
,37
35
,89
56
,02
85
,99
06
,55
76
,97
77
,11
66
,84
27
,21
27
,68
87
,81
38
,13
27
,92
6C
on
str
uc
tio
n
5.
38
5,5
50
41
0,3
39
43
4,4
60
91
,80
39
4,6
46
97
,59
11
01
,51
19
7,0
03
10
0,9
42
10
4,3
67
10
8,0
27
10
2,9
06
10
6,0
17
11
0,5
82
11
4,9
54
10
9,6
71
11
2,3
94
Se
rvic
es
5.1
Ele
ktr
ik d
an
ga
s
14
,87
21
5,5
23
16
,16
93
,56
83
,76
73
,77
53
,76
23
,74
83
,93
33
,92
43
,91
73
,90
84
,09
74
,07
54
,08
94
,02
84
,21
1E
lectr
icity a
nd
ga
s
5.2
Air
3,2
62
3,3
95
3,5
17
79
38
19
82
78
22
83
08
54
85
58
57
84
88
85
89
28
93
88
19
04
Wa
ter
5.3
Pe
rda
ga
ng
an
bo
ron
g
44
,13
94
5,5
86
48
,19
59
,58
91
0,9
24
11
,79
21
1,8
33
10
,24
71
1,3
49
12
,13
31
1,8
57
10
,78
01
1,8
72
12
,74
51
2,7
98
11
,64
81
2,8
66
Wh
ole
sa
le t
rad
e
5.4
Pe
rda
ga
ng
an
ru
ncit
4
4,2
34
46
,86
65
0,6
72
10
,40
71
0,4
80
11
,15
41
2,1
94
11
,22
21
1,2
45
11
,72
81
2,6
71
11
,98
41
2,0
83
12
,64
41
3,9
61
13
,22
51
3,2
84
Re
tail
tra
de
5.5
Ke
nd
era
an
be
rmo
tor
13
,58
21
4,1
93
14
,59
43
,19
03
,04
83
,75
43
,59
13
,19
73
,29
84
,00
03
,69
93
,31
63
,27
34
,16
43
,84
13
,44
73
,56
4M
oto
r ve
hic
les
5.6
Re
sto
ran
1
2,7
32
13
,54
51
4,4
58
3,0
38
3,0
91
3,1
79
3,4
23
3,2
47
3,3
35
3,3
44
3,6
19
3,5
12
3,5
34
3,5
50
3,8
62
3,7
42
3,7
61
Re
sta
ura
nts
5.7
Pe
ng
ina
pa
n4
,77
84
,91
75
,06
11
,12
41
,16
51
,23
71
,25
21
,17
31
,21
31
,25
31
,27
81
,19
21
,23
71
,31
51
,31
71
,24
91
,27
8A
cco
mm
od
atio
n
5.8
Pe
ng
an
gku
tan
da
n
pe
nyim
pa
na
n
2
6,0
69
27
,35
52
8,6
25
6,3
37
6,3
69
6,5
96
6,7
67
6,7
11
6,7
42
6,8
39
7,0
63
6,9
64
7,0
28
7,1
86
7,4
47
7,2
98
7,3
50
Tra
nsp
ort
an
d s
tora
ge
5.9
Ko
mu
nik
asi
26
,58
22
9,0
97
32
,01
16
,32
96
,58
16
,78
36
,89
06
,94
37
,22
77
,42
67
,50
17
,57
17
,93
78
,22
58
,27
68
,34
78
,71
3C
om
mu
nic
atio
n
5.1
0K
ew
an
ga
n
51
,29
85
4,1
49
55
,13
01
2,5
89
12
,86
11
2,6
55
13
,19
31
2,7
22
13
,38
61
3,8
72
14
,16
91
3,1
28
13
,37
21
4,1
89
14
,44
11
3,4
65
13
,40
4F
ina
nce
5.1
1In
su
ran
s
14
,25
91
6,5
79
16
,86
63
,44
73
,39
83
,68
53
,72
93
,63
44
,00
04
,35
04
,59
44
,25
03
,98
84
,20
44
,42
44
,33
54
,05
4In
su
ran
ce
5.1
2H
art
an
ah
da
n p
erk
hid
ma
tan
pe
rnia
ga
an
38
,65
44
1,4
47
44
,53
69
,49
99
,80
29
,54
19
,81
31
0,1
61
10
,54
31
0,2
58
10
,48
51
0,8
23
11
,26
81
1,0
94
11
,35
21
1,7
56
12
,09
6R
ea
l e
sta
te a
nd
bu
sin
ess
se
rvic
es
5.1
3P
erk
hid
ma
tan
la
in3
6,1
76
37
,58
73
9,5
20
8,8
36
9,0
42
9,1
20
9,1
78
9,1
95
9,4
18
9,4
26
9,5
49
9,6
70
9,9
16
9,8
99
10
,03
41
0,1
36
10
,35
9O
the
r se
rvic
es
5.1
4P
erk
hid
ma
tan
ke
raja
an
54
,91
26
0,1
00
65
,10
71
3,0
58
13
,29
81
3,4
91
15
,06
41
3,9
73
14
,40
01
4,9
59
16
,76
81
4,9
60
15
,52
71
6,4
01
18
,21
81
6,1
14
16
,55
1G
ove
rnm
en
t se
rvic
es
6.
8,6
53
10
,00
11
0,5
86
1,8
12
2,3
62
2,4
19
2,0
60
2,2
98
2,5
88
2,7
00
2,4
15
2,4
24
2,7
94
2,8
67
2,5
01
2,6
58
3,2
84
plu
s Im
po
rt d
uti
es
71
1,7
60
75
1,9
34
78
7,6
11
17
0,7
55
17
4,9
60
18
1,4
72
18
4,5
73
17
9,4
89
18
4,8
52
19
0,9
80
19
6,6
12
18
7,0
93
19
3,2
49
20
0,5
91
20
6,6
78
19
8,6
46
20
5,6
23
GD
P a
t p
urc
ha
se
rs' p
ric
es
ca
mp
ur
Du
ti i
mp
ort
KD
NK
pa
da
ha
rga
pe
mb
eli
25
Pe
rta
nia
n
Pe
rlo
mb
on
ga
n d
an
pe
ng
ku
ari
an
Pe
mb
ua
tan
Pe
mb
ina
an
Pe
rkh
idm
ata
n
2013
p
Jad
ual 8B
: K
DN
K m
en
gik
ut
Jen
is A
kti
vit
i E
ko
no
mi p
ad
a H
arg
a M
ala
r 2005 -
RM
Ju
taT
ab
le 8
B:
GD
P b
y K
ind
of
Eco
no
mic
Acti
vit
y a
t C
on
sta
nt
2005 P
rices -
RM
Millio
n
Kin
d o
f eco
no
mic
acti
vit
y2011
2012
Jen
is a
kti
vit
i eko
no
mi
2013
2011
2012
e2014

III
III
IVI
IIII
IIV
III
III
IVI
II
1.
26
.3-9
.3-2
.93
3.1
42
.42
9.5
4.9
-8.7
-13
.2-7
.9-7
.4-6
.9-1
2.5
-3.0
10
.91
2.3
18
.1A
gri
cu
ltu
re
1.1
Ge
tah
31
.2-3
3.4
-28
.95
2.6
64
.46
1.0
-24
.3-3
9.7
-27
.8-4
1.1
-19
.1-1
6.3
-48
.6-2
5.6
-26
.5-3
5.6
-29
.7R
ub
be
r
1.2
Ke
lap
a s
aw
it3
5.5
-15
.7-9
.94
9.8
75
.03
2.8
0.5
-14
.0-2
5.1
-9.1
-13
.1-1
8.9
-26
.8-1
1.5
18
.92
6.1
37
.3O
il p
alm
1.3
Te
rna
ka
n3
2.2
2.3
17
.43
0.6
35
.02
9.7
33
.68
.4-5
.6-0
.57
.81
3.6
18
.02
0.8
16
.81
9.3
8.8
Liv
esto
ck
1.4
Pe
rta
nia
n la
in1
5.4
5.7
20
.01
7.2
13
.11
1.9
20
.03
.26
.77
.06
.01
7.4
28
.11
7.4
17
.71
4.1
11
.2O
the
r a
gricu
ltu
re
1.5
Pe
rhu
tan
an
da
n p
em
ba
laka
n9
.63
.6-1
1.4
-13
.0-5
.73
0.3
28
.14
0.6
22
.9-1
2.5
-20
.8-1
7.2
-17
.2-8
.0-1
.0-3
.95
.6F
ore
str
y a
nd
lo
gg
ing
1.6
Pe
rika
na
n la
ut
7.4
8.4
6.3
14
.2-2
.21
0.7
7.9
0.3
7.3
14
.21
0.5
11
.55
.66
.02
.81
3.0
8.1
Ma
rin
e f
ish
ing
1.7
Aku
aku
ltu
r 6
.82
0.1
5.2
13
.5-2
.71
0.0
7.2
7.0
20
.52
6.5
24
.71
7.5
2.6
1.3
2.4
5.8
15
.3A
qu
acu
ltu
re
2.
6.7
5.4
1.6
2.7
6.0
6.5
11
.51
5.1
7.0
1.2
-1.2
-2.6
-5.5
4.1
10
.98
.81
4.3
Min
ing
an
d q
ua
rry
ing
3.
10
.06
.13
.49
.99
.41
0.8
9.9
6.3
8.0
4.7
5.4
-0.8
1.9
4.2
8.1
9.8
11
.0M
an
ufa
ctu
rin
g
3.1
Ma
ka
na
n,
min
um
an
da
n
tem
ba
ka
u
17
.90
.41
.01
5.2
23
.11
7.3
16
.04
.5-1
.41
.0-1
.6-2
.0-2
.40
.97
.21
3.2
21
.7F
oo
d,
be
ve
rag
es a
nd
tob
acco
3.2
Pro
du
k t
ekstil, p
aka
ian
da
n
ku
lit
12
.5-8
.32
.62
9.5
15
.47
.9-0
.1-1
0.5
-4.6
-9.1
-9.0
-6.8
5.8
0.5
11
.68
.31
7.7
Te
xtile
s,
we
arin
g a
pp
are
l a
nd
lea
the
r p
rod
ucts
3.3
Pro
du
k k
ayu
, p
era
bo
t, k
elu
ara
n
ke
rta
s,
pe
rce
taka
n d
an
pe
ne
rbita
n
5.8
6.1
-1.1
3.7
6.0
7.4
5.9
5.0
8.3
5.0
6.0
2.1
-4.3
-3.0
1.0
2.7
8.0
Wo
od
pro
du
cts
, fu
rnitu
re,
pa
pe
r p
rod
ucts
, p
rin
tin
g a
nd
pu
blis
hin
g
3.4
Pro
du
k p
etr
ole
um
, kim
ia,
ge
tah
da
n p
lastik
20
.78
.81
.32
3.3
24
.71
9.2
16
.61
2.1
14
.54
.75
.0-4
.4-1
.44
.46
.17
.62
.8P
etr
ole
um
, ch
em
ica
l, r
ub
be
r
an
d p
lastic p
rod
ucts
3.5
Pro
du
k m
ine
ral b
uka
n lo
ga
m,
log
am
asa
s d
an
pro
du
k lo
ga
m
ya
ng
dir
eka
18
.96
.53
.72
5.1
18
.01
9.9
13
.24
.53
.28
.51
0.1
3.8
7.6
1.3
2.0
3.1
7.5
No
n-m
eta
llic m
ine
ral
pro
du
cts
, b
asic
me
tal a
nd
fab
rica
ted
me
tal p
rod
ucts
3.6
Pro
du
k e
lektr
ik d
an
ele
ktr
on
ik
-4
.74
.64
.6-5
.2-7
.2-2
.8-3
.41
.76
.84
.75
.50
.30
.95
.41
2.6
15
.11
5.7
Ele
ctr
ica
l a
nd
ele
ctr
on
ic
pro
du
cts
3.7
Pe
rala
tan
pe
ng
an
gku
tan
da
n
pe
mb
ua
tan
la
in
-2.9
9.3
12
.8-6
.2-1
4.5
-0.6
9.6
6.6
12
.06
.71
1.4
3.8
15
.71
3.4
16
.61
3.9
19
.7T
ran
sp
ort
equ
ipm
en
t a
nd
oth
er
ma
nu
factu
res
4.
9.4
23
.41
2.9
8.0
5.9
9.5
13
.62
2.4
28
.62
2.4
20
.61
6.4
11
.91
2.2
11
.52
0.4
11
.6C
on
str
uc
tio
n
5.
9.4
9.1
6.9
9.5
9.9
8.9
9.4
9.0
9.7
9.3
8.6
6.8
5.6
7.1
8.1
8.8
8.3
Se
rvic
es
5.1
Ele
ktr
ik d
an
ga
s
6.4
8.8
6.8
2.1
2.9
10
.01
0.4
11
.71
0.8
6.4
6.7
6.7
7.2
6.6
6.7
12
.11
4.5
Ele
ctr
icity a
nd
ga
s
5.2
Air
7.9
5.0
4.9
5.6
7.9
10
.27
.96
.95
.13
.34
.83
.14
.75
.95
.85
.33
.4W
ate
r
5.3
Pe
rda
ga
ng
an
bo
ron
g
18
.35
.76
.71
4.9
19
.42
1.2
17
.31
1.1
8.1
4.9
0.2
4.2
3.1
6.4
12
.71
3.3
14
.0W
ho
lesa
le t
rad
e
5.4
Pe
rda
ga
ng
an
ru
ncit
1
0.2
7.8
10
.81
0.3
9.6
10
.41
0.5
10
.39
.56
.55
.48
.89
.01
0.7
14
.41
4.9
14
.8R
eta
il tr
ad
e
5.5
Ke
nd
era
an
be
rmo
tor
3.1
6.3
4.0
3.3
-1.5
6.1
3.8
2.6
9.5
8.2
5.1
6.0
-0.1
4.9
4.8
4.9
10
.3M
oto
r ve
hic
les
5.6
Re
sto
ran
1
1.2
9.4
10
.31
0.0
10
.81
1.4
12
.31
0.6
11
.08
.08
.11
1.4
9.3
9.7
10
.61
0.9
10
.7R
esta
ura
nts
5.7
Pe
ng
ina
pa
n4
.94
.85
.23
.85
.25
.65
.06
.36
.72
.93
.63
.33
.27
.26
.88
.77
.3A
cco
mm
od
atio
n
5.8
Pe
ng
an
gku
tan
da
n
pe
nyim
pa
na
n
6
.86
.46
.14
.66
.87
.97
.97
.77
.24
.96
.05
.45
.86
.46
.66
.26
.1T
ran
sp
ort
an
d s
tora
ge
5.9
Ko
mu
nik
asi
9.4
9.7
9.8
8.6
9.2
9.8
10
.09
.91
0.2
9.6
9.1
9.9
9.5
10
.19
.91
0.4
10
.2C
om
mu
nic
atio
n
5.1
0K
ew
an
ga
n
2.8
6.7
3.1
6.8
7.1
-3.6
1.3
2.2
4.5
11
.38
.94
.40
.94
.13
.34
.71
.5F
ina
nce
5.1
1In
su
ran
s
10
.11
7.5
3.4
12
.57
.51
.91
9.6
7.0
18
.71
9.1
24
.71
8.1
1.3
-1.0
-2.2
3.3
2.6
Insu
ran
ce
5.1
2H
art
an
ah
da
n p
erk
hid
ma
tan
pe
rnia
ga
an
7.3
8.9
8.8
7.5
8.6
6.7
6.4
8.9
9.5
9.1
8.2
7.9
8.4
9.4
9.5
9.8
8.4
Re
al e
sta
te a
nd
bu
sin
ess
se
rvic
es
5.1
3P
erk
hid
ma
tan
la
in6
.65
.46
.57
.56
.86
.85
.55
.85
.94
.55
.26
.36
.56
.66
.66
.15
.9O
the
r se
rvic
es
5.1
4P
erk
hid
ma
tan
ke
raja
an
13
.41
7.4
6.1
15
.61
4.7
12
.51
1.4
14
.71
6.1
18
.91
9.4
5.1
5.5
7.2
6.4
5.9
4.8
Go
ve
rnm
en
t se
rvic
es
6.
13
.61
6.9
5.7
16
.11
5.8
24
.90
.53
0.0
12
.21
2.1
16
.05
.07
.76
.13
.91
0.3
20
.2p
lus
Im
po
rt d
uti
es
11
.06
.44
.81
1.1
12
.41
1.5
9.3
7.5
6.8
5.7
5.6
2.8
2.0
5.2
8.7
9.8
10
.7G
DP
at
pu
rch
as
ers
' p
ric
es
Kin
d o
f eco
no
mic
acti
vit
y
Jad
ual 9A
: K
DN
K m
en
gik
ut
Jen
is A
kti
vit
i E
ko
no
mi p
ad
a H
arg
a S
em
asa -
Pera
tus p
eru
bah
an
dari
su
ku
tah
un
yan
g s
am
a t
ah
un
seb
elu
mn
ya
Tab
le 9
A:
GD
P b
y K
ind
of
Eco
no
mic
Acti
vit
y a
t C
urr
en
t P
rices -
Perc
en
tag
e c
han
ge f
rom
co
rresp
on
din
g q
uart
er
of
pre
ced
ing
year
2012
2011
Jen
is a
kti
vit
i eko
no
mi
2013
2011
2012
e2013
p2014
Pe
mb
ina
an
Pe
rkh
idm
ata
n
ca
mp
ur
Du
ti i
mp
ort
Pe
mb
ua
tan
26
Pe
rta
nia
n
Pe
rlo
mb
on
ga
n d
an
pe
ng
ku
ari
an
KD
NK
pa
da
ha
rga
pe
mb
eli
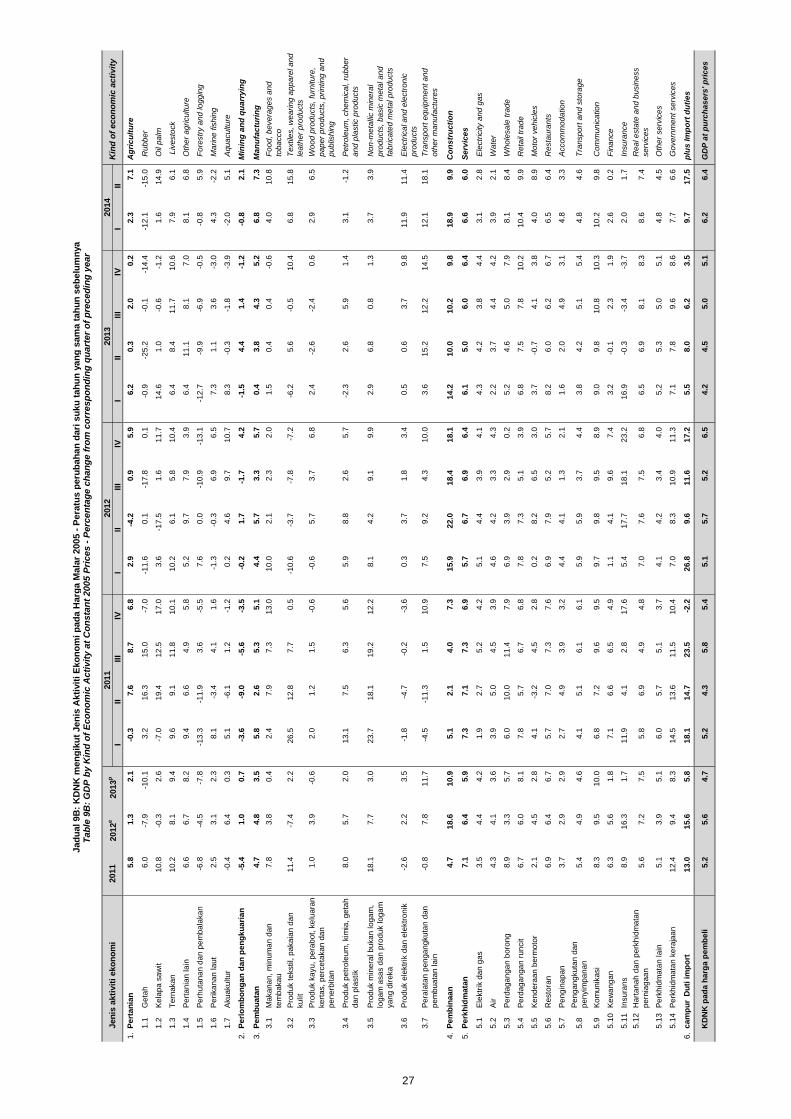
III
III
IVI
IIII
IIV
III
III
IVI
II
1.
5.8
1.3
2.1
-0.3
7.6
8.7
6.8
2.9
-4.2
0.9
5.9
6.2
0.3
2.0
0.2
2.3
7.1
Ag
ric
ult
ure
1.1
Ge
tah
6.0
-7.9
-10
.13
.21
6.3
15
.0-7
.0-1
1.6
0.1
-17
.80
.1-0
.9-2
5.2
-0.1
-14
.4-1
2.1
-15
.0R
ub
be
r
1.2
Ke
lap
a s
aw
it1
0.8
-0.3
2.6
-7.0
19
.41
2.5
17
.03
.6-1
7.5
1.6
11
.71
4.6
1.0
-0.6
-1.2
1.6
14
.9O
il p
alm
1.3
Te
rna
ka
n1
0.2
8.1
9.4
9.6
9.1
11
.81
0.1
10
.26
.15
.81
0.4
6.4
8.4
11
.71
0.6
7.9
6.1
Liv
esto
ck
1.4
Pe
rta
nia
n la
in6
.66
.78
.29
.46
.64
.95
.85
.29
.77
.93
.96
.41
1.1
8.1
7.0
8.1
6.8
Oth
er
ag
ricu
ltu
re
1.5
Pe
rhu
tan
an
da
n p
em
ba
laka
n-6
.8-4
.5-7
.8-1
3.3
-11
.93
.6-5
.57
.60
.0-1
0.9
-13
.1-1
2.7
-9.9
-6.9
-0.5
-0.8
5.9
Fo
restr
y a
nd
lo
gg
ing
1.6
Pe
rika
na
n la
ut
2.5
3.1
2.3
8.1
-3.4
4.1
1.6
-1.3
-0.3
6.9
6.5
7.3
1.1
3.6
-3.0
4.3
-2.2
Ma
rin
e f
ish
ing
1.7
Aku
aku
ltu
r -0
.46
.40
.35
.1-6
.11
.2-1
.20
.24
.69
.71
0.7
8.3
-0.3
-1.8
-3.9
-2.0
5.1
Aqu
acu
ltu
re
2.
-5.4
1.0
0.7
-3.6
-9.0
-5.6
-3.5
-0.2
1.7
-1.7
4.2
-1.5
4.4
1.4
-1.2
-0.8
2.1
Min
ing
an
d q
ua
rry
ing
3.
4.7
4.8
3.5
5.8
2.6
5.3
5.1
4.4
5.7
3.3
5.7
0.4
3.8
4.3
5.2
6.8
7.3
Ma
nu
fac
turi
ng
3.1
Ma
ka
na
n,
min
um
an
da
n
tem
ba
ka
u
7.8
3.8
0.4
2.4
7.9
7.3
13
.01
0.0
2.1
2.3
2.0
1.5
0.4
0.4
-0.6
4.0
10
.8F
oo
d,
be
ve
rag
es a
nd
tob
acco
3.2
Pro
du
k t
ekstil, p
aka
ian
da
n
ku
lit
11
.4-7
.42
.22
6.5
12
.87
.70
.5-1
0.6
-3.7
-7.8
-7.2
-6.2
5.6
-0.5
10
.46
.81
5.8
Te
xtile
s,
we
arin
g a
pp
are
l a
nd
lea
the
r p
rod
ucts
3.3
Pro
du
k k
ayu
, p
era
bo
t, k
elu
ara
n
ke
rta
s,
pe
rce
taka
n d
an
pe
ne
rbita
n
1.0
3.9
-0.6
2.0
1.2
1.5
-0.6
-0.6
5.7
3.7
6.8
2.4
-2.6
-2.4
0.6
2.9
6.5
Wo
od
pro
du
cts
, fu
rnitu
re,
pa
pe
r p
rod
ucts
, p
rin
tin
g a
nd
pu
blis
hin
g
3.4
Pro
du
k p
etr
ole
um
, kim
ia,
ge
tah
da
n p
lastik
8.0
5.7
2.0
13
.17
.56
.35
.65
.98
.82
.65
.7-2
.32
.65
.91
.43
.1-1
.2P
etr
ole
um
, ch
em
ica
l, r
ub
be
r
an
d p
lastic p
rod
ucts
3.5
Pro
du
k m
ine
ral b
uka
n lo
ga
m,
log
am
asa
s d
an
pro
du
k lo
ga
m
ya
ng
dir
eka
18
.17
.73
.02
3.7
18
.11
9.2
12
.28
.14
.29
.19
.92
.96
.80
.81
.33
.73
.9N
on
-me
talli
c m
ine
ral
pro
du
cts
, b
asic
me
tal a
nd
fab
rica
ted
me
tal p
rod
ucts
3.6
Pro
du
k e
lektr
ik d
an
ele
ktr
on
ik
-2
.62
.23
.5-1
.8-4
.7-0
.2-3
.60
.33
.71
.83
.40
.50
.63
.79
.81
1.9
11
.4E
lectr
ica
l a
nd
ele
ctr
on
ic
pro
du
cts
3.7
Pe
rala
tan
pe
ng
an
gku
tan
da
n
pe
mb
ua
tan
la
in
-0.8
7.8
11
.7-4
.5-1
1.3
1.5
10
.97
.59
.24
.31
0.0
3.6
15
.21
2.2
14
.51
2.1
18
.1T
ran
sp
ort
equ
ipm
en
t a
nd
oth
er
ma
nu
factu
res
4.
4.7
18
.61
0.9
5.1
2.1
4.0
7.3
15
.92
2.0
18
.41
8.1
14
.21
0.0
10
.29
.81
8.9
9.9
Co
ns
tru
cti
on
5.
7.1
6.4
5.9
7.3
7.1
7.3
6.9
5.7
6.7
6.9
6.4
6.1
5.0
6.0
6.4
6.6
6.0
Se
rvic
es
5.1
Ele
ktr
ik d
an
ga
s
3.5
4.4
4.2
1.9
2.7
5.2
4.2
5.1
4.4
3.9
4.1
4.3
4.2
3.8
4.4
3.1
2.8
Ele
ctr
icity a
nd
ga
s
5.2
Air
4.3
4.1
3.6
3.9
5.0
4.5
3.9
4.6
4.2
3.3
4.3
2.2
3.7
4.4
4.2
3.9
2.1
Wa
ter
5.3
Pe
rda
ga
ng
an
bo
ron
g
8.9
3.3
5.7
6.0
10
.01
1.4
7.9
6.9
3.9
2.9
0.2
5.2
4.6
5.0
7.9
8.1
8.4
Wh
ole
sa
le t
rad
e
5.4
Pe
rda
ga
ng
an
ru
ncit
6
.76
.08
.17
.85
.76
.76
.87
.87
.35
.13
.96
.87
.57
.81
0.2
10
.49
.9R
eta
il tr
ad
e
5.5
Ke
nd
era
an
be
rmo
tor
2.1
4.5
2.8
4.1
-3.2
4.5
2.8
0.2
8.2
6.5
3.0
3.7
-0.7
4.1
3.8
4.0
8.9
Mo
tor
ve
hic
les
5.6
Re
sto
ran
6
.96
.46
.75
.77
.07
.37
.66
.97
.95
.25
.78
.26
.06
.26
.76
.56
.4R
esta
ura
nts
5.7
Pe
ng
ina
pa
n3
.72
.92
.92
.74
.93
.93
.24
.44
.11
.32
.11
.62
.04
.93
.14
.83
.3A
cco
mm
od
atio
n
5.8
Pe
ng
an
gku
tan
da
n
pe
nyim
pa
na
n
5
.44
.94
.64
.15
.16
.16
.15
.95
.93
.74
.43
.84
.25
.15
.44
.84
.6T
ran
sp
ort
an
d s
tora
ge
5.9
Ko
mu
nik
asi
8.3
9.5
10
.06
.87
.29
.69
.59
.79
.89
.58
.99
.09
.81
0.8
10
.31
0.2
9.8
Co
mm
un
ica
tio
n
5.1
0K
ew
an
ga
n
6.3
5.6
1.8
7.1
6.6
6.5
4.9
1.1
4.1
9.6
7.4
3.2
-0.1
2.3
1.9
2.6
0.2
Fin
an
ce
5.1
1In
su
ran
s
8.9
16
.31
.71
1.9
4.1
2.8
17
.65
.41
7.7
18
.12
3.2
16
.9-0
.3-3
.4-3
.72
.01
.7In
su
ran
ce
5.1
2H
art
an
ah
da
n p
erk
hid
ma
tan
pe
rnia
ga
an
5.6
7.2
7.5
5.8
6.9
4.9
4.8
7.0
7.6
7.5
6.8
6.5
6.9
8.1
8.3
8.6
7.4
Re
al e
sta
te a
nd
bu
sin
ess
se
rvic
es
5.1
3P
erk
hid
ma
tan
la
in5
.13
.95
.16
.05
.75
.13
.74
.14
.23
.44
.05
.25
.35
.05
.14
.84
.5O
the
r se
rvic
es
5.1
4P
erk
hid
ma
tan
ke
raja
an
12
.49
.48
.31
4.5
13
.61
1.5
10
.47
.08
.31
0.9
11
.37
.17
.89
.68
.67
.76
.6G
ove
rnm
en
t se
rvic
es
6.
13
.01
5.6
5.8
18
.11
4.7
23
.5-2
.22
6.8
9.6
11
.61
7.2
5.5
8.0
6.2
3.5
9.7
17
.5p
lus
Im
po
rt d
uti
es
5.2
5.6
4.7
5.2
4.3
5.8
5.4
5.1
5.7
5.2
6.5
4.2
4.5
5.0
5.1
6.2
6.4
GD
P a
t p
urc
ha
se
rs' p
ric
es
Jad
ual 9B
: K
DN
K m
en
gik
ut
Jen
is A
kti
vit
i E
ko
no
mi p
ad
a H
arg
a M
ala
r 2005 -
Pera
tus p
eru
bah
an
dari
su
ku
tah
un
yan
g s
am
a t
ah
un
seb
elu
mn
ya
Tab
le 9
B:
GD
P b
y K
ind
of
Eco
no
mic
Acti
vit
y a
t C
on
sta
nt
2005 P
rices -
Perc
en
tag
e c
han
ge f
rom
co
rresp
on
din
g q
uart
er
of
pre
ced
ing
year
2011
Kin
d o
f eco
no
mic
acti
vit
y2012
Jen
is a
kti
vit
i eko
no
mi
2013
2011
2012
e2013
p2014
27
KD
NK
pa
da
ha
rga
pe
mb
eli
Pe
rta
nia
n
Pe
rlo
mb
on
ga
n d
an
pe
ng
ku
ari
an
Pe
mb
ua
tan
Pe
mb
ina
an
Pe
rkh
idm
ata
n
ca
mp
ur
Du
ti i
mp
ort
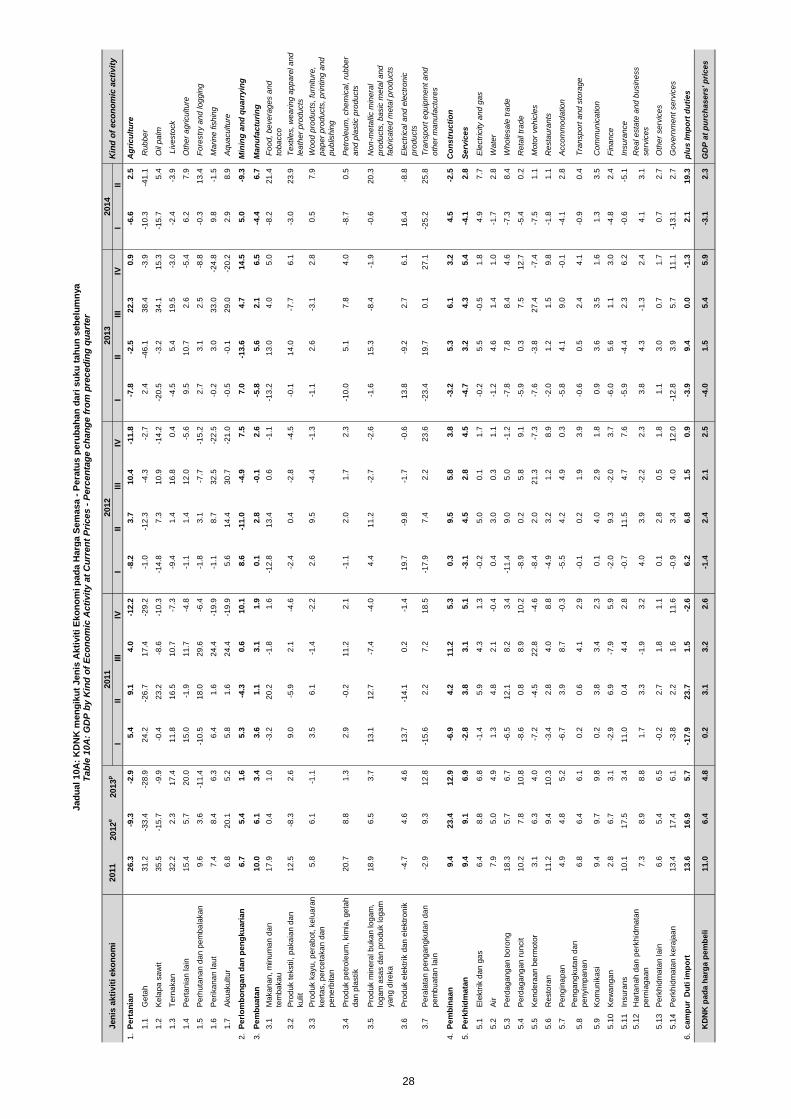
III
III
IVI
IIII
IIV
III
III
IVI
II
1.
26
.3-9
.3-2
.95
.49
.14
.0-1
2.2
-8.2
3.7
10
.4-1
1.8
-7.8
-2.5
22
.30
.9-6
.62
.5A
gri
cu
ltu
re
1.1
Ge
tah
31
.2-3
3.4
-28
.92
4.2
-26
.71
7.4
-29
.2-1
.0-1
2.3
-4.3
-2.7
2.4
-46
.13
8.4
-3.9
-10
.3-4
1.1
Ru
bb
er
1.2
Ke
lap
a s
aw
it3
5.5
-15
.7-9
.9-0
.42
3.2
-8.6
-10
.3-1
4.8
7.3
10
.9-1
4.2
-20
.5-3
.23
4.1
15
.3-1
5.7
5.4
Oil
pa
lm
1.3
Te
rna
ka
n3
2.2
2.3
17
.41
1.8
16
.51
0.7
-7.3
-9.4
1.4
16
.80
.4-4
.55
.41
9.5
-3.0
-2.4
-3.9
Liv
esto
ck
1.4
Pe
rta
nia
n la
in1
5.4
5.7
20
.01
5.0
-1.9
11
.7-4
.8-1
.11
.41
2.0
-5.6
9.5
10
.72
.6-5
.46
.27
.9O
the
r a
gricu
ltu
re
1.5
Pe
rhu
tan
an
da
n p
em
ba
laka
n9
.63
.6-1
1.4
-10
.51
8.0
29
.6-6
.4-1
.83
.1-7
.7-1
5.2
2.7
3.1
2.5
-8.8
-0.3
13
.4F
ore
str
y a
nd
lo
gg
ing
1.6
Pe
rika
na
n la
ut
7.4
8.4
6.3
6.4
1.6
24
.4-1
9.9
-1.1
8.7
32
.5-2
2.5
-0.2
3.0
33
.0-2
4.8
9.8
-1.5
Ma
rin
e f
ish
ing
1.7
Aku
aku
ltu
r 6
.82
0.1
5.2
5.8
1.6
24
.4-1
9.9
5.6
14
.43
0.7
-21
.0-0
.5-0
.12
9.0
-20
.22
.98
.9A
qu
acu
ltu
re
2.
6.7
5.4
1.6
5.3
-4.3
0.6
10
.18
.6-1
1.0
-4.9
7.5
7.0
-13
.64
.71
4.5
5.0
-9.3
Min
ing
an
d q
ua
rry
ing
3.
10
.06
.13
.43
.61
.13
.11
.90
.12
.8-0
.12
.6-5
.85
.62
.16
.5-4
.46
.7M
an
ufa
ctu
rin
g
3.1
Ma
ka
na
n,
min
um
an
da
n
tem
ba
ka
u
17
.90
.41
.0-3
.22
0.2
-1.8
1.6
-12
.81
3.4
0.6
-1.1
-13
.21
3.0
4.0
5.0
-8.2
21
.4F
oo
d,
be
ve
rag
es a
nd
tob
acco
3.2
Pro
du
k t
ekstil, p
aka
ian
da
n
ku
lit
12
.5-8
.32
.69
.0-5
.92
.1-4
.6-2
.40
.4-2
.8-4
.5-0
.11
4.0
-7.7
6.1
-3.0
23
.9T
extile
s,
we
arin
g a
pp
are
l a
nd
lea
the
r p
rod
ucts
3.3
Pro
du
k k
ayu
, p
era
bo
t, k
elu
ara
n
ke
rta
s,
pe
rce
taka
n d
an
pe
ne
rbita
n
5.8
6.1
-1.1
3.5
6.1
-1.4
-2.2
2.6
9.5
-4.4
-1.3
-1.1
2.6
-3.1
2.8
0.5
7.9
Wo
od
pro
du
cts
, fu
rnitu
re,
pa
pe
r p
rod
ucts
, p
rin
tin
g a
nd
pu
blis
hin
g
3.4
Pro
du
k p
etr
ole
um
, kim
ia,
ge
tah
da
n p
lastik
20
.78
.81
.32
.9-0
.21
1.2
2.1
-1.1
2.0
1.7
2.3
-10
.05
.17
.84
.0-8
.70
.5P
etr
ole
um
, ch
em
ica
l, r
ub
be
r
an
d p
lastic p
rod
ucts
3.5
Pro
du
k m
ine
ral b
uka
n lo
ga
m,
log
am
asa
s d
an
pro
du
k lo
ga
m
ya
ng
dir
eka
18
.96
.53
.71
3.1
12
.7-7
.4-4
.04
.41
1.2
-2.7
-2.6
-1.6
15
.3-8
.4-1
.9-0
.62
0.3
No
n-m
eta
llic m
ine
ral
pro
du
cts
, b
asic
me
tal a
nd
fab
rica
ted
me
tal p
rod
ucts
3.6
Pro
du
k e
lektr
ik d
an
ele
ktr
on
ik
-4
.74
.64
.61
3.7
-14
.10
.2-1
.41
9.7
-9.8
-1.7
-0.6
13
.8-9
.22
.76
.11
6.4
-8.8
Ele
ctr
ica
l a
nd
ele
ctr
on
ic
pro
du
cts
3.7
Pe
rala
tan
pe
ng
an
gku
tan
da
n
pe
mb
ua
tan
la
in
-2.9
9.3
12
.8-1
5.6
2.2
7.2
18
.5-1
7.9
7.4
2.2
23
.6-2
3.4
19
.70
.12
7.1
-25
.22
5.8
Tra
nsp
ort
equ
ipm
en
t a
nd
oth
er
ma
nu
factu
res
4.
9.4
23
.41
2.9
-6.9
4.2
11
.25
.30
.39
.55
.83
.8-3
.25
.36
.13
.24
.5-2
.5C
on
str
uc
tio
n
5.
9.4
9.1
6.9
-2.8
3.8
3.1
5.1
-3.1
4.5
2.8
4.5
-4.7
3.2
4.3
5.4
-4.1
2.8
Se
rvic
es
5.1
Ele
ktr
ik d
an
ga
s
6.4
8.8
6.8
-1.4
5.9
4.3
1.3
-0.2
5.0
0.1
1.7
-0.2
5.5
-0.5
1.8
4.9
7.7
Ele
ctr
icity a
nd
ga
s
5.2
Air
7.9
5.0
4.9
1.3
4.8
2.1
-0.4
0.4
3.0
0.3
1.1
-1.2
4.6
1.4
1.0
-1.7
2.8
Wa
ter
5.3
Pe
rda
ga
ng
an
bo
ron
g
18
.35
.76
.7-6
.51
2.1
8.2
3.4
-11
.49
.05
.0-1
.2-7
.87
.88
.44
.6-7
.38
.4W
ho
lesa
le t
rad
e
5.4
Pe
rda
ga
ng
an
ru
ncit
1
0.2
7.8
10
.8-8
.60
.88
.91
0.2
-8.9
0.2
5.8
9.1
-5.9
0.3
7.5
12
.7-5
.40
.2R
eta
il tr
ad
e
5.5
Ke
nd
era
an
be
rmo
tor
3.1
6.3
4.0
-7.2
-4.5
22
.8-4
.6-8
.42
.02
1.3
-7.3
-7.6
-3.8
27
.4-7
.4-7
.51
.1M
oto
r ve
hic
les
5.6
Re
sto
ran
1
1.2
9.4
10
.3-3
.42
.84
.08
.8-4
.93
.21
.28
.9-2
.01
.21
.59
.8-1
.81
.1R
esta
ura
nts
5.7
Pe
ng
ina
pa
n4
.94
.85
.2-6
.73
.98
.7-0
.3-5
.54
.24
.90
.3-5
.84
.19
.0-0
.1-4
.12
.8A
cco
mm
od
atio
n
5.8
Pe
ng
an
gku
tan
da
n
pe
nyim
pa
na
n
6
.86
.46
.10
.20
.64
.12
.9-0
.10
.21
.93
.9-0
.60
.52
.44
.1-0
.90
.4T
ran
sp
ort
an
d s
tora
ge
5.9
Ko
mu
nik
asi
9.4
9.7
9.8
0.2
3.8
3.4
2.3
0.1
4.0
2.9
1.8
0.9
3.6
3.5
1.6
1.3
3.5
Co
mm
un
ica
tio
n
5.1
0K
ew
an
ga
n
2.8
6.7
3.1
-2.9
6.9
-7.9
5.9
-2.0
9.3
-2.0
3.7
-6.0
5.6
1.1
3.0
-4.8
2.4
Fin
an
ce
5.1
1In
su
ran
s
10
.11
7.5
3.4
11
.00
.44
.42
.8-0
.71
1.5
4.7
7.6
-5.9
-4.4
2.3
6.2
-0.6
-5.1
Insu
ran
ce
5.1
2H
art
an
ah
da
n p
erk
hid
ma
tan
pe
rnia
ga
an
7.3
8.9
8.8
1.7
3.3
-1.9
3.2
4.0
3.9
-2.2
2.3
3.8
4.3
-1.3
2.4
4.1
3.1
Re
al e
sta
te a
nd
bu
sin
ess
se
rvic
es
5.1
3P
erk
hid
ma
tan
la
in6
.65
.46
.5-0
.22
.71
.81
.10
.12
.80
.51
.81
.13
.00
.71
.70
.72
.7O
the
r se
rvic
es
5.1
4P
erk
hid
ma
tan
ke
raja
an
13
.41
7.4
6.1
-3.8
2.2
1.6
11
.6-0
.93
.44
.01
2.0
-12
.83
.95
.71
1.1
-13
.12
.7G
ove
rnm
en
t se
rvic
es
6.
13
.61
6.9
5.7
-17
.92
3.7
1.5
-2.6
6.2
6.8
1.5
0.9
-3.9
9.4
0.0
-1.3
2.1
19
.3p
lus
Im
po
rt d
uti
es
11
.06
.44
.80
.23
.13
.22
.6-1
.42
.42
.12
.5-4
.01
.55
.45
.9-3
.12
.3G
DP
at
pu
rch
as
ers
' p
ric
es
Jad
ual 10A
: K
DN
K m
en
gik
ut
Jen
is A
kti
vit
i E
ko
no
mi p
ad
a H
arg
a S
em
asa -
Pera
tus p
eru
bah
an
dari
su
ku
tah
un
seb
elu
mn
ya
Tab
le 1
0A
: G
DP
by K
ind
of
Eco
no
mic
Acti
vit
y a
t C
urr
en
t P
rices -
Perc
en
tag
e c
han
ge f
rom
pre
ced
ing
qu
art
er
2011
Kin
d o
f eco
no
mic
acti
vit
y2012
Jen
is a
kti
vit
i eko
no
mi
2013
2011
2012
e2013
p2014
KD
NK
pa
da
ha
rga
pe
mb
eli
Pe
mb
ina
an
Pe
rkh
idm
ata
n
ca
mp
ur
Du
ti i
mp
ort
28
Pe
rta
nia
n
Pe
rlo
mb
on
ga
n d
an
pe
ng
ku
ari
an
Pe
mb
ua
tan
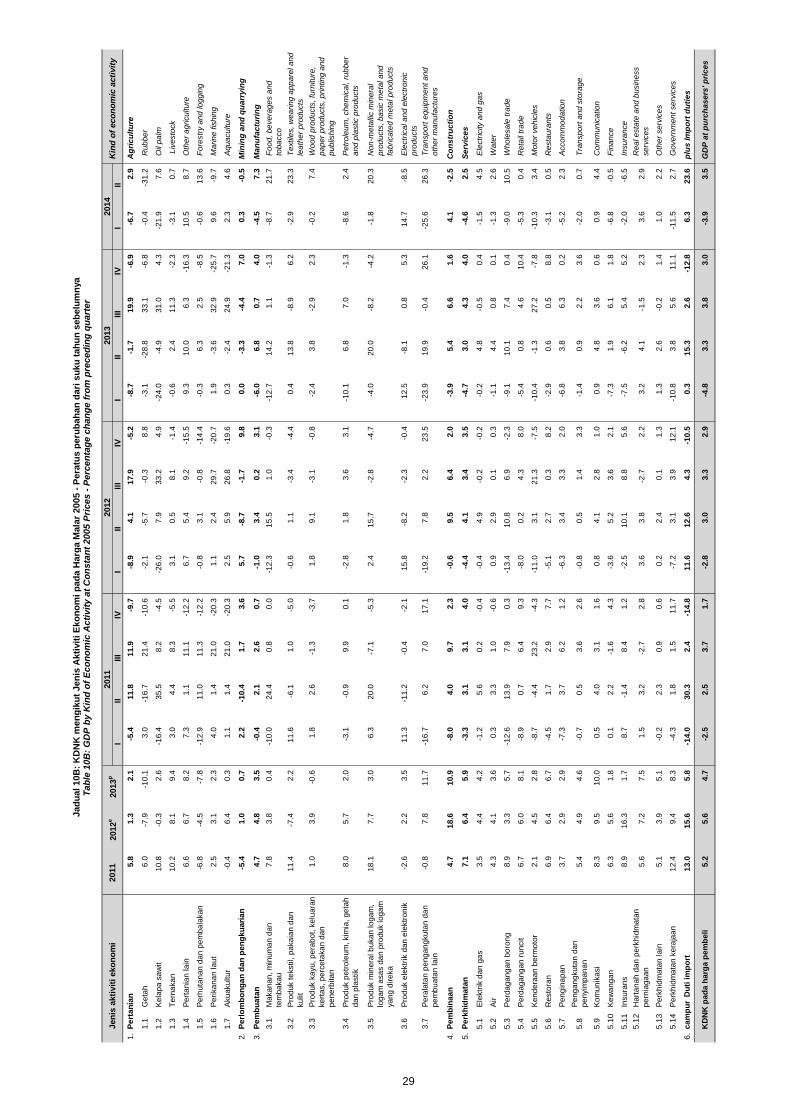
III
III
IVI
IIII
IIV
III
III
IVI
II
1.
5.8
1.3
2.1
-5.4
11
.81
1.9
-9.7
-8.9
4.1
17
.9-5
.2-8
.7-1
.71
9.9
-6.9
-6.7
2.9
Ag
ric
ult
ure
1.1
Ge
tah
6.0
-7.9
-10
.13
.0-1
6.7
21
.4-1
0.6
-2.1
-5.7
-0.3
8.8
-3.1
-28
.83
3.1
-6.8
-0.4
-31
.2R
ub
be
r
1.2
Ke
lap
a s
aw
it1
0.8
-0.3
2.6
-16
.43
5.5
8.2
-4.5
-26
.07
.93
3.2
4.9
-24
.0-4
.93
1.0
4.3
-21
.97
.6O
il p
alm
1.3
Te
rna
ka
n1
0.2
8.1
9.4
3.0
4.4
8.3
-5.5
3.1
0.5
8.1
-1.4
-0.6
2.4
11
.3-2
.3-3
.10
.7 L
ive
sto
ck
1.4
Pe
rta
nia
n la
in6
.66
.78
.27
.31
.11
1.1
-12
.26
.75
.49
.2-1
5.5
9.3
10
.06
.3-1
6.3
10
.58
.7O
the
r a
gricu
ltu
re
1.5
Pe
rhu
tan
an
da
n p
em
ba
laka
n-6
.8-4
.5-7
.8-1
2.9
11
.01
1.3
-12
.2-0
.83
.1-0
.8-1
4.4
-0.3
6.3
2.5
-8.5
-0.6
13
.6F
ore
str
y a
nd
lo
gg
ing
1.6
Pe
rika
na
n la
ut
2.5
3.1
2.3
4.0
1.4
21
.0-2
0.3
1.1
2.4
29
.7-2
0.7
1.9
-3.6
32
.9-2
5.7
9.6
-9.7
Ma
rin
e f
ish
ing
1.7
Aku
aku
ltu
r -0
.46
.40
.31
.11
.42
1.0
-20
.32
.55
.92
6.8
-19
.60
.3-2
.42
4.9
-21
.32
.34
.6A
qu
acu
ltu
re
2.
-5.4
1.0
0.7
2.2
-10
.41
.73
.65
.7-8
.7-1
.79
.80
.0-3
.3-4
.47
.00
.3-0
.5M
inin
g a
nd
qu
arr
yin
g
3.
4.7
4.8
3.5
-0.4
2.1
2.6
0.7
-1.0
3.4
0.2
3.1
-6.0
6.8
0.7
4.0
-4.5
7.3
Ma
nu
fac
turi
ng
3.1
Ma
ka
na
n,
min
um
an
da
n
tem
ba
ka
u
7.8
3.8
0.4
-10
.02
4.4
0.8
0.0
-12
.31
5.5
1.0
-0.3
-12
.71
4.2
1.1
-1.3
-8.7
21
.7F
oo
d,
be
ve
rag
es a
nd
tob
acco
3.2
Pro
du
k t
ekstil, p
aka
ian
da
n
ku
lit
11
.4-7
.42
.21
1.6
-6.1
1.0
-5.0
-0.6
1.1
-3.4
-4.4
0.4
13
.8-8
.96
.2-2
.92
3.3
Te
xtile
s,
we
arin
g a
pp
are
l a
nd
lea
the
r p
rod
ucts
3.3
Pro
du
k k
ayu
, p
era
bo
t, k
elu
ara
n
ke
rta
s,
pe
rce
taka
n d
an
pe
ne
rbita
n
1.0
3.9
-0.6
1.8
2.6
-1.3
-3.7
1.8
9.1
-3.1
-0.8
-2.4
3.8
-2.9
2.3
-0.2
7.4
Wo
od
pro
du
cts
, fu
rnitu
re,
pa
pe
r p
rod
ucts
, p
rin
tin
g a
nd
pu
blis
hin
g
3.4
Pro
du
k p
etr
ole
um
, kim
ia,
ge
tah
da
n p
lastik
8.0
5.7
2.0
-3.1
-0.9
9.9
0.1
-2.8
1.8
3.6
3.1
-10
.16
.87
.0-1
.3-8
.62
.4P
etr
ole
um
, ch
em
ica
l, r
ub
be
r
an
d p
lastic p
rod
ucts
3.5
Pro
du
k m
ine
ral b
uka
n lo
ga
m,
log
am
asa
s d
an
pro
du
k lo
ga
m
ya
ng
dir
eka
18
.17
.73
.06
.32
0.0
-7.1
-5.3
2.4
15
.7-2
.8-4
.7-4
.02
0.0
-8.2
-4.2
-1.8
20
.3N
on
-me
talli
c m
ine
ral
pro
du
cts
, b
asic
me
tal a
nd
fab
rica
ted
me
tal p
rod
ucts
3.6
Pro
du
k e
lektr
ik d
an
ele
ktr
on
ik
-2
.62
.23
.51
1.3
-11
.2-0
.4-2
.11
5.8
-8.2
-2.3
-0.4
12
.5-8
.10
.85
.31
4.7
-8.5
Ele
ctr
ica
l a
nd
ele
ctr
on
ic
pro
du
cts
3.7
Pe
rala
tan
pe
ng
an
gku
tan
da
n
pe
mb
ua
tan
la
in
-0.8
7.8
11
.7-1
6.7
6.2
7.0
17
.1-1
9.2
7.8
2.2
23
.5-2
3.9
19
.9-0
.42
6.1
-25
.62
6.3
Tra
nsp
ort
equ
ipm
en
t a
nd
oth
er
ma
nu
factu
res
4.
4.7
18
.61
0.9
-8.0
4.0
9.7
2.3
-0.6
9.5
6.4
2.0
-3.9
5.4
6.6
1.6
4.1
-2.5
Co
ns
tru
cti
on
5.
7.1
6.4
5.9
-3.3
3.1
3.1
4.0
-4.4
4.1
3.4
3.5
-4.7
3.0
4.3
4.0
-4.6
2.5
Se
rvic
es
5.1
Ele
ktr
ik d
an
ga
s
3.5
4.4
4.2
-1.2
5.6
0.2
-0.4
-0.4
4.9
-0.2
-0.2
-0.2
4.8
-0.5
0.4
-1.5
4.5
Ele
ctr
icity a
nd
ga
s
5.2
Air
4.3
4.1
3.6
0.3
3.3
1.0
-0.6
0.9
2.9
0.1
0.3
-1.1
4.4
0.8
0.1
-1.3
2.6
Wa
ter
5.3
Pe
rda
ga
ng
an
bo
ron
g
8.9
3.3
5.7
-12
.61
3.9
7.9
0.3
-13
.41
0.8
6.9
-2.3
-9.1
10
.17
.40
.4-9
.01
0.5
Wh
ole
sa
le t
rad
e
5.4
Pe
rda
ga
ng
an
ru
ncit
6
.76
.08
.1-8
.90
.76
.49
.3-8
.00
.24
.38
.0-5
.40
.84
.61
0.4
-5.3
0.4
Re
tail
tra
de
5.5
Ke
nd
era
an
be
rmo
tor
2.1
4.5
2.8
-8.7
-4.4
23
.2-4
.3-1
1.0
3.1
21
.3-7
.5-1
0.4
-1.3
27
.2-7
.8-1
0.3
3.4
Mo
tor
ve
hic
les
5.6
Re
sto
ran
6
.96
.46
.7-4
.51
.72
.97
.7-5
.12
.70
.38
.2-2
.90
.60
.58
.8-3
.10
.5R
esta
ura
nts
5.7
Pe
ng
ina
pa
n3
.72
.92
.9-7
.33
.76
.21
.2-6
.33
.43
.32
.0-6
.83
.86
.30
.2-5
.22
.3A
cco
mm
od
atio
n
5.8
Pe
ng
an
gku
tan
da
n
pe
nyim
pa
na
n
5
.44
.94
.6-0
.70
.53
.62
.6-0
.80
.51
.43
.3-1
.40
.92
.23
.6-2
.00
.7T
ran
sp
ort
an
d s
tora
ge
5.9
Ko
mu
nik
asi
8.3
9.5
10
.00
.54
.03
.11
.60
.84
.12
.81
.00
.94
.83
.60
.60
.94
.4C
om
mu
nic
atio
n
5.1
0K
ew
an
ga
n
6.3
5.6
1.8
0.1
2.2
-1.6
4.3
-3.6
5.2
3.6
2.1
-7.3
1.9
6.1
1.8
-6.8
-0.5
Fin
an
ce
5.1
1In
su
ran
s
8.9
16
.31
.78
.7-1
.48
.41
.2-2
.51
0.1
8.8
5.6
-7.5
-6.2
5.4
5.2
-2.0
-6.5
Insu
ran
ce
5.1
2H
art
an
ah
da
n p
erk
hid
ma
tan
pe
rnia
ga
an
5.6
7.2
7.5
1.5
3.2
-2.7
2.8
3.6
3.8
-2.7
2.2
3.2
4.1
-1.5
2.3
3.6
2.9
Re
al e
sta
te a
nd
bu
sin
ess
se
rvic
es
5.1
3P
erk
hid
ma
tan
la
in5
.13
.95
.1-0
.22
.30
.90
.60
.22
.40
.11
.31
.32
.6-0
.21
.41
.02
.2O
the
r se
rvic
es
5.1
4P
erk
hid
ma
tan
ke
raja
an
12
.49
.48
.3-4
.31
.81
.51
1.7
-7.2
3.1
3.9
12
.1-1
0.8
3.8
5.6
11
.1-1
1.5
2.7
Go
ve
rnm
en
t se
rvic
es
6.
13
.01
5.6
5.8
-14
.03
0.3
2.4
-14
.81
1.6
12
.64
.3-1
0.5
0.3
15
.32
.6-1
2.8
6.3
23
.6p
lus
Im
po
rt d
uti
es
5.2
5.6
4.7
-2.5
2.5
3.7
1.7
-2.8
3.0
3.3
2.9
-4.8
3.3
3.8
3.0
-3.9
3.5
GD
P a
t p
urc
ha
se
rs' p
ric
es
Kin
d o
f eco
no
mic
acti
vit
y2012
Jad
ual 10B
: K
DN
K m
en
gik
ut
Jen
is A
kti
vit
i E
ko
no
mi p
ad
a H
arg
a M
ala
r 2005 -
Pera
tus p
eru
bah
an
dari
su
ku
tah
un
seb
elu
mn
ya
Tab
le 1
0B
: G
DP
by K
ind
of
Eco
no
mic
Acti
vit
y a
t C
on
sta
nt
2005 P
rices -
Perc
en
tag
e c
han
ge f
rom
pre
ced
ing
qu
art
er
2011
Jen
is a
kti
vit
i eko
no
mi
2013
2011
2012
e2013
p2014
29
KD
NK
pa
da
ha
rga
pe
mb
eli
Pe
rta
nia
n
Pe
rlo
mb
on
ga
n d
an
pe
ng
ku
ari
an
Pe
mb
ua
tan
Pe
mb
ina
an
Pe
rkh
idm
ata
n
ca
mp
ur
Du
ti i
mp
ort
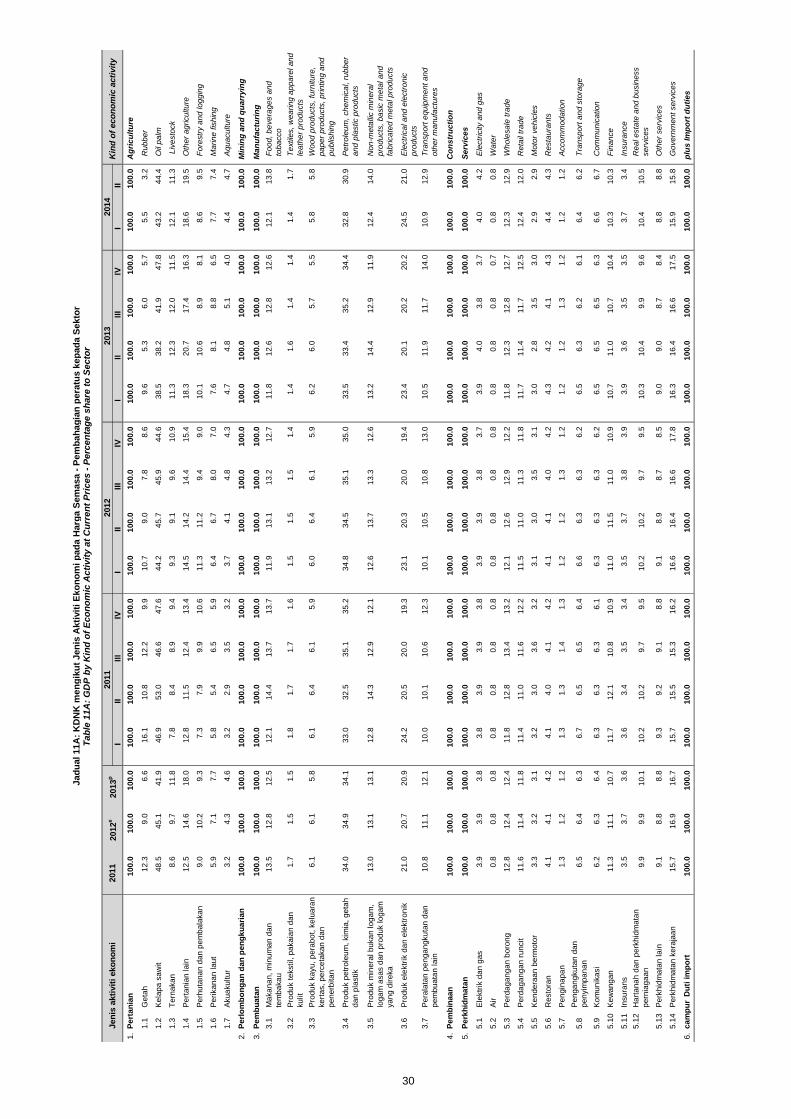
III
III
IVI
IIII
IIV
III
III
IVI
II
1.
10
0.0
10
0.0
10
0.0
10
0.0
10
0.0
10
0.0
10
0.0
10
0.0
10
0.0
10
0.0
10
0.0
10
0.0
10
0.0
10
0.0
10
0.0
10
0.0
10
0.0
Ag
ric
ult
ure
1.1
Ge
tah
12
.39
.06
.61
6.1
10
.81
2.2
9.9
10
.79
.07
.88
.69
.65
.36
.05
.75
.53
.2R
ub
be
r
1.2
Ke
lap
a s
aw
it4
8.5
45
.14
1.9
46
.95
3.0
46
.64
7.6
44
.24
5.7
45
.94
4.6
38
.53
8.2
41
.94
7.8
43
.24
4.4
Oil
pa
lm
1.3
Te
rna
ka
n8
.69
.71
1.8
7.8
8.4
8.9
9.4
9.3
9.1
9.6
10
.91
1.3
12
.31
2.0
11
.51
2.1
11
.3 L
ive
sto
ck
1.4
Pe
rta
nia
n la
in1
2.5
14
.61
8.0
12
.81
1.5
12
.41
3.4
14
.51
4.2
14
.41
5.4
18
.32
0.7
17
.41
6.3
18
.61
9.5
Oth
er
ag
ricu
ltu
re
1.5
Pe
rhu
tan
an
da
n p
em
ba
laka
n9
.01
0.2
9.3
7.3
7.9
9.9
10
.61
1.3
11
.29
.49
.01
0.1
10
.68
.98
.18
.69
.5F
ore
str
y a
nd
lo
gg
ing
1.6
Pe
rika
na
n la
ut
5.9
7.1
7.7
5.8
5.4
6.5
5.9
6.4
6.7
8.0
7.0
7.6
8.1
8.8
6.5
7.7
7.4
Ma
rin
e f
ish
ing
1.7
Aku
aku
ltu
r 3
.24
.34
.63
.22
.93
.53
.23
.74
.14
.84
.34
.74
.85
.14
.04
.44
.7A
qu
acu
ltu
re
2.
10
0.0
10
0.0
10
0.0
10
0.0
10
0.0
10
0.0
10
0.0
10
0.0
10
0.0
10
0.0
10
0.0
10
0.0
10
0.0
10
0.0
10
0.0
10
0.0
10
0.0
Min
ing
an
d q
ua
rry
ing
3.
10
0.0
10
0.0
10
0.0
10
0.0
10
0.0
10
0.0
10
0.0
10
0.0
10
0.0
10
0.0
10
0.0
10
0.0
10
0.0
10
0.0
10
0.0
10
0.0
10
0.0
Ma
nu
fac
turi
ng
3.1
Ma
ka
na
n,
min
um
an
da
n
tem
ba
ka
u
13
.51
2.8
12
.51
2.1
14
.41
3.7
13
.71
1.9
13
.11
3.2
12
.71
1.8
12
.61
2.8
12
.61
2.1
13
.8F
oo
d,
be
ve
rag
es a
nd
tob
acco
3.2
Pro
du
k t
ekstil, p
aka
ian
da
n
ku
lit
1.7
1.5
1.5
1.8
1.7
1.7
1.6
1.5
1.5
1.5
1.4
1.4
1.6
1.4
1.4
1.4
1.7
Te
xtile
s,
we
arin
g a
pp
are
l a
nd
lea
the
r p
rod
ucts
3.3
Pro
du
k k
ayu
, p
era
bo
t, k
elu
ara
n
ke
rta
s,
pe
rce
taka
n d
an
pe
ne
rbita
n
6.1
6.1
5.8
6.1
6.4
6.1
5.9
6.0
6.4
6.1
5.9
6.2
6.0
5.7
5.5
5.8
5.8
Wo
od
pro
du
cts
, fu
rnitu
re,
pa
pe
r p
rod
ucts
, p
rin
tin
g a
nd
pu
blis
hin
g
3.4
Pro
du
k p
etr
ole
um
, kim
ia,
ge
tah
da
n p
lastik
34
.03
4.9
34
.13
3.0
32
.53
5.1
35
.23
4.8
34
.53
5.1
35
.03
3.5
33
.43
5.2
34
.43
2.8
30
.9P
etr
ole
um
, ch
em
ica
l, r
ub
be
r
an
d p
lastic p
rod
ucts
3.5
Pro
du
k m
ine
ral b
uka
n lo
ga
m,
log
am
asa
s d
an
pro
du
k lo
ga
m
ya
ng
dir
eka
13
.01
3.1
13
.11
2.8
14
.31
2.9
12
.11
2.6
13
.71
3.3
12
.61
3.2
14
.41
2.9
11
.91
2.4
14
.0N
on
-me
talli
c m
ine
ral
pro
du
cts
, b
asic
me
tal a
nd
fab
rica
ted
me
tal p
rod
ucts
3.6
Pro
du
k e
lektr
ik d
an
ele
ktr
on
ik
2
1.0
20
.72
0.9
24
.22
0.5
20
.01
9.3
23
.12
0.3
20
.01
9.4
23
.42
0.1
20
.22
0.2
24
.52
1.0
Ele
ctr
ica
l a
nd
ele
ctr
on
ic
pro
du
cts
3.7
Pe
rala
tan
pe
ng
an
gku
tan
da
n
pe
mb
ua
tan
la
in
10
.81
1.1
12
.11
0.0
10
.11
0.6
12
.31
0.1
10
.51
0.8
13
.01
0.5
11
.91
1.7
14
.01
0.9
12
.9T
ran
sp
ort
equ
ipm
en
t a
nd
oth
er
ma
nu
factu
res
4.
10
0.0
10
0.0
10
0.0
10
0.0
10
0.0
10
0.0
10
0.0
10
0.0
10
0.0
10
0.0
10
0.0
10
0.0
10
0.0
10
0.0
10
0.0
10
0.0
10
0.0
Co
ns
tru
cti
on
5.
10
0.0
10
0.0
10
0.0
10
0.0
10
0.0
10
0.0
10
0.0
10
0.0
10
0.0
10
0.0
10
0.0
10
0.0
10
0.0
10
0.0
10
0.0
10
0.0
10
0.0
Se
rvic
es
5.1
Ele
ktr
ik d
an
ga
s
3.9
3.9
3.8
3.8
3.9
3.9
3.8
3.9
3.9
3.8
3.7
3.9
4.0
3.8
3.7
4.0
4.2
Ele
ctr
icity a
nd
ga
s
5.2
Air
0.8
0.8
0.8
0.8
0.8
0.8
0.8
0.8
0.8
0.8
0.8
0.8
0.8
0.8
0.7
0.8
0.8
Wa
ter
5.3
Pe
rda
ga
ng
an
bo
ron
g
12
.81
2.4
12
.41
1.8
12
.81
3.4
13
.21
2.1
12
.61
2.9
12
.21
1.8
12
.31
2.8
12
.71
2.3
12
.9W
ho
lesa
le t
rad
e
5.4
Pe
rda
ga
ng
an
ru
ncit
1
1.6
11
.41
1.8
11
.41
1.0
11
.61
2.2
11
.51
1.0
11
.31
1.8
11
.71
1.4
11
.71
2.5
12
.41
2.0
Re
tail
tra
de
5.5
Ke
nd
era
an
be
rmo
tor
3.3
3.2
3.1
3.2
3.0
3.6
3.2
3.1
3.0
3.5
3.1
3.0
2.8
3.5
3.0
2.9
2.9
Mo
tor
ve
hic
les
5.6
Re
sto
ran
4
.14
.14
.24
.14
.04
.14
.24
.14
.14
.04
.24
.34
.24
.14
.34
.44
.3R
esta
ura
nts
5.7
Pe
ng
ina
pa
n1
.31
.21
.21
.31
.31
.41
.31
.21
.21
.31
.21
.21
.21
.31
.21
.21
.2A
cco
mm
od
atio
n
5.8
Pe
ng
an
gku
tan
da
n
pe
nyim
pa
na
n
6
.56
.46
.36
.76
.56
.56
.46
.66
.36
.36
.26
.56
.36
.26
.16
.46
.2T
ran
sp
ort
an
d s
tora
ge
5.9
Ko
mu
nik
asi
6.2
6.3
6.4
6.3
6.3
6.3
6.1
6.3
6.3
6.3
6.2
6.5
6.5
6.5
6.3
6.6
6.7
Co
mm
un
ica
tio
n
5.1
0K
ew
an
ga
n
11
.31
1.1
10
.71
1.7
12
.11
0.8
10
.91
1.0
11
.51
1.0
10
.91
0.7
11
.01
0.7
10
.41
0.3
10
.3F
ina
nce
5.1
1In
su
ran
s
3.5
3.7
3.6
3.6
3.4
3.5
3.4
3.5
3.7
3.8
3.9
3.9
3.6
3.5
3.5
3.7
3.4
Insu
ran
ce
5.1
2H
art
an
ah
da
n p
erk
hid
ma
tan
pe
rnia
ga
an
9.9
9.9
10
.11
0.2
10
.29
.79
.51
0.2
10
.29
.79
.51
0.3
10
.49
.99
.61
0.4
10
.5R
ea
l e
sta
te a
nd
bu
sin
ess
se
rvic
es
5.1
3P
erk
hid
ma
tan
la
in9
.18
.88
.89
.39
.29
.18
.89
.18
.98
.78
.59
.09
.08
.78
.48
.88
.8O
the
r se
rvic
es
5.1
4P
erk
hid
ma
tan
ke
raja
an
15
.71
6.9
16
.71
5.7
15
.51
5.3
16
.21
6.6
16
.41
6.6
17
.81
6.3
16
.41
6.6
17
.51
5.9
15
.8G
ove
rnm
en
t se
rvic
es
6.
10
0.0
10
0.0
10
0.0
10
0.0
10
0.0
10
0.0
10
0.0
10
0.0
10
0.0
10
0.0
10
0.0
10
0.0
10
0.0
10
0.0
10
0.0
10
0.0
10
0.0
plu
s Im
po
rt d
uti
es
Jad
ual 11A
: K
DN
K m
en
gik
ut
Jen
is A
kti
vit
i E
ko
no
mi p
ad
a H
arg
a S
em
asa -
Pem
bah
ag
ian
pera
tus k
ep
ad
a S
ekto
rT
ab
le 1
1A
: G
DP
by K
ind
of
Eco
no
mic
Acti
vit
y a
t C
urr
en
t P
rices -
Perc
en
tag
e s
hare
to
Secto
r
2011
Kin
d o
f eco
no
mic
acti
vit
y2012
Jen
is a
kti
vit
i eko
no
mi
2013
2011
2012
e2013
p2014
Pe
mb
ina
an
Pe
rkh
idm
ata
n
ca
mp
ur
Du
ti i
mp
ort
30
Pe
rta
nia
n
Pe
rlo
mb
on
ga
n d
an
pe
ng
ku
ari
an
Pe
mb
ua
tan

III
III
IVI
IIII
IIV
III
III
IVI
II
1.
10
0.0
10
0.0
10
0.0
10
0.0
10
0.0
10
0.0
10
0.0
10
0.0
10
0.0
10
0.0
10
0.0
10
0.0
10
0.0
10
0.0
10
0.0
10
0.0
10
0.0
Ag
ric
ult
ure
1.1
Ge
tah
8.8
8.0
7.0
10
.57
.98
.58
.49
.18
.26
.98
.08
.56
.16
.86
.87
.34
.9R
ub
be
r
1.2
Ke
lap
a s
aw
it3
7.0
36
.43
6.6
31
.93
8.6
37
.43
9.5
32
.13
3.3
37
.64
1.7
34
.73
3.5
36
.64
1.1
34
.43
6.0
Oil
pa
lm
1.3
Te
rna
ka
n1
0.8
11
.61
2.4
11
.51
0.7
10
.41
0.9
12
.31
1.9
10
.91
1.3
12
.31
2.8
11
.91
2.5
13
.01
2.7
Liv
esto
ck
1.4
Pe
rta
nia
n la
in1
7.2
18
.11
9.2
18
.71
6.9
16
.81
6.4
19
.21
9.4
18
.01
6.0
19
.22
1.5
19
.11
7.1
20
.32
1.5
Oth
er
ag
ricu
ltu
re
1.5
Pe
rhu
tan
an
da
n p
em
ba
laka
n1
1.9
11
.21
0.1
12
.11
2.0
11
.91
1.6
12
.61
2.5
10
.59
.51
0.4
11
.29
.69
.41
0.1
11
.1F
ore
str
y a
nd
lo
gg
ing
1.6
Pe
rika
na
n la
ut
9.2
9.4
9.4
9.8
8.9
9.7
8.5
9.4
9.3
10
.28
.69
.59
.41
0.4
8.3
9.7
8.6
Ma
rin
e f
ish
ing
1.7
Aku
aku
ltu
r 5
.15
.45
.35
.44
.95
.34
.75
.35
.45
.84
.95
.45
.45
.64
.75
.25
.3A
qu
acu
ltu
re
2.
10
0.0
10
0.0
10
0.0
10
0.0
10
0.0
10
0.0
10
0.0
10
0.0
10
0.0
10
0.0
10
0.0
10
0.0
10
0.0
10
0.0
10
0.0
10
0.0
10
0.0
Min
ing
an
d q
ua
rry
ing
3.
10
0.0
10
0.0
10
0.0
10
0.0
10
0.0
10
0.0
10
0.0
10
0.0
10
0.0
10
0.0
10
0.0
10
0.0
10
0.0
10
0.0
10
0.0
10
0.0
10
0.0
Ma
nu
fac
turi
ng
3.1
Ma
ka
na
n,
min
um
an
da
n
tem
ba
ka
u
11
.01
0.9
10
.69
.61
1.7
11
.51
1.4
10
.11
1.3
11
.41
1.0
10
.21
0.9
11
.01
0.4
9.9
11
.3F
oo
d,
be
ve
rag
es a
nd
tob
acco
3.2
Pro
du
k t
ekstil, p
aka
ian
da
n
ku
lit
2.0
1.7
1.7
2.1
2.0
1.9
1.8
1.8
1.8
1.7
1.6
1.7
1.8
1.6
1.7
1.7
2.0
Te
xtile
s,
we
arin
g a
pp
are
l a
nd
lea
the
r p
rod
ucts
3.3
Pro
du
k k
ayu
, p
era
bo
t, k
elu
ara
n
ke
rta
s,
pe
rce
taka
n d
an
pe
ne
rbita
n
6.2
6.1
5.9
6.3
6.4
6.1
5.8
6.0
6.4
6.1
5.9
6.1
6.0
5.7
5.6
5.9
5.9
Wo
od
pro
du
cts
, fu
rnitu
re,
pa
pe
r p
rod
ucts
, p
rin
tin
g a
nd
pu
blis
hin
g
3.4
Pro
du
k p
etr
ole
um
, kim
ia,
ge
tah
da
n p
lastik
29
.62
9.9
29
.42
9.3
28
.43
0.5
30
.32
9.7
29
.33
0.2
30
.22
8.9
28
.93
0.7
29
.12
7.9
26
.6P
etr
ole
um
, ch
em
ica
l, r
ub
be
r
an
d p
lastic p
rod
ucts
3.5
Pro
du
k m
ine
ral b
uka
n lo
ga
m,
log
am
asa
s d
an
pro
du
k lo
ga
m
ya
ng
dir
eka
13
.01
3.4
13
.31
2.3
14
.41
3.1
12
.31
2.7
14
.21
3.8
12
.81
3.0
14
.61
3.3
12
.31
2.6
14
.2N
on
-me
talli
c m
ine
ral
pro
du
cts
, b
asic
me
tal a
nd
fab
rica
ted
me
tal p
rod
ucts
3.6
Pro
du
k e
lektr
ik d
an
ele
ktr
on
ik
2
5.1
24
.52
4.5
28
.52
4.8
24
.02
3.4
27
.42
4.3
23
.72
2.9
27
.42
3.5
23
.62
3.9
28
.72
4.4
Ele
ctr
ica
l a
nd
ele
ctr
on
ic
pro
du
cts
3.7
Pe
rala
tan
pe
ng
an
gku
tan
da
n
pe
mb
ua
tan
la
in
13
.11
3.5
14
.51
1.9
12
.41
2.9
15
.01
2.3
12
.81
3.0
15
.61
2.6
14
.21
4.0
17
.01
3.3
15
.6T
ran
sp
ort
equ
ipm
en
t a
nd
oth
er
ma
nu
factu
res
4.
10
0.0
10
0.0
10
0.0
10
0.0
10
0.0
10
0.0
10
0.0
10
0.0
10
0.0
10
0.0
10
0.0
10
0.0
10
0.0
10
0.0
10
0.0
10
0.0
10
0.0
Co
ns
tru
cti
on
5.
10
0.0
10
0.0
10
0.0
10
0.0
10
0.0
10
0.0
10
0.0
10
0.0
10
0.0
10
0.0
10
0.0
10
0.0
10
0.0
10
0.0
10
0.0
10
0.0
10
0.0
Se
rvic
es
5.1
Ele
ktr
ik d
an
ga
s
3.9
3.8
3.7
3.9
4.0
3.9
3.7
3.9
3.9
3.8
3.6
3.8
3.9
3.7
3.6
3.7
3.7
Ele
ctr
icity a
nd
ga
s
5.2
Air
0.8
0.8
0.8
0.9
0.9
0.8
0.8
0.9
0.8
0.8
0.8
0.8
0.8
0.8
0.8
0.8
0.8
Wa
ter
5.3
Pe
rda
ga
ng
an
bo
ron
g
11
.41
1.1
11
.11
0.4
11
.51
2.1
11
.71
0.6
11
.21
1.6
11
.01
0.5
11
.21
1.5
11
.11
0.6
11
.4W
ho
lesa
le t
rad
e
5.4
Pe
rda
ga
ng
an
ru
ncit
1
1.5
11
.41
1.7
11
.31
1.1
11
.41
2.0
11
.61
1.1
11
.21
1.7
11
.61
1.4
11
.41
2.1
12
.11
1.8
Re
tail
tra
de
5.5
Ke
nd
era
an
be
rmo
tor
3.5
3.5
3.4
3.5
3.2
3.8
3.5
3.3
3.3
3.8
3.4
3.2
3.1
3.8
3.3
3.1
3.2
Mo
tor
ve
hic
les
5.6
Re
sto
ran
3
.33
.33
.33
.33
.33
.33
.43
.33
.33
.23
.33
.43
.33
.23
.43
.43
.3R
esta
ura
nts
5.7
Pe
ng
ina
pa
n1
.21
.21
.21
.21
.21
.31
.21
.21
.21
.21
.21
.21
.21
.21
.11
.11
.1A
cco
mm
od
atio
n
5.8
Pe
ng
an
gku
tan
da
n
pe
nyim
pa
na
n
6
.86
.76
.66
.96
.76
.86
.76
.96
.76
.66
.56
.86
.66
.56
.56
.76
.5T
ran
sp
ort
an
d s
tora
ge
5.9
Ko
mu
nik
asi
6.9
7.1
7.4
6.9
7.0
7.0
6.8
7.2
7.2
7.1
6.9
7.4
7.5
7.4
7.2
7.6
7.8
Co
mm
un
ica
tio
n
5.1
0K
ew
an
ga
n
13
.31
3.2
12
.71
3.7
13
.61
3.0
13
.01
3.1
13
.31
3.3
13
.11
2.8
12
.61
2.8
12
.61
2.3
11
.9F
ina
nce
5.1
1In
su
ran
s
3.7
4.0
3.9
3.8
3.6
3.8
3.7
3.7
4.0
4.2
4.3
4.1
3.8
3.8
3.8
4.0
3.6
Insu
ran
ce
5.1
2H
art
an
ah
da
n p
erk
hid
ma
tan
pe
rnia
ga
an
10
.01
0.1
10
.31
0.3
10
.49
.89
.71
0.5
10
.49
.89
.71
0.5
10
.61
0.0
9.9
10
.71
0.8
Re
al e
sta
te a
nd
bu
sin
ess
se
rvic
es
5.1
3P
erk
hid
ma
tan
la
in9
.49
.29
.19
.69
.69
.39
.09
.59
.39
.08
.89
.49
.49
.08
.79
.29
.2O
the
r se
rvic
es
5.1
4P
erk
hid
ma
tan
ke
raja
an
14
.21
4.6
15
.01
4.2
14
.11
3.8
14
.81
4.4
14
.31
4.3
15
.51
4.5
14
.61
4.8
15
.81
4.7
14
.7G
ove
rnm
en
t se
rvic
es
6.
10
0.0
10
0.0
10
0.0
10
0.0
10
0.0
10
0.0
10
0.0
10
0.0
10
0.0
10
0.0
10
0.0
10
0.0
10
0.0
10
0.0
10
0.0
10
0.0
10
0.0
plu
s Im
po
rt d
uti
es
Ja
du
al 1
1B
: K
DN
K m
en
gik
ut
Je
nis
Ak
tivit
i E
ko
no
mi p
ad
a H
arg
a M
ala
r 2
00
5 -
Pe
mb
ah
ag
ian
pe
ratu
s k
ep
ad
a S
ek
tor
Ta
ble
11
B:
GD
P b
y K
ind
of
Ec
on
om
ic A
cti
vit
y a
t C
on
sta
nt
20
05
Pri
ce
s -
Pe
rce
nta
ge
sh
are
to
Se
cto
r
2011
Kin
d o
f eco
no
mic
acti
vit
y2012
Jen
is a
kti
vit
i eko
no
mi
2013
2011
2012
e2013
p2014
31
Pe
rta
nia
n
Pe
rlo
mb
on
ga
n d
an
pe
ng
ku
ari
an
Pe
mb
ua
tan
Pe
mb
ina
an
Pe
rkh
idm
ata
n
ca
mp
ur
Du
ti i
mp
ort
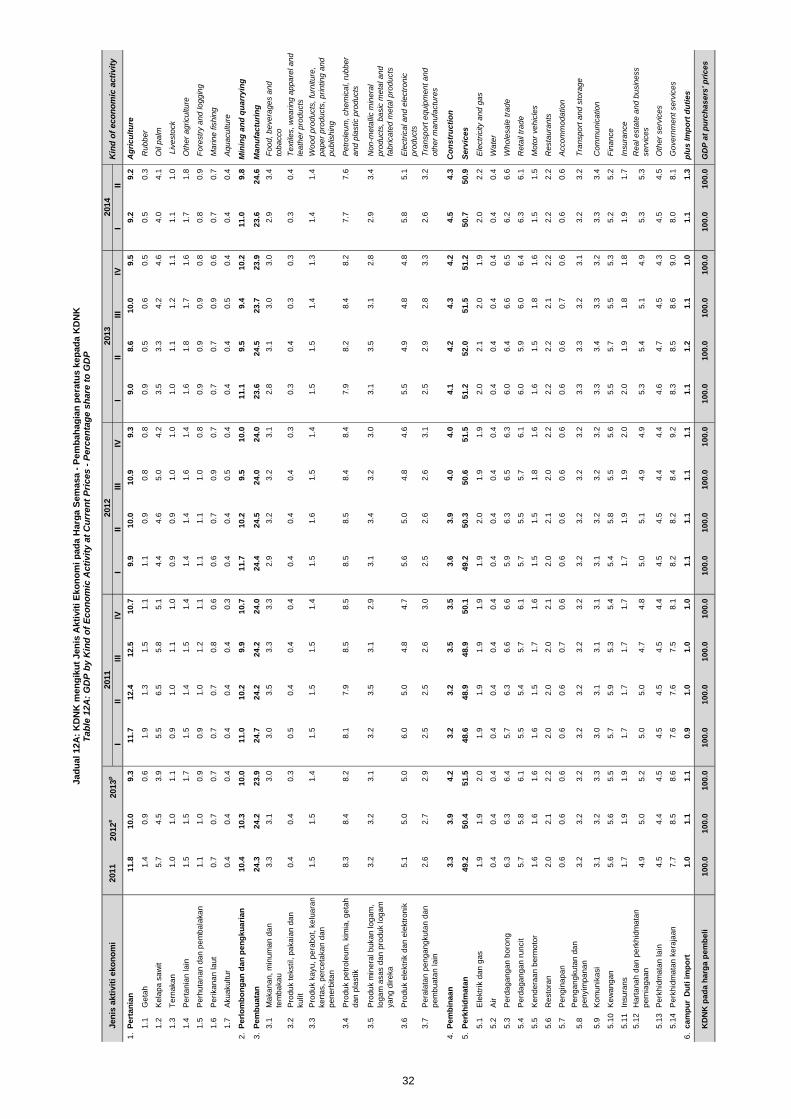
III
III
IVI
IIII
IIV
III
III
IVI
II
1.
11
.81
0.0
9.3
11
.71
2.4
12
.51
0.7
9.9
10
.01
0.9
9.3
9.0
8.6
10
.09
.59
.29
.2A
gri
cu
ltu
re
1.1
Ge
tah
1.4
0.9
0.6
1.9
1.3
1.5
1.1
1.1
0.9
0.8
0.8
0.9
0.5
0.6
0.5
0.5
0.3
Ru
bb
er
1.2
Ke
lap
a s
aw
it5
.74
.53
.95
.56
.55
.85
.14
.44
.65
.04
.23
.53
.34
.24
.64
.04
.1O
il p
alm
1.3
Te
rna
ka
n1
.01
.01
.10
.91
.01
.11
.00
.90
.91
.01
.01
.01
.11
.21
.11
.11
.0 L
ive
sto
ck
1.4
Pe
rta
nia
n la
in1
.51
.51
.71
.51
.41
.51
.41
.41
.41
.61
.41
.61
.81
.71
.61
.71
.8O
the
r a
gricu
ltu
re
1.5
Pe
rhu
tan
an
da
n p
em
ba
laka
n1
.11
.00
.90
.91
.01
.21
.11
.11
.11
.00
.80
.90
.90
.90
.80
.80
.9F
ore
str
y a
nd
lo
gg
ing
1.6
Pe
rika
na
n la
ut
0.7
0.7
0.7
0.7
0.7
0.8
0.6
0.6
0.7
0.9
0.7
0.7
0.7
0.9
0.6
0.7
0.7
Ma
rin
e f
ish
ing
1.7
Aku
aku
ltu
r 0
.40
.40
.40
.40
.40
.40
.30
.40
.40
.50
.40
.40
.40
.50
.40
.40
.4A
qu
acu
ltu
re
2.
10
.41
0.3
10
.01
1.0
10
.29
.91
0.7
11
.71
0.2
9.5
10
.01
1.1
9.5
9.4
10
.21
1.0
9.8
Min
ing
an
d q
ua
rry
ing
3.
24
.32
4.2
23
.92
4.7
24
.22
4.2
24
.02
4.4
24
.52
4.0
24
.02
3.6
24
.52
3.7
23
.92
3.6
24
.6M
an
ufa
ctu
rin
g
3.1
Ma
ka
na
n,
min
um
an
da
n
tem
ba
ka
u
3.3
3.1
3.0
3.0
3.5
3.3
3.3
2.9
3.2
3.2
3.1
2.8
3.1
3.0
3.0
2.9
3.4
Fo
od
, b
eve
rag
es a
nd
tob
acco
3.2
Pro
du
k t
ekstil, p
aka
ian
da
n
ku
lit
0.4
0.4
0.3
0.5
0.4
0.4
0.4
0.4
0.4
0.4
0.3
0.3
0.4
0.3
0.3
0.3
0.4
Te
xtile
s,
we
arin
g a
pp
are
l a
nd
lea
the
r p
rod
ucts
3.3
Pro
du
k k
ayu
, p
era
bo
t, k
elu
ara
n
ke
rta
s,
pe
rce
taka
n d
an
pe
ne
rbita
n
1.5
1.5
1.4
1.5
1.5
1.5
1.4
1.5
1.6
1.5
1.4
1.5
1.5
1.4
1.3
1.4
1.4
Wo
od
pro
du
cts
, fu
rnitu
re,
pa
pe
r p
rod
ucts
, p
rin
tin
g a
nd
pu
blis
hin
g
3.4
Pro
du
k p
etr
ole
um
, kim
ia,
ge
tah
da
n p
lastik
8.3
8.4
8.2
8.1
7.9
8.5
8.5
8.5
8.5
8.4
8.4
7.9
8.2
8.4
8.2
7.7
7.6
Pe
tro
leu
m,
ch
em
ica
l, r
ub
be
r
an
d p
lastic p
rod
ucts
3.5
Pro
du
k m
ine
ral b
uka
n lo
ga
m,
log
am
asa
s d
an
pro
du
k lo
ga
m
ya
ng
dir
eka
3.2
3.2
3.1
3.2
3.5
3.1
2.9
3.1
3.4
3.2
3.0
3.1
3.5
3.1
2.8
2.9
3.4
No
n-m
eta
llic m
ine
ral
pro
du
cts
, b
asic
me
tal a
nd
fab
rica
ted
me
tal p
rod
ucts
3.6
Pro
du
k e
lektr
ik d
an
ele
ktr
on
ik
5
.15
.05
.06
.05
.04
.84
.75
.65
.04
.84
.65
.54
.94
.84
.85
.85
.1E
lectr
ica
l a
nd
ele
ctr
on
ic
pro
du
cts
3.7
Pe
rala
tan
pe
ng
an
gku
tan
da
n
pe
mb
ua
tan
la
in
2.6
2.7
2.9
2.5
2.5
2.6
3.0
2.5
2.6
2.6
3.1
2.5
2.9
2.8
3.3
2.6
3.2
Tra
nsp
ort
equ
ipm
en
t a
nd
oth
er
ma
nu
factu
res
4.
3.3
3.9
4.2
3.2
3.2
3.5
3.5
3.6
3.9
4.0
4.0
4.1
4.2
4.3
4.2
4.5
4.3
Co
ns
tru
cti
on
5.
49
.25
0.4
51
.54
8.6
48
.94
8.9
50
.14
9.2
50
.35
0.6
51
.55
1.2
52
.05
1.5
51
.25
0.7
50
.9S
erv
ice
s
5.1
Ele
ktr
ik d
an
ga
s
1.9
1.9
2.0
1.9
1.9
1.9
1.9
1.9
2.0
1.9
1.9
2.0
2.1
2.0
1.9
2.0
2.2
Ele
ctr
icity a
nd
ga
s
5.2
Air
0.4
0.4
0.4
0.4
0.4
0.4
0.4
0.4
0.4
0.4
0.4
0.4
0.4
0.4
0.4
0.4
0.4
Wa
ter
5.3
Pe
rda
ga
ng
an
bo
ron
g
6.3
6.3
6.4
5.7
6.3
6.6
6.6
5.9
6.3
6.5
6.3
6.0
6.4
6.6
6.5
6.2
6.6
Wh
ole
sa
le t
rad
e
5.4
Pe
rda
ga
ng
an
ru
ncit
5
.75
.86
.15
.55
.45
.76
.15
.75
.55
.76
.16
.05
.96
.06
.46
.36
.1R
eta
il tr
ad
e
5.5
Ke
nd
era
an
be
rmo
tor
1.6
1.6
1.6
1.6
1.5
1.7
1.6
1.5
1.5
1.8
1.6
1.6
1.5
1.8
1.6
1.5
1.5
Mo
tor
ve
hic
les
5.6
Re
sto
ran
2
.02
.12
.22
.02
.02
.02
.12
.02
.12
.02
.22
.22
.22
.12
.22
.22
.2R
esta
ura
nts
5.7
Pe
ng
ina
pa
n0
.60
.60
.60
.60
.60
.70
.60
.60
.60
.60
.60
.60
.60
.70
.60
.60
.6A
cco
mm
od
atio
n
5.8
Pe
ng
an
gku
tan
da
n
pe
nyim
pa
na
n
3
.23
.23
.23
.23
.23
.23
.23
.23
.23
.23
.23
.33
.33
.23
.13
.23
.2T
ran
sp
ort
an
d s
tora
ge
5.9
Ko
mu
nik
asi
3.1
3.2
3.3
3.0
3.1
3.1
3.1
3.1
3.2
3.2
3.2
3.3
3.4
3.3
3.2
3.3
3.4
Co
mm
un
ica
tio
n
5.1
0K
ew
an
ga
n
5.6
5.6
5.5
5.7
5.9
5.3
5.4
5.4
5.8
5.5
5.6
5.5
5.7
5.5
5.3
5.2
5.2
Fin
an
ce
5.1
1In
su
ran
s
1.7
1.9
1.9
1.7
1.7
1.7
1.7
1.7
1.9
1.9
2.0
2.0
1.9
1.8
1.8
1.9
1.7
Insu
ran
ce
5.1
2H
art
an
ah
da
n p
erk
hid
ma
tan
pe
rnia
ga
an
4.9
5.0
5.2
5.0
5.0
4.7
4.8
5.0
5.1
4.9
4.9
5.3
5.4
5.1
4.9
5.3
5.3
Re
al e
sta
te a
nd
bu
sin
ess
se
rvic
es
5.1
3P
erk
hid
ma
tan
la
in4
.54
.44
.54
.54
.54
.54
.44
.54
.54
.44
.44
.64
.74
.54
.34
.54
.5O
the
r se
rvic
es
5.1
4P
erk
hid
ma
tan
ke
raja
an
7.7
8.5
8.6
7.6
7.6
7.5
8.1
8.2
8.2
8.4
9.2
8.3
8.5
8.6
9.0
8.0
8.1
Go
ve
rnm
en
t se
rvic
es
6.
1.0
1.1
1.1
0.9
1.0
1.0
1.0
1.1
1.1
1.1
1.1
1.1
1.2
1.1
1.0
1.1
1.3
plu
s Im
po
rt d
uti
es
10
0.0
10
0.0
10
0.0
10
0.0
10
0.0
10
0.0
10
0.0
10
0.0
10
0.0
10
0.0
10
0.0
10
0.0
10
0.0
10
0.0
10
0.0
10
0.0
10
0.0
GD
P a
t p
urc
ha
se
rs' p
ric
es
Jad
ual 12A
: K
DN
K m
en
gik
ut
Jen
is A
kti
vit
i E
ko
no
mi p
ad
a H
arg
a S
em
asa -
Pem
bah
ag
ian
pera
tus k
ep
ad
a K
DN
KT
ab
le 1
2A
: G
DP
by K
ind
of
Eco
no
mic
Acti
vit
y a
t C
urr
en
t P
rices -
Perc
en
tag
e s
hare
to
GD
P
2011
Kin
d o
f eco
no
mic
acti
vit
y2011
2012
e2012
Jen
is a
kti
vit
i eko
no
mi
2013
p2013
2014
KD
NK
pa
da
ha
rga
pe
mb
eli
Pe
mb
ina
an
Pe
rkh
idm
ata
n
ca
mp
ur
Du
ti i
mp
ort
32
Pe
rta
nia
n
Pe
rlo
mb
on
ga
n d
an
pe
ng
ku
ari
an
Pe
mb
ua
tan

III
III
IVI
IIII
IIV
III
III
IVI
II
1.
7.6
7.3
7.1
7.1
7.7
8.3
7.4
6.9
7.0
8.0
7.3
7.0
6.7
7.7
7.0
6.8
6.7
Ag
ric
ult
ure
1.1
Ge
tah
0.7
0.6
0.5
0.7
0.6
0.7
0.6
0.6
0.6
0.6
0.6
0.6
0.4
0.5
0.5
0.5
0.3
Ru
bb
er
1.2
Ke
lap
a s
aw
it2
.82
.72
.62
.33
.03
.12
.92
.22
.33
.03
.12
.42
.22
.82
.92
.32
.4O
il p
alm
1.3
Te
rna
ka
n0
.80
.80
.90
.80
.80
.90
.80
.80
.80
.90
.80
.90
.90
.90
.90
.90
.9 L
ive
sto
ck
1.4
Pe
rta
nia
n la
in1
.31
.31
.41
.31
.31
.41
.21
.31
.41
.41
.21
.41
.41
.51
.21
.41
.4O
the
r a
gricu
ltu
re
1.5
Pe
rhu
tan
an
da
n p
em
ba
laka
n0
.90
.80
.70
.90
.91
.00
.90
.90
.90
.80
.70
.70
.80
.70
.70
.70
.7F
ore
str
y a
nd
lo
gg
ing
1.6
Pe
rika
na
n la
ut
0.7
0.7
0.7
0.7
0.7
0.8
0.6
0.7
0.6
0.8
0.6
0.7
0.6
0.8
0.6
0.7
0.6
Ma
rin
e f
ish
ing
1.7
Aku
aku
ltu
r 0
.40
.40
.40
.40
.40
.40
.30
.40
.40
.50
.40
.40
.40
.40
.30
.40
.4A
qu
acu
ltu
re
2.
8.8
8.4
8.1
9.8
8.5
8.4
8.5
9.3
8.2
7.8
8.4
8.8
8.2
7.6
7.9
8.2
7.9
Min
ing
an
d q
ua
rry
ing
3.
25
.02
4.8
24
.52
5.3
25
.22
4.9
24
.72
5.1
25
.22
4.5
24
.52
4.2
25
.12
4.3
24
.52
4.4
25
.3M
an
ufa
ctu
rin
g
3.1
Ma
ka
na
n,
min
um
an
da
n
tem
ba
ka
u
2.8
2.7
2.6
2.4
2.9
2.9
2.8
2.5
2.8
2.8
2.7
2.5
2.7
2.7
2.5
2.4
2.8
Fo
od
, b
eve
rag
es a
nd
tob
acco
3.2
Pro
du
k t
ekstil, p
aka
ian
da
n
ku
lit
0.5
0.4
0.4
0.5
0.5
0.5
0.4
0.5
0.4
0.4
0.4
0.4
0.5
0.4
0.4
0.4
0.5
Te
xtile
s,
we
arin
g a
pp
are
l a
nd
lea
the
r p
rod
ucts
3.3
Pro
du
k k
ayu
, p
era
bo
t, k
elu
ara
n
ke
rta
s,
pe
rce
taka
n d
an
pe
ne
rbita
n
1.5
1.5
1.4
1.6
1.6
1.5
1.4
1.5
1.6
1.5
1.4
1.5
1.5
1.4
1.4
1.4
1.5
Wo
od
pro
du
cts
, fu
rnitu
re,
pa
pe
r p
rod
ucts
, p
rin
tin
g a
nd
pu
blis
hin
g
3.4
Pro
du
k p
etr
ole
um
, kim
ia,
ge
tah
da
n p
lastik
7.4
7.4
7.2
7.4
7.2
7.6
7.5
7.5
7.4
7.4
7.4
7.0
7.2
7.5
7.2
6.8
6.7
Pe
tro
leu
m,
ch
em
ica
l, r
ub
be
r
an
d p
lastic p
rod
ucts
3.5
Pro
du
k m
ine
ral b
uka
n lo
ga
m,
log
am
asa
s d
an
pro
du
k lo
ga
m
ya
ng
dir
eka
3.3
3.3
3.3
3.1
3.6
3.3
3.0
3.2
3.6
3.4
3.1
3.2
3.7
3.2
3.0
3.1
3.6
No
n-m
eta
llic m
ine
ral
pro
du
cts
, b
asic
me
tal a
nd
fab
rica
ted
me
tal p
rod
ucts
3.6
Pro
du
k e
lektr
ik d
an
ele
ktr
on
ik
6
.36
.16
.07
.26
.26
.05
.86
.96
.15
.85
.66
.65
.95
.75
.97
.06
.2E
lectr
ica
l a
nd
ele
ctr
on
ic
pro
du
cts
3.7
Pe
rala
tan
pe
ng
an
gku
tan
da
n
pe
mb
ua
tan
la
in
3.3
3.3
3.6
3.0
3.1
3.2
3.7
3.1
3.2
3.2
3.8
3.1
3.6
3.4
4.2
3.2
3.9
Tra
nsp
ort
equ
ipm
en
t a
nd
oth
er
ma
nu
factu
res
4.
3.2
3.5
3.8
3.0
3.1
3.2
3.3
3.3
3.5
3.7
3.6
3.7
3.7
3.8
3.8
4.1
3.9
Co
ns
tru
cti
on
5.
54
.25
4.6
55
.25
3.8
54
.15
3.8
55
.05
4.0
54
.65
4.6
54
.95
5.0
54
.95
5.1
55
.65
5.2
54
.7S
erv
ice
s
5.1
Ele
ktr
ik d
an
ga
s
2.1
2.1
2.1
2.1
2.2
2.1
2.0
2.1
2.1
2.1
2.0
2.1
2.1
2.0
2.0
2.0
2.0
Ele
ctr
icity a
nd
ga
s
5.2
Air
0.5
0.5
0.4
0.5
0.5
0.5
0.4
0.5
0.5
0.4
0.4
0.5
0.5
0.4
0.4
0.4
0.4
Wa
ter
5.3
Pe
rda
ga
ng
an
bo
ron
g
6.2
6.1
6.1
5.6
6.2
6.5
6.4
5.7
6.1
6.4
6.0
5.8
6.1
6.4
6.2
5.9
6.3
Wh
ole
sa
le t
rad
e
5.4
Pe
rda
ga
ng
an
ru
ncit
6
.26
.26
.46
.16
.06
.16
.66
.36
.16
.16
.46
.46
.36
.36
.86
.76
.5R
eta
il tr
ad
e
5.5
Ke
nd
era
an
be
rmo
tor
1.9
1.9
1.9
1.9
1.7
2.1
1.9
1.8
1.8
2.1
1.9
1.8
1.7
2.1
1.9
1.7
1.7
Mo
tor
ve
hic
les
5.6
Re
sto
ran
1
.81
.81
.81
.81
.81
.81
.91
.81
.81
.81
.81
.91
.81
.81
.91
.91
.8R
esta
ura
nts
5.7
Pe
ng
ina
pa
n0
.70
.70
.60
.70
.70
.70
.70
.70
.70
.70
.70
.60
.60
.70
.60
.60
.6A
cco
mm
od
atio
n
5.8
Pe
ng
an
gku
tan
da
n
pe
nyim
pa
na
n
3
.73
.63
.63
.73
.63
.63
.73
.73
.63
.63
.63
.73
.63
.63
.63
.73
.6T
ran
sp
ort
an
d s
tora
ge
5.9
Ko
mu
nik
asi
3.7
3.9
4.1
3.7
3.8
3.7
3.7
3.9
3.9
3.9
3.8
4.0
4.1
4.1
4.0
4.2
4.2
Co
mm
un
ica
tio
n
5.1
0K
ew
an
ga
n
7.2
7.2
7.0
7.4
7.4
7.0
7.1
7.1
7.2
7.3
7.2
7.0
6.9
7.1
7.0
6.8
6.5
Fin
an
ce
5.1
1In
su
ran
s
2.0
2.2
2.1
2.0
1.9
2.0
2.0
2.0
2.2
2.3
2.3
2.3
2.1
2.1
2.1
2.2
2.0
Insu
ran
ce
5.1
2H
art
an
ah
da
n p
erk
hid
ma
tan
pe
rnia
ga
an
5.4
5.5
5.7
5.6
5.6
5.3
5.3
5.7
5.7
5.4
5.3
5.8
5.8
5.5
5.5
5.9
5.9
Re
al e
sta
te a
nd
bu
sin
ess
se
rvic
es
5.1
3P
erk
hid
ma
tan
la
in5
.15
.05
.05
.25
.25
.05
.05
.15
.14
.94
.95
.25
.14
.94
.95
.15
.0O
the
r se
rvic
es
5.1
4P
erk
hid
ma
tan
ke
raja
an
7.7
8.0
8.3
7.6
7.6
7.4
8.2
7.8
7.8
7.8
8.5
8.0
8.0
8.2
8.8
8.1
8.0
Go
ve
rnm
en
t se
rvic
es
6.
1.2
1.3
1.3
1.1
1.4
1.3
1.1
1.3
1.4
1.4
1.2
1.3
1.4
1.4
1.2
1.3
1.6
plu
s Im
po
rt d
uti
es
10
0.0
10
0.0
10
0.0
10
0.0
10
0.0
10
0.0
10
0.0
10
0.0
10
0.0
10
0.0
10
0.0
10
0.0
10
0.0
10
0.0
10
0.0
10
0.0
10
0.0
GD
P a
t p
urc
ha
se
rs' p
ric
es
Ja
du
al 1
2B
: K
DN
K m
en
gik
ut
Je
nis
Ak
tivit
i E
ko
no
mi p
ad
a H
arg
a M
ala
r 2
00
5 -
Pe
mb
ah
ag
ian
pe
ratu
s k
ep
ad
a K
DN
K
Ta
ble
12
B:
GD
P b
y K
ind
of
Ec
on
om
ic A
cti
vit
y a
t C
on
sta
nt
20
05
Pri
ce
s -
Pe
rce
nta
ge
sh
are
to
GD
P
2011
2011
Kin
d o
f eco
no
mic
acti
vit
y2012
e2012
Jen
is a
kti
vit
i eko
no
mi
2013
p2013
2014
33
KD
NK
pa
da
ha
rga
pe
mb
eli
Pe
rta
nia
n
Pe
rlo
mb
on
ga
n d
an
pe
ng
ku
ari
an
Pe
mb
ua
tan
Pe
mb
ina
an
Pe
rkh
idm
ata
n
ca
mp
ur
Du
ti i
mp
ort
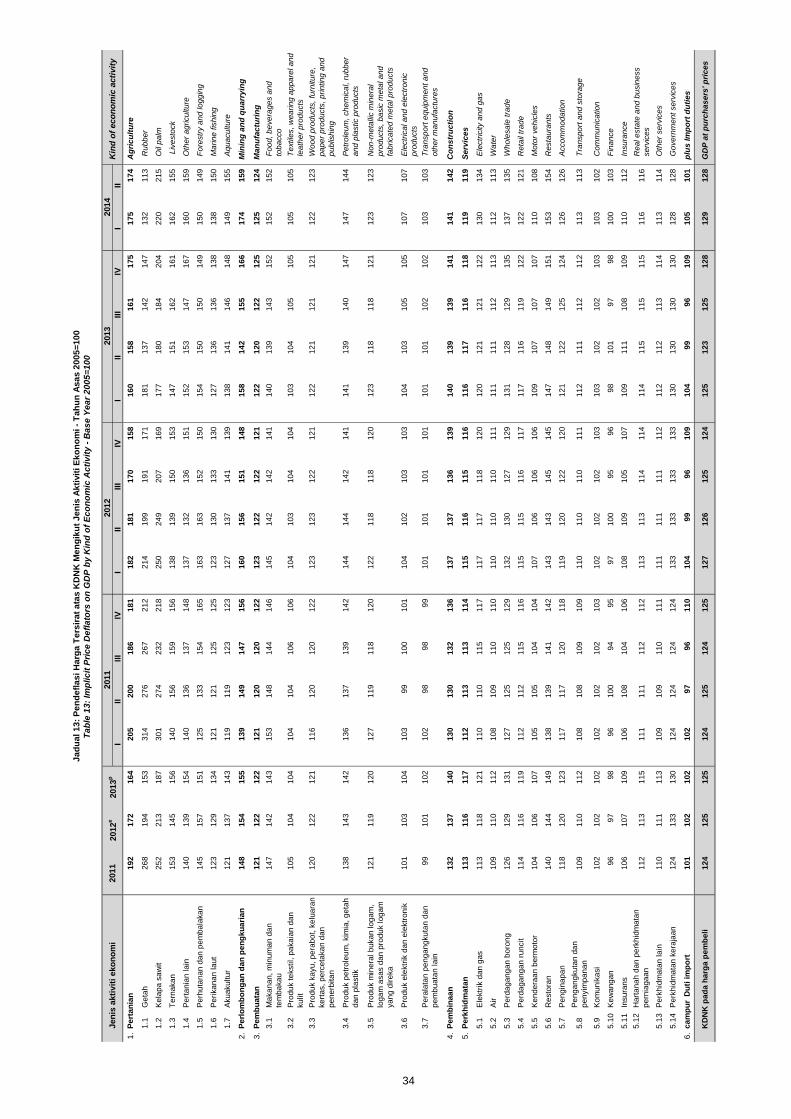
III
III
IVI
IIII
IIV
III
III
IVI
II
1.
19
21
72
16
42
05
20
01
86
18
11
82
18
11
70
15
81
60
15
81
61
17
51
75
17
4A
gri
cu
ltu
re
1.1
Ge
tah
26
81
94
15
33
14
27
62
67
21
22
14
19
91
91
17
11
81
13
71
42
14
71
32
11
3R
ub
be
r
1.2
Ke
lap
a s
aw
it2
52
21
31
87
30
12
74
23
22
18
25
02
49
20
71
69
17
71
80
18
42
04
22
02
15
Oil
pa
lm
1.3
Te
rna
ka
n1
53
14
51
56
14
01
56
15
91
56
13
81
39
15
01
53
14
71
51
16
21
61
16
21
55
Liv
esto
ck
1.4
Pe
rta
nia
n la
in1
40
13
91
54
14
01
36
13
71
48
13
71
32
13
61
51
15
21
53
14
71
67
16
01
59
Oth
er
ag
ricu
ltu
re
1.5
Pe
rhu
tan
an
da
n p
em
ba
laka
n1
45
15
71
51
12
51
33
15
41
65
16
31
63
15
21
50
15
41
50
15
01
49
15
01
49
Fo
restr
y a
nd
lo
gg
ing
1.6
Pe
rika
na
n la
ut
12
31
29
13
41
21
12
11
25
12
51
23
13
01
33
13
01
27
13
61
36
13
81
38
15
0M
arin
e f
ish
ing
1.7
Aku
aku
ltu
r 1
21
13
71
43
11
91
19
12
31
23
12
71
37
14
11
39
13
81
41
14
61
48
14
91
55
Aqu
acu
ltu
re
2.
14
81
54
15
51
39
14
91
47
15
61
60
15
61
51
14
81
58
14
21
55
16
61
74
15
9M
inin
g a
nd
qu
arr
yin
g
3.
12
11
22
12
21
21
12
01
20
12
21
23
12
21
22
12
11
22
12
01
22
12
51
25
12
4M
an
ufa
ctu
rin
g
3.1
Ma
ka
na
n,
min
um
an
da
n
tem
ba
ka
u
14
71
42
14
31
53
14
81
44
14
61
45
14
21
42
14
11
40
13
91
43
15
21
52
15
2F
oo
d,
be
ve
rag
es a
nd
tob
acco
3.2
Pro
du
k t
ekstil, p
aka
ian
da
n
ku
lit
10
51
04
10
41
04
10
41
06
10
61
04
10
31
04
10
41
03
10
41
05
10
51
05
10
5T
extile
s,
we
arin
g a
pp
are
l a
nd
lea
the
r p
rod
ucts
3.3
Pro
du
k k
ayu
, p
era
bo
t, k
elu
ara
n
ke
rta
s,
pe
rce
taka
n d
an
pe
ne
rbita
n
12
01
22
12
11
16
12
01
20
12
21
23
12
31
22
12
11
22
12
11
21
12
11
22
12
3W
oo
d p
rod
ucts
, fu
rnitu
re,
pa
pe
r p
rod
ucts
, p
rin
tin
g a
nd
pu
blis
hin
g
3.4
Pro
du
k p
etr
ole
um
, kim
ia,
ge
tah
da
n p
lastik
13
81
43
14
21
36
13
71
39
14
21
44
14
41
42
14
11
41
13
91
40
14
71
47
14
4P
etr
ole
um
, ch
em
ica
l, r
ub
be
r
an
d p
lastic p
rod
ucts
3.5
Pro
du
k m
ine
ral b
uka
n lo
ga
m,
log
am
asa
s d
an
pro
du
k lo
ga
m
ya
ng
dir
eka
12
11
19
12
01
27
11
91
18
12
01
22
11
81
18
12
01
23
11
81
18
12
11
23
12
3N
on
-me
talli
c m
ine
ral
pro
du
cts
, b
asic
me
tal a
nd
fab
rica
ted
me
tal p
rod
ucts
3.6
Pro
du
k e
lektr
ik d
an
ele
ktr
on
ik
1
01
10
31
04
10
39
91
00
10
11
04
10
21
03
10
31
04
10
31
05
10
51
07
10
7E
lectr
ica
l a
nd
ele
ctr
on
ic
pro
du
cts
3.7
Pe
rala
tan
pe
ng
an
gku
tan
da
n
pe
mb
ua
tan
la
in
99
10
11
02
10
29
89
89
91
01
10
11
01
10
11
01
10
11
02
10
21
03
10
3T
ran
sp
ort
equ
ipm
en
t a
nd
oth
er
ma
nu
factu
res
4.
13
21
37
14
01
30
13
01
32
13
61
37
13
71
36
13
91
40
13
91
39
14
11
41
14
2C
on
str
uc
tio
n
5.
11
31
16
11
71
12
11
31
13
11
41
15
11
61
15
11
61
16
11
71
16
11
81
19
11
9S
erv
ice
s
5.1
Ele
ktr
ik d
an
ga
s
11
31
18
12
11
10
11
01
15
11
71
17
11
71
18
12
01
20
12
11
21
12
21
30
13
4E
lectr
icity a
nd
ga
s
5.2
Air
10
91
10
11
21
08
10
91
10
11
01
10
11
01
10
11
11
11
11
11
12
11
31
12
11
3W
ate
r
5.3
Pe
rda
ga
ng
an
bo
ron
g
12
61
29
13
11
27
12
51
25
12
91
32
13
01
27
12
91
31
12
81
29
13
51
37
13
5W
ho
lesa
le t
rad
e
5.4
Pe
rda
ga
ng
an
ru
ncit
1
14
11
61
19
11
21
12
11
51
16
11
51
15
11
61
17
11
71
16
11
91
22
12
21
21
Re
tail
tra
de
5.5
Ke
nd
era
an
be
rmo
tor
10
41
06
10
71
05
10
51
04
10
41
07
10
61
06
10
61
09
10
71
07
10
71
10
10
8M
oto
r ve
hic
les
5.6
Re
sto
ran
1
40
14
41
49
13
81
39
14
11
42
14
31
43
14
51
45
14
71
48
14
91
51
15
31
54
Re
sta
ura
nts
5.7
Pe
ng
ina
pa
n1
18
12
01
23
11
71
17
12
01
18
11
91
20
12
21
20
12
11
22
12
51
24
12
61
26
Acco
mm
od
atio
n
5.8
Pe
ng
an
gku
tan
da
n
pe
nyim
pa
na
n
1
09
11
01
12
10
81
08
10
91
09
11
01
10
11
01
11
11
21
11
11
21
12
11
31
13
Tra
nsp
ort
an
d s
tora
ge
5.9
Ko
mu
nik
asi
10
21
02
10
21
02
10
21
02
10
31
02
10
21
02
10
31
03
10
21
02
10
31
03
10
2C
om
mu
nic
atio
n
5.1
0K
ew
an
ga
n
96
97
98
96
10
09
49
59
71
00
95
96
98
10
19
79
81
00
10
3F
ina
nce
5.1
1In
su
ran
s
10
61
07
10
91
06
10
81
04
10
61
08
10
91
05
10
71
09
11
11
08
10
91
10
11
2In
su
ran
ce
5.1
2H
art
an
ah
da
n p
erk
hid
ma
tan
pe
rnia
ga
an
11
21
13
11
51
11
11
11
12
11
21
13
11
31
14
11
41
14
11
51
15
11
51
16
11
6R
ea
l e
sta
te a
nd
bu
sin
ess
se
rvic
es
5.1
3P
erk
hid
ma
tan
la
in1
10
11
11
13
10
91
09
11
01
11
11
11
11
11
11
12
11
21
12
11
31
14
11
31
14
Oth
er
se
rvic
es
5.1
4P
erk
hid
ma
tan
ke
raja
an
12
41
33
13
01
24
12
41
24
12
41
33
13
31
33
13
31
30
13
01
30
13
01
28
12
8G
ove
rnm
en
t se
rvic
es
6.
10
11
02
10
21
02
97
96
11
01
04
99
96
10
91
04
99
96
10
91
05
10
1p
lus
Im
po
rt d
uti
es
12
41
25
12
51
24
12
51
24
12
51
27
12
61
25
12
41
25
12
31
25
12
81
29
12
8G
DP
at
pu
rch
as
ers
' p
ric
es
Kin
d o
f eco
no
mic
acti
vit
y
Pe
rta
nia
n
Pe
rlo
mb
on
ga
n d
an
pe
ng
ku
ari
an
Pe
mb
ua
tan
Ja
du
al 1
3:
Pe
nd
efl
as
i H
arg
a T
ers
ira
t a
tas
KD
NK
Me
ng
iku
t J
en
is A
kti
vit
i E
ko
no
mi -
Ta
hu
n A
sa
s 2
00
5=
10
0
Ta
ble
13
: Im
plic
it P
ric
e D
efl
ato
rs o
n G
DP
by
Kin
d o
f E
co
no
mic
Ac
tiv
ity
- B
as
e Y
ea
r 2
00
5=
10
0
2011
2011
2012
e2012
Jen
is a
kti
vit
i eko
no
mi
2013
p2013
2014
34
Pe
mb
ina
an
Pe
rkh
idm
ata
n
ca
mp
ur
Du
ti i
mp
ort
KD
NK
pa
da
ha
rga
pe
mb
eli
SEKSYEN 3:
JADUAL PERBELANJAAN
KDNK MENGIKUT JENIS PERBELANJAAN PADA HARGA SEMASA KDNK MENGIKUT JENIS PERBELANJAAN PADA HARGA MALAR 2005
SECTION 3: EXPENDITURE TABLES
GDP BY TYPE OF EXPENDITURE AT CURRENT PRICES GDP BY TYPE OF EXPENDITURE AT CONSTANT 2005 PRICES

Jadual Perbelanjaan
Expenditure Tables
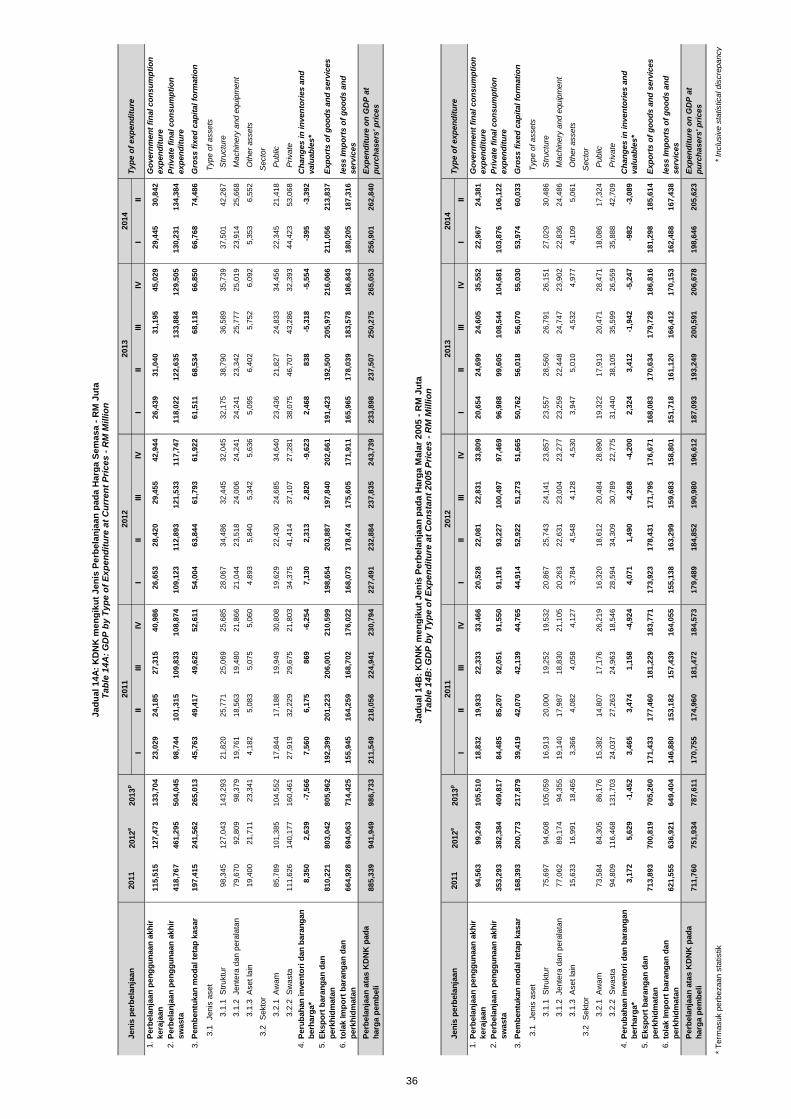
III
III
IVI
IIIII
IVI
IIIII
IVI
II
1.
11
5,5
15
12
7,4
73
13
3,7
04
23
,02
92
4,1
85
27
,31
54
0,9
86
26
,65
32
8,4
20
29
,45
54
2,9
44
26
,43
93
1,0
40
31
,19
54
5,0
29
29
,44
53
0,8
42
Go
vern
men
t fi
nal co
nsu
mp
tio
n
exp
en
dit
ure
2.
41
8,7
67
46
1,2
95
50
4,0
45
98
,74
41
01
,31
51
09
,83
31
08
,87
41
09
,12
31
12
,89
31
21
,53
31
17
,74
71
18
,02
21
22
,63
51
33
,88
41
29
,50
51
30
,23
11
34
,38
4P
rivate
fin
al co
nsu
mp
tio
n
exp
en
dit
ure
3.
19
7,4
15
24
1,5
62
26
5,0
13
45
,76
34
9,4
17
49
,62
55
2,6
11
54
,00
46
3,8
44
61
,79
36
1,9
22
61
,51
16
8,5
34
68
,11
86
6,8
50
66
,76
87
4,4
86
Gro
ss f
ixed
cap
ital fo
rmati
on
3.1
Jenis
aset
Type o
f assets
3.1
.1 S
truktu
r
98
,34
51
27
,04
31
43
,29
32
1,8
20
25
,77
12
5,0
69
25
,68
52
8,0
67
34
,48
63
2,4
45
32
,04
53
2,1
75
38
,79
03
6,5
89
35
,73
93
7,5
01
42
,26
7S
tructu
re
3.1
.2 Jente
ra d
an p
era
lata
n
79
,67
09
2,8
09
98
,37
91
9,7
61
18
,56
31
9,4
80
21
,86
62
1,0
44
23
,51
82
4,0
06
24
,24
12
4,2
41
23
,34
22
5,7
77
25
,01
92
3,9
14
25
,66
8M
achin
ery
and e
quip
ment
3.1
.3 A
set la
in
19
,40
02
1,7
11
23
,34
14
,18
25
,08
35
,07
55
,06
04
,89
35
,84
05
,34
25
,63
65
,09
56
,40
25
,75
26
,09
25
,35
36
,55
2O
ther
assets
3.2
Sekto
r
Secto
r
3.2
.1 A
wam
85
,78
91
01
,38
51
04
,55
21
7,8
44
17
,18
81
9,9
49
30
,80
81
9,6
29
22
,43
02
4,6
85
34
,64
02
3,4
36
21
,82
72
4,8
33
34
,45
62
2,3
45
21
,41
8P
ublic
3.2
.2 S
wasta
11
1,6
26
14
0,1
77
16
0,4
61
27
,91
93
2,2
29
29
,67
52
1,8
03
34
,37
54
1,4
14
37
,10
72
7,2
81
38
,07
54
6,7
07
43
,28
63
2,3
93
44
,42
35
3,0
68
Private
4.
8,3
50
2,6
39
-7,5
66
7,5
60
6,1
75
86
9-6
,25
47
,13
02
,31
32
,82
0-9
,62
32
,46
88
38
-5,3
18
-5,5
54
-39
5-3
,39
2C
han
ges in
in
ven
tori
es a
nd
valu
ab
les*
5.
81
0,2
21
80
3,0
42
80
5,9
62
19
2,3
99
20
1,2
23
20
6,0
01
21
0,5
99
19
8,6
54
20
3,8
87
19
7,8
40
20
2,6
61
19
1,4
23
19
2,5
00
20
5,9
73
21
6,0
66
21
1,0
56
21
3,8
37
Exp
ort
s o
f g
oo
ds a
nd
serv
ices
6.
66
4,9
28
69
4,0
63
71
4,4
25
15
5,9
45
16
4,2
59
16
8,7
02
17
6,0
22
16
8,0
73
17
8,4
74
17
5,6
05
17
1,9
11
16
5,9
65
17
8,0
39
18
3,5
78
18
6,8
43
18
0,2
05
18
7,3
16
less Im
po
rts o
f g
oo
ds a
nd
serv
ices
88
5,3
39
94
1,9
49
98
6,7
33
21
1,5
49
21
8,0
56
22
4,9
41
23
0,7
94
22
7,4
91
23
2,8
84
23
7,8
35
24
3,7
39
23
3,8
98
23
7,5
07
25
0,2
75
26
5,0
53
25
6,9
01
26
2,8
40
Exp
en
dit
ure
on
GD
P a
t
pu
rch
asers
' p
rices
III
III
IVI
IIIII
IVI
IIIII
IVI
II
1.
94
,56
39
9,2
49
10
5,5
10
18
,83
21
9,9
33
22
,33
33
3,4
66
20
,52
82
2,0
81
22
,83
13
3,8
09
20
,65
42
4,6
99
24
,60
53
5,5
52
22
,96
72
4,3
81
Go
vern
men
t fi
nal co
nsu
mp
tio
n
exp
en
dit
ure
2.
35
3,2
93
38
2,3
84
40
9,8
17
84
,48
58
5,2
07
92
,05
19
1,5
50
91
,19
19
3,2
27
10
0,4
97
97
,46
99
6,9
88
99
,60
51
08
,54
41
04
,68
11
03
,87
61
06
,12
2P
rivate
fin
al co
nsu
mp
tio
n
exp
en
dit
ure
3.
16
8,3
93
20
0,7
73
21
7,8
79
39
,41
94
2,0
70
42
,13
94
4,7
65
44
,91
45
2,9
22
51
,27
35
1,6
65
50
,76
25
6,0
18
56
,07
05
5,0
30
53
,97
46
0,0
33
Gro
ss f
ixed
cap
ital fo
rmati
on
3.1
Jenis
aset
Type o
f assets
3.1
.1 S
truktu
r
75
,69
79
4,6
08
10
5,0
59
16
,91
32
0,0
00
19
,25
21
9,5
32
20
,86
72
5,7
43
24
,14
12
3,8
57
23
,55
72
8,5
60
26
,79
12
6,1
51
27
,02
93
0,4
86
Str
uctu
re
3.1
.2 Jente
ra d
an p
era
lata
n
77
,06
28
9,1
74
94
,35
51
9,1
40
17
,98
71
8,8
30
21
,10
52
0,2
63
22
,63
12
3,0
04
23
,27
72
3,2
59
22
,44
82
4,7
47
23
,90
22
2,8
36
24
,48
6M
achin
ery
and e
quip
ment
3.1
.3 A
set la
in
15
,63
31
6,9
91
18
,46
53
,36
64
,08
24
,05
84
,12
73
,78
44
,54
84
,12
84
,53
03
,94
75
,01
04
,53
24
,97
74
,10
95
,06
1O
ther
assets
3.2
Sekto
r
Secto
r
3.2
.1 A
wam
73
,58
48
4,3
05
86
,17
61
5,3
82
14
,80
71
7,1
76
26
,21
91
6,3
20
18
,61
22
0,4
84
28
,89
01
9,3
22
17
,91
32
0,4
71
28
,47
11
8,0
86
17
,32
4P
ublic
3.2
.2 S
wasta
94
,80
91
16
,46
81
31
,70
32
4,0
37
27
,26
32
4,9
63
18
,54
62
8,5
94
34
,30
93
0,7
89
22
,77
53
1,4
40
38
,10
53
5,5
99
26
,55
93
5,8
88
42
,70
9P
rivate
4.
3,1
72
5,6
29
-1,4
52
3,4
65
3,4
74
1,1
58
-4,9
24
4,0
71
1,4
90
4,2
68
-4,2
00
2,3
24
3,4
12
-1,9
42
-5,2
47
-98
2-3
,08
9C
han
ges in
in
ven
tori
es a
nd
valu
ab
les*
5.
71
3,8
93
70
0,8
19
70
5,2
60
17
1,4
33
17
7,4
60
18
1,2
29
18
3,7
71
17
3,9
23
17
8,4
31
17
1,7
95
17
6,6
71
16
8,0
83
17
0,6
34
17
9,7
28
18
6,8
16
18
1,2
98
18
5,6
14
Exp
ort
s o
f g
oo
ds a
nd
serv
ices
6.
62
1,5
55
63
6,9
21
64
9,4
04
14
6,8
80
15
3,1
82
15
7,4
39
16
4,0
55
15
5,1
38
16
3,2
99
15
9,6
83
15
8,8
01
15
1,7
18
16
1,1
20
16
6,4
12
17
0,1
53
16
2,4
88
16
7,4
38
less Im
po
rts o
f g
oo
ds a
nd
serv
ices
71
1,7
60
75
1,9
34
78
7,6
11
17
0,7
55
17
4,9
60
18
1,4
72
18
4,5
73
17
9,4
89
18
4,8
52
19
0,9
80
19
6,6
12
18
7,0
93
19
3,2
49
20
0,5
91
20
6,6
78
19
8,6
46
20
5,6
23
Exp
en
dit
ure
on
GD
P a
t
pu
rch
asers
' p
rices
* T
erm
asuk p
erb
ezaan s
tatistik
Typ
e o
f exp
en
dit
ure
Perb
ela
nja
an
pen
gg
un
aan
akh
ir
sw
asta
Peru
bah
an
in
ven
tori
dan
bara
ng
an
berh
arg
a*
Perb
ela
nja
an
pen
gg
un
aan
akh
ir
kera
jaan
Pem
ben
tukan
mo
dal te
tap
kasar
2012
e2013
p2013
2014
Jen
is p
erb
ela
nja
an
Jen
is p
erb
ela
nja
an
2011
2012
tola
k Im
po
rt b
ara
ng
an
dan
perk
hid
mata
n
Peru
bah
an
in
ven
tori
dan
bara
ng
an
berh
arg
a*
Eksp
ort
bara
ng
an
dan
perk
hid
mata
n
Perb
ela
nja
an
ata
s K
DN
K p
ad
a
harg
a p
em
beli
Ja
du
al
14
B:
KD
NK
me
ng
iku
t J
en
is P
erb
ela
nja
an
pa
da
Ha
rga
Ma
lar
20
05
- R
M J
uta
Ta
ble
14
B:
GD
P b
y T
yp
e o
f E
xp
en
dit
ure
at
Co
ns
tan
t 2
00
5 P
ric
es
- R
M M
illi
on
Eksp
ort
bara
ng
an
dan
perk
hid
mata
n
* In
clu
siv
e s
tatistical dis
cre
pancy
2011
Ja
du
al
14
A:
KD
NK
me
ng
iku
t J
en
is P
erb
ela
nja
an
pa
da
Ha
rga
Se
ma
sa
- R
M J
uta
Ta
ble
14
A:
GD
P b
y T
yp
e o
f E
xp
en
dit
ure
at
Cu
rre
nt
Pri
ce
s -
RM
Mil
lio
n
2011
2012
e2011
2012
Typ
e o
f exp
en
dit
ure
2013
p2013
2014
36
tola
k Im
po
rt b
ara
ng
an
dan
perk
hid
mata
n
Perb
ela
nja
an
pen
gg
un
aan
akh
ir
kera
jaan
Perb
ela
nja
an
pen
gg
un
aan
akh
ir
sw
asta
Pem
ben
tukan
mo
dal te
tap
kasar
Perb
ela
nja
an
ata
s K
DN
K p
ad
a
harg
a p
em
beli
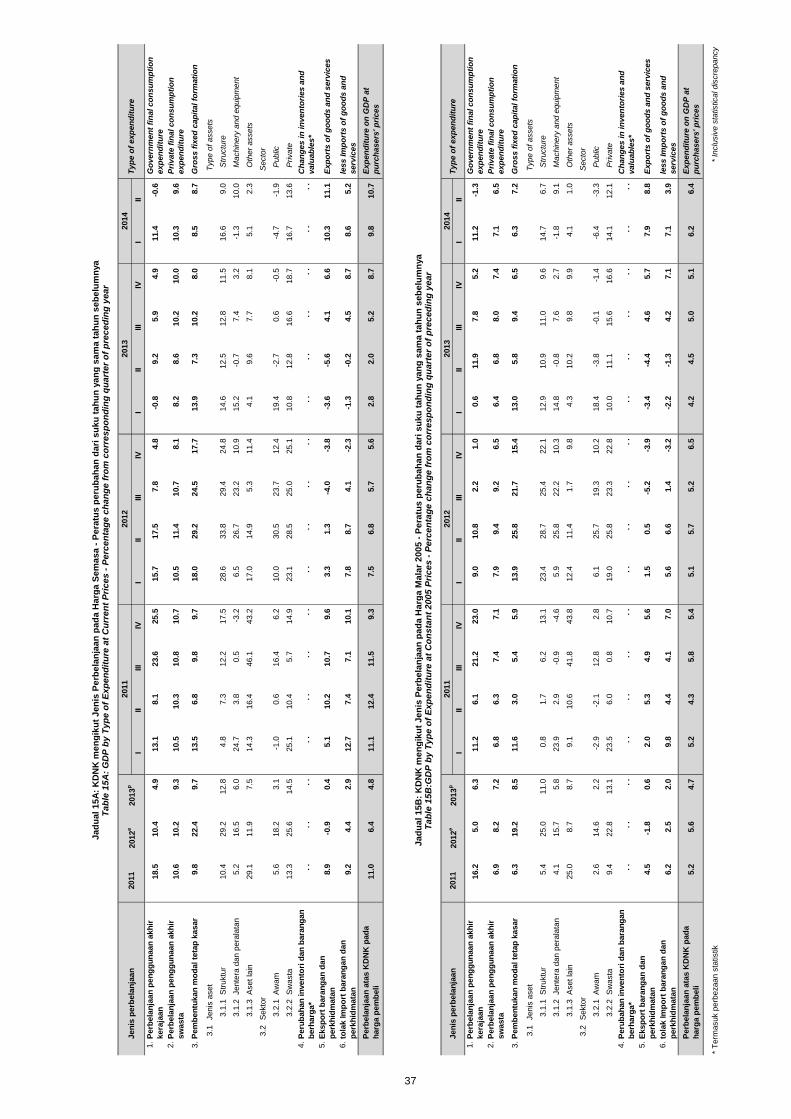
III
III
IVI
IIIII
IVI
IIIII
IVI
II
1.
18.5
10.4
4.9
13.1
8.1
23.6
25.5
15.7
17.5
7.8
4.8
-0.8
9.2
5.9
4.9
11.4
-0.6
Go
vern
men
t fi
nal co
nsu
mp
tio
n
exp
en
dit
ure
2.
10.6
10.2
9.3
10.5
10.3
10.8
10.7
10.5
11.4
10.7
8.1
8.2
8.6
10.2
10.0
10.3
9.6
Pri
vate
fin
al co
nsu
mp
tio
n
exp
en
dit
ure
3.
9.8
22.4
9.7
13.5
6.8
9.8
9.7
18.0
29.2
24.5
17.7
13.9
7.3
10.2
8.0
8.5
8.7
Gro
ss f
ixed
cap
ital fo
rmati
on
3.1
Jenis
aset
Type o
f assets
3.1
.1 S
truktu
r
10.4
29.2
12.8
4.8
7.3
12.2
17.5
28.6
33.8
29.4
24.8
14.6
12.5
12.8
11.5
16.6
9.0
Str
uctu
re
3.1
.2 Jente
ra d
an p
era
lata
n
5.2
16.5
6.0
24.7
3.8
0.5
-3.2
6.5
26.7
23.2
10.9
15.2
-0.7
7.4
3.2
-1.3
10.0
Machin
ery
and e
quip
ment
3.1
.3 A
set la
in
29.1
11.9
7.5
14.3
16.4
46.1
43.2
17.0
14.9
5.3
11.4
4.1
9.6
7.7
8.1
5.1
2.3
Oth
er
assets
3.2
Sekto
r
Secto
r
3.2
.1 A
wam
5.6
18.2
3.1
-1.0
0.6
16.4
6.2
10.0
30.5
23.7
12.4
19.4
-2.7
0.6
-0.5
-4.7
-1.9
Public
3.2
.2 S
wasta
13.3
25.6
14.5
25.1
10.4
5.7
14.9
23.1
28.5
25.0
25.1
10.8
12.8
16.6
18.7
16.7
13.6
Private
4.
. .
. .
. .
. .
. .
. .
. .
. .
. .
. .
. .
. .
. .
. .
. .
. .
. .
Ch
an
ges in
in
ven
tori
es a
nd
valu
ab
les*
5.
8.9
-0.9
0.4
5.1
10.2
10.7
9.6
3.3
1.3
-4.0
-3.8
-3.6
-5.6
4.1
6.6
10.3
11.1
Exp
ort
s o
f g
oo
ds a
nd
serv
ices
6.
9.2
4.4
2.9
12.7
7.4
7.1
10.1
7.8
8.7
4.1
-2.3
-1.3
-0.2
4.5
8.7
8.6
5.2
less Im
po
rts o
f g
oo
ds a
nd
serv
ices
11.0
6.4
4.8
11.1
12.4
11.5
9.3
7.5
6.8
5.7
5.6
2.8
2.0
5.2
8.7
9.8
10.7
Exp
en
dit
ure
on
GD
P a
t
pu
rch
asers
' p
rices
III
III
IVI
IIIII
IVI
IIIII
IVI
II
1.
16.2
5.0
6.3
11.2
6.1
21.2
23.0
9.0
10.8
2.2
1.0
0.6
11.9
7.8
5.2
11.2
-1.3
Go
vern
men
t fi
nal co
nsu
mp
tio
n
exp
en
dit
ure
2.
6.9
8.2
7.2
6.8
6.3
7.4
7.1
7.9
9.4
9.2
6.5
6.4
6.8
8.0
7.4
7.1
6.5
Pri
vate
fin
al co
nsu
mp
tio
n
exp
en
dit
ure
3.
6.3
19.2
8.5
11.6
3.0
5.4
5.9
13.9
25.8
21.7
15.4
13.0
5.8
9.4
6.5
6.3
7.2
Gro
ss f
ixed
cap
ital fo
rmati
on
3.1
Jenis
aset
Type o
f assets
3.1
.1 S
truktu
r
5.4
25.0
11.0
0.8
1.7
6.2
13.1
23.4
28.7
25.4
22.1
12.9
10.9
11.0
9.6
14.7
6.7
Str
uctu
re
3.1
.2 Jente
ra d
an p
era
lata
n
4.1
15.7
5.8
23.9
2.9
-0.9
-4.6
5.9
25.8
22.2
10.3
14.8
-0.8
7.6
2.7
-1.8
9.1
Machin
ery
and e
quip
ment
3.1
.3 A
set la
in
25.0
8.7
8.7
9.1
10.6
41.8
43.8
12.4
11.4
1.7
9.8
4.3
10.2
9.8
9.9
4.1
1.0
Oth
er
assets
3.2
Sekto
r
Secto
r
3.2
.1 A
wam
2.6
14.6
2.2
-2.9
-2.1
12.8
2.8
6.1
25.7
19.3
10.2
18.4
-3.8
-0.1
-1.4
-6.4
-3.3
Public
3.2
.2 S
wasta
9.4
22.8
13.1
23.5
6.0
0.8
10.7
19.0
25.8
23.3
22.8
10.0
11.1
15.6
16.6
14.1
12.1
Private
4.
. .
. .
. .
. .
. .
. .
. .
. .
. .
. .
. .
. .
. .
. .
. .
. .
. .
Ch
an
ges in
in
ven
tori
es a
nd
valu
ab
les*
5.
4.5
-1.8
0.6
2.0
5.3
4.9
5.6
1.5
0.5
-5.2
-3.9
-3.4
-4.4
4.6
5.7
7.9
8.8
Exp
ort
s o
f g
oo
ds a
nd
serv
ices
6.
6.2
2.5
2.0
9.8
4.4
4.1
7.0
5.6
6.6
1.4
-3.2
-2.2
-1.3
4.2
7.1
7.1
3.9
less Im
po
rts o
f g
oo
ds a
nd
serv
ices
5.2
5.6
4.7
5.2
4.3
5.8
5.4
5.1
5.7
5.2
6.5
4.2
4.5
5.0
5.1
6.2
6.4
Exp
en
dit
ure
on
GD
P a
t
pu
rch
asers
' p
rices
* T
erm
asuk p
erb
ezaan s
tatistik
2013
p
2013
p
2013
2013
* In
clu
siv
e s
tatistical dis
cre
pancy
2014
2014
Perb
ela
nja
an
pen
gg
un
aan
akh
ir
sw
asta
Peru
bah
an
in
ven
tori
dan
bara
ng
an
berh
arg
a*
Perb
ela
nja
an
pen
gg
un
aan
akh
ir
kera
jaan
Pem
ben
tukan
mo
dal te
tap
kasar
Typ
e o
f exp
en
dit
ure
2011
2012
e2011
2012
Perb
ela
nja
an
ata
s K
DN
K p
ad
a
harg
a p
em
beli
37
tola
k Im
po
rt b
ara
ng
an
dan
perk
hid
mata
n
Perb
ela
nja
an
pen
gg
un
aan
akh
ir
kera
jaan
Perb
ela
nja
an
pen
gg
un
aan
akh
ir
sw
asta
Pem
ben
tukan
mo
dal te
tap
kasar
Jen
is p
erb
ela
nja
an
Jen
is p
erb
ela
nja
an
tola
k Im
po
rt b
ara
ng
an
dan
perk
hid
mata
n
Peru
bah
an
in
ven
tori
dan
bara
ng
an
berh
arg
a*
Eksp
ort
bara
ng
an
dan
perk
hid
mata
n
Perb
ela
nja
an
ata
s K
DN
K p
ad
a
harg
a p
em
beli
Ja
du
al
15
B:
KD
NK
me
ng
iku
t J
en
is P
erb
ela
nja
an
pa
da
Ha
rga
Ma
lar
20
05
- P
era
tus
pe
rub
ah
an
da
ri s
uk
u t
ah
un
ya
ng
sa
ma
ta
hu
n s
eb
elu
mn
ya
Ta
ble
15
B:G
DP
by
Ty
pe
of
Ex
pe
nd
itu
re a
t C
on
sta
nt
20
05
Pri
ce
s -
Pe
rce
nta
ge
ch
an
ge
fro
m c
orr
es
po
nd
ing
qu
art
er
of
pre
ce
din
g y
ea
r
Eksp
ort
bara
ng
an
dan
perk
hid
mata
n
Ja
du
al
15
A:
KD
NK
me
ng
iku
t J
en
is P
erb
ela
nja
an
pa
da
Ha
rga
Se
ma
sa
- P
era
tus
pe
rub
ah
an
da
ri s
uk
u t
ah
un
ya
ng
sa
ma
ta
hu
n s
eb
elu
mn
ya
Ta
ble
15
A:
GD
P b
y T
yp
e o
f E
xp
en
dit
ure
at
Cu
rre
nt
Pri
ce
s -
Pe
rce
nta
ge
ch
an
ge
fro
m c
orr
es
po
nd
ing
qu
art
er
of
pre
ce
din
g y
ea
r
2011
2012
e2011
2012
Typ
e o
f exp
en
dit
ure
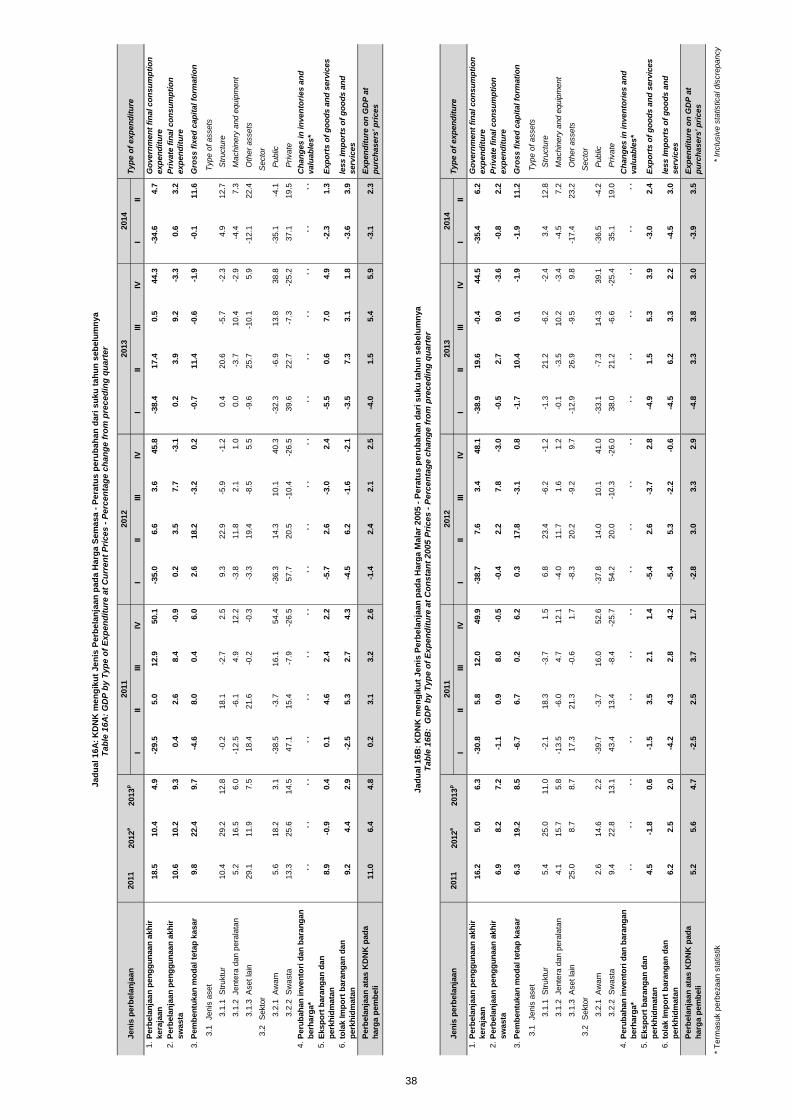
III
III
IVI
IIIII
IVI
IIIII
IVI
II
1.
18.5
10.4
4.9
-29.5
5.0
12.9
50.1
-35.0
6.6
3.6
45.8
-38.4
17.4
0.5
44.3
-34.6
4.7
Go
vern
men
t fi
nal co
nsu
mp
tio
n
exp
en
dit
ure
2.
10.6
10.2
9.3
0.4
2.6
8.4
-0.9
0.2
3.5
7.7
-3.1
0.2
3.9
9.2
-3.3
0.6
3.2
Pri
vate
fin
al co
nsu
mp
tio
n
exp
en
dit
ure
3.
9.8
22.4
9.7
-4.6
8.0
0.4
6.0
2.6
18.2
-3.2
0.2
-0.7
11.4
-0.6
-1.9
-0.1
11.6
Gro
ss f
ixed
cap
ital fo
rmati
on
3.1
Jenis
aset
Type o
f assets
3.1
.1 S
truktu
r
10.4
29.2
12.8
-0.2
18.1
-2.7
2.5
9.3
22.9
-5.9
-1.2
0.4
20.6
-5.7
-2.3
4.9
12.7
Str
uctu
re
3.1
.2 Jente
ra d
an p
era
lata
n
5.2
16.5
6.0
-12.5
-6.1
4.9
12.2
-3.8
11.8
2.1
1.0
0.0
-3.7
10.4
-2.9
-4.4
7.3
Machin
ery
and e
quip
ment
3.1
.3 A
set la
in
29.1
11.9
7.5
18.4
21.6
-0.2
-0.3
-3.3
19.4
-8.5
5.5
-9.6
25.7
-10.1
5.9
-12.1
22.4
Oth
er
assets
3.2
Sekto
r
Secto
r
3.2
.1 A
wam
5.6
18.2
3.1
-38.5
-3.7
16.1
54.4
-36.3
14.3
10.1
40.3
-32.3
-6.9
13.8
38.8
-35.1
-4.1
Public
3.2
.2 S
wasta
13.3
25.6
14.5
47.1
15.4
-7.9
-26.5
57.7
20.5
-10.4
-26.5
39.6
22.7
-7.3
-25.2
37.1
19.5
Private
4.
. .
. .
. .
. .
. .
. .
. .
. .
. .
. .
. .
. .
. .
. .
. .
. .
. .
Ch
an
ges in
in
ven
tori
es a
nd
valu
ab
les*
5.
8.9
-0.9
0.4
0.1
4.6
2.4
2.2
-5.7
2.6
-3.0
2.4
-5.5
0.6
7.0
4.9
-2.3
1.3
Exp
ort
s o
f g
oo
ds a
nd
serv
ices
6.
9.2
4.4
2.9
-2.5
5.3
2.7
4.3
-4.5
6.2
-1.6
-2.1
-3.5
7.3
3.1
1.8
-3.6
3.9
less Im
po
rts o
f g
oo
ds a
nd
serv
ices
11.0
6.4
4.8
0.2
3.1
3.2
2.6
-1.4
2.4
2.1
2.5
-4.0
1.5
5.4
5.9
-3.1
2.3
Exp
en
dit
ure
on
GD
P a
t
pu
rch
asers
' p
rices
III
III
IVI
IIIII
IVI
IIIII
IVI
II
1.
16.2
5.0
6.3
-30.8
5.8
12.0
49.9
-38.7
7.6
3.4
48.1
-38.9
19.6
-0.4
44.5
-35.4
6.2
Go
vern
men
t fi
nal co
nsu
mp
tio
n
exp
en
dit
ure
2.
6.9
8.2
7.2
-1.1
0.9
8.0
-0.5
-0.4
2.2
7.8
-3.0
-0.5
2.7
9.0
-3.6
-0.8
2.2
Pri
vate
fin
al co
nsu
mp
tio
n
exp
en
dit
ure
3.
6.3
19.2
8.5
-6.7
6.7
0.2
6.2
0.3
17.8
-3.1
0.8
-1.7
10.4
0.1
-1.9
-1.9
11.2
Gro
ss f
ixed
cap
ital fo
rmati
on
3.1
Jenis
aset
Type o
f assets
3.1
.1 S
truktu
r
5.4
25.0
11.0
-2.1
18.3
-3.7
1.5
6.8
23.4
-6.2
-1.2
-1.3
21.2
-6.2
-2.4
3.4
12.8
Str
uctu
re
3.1
.2 Jente
ra d
an p
era
lata
n
4.1
15.7
5.8
-13.5
-6.0
4.7
12.1
-4.0
11.7
1.6
1.2
-0.1
-3.5
10.2
-3.4
-4.5
7.2
Machin
ery
and e
quip
ment
3.1
.3 A
set la
in
25.0
8.7
8.7
17.3
21.3
-0.6
1.7
-8.3
20.2
-9.2
9.7
-12.9
26.9
-9.5
9.8
-17.4
23.2
Oth
er
assets
3.2
Sekto
r
Secto
r
3.2
.1 A
wam
2.6
14.6
2.2
-39.7
-3.7
16.0
52.6
-37.8
14.0
10.1
41.0
-33.1
-7.3
14.3
39.1
-36.5
-4.2
Public
3.2
.2 S
wasta
9.4
22.8
13.1
43.4
13.4
-8.4
-25.7
54.2
20.0
-10.3
-26.0
38.0
21.2
-6.6
-25.4
35.1
19.0
Private
4.
. .
. .
. .
. .
. .
. .
. .
. .
. .
. .
. .
. .
. .
. .
. .
. .
. .
Ch
an
ges in
in
ven
tori
es a
nd
valu
ab
les*
5.
4.5
-1.8
0.6
-1.5
3.5
2.1
1.4
-5.4
2.6
-3.7
2.8
-4.9
1.5
5.3
3.9
-3.0
2.4
Exp
ort
s o
f g
oo
ds a
nd
serv
ices
6.
6.2
2.5
2.0
-4.2
4.3
2.8
4.2
-5.4
5.3
-2.2
-0.6
-4.5
6.2
3.3
2.2
-4.5
3.0
less Im
po
rts o
f g
oo
ds a
nd
serv
ices
5.2
5.6
4.7
-2.5
2.5
3.7
1.7
-2.8
3.0
3.3
2.9
-4.8
3.3
3.8
3.0
-3.9
3.5
Exp
en
dit
ure
on
GD
P a
t
pu
rch
asers
' p
rices
* T
erm
asuk p
erb
ezaan s
tatistik
2013
p
2013
p
2013
2013
* In
clu
siv
e s
tatistical dis
cre
pancy
2014
2014
Perb
ela
nja
an
pen
gg
un
aan
akh
ir
sw
asta
Peru
bah
an
in
ven
tori
dan
bara
ng
an
berh
arg
a*
Perb
ela
nja
an
pen
gg
un
aan
akh
ir
kera
jaan
Pem
ben
tukan
mo
dal te
tap
kasar
Typ
e o
f exp
en
dit
ure
2011
2012
e2011
2012
Perb
ela
nja
an
ata
s K
DN
K p
ad
a
harg
a p
em
beli
38
tola
k Im
po
rt b
ara
ng
an
dan
perk
hid
mata
n
Perb
ela
nja
an
pen
gg
un
aan
akh
ir
kera
jaan
Perb
ela
nja
an
pen
gg
un
aan
akh
ir
sw
asta
Pem
ben
tukan
mo
dal te
tap
kasar
Jen
is p
erb
ela
nja
an
Jen
is p
erb
ela
nja
an
tola
k Im
po
rt b
ara
ng
an
dan
perk
hid
mata
n
Peru
bah
an
in
ven
tori
dan
bara
ng
an
berh
arg
a*
Eksp
ort
bara
ng
an
dan
perk
hid
mata
n
Perb
ela
nja
an
ata
s K
DN
K p
ad
a
harg
a p
em
beli
Jad
ual 16B
: K
DN
K m
en
gik
ut
Jen
is P
erb
ela
nja
an
pad
a H
arg
a M
ala
r 2005 -
Pera
tus p
eru
bah
an
dari
su
ku
tah
un
seb
elu
mn
ya
Tab
le 1
6B
: G
DP
by T
yp
e o
f E
xp
en
dit
ure
at
Co
nsta
nt
2005 P
rices -
Perc
en
tag
e c
han
ge f
rom
pre
ced
ing
qu
art
er
Eksp
ort
bara
ng
an
dan
perk
hid
mata
n
Jad
ual 16A
: K
DN
K m
en
gik
ut
Jen
is P
erb
ela
nja
an
pad
a H
arg
a S
em
asa -
Pera
tus p
eru
bah
an
dari
su
ku
tah
un
seb
elu
mn
ya
Tab
le 1
6A
: G
DP
by T
yp
e o
f E
xp
en
dit
ure
at
Cu
rren
t P
rices -
Perc
en
tag
e c
han
ge f
rom
pre
ced
ing
qu
art
er
2011
2012
e2011
2012
Typ
e o
f exp
en
dit
ure
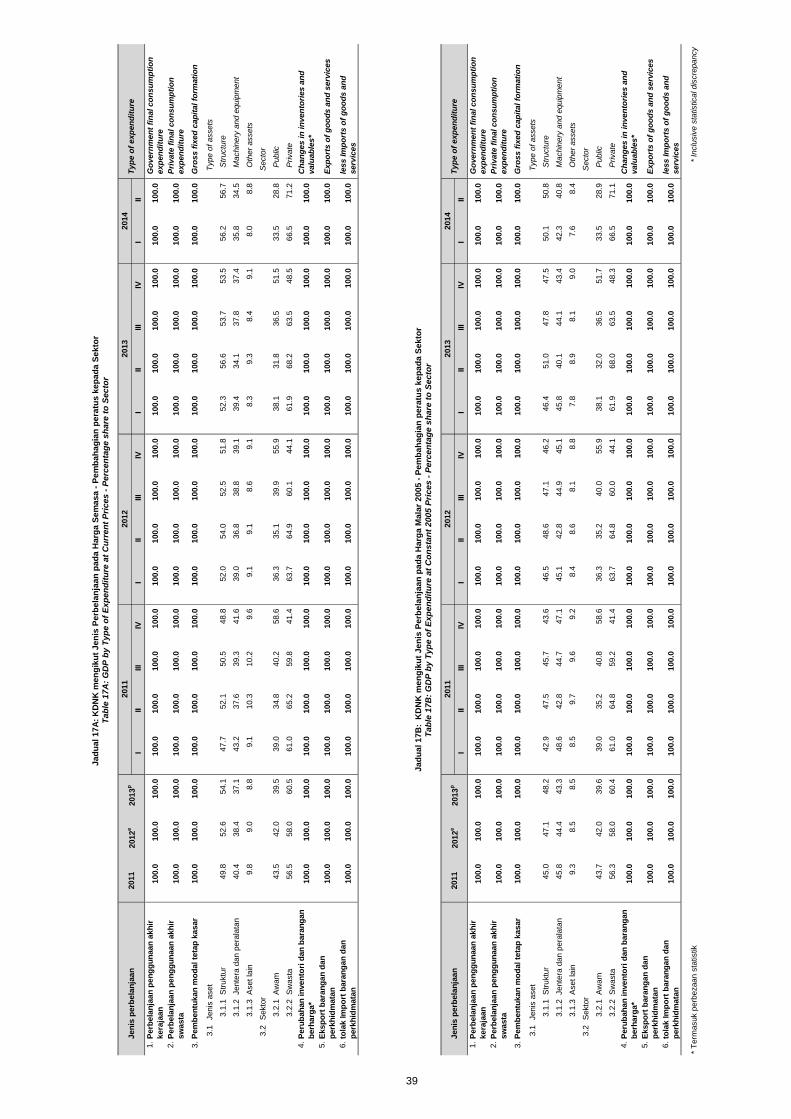
III
III
IVI
IIIII
IVI
IIIII
IVI
II
1.
100.0
100.0
100.0
100.0
100.0
100.0
100.0
100.0
100.0
100.0
100.0
100.0
100.0
100.0
100.0
100.0
100.0
Go
vern
men
t fi
nal co
nsu
mp
tio
n
exp
en
dit
ure
2.
100.0
100.0
100.0
100.0
100.0
100.0
100.0
100.0
100.0
100.0
100.0
100.0
100.0
100.0
100.0
100.0
100.0
Pri
vate
fin
al co
nsu
mp
tio
n
exp
en
dit
ure
3.
100.0
100.0
100.0
100.0
100.0
100.0
100.0
100.0
100.0
100.0
100.0
100.0
100.0
100.0
100.0
100.0
100.0
Gro
ss f
ixed
cap
ital fo
rmati
on
3.1
Jenis
aset
Type o
f assets
3.1
.1 S
truktu
r
49.8
52.6
54.1
47.7
52.1
50.5
48.8
52.0
54.0
52.5
51.8
52.3
56.6
53.7
53.5
56.2
56.7
Str
uctu
re
3.1
.2 Jente
ra d
an p
era
lata
n
40.4
38.4
37.1
43.2
37.6
39.3
41.6
39.0
36.8
38.8
39.1
39.4
34.1
37.8
37.4
35.8
34.5
Machin
ery
and e
quip
ment
3.1
.3 A
set la
in
9.8
9.0
8.8
9.1
10.3
10.2
9.6
9.1
9.1
8.6
9.1
8.3
9.3
8.4
9.1
8.0
8.8
Oth
er
assets
3.2
Sekto
r
Secto
r
3.2
.1 A
wam
43.5
42.0
39.5
39.0
34.8
40.2
58.6
36.3
35.1
39.9
55.9
38.1
31.8
36.5
51.5
33.5
28.8
Public
3.2
.2 S
wasta
56.5
58.0
60.5
61.0
65.2
59.8
41.4
63.7
64.9
60.1
44.1
61.9
68.2
63.5
48.5
66.5
71.2
Private
4.
100.0
100.0
100.0
100.0
100.0
100.0
100.0
100.0
100.0
100.0
100.0
100.0
100.0
100.0
100.0
100.0
100.0
Ch
an
ges in
in
ven
tori
es a
nd
valu
ab
les*
5.
100.0
100.0
100.0
100.0
100.0
100.0
100.0
100.0
100.0
100.0
100.0
100.0
100.0
100.0
100.0
100.0
100.0
Exp
ort
s o
f g
oo
ds a
nd
serv
ices
6.
100.0
100.0
100.0
100.0
100.0
100.0
100.0
100.0
100.0
100.0
100.0
100.0
100.0
100.0
100.0
100.0
100.0
less Im
po
rts o
f g
oo
ds a
nd
serv
ices
III
III
IVI
IIIII
IVI
IIIII
IVI
II
1.
100.0
100.0
100.0
100.0
100.0
100.0
100.0
100.0
100.0
100.0
100.0
100.0
100.0
100.0
100.0
100.0
100.0
Go
vern
men
t fi
nal co
nsu
mp
tio
n
exp
en
dit
ure
2.
100.0
100.0
100.0
100.0
100.0
100.0
100.0
100.0
100.0
100.0
100.0
100.0
100.0
100.0
100.0
100.0
100.0
Pri
vate
fin
al co
nsu
mp
tio
n
exp
en
dit
ure
3.
100.0
100.0
100.0
100.0
100.0
100.0
100.0
100.0
100.0
100.0
100.0
100.0
100.0
100.0
100.0
100.0
100.0
Gro
ss f
ixed
cap
ital fo
rmati
on
3.1
Jenis
aset
Type o
f assets
3.1
.1 S
truktu
r
45.0
47.1
48.2
42.9
47.5
45.7
43.6
46.5
48.6
47.1
46.2
46.4
51.0
47.8
47.5
50.1
50.8
Str
uctu
re
3.1
.2 Jente
ra d
an p
era
lata
n
45.8
44.4
43.3
48.6
42.8
44.7
47.1
45.1
42.8
44.9
45.1
45.8
40.1
44.1
43.4
42.3
40.8
Machin
ery
and e
quip
ment
3.1
.3 A
set la
in
9.3
8.5
8.5
8.5
9.7
9.6
9.2
8.4
8.6
8.1
8.8
7.8
8.9
8.1
9.0
7.6
8.4
Oth
er
assets
3.2
Sekto
r
Secto
r
3.2
.1 A
wam
43.7
42.0
39.6
39.0
35.2
40.8
58.6
36.3
35.2
40.0
55.9
38.1
32.0
36.5
51.7
33.5
28.9
Public
3.2
.2 S
wasta
56.3
58.0
60.4
61.0
64.8
59.2
41.4
63.7
64.8
60.0
44.1
61.9
68.0
63.5
48.3
66.5
71.1
Private
4.
100.0
100.0
100.0
100.0
100.0
100.0
100.0
100.0
100.0
100.0
100.0
100.0
100.0
100.0
100.0
100.0
100.0
Ch
an
ges in
in
ven
tori
es a
nd
valu
ab
les*
5.
100.0
100.0
100.0
100.0
100.0
100.0
100.0
100.0
100.0
100.0
100.0
100.0
100.0
100.0
100.0
100.0
100.0
Exp
ort
s o
f g
oo
ds a
nd
serv
ices
6.
100.0
100.0
100.0
100.0
100.0
100.0
100.0
100.0
100.0
100.0
100.0
100.0
100.0
100.0
100.0
100.0
100.0
less Im
po
rts o
f g
oo
ds a
nd
serv
ices
* T
erm
asuk p
erb
ezaan s
tatistik
Jad
ual 17B
: K
DN
K m
en
gik
ut
Jen
is P
erb
ela
nja
an
pad
a H
arg
a M
ala
r 2005 -
Pem
bah
ag
ian
pera
tus k
ep
ad
a S
ekto
r
Tab
le 1
7B
: G
DP
by T
yp
e o
f E
xp
en
dit
ure
at
Co
nsta
nt
2005 P
rices -
Perc
en
tag
e s
hare
to
Secto
r
2011
2012
2013
p2014
2011
* In
clu
siv
e s
tatistical dis
cre
pancy
2012
eT
yp
e o
f exp
en
dit
ure
2013
39
tola
k Im
po
rt b
ara
ng
an
dan
perk
hid
mata
n
Perb
ela
nja
an
pen
gg
un
aan
akh
ir
kera
jaan
Perb
ela
nja
an
pen
gg
un
aan
akh
ir
sw
asta
Pem
ben
tukan
mo
dal te
tap
kasar
Peru
bah
an
in
ven
tori
dan
bara
ng
an
berh
arg
a*
Perb
ela
nja
an
pen
gg
un
aan
akh
ir
kera
jaan
Pem
ben
tukan
mo
dal te
tap
kasar
Jen
is p
erb
ela
nja
an
tola
k Im
po
rt b
ara
ng
an
dan
perk
hid
mata
n
Eksp
ort
bara
ng
an
dan
perk
hid
mata
n
Perb
ela
nja
an
pen
gg
un
aan
akh
ir
sw
asta
Jen
is p
erb
ela
nja
an
Peru
bah
an
in
ven
tori
dan
bara
ng
an
berh
arg
a*
Eksp
ort
bara
ng
an
dan
perk
hid
mata
n
Jad
ual 17A
: K
DN
K m
en
gik
ut
Jen
is P
erb
ela
nja
an
pad
a H
arg
a S
em
asa -
Pem
bah
ag
ian
pera
tus k
ep
ad
a S
ekto
r
Tab
le 1
7A
: G
DP
by T
yp
e o
f E
xp
en
dit
ure
at
Cu
rren
t P
rices -
Perc
en
tag
e s
hare
to
Secto
r
2011
2012
e2011
2012
Typ
e o
f exp
en
dit
ure
2013
p2013
2014
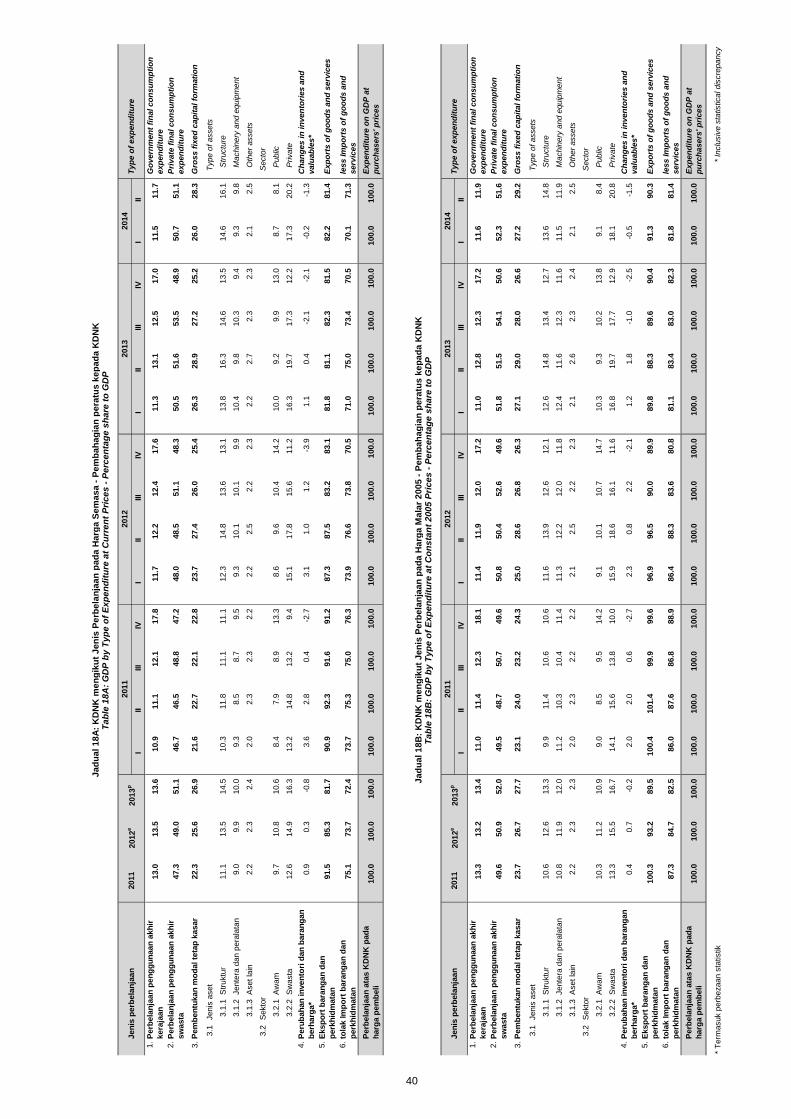
III
III
IVI
IIIII
IVI
IIIII
IVI
II
1.
13.0
13.5
13.6
10.9
11.1
12.1
17.8
11.7
12.2
12.4
17.6
11.3
13.1
12.5
17.0
11.5
11.7
Go
vern
men
t fi
nal co
nsu
mp
tio
n
exp
en
dit
ure
2.
47.3
49.0
51.1
46.7
46.5
48.8
47.2
48.0
48.5
51.1
48.3
50.5
51.6
53.5
48.9
50.7
51.1
Pri
vate
fin
al co
nsu
mp
tio
n
exp
en
dit
ure
3.
22.3
25.6
26.9
21.6
22.7
22.1
22.8
23.7
27.4
26.0
25.4
26.3
28.9
27.2
25.2
26.0
28.3
Gro
ss f
ixed
cap
ital fo
rmati
on
3.1
Jenis
aset
Type o
f assets
3.1
.1 S
truktu
r
11.1
13.5
14.5
10.3
11.8
11.1
11.1
12.3
14.8
13.6
13.1
13.8
16.3
14.6
13.5
14.6
16.1
Str
uctu
re
3.1
.2 Jente
ra d
an p
era
lata
n
9.0
9.9
10.0
9.3
8.5
8.7
9.5
9.3
10.1
10.1
9.9
10.4
9.8
10.3
9.4
9.3
9.8
Machin
ery
and e
quip
ment
3.1
.3 A
set la
in
2.2
2.3
2.4
2.0
2.3
2.3
2.2
2.2
2.5
2.2
2.3
2.2
2.7
2.3
2.3
2.1
2.5
Oth
er
assets
3.2
Sekto
r
Secto
r
3.2
.1 A
wam
9.7
10.8
10.6
8.4
7.9
8.9
13.3
8.6
9.6
10.4
14.2
10.0
9.2
9.9
13.0
8.7
8.1
Public
3.2
.2 S
wasta
12.6
14.9
16.3
13.2
14.8
13.2
9.4
15.1
17.8
15.6
11.2
16.3
19.7
17.3
12.2
17.3
20.2
Private
4.
0.9
0.3
-0.8
3.6
2.8
0.4
-2.7
3.1
1.0
1.2
-3.9
1.1
0.4
-2.1
-2.1
-0.2
-1.3
Ch
an
ges in
in
ven
tori
es a
nd
valu
ab
les*
5.
91.5
85.3
81.7
90.9
92.3
91.6
91.2
87.3
87.5
83.2
83.1
81.8
81.1
82.3
81.5
82.2
81.4
Exp
ort
s o
f g
oo
ds a
nd
serv
ices
6.
75.1
73.7
72.4
73.7
75.3
75.0
76.3
73.9
76.6
73.8
70.5
71.0
75.0
73.4
70.5
70.1
71.3
less Im
po
rts o
f g
oo
ds a
nd
serv
ices
100.0
100.0
100.0
100.0
100.0
100.0
100.0
100.0
100.0
100.0
100.0
100.0
100.0
100.0
100.0
100.0
100.0
Exp
en
dit
ure
on
GD
P a
t
pu
rch
asers
' p
rices
III
III
IVI
IIIII
IVI
IIIII
IVI
II
1.
13.3
13.2
13.4
11.0
11.4
12.3
18.1
11.4
11.9
12.0
17.2
11.0
12.8
12.3
17.2
11.6
11.9
Go
vern
men
t fi
nal co
nsu
mp
tio
n
exp
en
dit
ure
2.
49.6
50.9
52.0
49.5
48.7
50.7
49.6
50.8
50.4
52.6
49.6
51.8
51.5
54.1
50.6
52.3
51.6
Pri
vate
fin
al co
nsu
mp
tio
n
exp
en
dit
ure
3.
23.7
26.7
27.7
23.1
24.0
23.2
24.3
25.0
28.6
26.8
26.3
27.1
29.0
28.0
26.6
27.2
29.2
Gro
ss f
ixed
cap
ital fo
rmati
on
3.1
Jenis
aset
Type o
f assets
3.1
.1 S
truktu
r
10.6
12.6
13.3
9.9
11.4
10.6
10.6
11.6
13.9
12.6
12.1
12.6
14.8
13.4
12.7
13.6
14.8
Str
uctu
re
3.1
.2 Jente
ra d
an p
era
lata
n
10.8
11.9
12.0
11.2
10.3
10.4
11.4
11.3
12.2
12.0
11.8
12.4
11.6
12.3
11.6
11.5
11.9
Machin
ery
and e
quip
ment
3.1
.3 A
set la
in
2.2
2.3
2.3
2.0
2.3
2.2
2.2
2.1
2.5
2.2
2.3
2.1
2.6
2.3
2.4
2.1
2.5
Oth
er
assets
3.2
Sekto
r
Secto
r
3.2
.1 A
wam
10.3
11.2
10.9
9.0
8.5
9.5
14.2
9.1
10.1
10.7
14.7
10.3
9.3
10.2
13.8
9.1
8.4
Public
3.2
.2 S
wasta
13.3
15.5
16.7
14.1
15.6
13.8
10.0
15.9
18.6
16.1
11.6
16.8
19.7
17.7
12.9
18.1
20.8
Private
4.
0.4
0.7
-0.2
2.0
2.0
0.6
-2.7
2.3
0.8
2.2
-2.1
1.2
1.8
-1.0
-2.5
-0.5
-1.5
Ch
an
ges in
in
ven
tori
es a
nd
valu
ab
les*
5.
100.3
93.2
89.5
100.4
101.4
99.9
99.6
96.9
96.5
90.0
89.9
89.8
88.3
89.6
90.4
91.3
90.3
Exp
ort
s o
f g
oo
ds a
nd
serv
ices
6.
87.3
84.7
82.5
86.0
87.6
86.8
88.9
86.4
88.3
83.6
80.8
81.1
83.4
83.0
82.3
81.8
81.4
less Im
po
rts o
f g
oo
ds a
nd
serv
ices
100.0
100.0
100.0
100.0
100.0
100.0
100.0
100.0
100.0
100.0
100.0
100.0
100.0
100.0
100.0
100.0
100.0
Exp
en
dit
ure
on
GD
P a
t
pu
rch
asers
' p
rices
* T
erm
asuk p
erb
ezaan s
tatistik
2013
p
2013
p2013
2013
* In
clu
siv
e s
tatistical dis
cre
pancy
2014
2014
Perb
ela
nja
an
pen
gg
un
aan
akh
ir
sw
asta
Peru
bah
an
in
ven
tori
dan
bara
ng
an
berh
arg
a*
Perb
ela
nja
an
pen
gg
un
aan
akh
ir
kera
jaan
Pem
ben
tukan
mo
dal te
tap
kasar
Typ
e o
f exp
en
dit
ure
2011
2012
e2011
2012
Perb
ela
nja
an
ata
s K
DN
K p
ad
a
harg
a p
em
beli
40
tola
k Im
po
rt b
ara
ng
an
dan
perk
hid
mata
n
Perb
ela
nja
an
pen
gg
un
aan
akh
ir
kera
jaan
Perb
ela
nja
an
pen
gg
un
aan
akh
ir
sw
asta
Pem
ben
tukan
mo
dal te
tap
kasar
Jen
is p
erb
ela
nja
an
Jen
is p
erb
ela
nja
an
tola
k Im
po
rt b
ara
ng
an
dan
perk
hid
mata
n
Peru
bah
an
in
ven
tori
dan
bara
ng
an
berh
arg
a*
Eksp
ort
bara
ng
an
dan
perk
hid
mata
n
Perb
ela
nja
an
ata
s K
DN
K p
ad
a
harg
a p
em
beli
Ja
du
al
18
B:
KD
NK
me
ng
iku
t J
en
is P
erb
ela
nja
an
pa
da
Ha
rga
Ma
lar
20
05
- P
em
ba
ha
gia
n p
era
tus
ke
pa
da
KD
NK
Ta
ble
18
B:
GD
P b
y T
yp
e o
f E
xp
en
dit
ure
at
Co
ns
tan
t 2
00
5 P
ric
es
- P
erc
en
tag
e s
ha
re t
o G
DP
Eksp
ort
bara
ng
an
dan
perk
hid
mata
n
Ja
du
al
18
A:
KD
NK
me
ng
iku
t J
en
is P
erb
ela
nja
an
pa
da
Ha
rga
Se
ma
sa
- P
em
ba
ha
gia
n p
era
tus
ke
pa
da
KD
NK
Ta
ble
18
A:
GD
P b
y T
yp
e o
f E
xp
en
dit
ure
at
Cu
rre
nt
Pri
ce
s -
Pe
rce
nta
ge
sh
are
to
GD
P
2011
2012
e2011
2012
Typ
e o
f exp
en
dit
ure
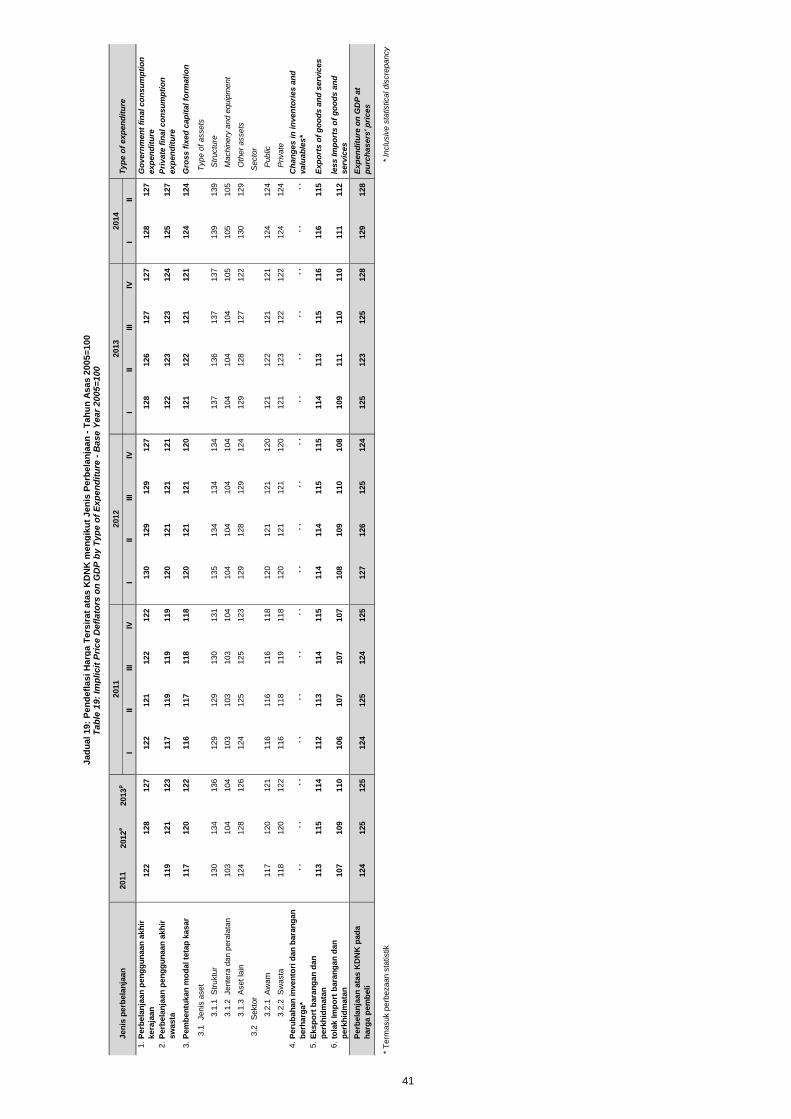
III
III
IVI
IIIII
IVI
IIIII
IVI
II
1.
122
128
127
122
121
122
122
130
129
129
127
128
126
127
127
128
127
Go
vern
men
t fi
nal co
nsu
mp
tio
n
exp
en
dit
ure
2.
119
121
123
117
119
119
119
120
121
121
121
122
123
123
124
125
127
Pri
vate
fin
al co
nsu
mp
tio
n
exp
en
dit
ure
3.
117
120
122
116
117
118
118
120
121
121
120
121
122
121
121
124
124
Gro
ss f
ixed
cap
ital fo
rmati
on
3.1
Jenis
aset
Type o
f assets
3.1
.1 S
truktu
r
130
134
136
129
129
130
131
135
134
134
134
137
136
137
137
139
139
Str
uctu
re
3.1
.2 Jente
ra d
an p
era
lata
n
103
104
104
103
103
103
104
104
104
104
104
104
104
104
105
105
105
Machin
ery
and e
quip
ment
3.1
.3 A
set la
in
124
128
126
124
125
125
123
129
128
129
124
129
128
127
122
130
129
Oth
er
assets
3.2
Sekto
r
Secto
r
3.2
.1 A
wam
117
120
121
116
116
116
118
120
121
121
120
121
122
121
121
124
124
Public
3.2
.2 S
wasta
118
120
122
116
118
119
118
120
121
121
120
121
123
122
122
124
124
Private
4.
. .
. .
. .
. .
. .
. .
. .
. .
. .
. .
. .
. .
. .
. .
. .
. .
. .
Ch
an
ges in
in
ven
tori
es a
nd
valu
ab
les*
5.
113
115
114
112
113
114
115
114
114
115
115
114
113
115
116
116
115
Exp
ort
s o
f g
oo
ds a
nd
serv
ices
6.
107
109
110
106
107
107
107
108
109
110
108
109
111
110
110
111
112
less Im
po
rts o
f g
oo
ds a
nd
serv
ices
124
125
125
124
125
124
125
127
126
125
124
125
123
125
128
129
128
Exp
en
dit
ure
on
GD
P a
t
pu
rch
asers
' p
rices
* T
erm
asuk p
erb
ezaan s
tatistik
41
* In
clu
siv
e s
tatistical dis
cre
pancy
tola
k Im
po
rt b
ara
ng
an
dan
perk
hid
mata
n
Perb
ela
nja
an
ata
s K
DN
K p
ad
a
harg
a p
em
beli
Perb
ela
nja
an
pen
gg
un
aan
akh
ir
kera
jaan
Perb
ela
nja
an
pen
gg
un
aan
akh
ir
sw
asta
Pem
ben
tukan
mo
dal te
tap
kasar
Peru
bah
an
in
ven
tori
dan
bara
ng
an
berh
arg
a*
Eksp
ort
bara
ng
an
dan
perk
hid
mata
n
2014
Ja
du
al
19
: P
en
de
fla
si
Harg
a T
ers
ira
t a
tas
KD
NK
me
ng
iku
t J
en
is P
erb
ela
nja
an
- T
ah
un
As
as
20
05
=1
00
Ta
ble
19
: Im
pli
cit
Pri
ce
De
fla
tors
on
GD
P b
y T
yp
e o
f E
xp
en
dit
ure
- B
as
e Y
ea
r 2
00
5=
10
0
2011
2011
Typ
e o
f exp
en
dit
ure
2012
e2012
Jen
is p
erb
ela
nja
an
2013
p2013

42
This page is deliberately left blank.
Muka surat ini sengaja dibiarkan kosong.
SEKSYEN 4:
NOTA TEKNIKAL
SECTION 4: TECHNICAL NOTES

NOTA TEKNIKAL TECHNICAL NOTES
43
PENGENALAN Penerbitan ini membentangkan data Keluaran Dalam Negeri Kasar (KDNK) bagi suku pertama 2011 hingga suku kedua 2014. Data KDNK ini diterbitkan berdasarkan tahun asas 2005. Secara konsepnya tahun asas 2005 membawa maksud semua transaksi barangan dan perkhidmatan dinilai semula berdasarkan harga tahun 2005. Anggaran ini disusun berdasarkan garis panduan Sistem Akaun Negara 1993 (1993 SNA). Di samping itu, beberapa saranan 2008 SNA telah diguna pakai iaitu penyusunan Perkhidmatan Perantaraan Kewangan yang Diukur Secara Tidak Langsung (FISIM), perluasan konsep Pembentukan Modal Tetap Kasar merangkumi Sistem Persenjataan dan Penyelidikan & Pembangunan (R&D). KELUARAN DALAM NEGERI KASAR (KDNK) KDNK adalah jumlah nilai barangan dan perkhidmatan yang dikeluarkan dalam tempoh tertentu selepas ditolak kos barang dan perkhidmatan yang digunakan dalam proses pengeluaran. Nilai ini merupakan nilai sebelum ditolak nilai penggunaan modal tetap; iaitu jumlah nilai ditambah pada harga pengeluar bagi pengeluar residen ditambah dengan duti import. KDNK ini juga bersamaan dengan perbelanjaan ke atas KDNK (pada harga pembeli) iaitu jumlah bagi semua komponen perbelanjaan akhir ke atas barangan dan perkhidmatan tolak dengan import barangan dan perkhidmatan.
INTRODUCTION This publication presents data of Gross Domestic Product (GDP) for the first quarter of 2011 to second quarter of 2014. The GDP data are published based on 2005 base year. Conceptually, the 2005 base year refers to transaction of all goods and services revalued based on the prices in 2005. The estimation was compiled based on the concept of System of National Accounts 1993 (1993 SNA). In addition, selected recommendations from 2008 SNA was adopted namely Financial Intermediation Services Indirectly Measured (FISIM), enhancement in the concepts of Gross Fixed Capital Formation inclusive of Weapons System and Research & Development (R&D).
GROSS DOMESTIC PRODUCT (GDP) GDP is the total value of all goods and services produced in a certain period after deducting the cost of goods and services used up in the process of production. This value is before deducting allowances for consumption of fixed capital i.e. the sum of value added of resident producers in producers’ value plus import duties. GDP is equivalent to expenditure on the GDP (in purchasers’ price) i.e. the sum of all components of final expenditure on goods and services less imports of goods and services.
KDNK boleh diukur dengan menggunakan tiga kaedah iaitu Kaedah Pengeluaran, Perbelanjaan dan Pendapatan. Namun begitu, penerbitan ini membentangkan Kaedah Pengeluaran dan Perbelanjaan sahaja. KAEDAH PENGELUARAN KDNK berasaskan Kaedah Pengeluaran boleh didefinisikan sebagai jumlah nilai barangan dan perkhidmatan yang dikeluarkan di Malaysia setelah ditolak dengan nilai penggunaan perantaraan. Kaedah ini turut dikenali sebagai kaedah nilai ditambah yang mana ia menunjukkan sumbangan setiap aktiviti ekonomi terhadap keseluruhan KDNK.
GDP can be measured by using three approaches namely Production, Expenditure and Income Approach. However, this publication only presents Production and Expenditure Approach. PRODUCTION APPROACH GDP based on Production Approach is defined as value of total production of goods and services produced in Malaysia after deducting value of intermediate consumption. This approach is also known as value added approach which will be able to show the contribution of each economic activity on overall GDP.
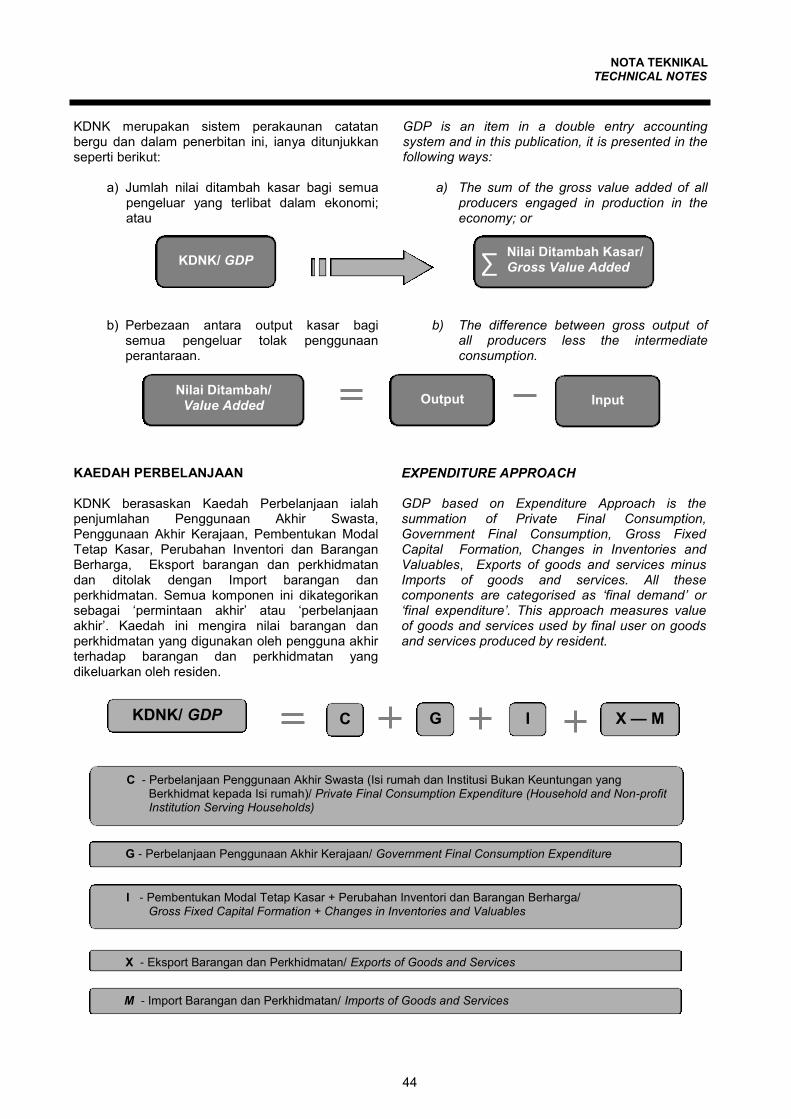
NOTA TEKNIKAL TECHNICAL NOTES
44
KDNK merupakan sistem perakaunan catatan bergu dan dalam penerbitan ini, ianya ditunjukkan seperti berikut:
a) Jumlah nilai ditambah kasar bagi semua pengeluar yang terlibat dalam ekonomi; atau
b) Perbezaan antara output kasar bagi
semua pengeluar tolak penggunaan perantaraan.
GDP is an item in a double entry accounting system and in this publication, it is presented in the following ways:
a) The sum of the gross value added of all producers engaged in production in the economy; or
b) The difference between gross output of
all producers less the intermediate consumption.
EXPENDITURE APPROACH GDP based on Expenditure Approach is the summation of Private Final Consumption, Government Final Consumption, Gross Fixed Capital Formation, Changes in Inventories and Valuables, Exports of goods and services minus Imports of goods and services. All these components are categorised as ‘final demand’ or ‘final expenditure’. This approach measures value of goods and services used by final user on goods and services produced by resident.
KAEDAH PERBELANJAAN KDNK berasaskan Kaedah Perbelanjaan ialah penjumlahan Penggunaan Akhir Swasta, Penggunaan Akhir Kerajaan, Pembentukan Modal Tetap Kasar, Perubahan Inventori dan Barangan Berharga, Eksport barangan dan perkhidmatan dan ditolak dengan Import barangan dan perkhidmatan. Semua komponen ini dikategorikan sebagai ‘permintaan akhir’ atau ‘perbelanjaan akhir’. Kaedah ini mengira nilai barangan dan perkhidmatan yang digunakan oleh pengguna akhir terhadap barangan dan perkhidmatan yang dikeluarkan oleh residen.
C - Perbelanjaan Penggunaan Akhir Swasta (Isi rumah dan Institusi Bukan Keuntungan yang Berkhidmat kepada Isi rumah)/ Private Final Consumption Expenditure (Household and Non-profit Institution Serving Households)
G - Perbelanjaan Penggunaan Akhir Kerajaan/ Government Final Consumption Expenditure
I - Pembentukan Modal Tetap Kasar + Perubahan Inventori dan Barangan Berharga/ Gross Fixed Capital Formation + Changes in Inventories and Valuables
X - Eksport Barangan dan Perkhidmatan/ Exports of Goods and Services
M - Import Barangan dan Perkhidmatan/ Imports of Goods and Services
KDNK/ GDP Nilai Ditambah Kasar/ Gross Value Added ∑
Output
Input Nilai Ditambah/
Value Added
C G I X — M KDNK/ GDP
NOTA TEKNIKAL TECHNICAL NOTES
45
GDP AT CONSTANT PRICES GDP at constant prices is the value of GDP without price effect. GDP at constant prices enables actual comparison to be made for changes in level of production/ volume of goods and services occurred in economic activity.
KDNK PADA HARGA MALAR KDNK pada harga malar ialah nilai KDNK tanpa kesan harga. KDNK pada harga malar ini penting bagi membolehkan perbandingan sebenar perubahan tingkat pengeluaran/ kuantiti barangan dan perkhidmatan yang berlaku dalam aktiviti ekonomi.
PENGIMBANGAN ANTARA ANGGARAN PENGELUARAN DAN PERBELANJAAN Secara teorinya, anggaran KDNK bagi kedua-dua kaedah harus menghasilkan nilai yang sama. Walau bagaimanapun, secara praktikal, anggaran nilai bagi kedua-dua kaedah ini tidak akan sama kerana penggunaan sumber data yang berlainan. Perbezaan ini dikenali sebagai “Perbezaan Statistik” dalam Sistem Akaun Negara.
BALANCING BETWEEN THE PRODUCTION AND EXPENDITURE ESTIMATES Theoretically, the estimated GDP for both approaches should arrive at the same value. However, in practice, the estimated value by both approaches will not be equal due to the usage of different data sources. These differences are known as “Statistical Discrepancy” in National Accounts System.
KDNK Kaedah Perbelanjaan/ GDP Expenditure Approach
Perbezaan Statistik/ Statistical Discrepancy
KDNK Kaedah Pengeluaran/
GDP Production Approach
VALUATION OF TRANSACTIONS Estimation is expressed in two types of prices namely current prices and constant prices (base year 2005). Various techniques have been used to estimate value at current and constant prices.
PENILAIAN TRANSAKSI Anggaran dinyatakan dalam dua jenis harga iaitu harga semasa dan harga malar (tahun asas 2005). Pelbagai teknik digunakan dalam membuat nilai anggaran pada harga semasa dan malar.
IMPLICIT PRICE DEFLATOR In deriving the constant prices series, direct deflation method which consists of single deflation and double deflation is used. The single deflation method removes the price effect from the estimated output or input, while double deflation method eliminates the price effect from both the output and input. Hence, value added is obtained as residual by subtracting input from output. Main price indices that are being used widely are Producer Price Index and Consumer Price Index. Meanwhile, for goods and services which are not in both indices, information on prices are obtained from establishments involved. The information is then transformed into derived price indices specially for those goods and services.
PENDEFLASI HARGA TERSIRAT Bagi mendapatkan siri harga malar, kaedah deflasi langsung yang terdiri daripada deflasi tunggal dan deflasi berganda digunakan. Kaedah deflasi tunggal menghapuskan pengaruh harga daripada output atau input yang telah dianggarkan manakala kaedah deflasi berganda pula menghapuskan pengaruh harga daripada output dan input. Oleh itu, nilai ditambah diperoleh sebagai perbezaan hasil tolak input daripada output. Indeks harga utama yang digunakan secara meluas ialah Indeks Harga Pengeluar dan Indeks Harga Pengguna. Sementara itu, bagi barangan dan perkhidmatan yang tidak terdapat dalam kedua-dua indeks ini, maklumat harga diperoleh daripada pertubuhan yang terlibat. Maklumat ini kemudiannya dijadikan indeks harga terbitan khusus bagi barangan dan perkhidmatan tersebut.
NOTA TEKNIKAL TECHNICAL NOTES
46
RELATION BETWEEN GDP ESTIMATES AND BALANCE OF PAYMENTS The national accounts series published in this publication is consistent with the annual estimates of balance of payments published by DOSM. These two estimates show a complete statement of Malaysia transaction with other countries at current prices. CLASSIFICATION
GDP compilation corresponds with the following classifications;
Malaysia Standard Industrial Classification (MSIC 2000);
Malaysia Classification of Product by Activity (MCPA 2005);
Classification of the Functions of Government (COFOG);
Classification of Individual Consumption by Purposes (COICOP); and
Standard International Trade Classification (SITC).
HUBUNGAN ANTARA ANGGARAN KDNK DAN IMBANGAN PEMBAYARAN Siri akaun negara yang dikeluarkan dalam penerbitan ini adalah konsisten dengan anggaran tahunan imbangan pembayaran yang dikeluarkan oleh Jabatan Perangkaan. Kedua-dua anggaran ini menunjukkan penyata yang lengkap mengenai transaksi antara Malaysia dengan negara-negara lain pada harga semasa.
KLASIFIKASI
Penyusunan KDNK selaras dengan klasifikasi seperti berikut;
Piawaian Klasifikasi Industri Malaysia (MSIC 2000);
Malaysia Classification of Product by Activity (MCPA 2005);
Classification of the Functions of Government (COFOG);
Classification of Individual Consumption by Purposes (COICOP); dan
Standard International Trade Classification (SITC).
OUTPUT Output ialah nilai barangan dan perkhidmatan yang dikeluarkan. Ini termasuk pengeluaran untuk pasaran, pengeluaran untuk kegunaan sendiri dan pengeluaran bukan pasaran (perkhidmatan kerajaan dan NPISHs). Pengeluaran barangan dan perkhidmatan tidak semestinya untuk dijual atau perolehan oleh pertubuhan. PENGGUNAAN PERANTARAAN Penggunaan perantaraan ialah nilai barangan dan perkhidmatan yang digunakan (sebagai input) dalam proses pengeluaran barangan dan perkhidmatan tidak termasuk gaji dan upah, susut nilai daripada modal dan faedah bersih yang dibayar.
OUTPUT Output is the value of goods and services produced. This includes market production, production for own final use, and non-market production (government services and NPISHs). Production of goods and services is not necessarily for sale or turnover of establishment. INTERMEDIATE CONSUMPTION Intermediate consumption is the value of goods and services consumed (as input) in the production process of goods and services excluded salaries and wages, depreciation of capital and net interest paid.
NILAI DITAMBAH Nilai ditambah ialah perbezaan di antara output dan penggunaan perantaraan. Ia merupakan nilai ditambah barangan dan perkhidmatan dalam aktiviti ekonomi. Oleh itu, ia hampir menyamai dengan keuntungan perniagaan, gaji dan upah, susut nilai dan cukai tidak langsung; campur faedah yang dibayar dan tolak faedah yang diterima.
VALUE ADDED Value added is the difference between output and intermediate consumption. It represents the added value of goods and services by economic activity. Hence, it is approximately equivalent to commercial profit, salaries and wages, depreciation and indirect taxes; plus interest paid less interest received.
NOTA TEKNIKAL TECHNICAL NOTES
47
KAEDAH AM DALAM PENGANGGARAN AKAUN NEGARA SUKU TAHUNAN Anggaran suku tahunan bagi aktiviti ekonomi dan komponen perbelanjaan dibuat dengan menggunakan maklumat bulanan/ suku tahunan bagi kuantiti, nilai dan harga. Anggaran ini dibuat pada harga semasa dan malar. Seterusnya, anggaran suku tahunan diselaraskan dengan anggaran tahunan menggunakan teknik tanda aras. Teknik ini digunakan bagi anggaran suku tahunan sehingga tahun 2011 dan bagi beberapa aktiviti sehingga tahun 2012/ 2013. Anggaran KDNK suku tahunan adalah sebahagian rangkuman daripada anggaran tahunan. Oleh yang demikian, sumber data dan kaedah tahunan turut digunakan sebagai rujukan.
GENERAL APPROACH OF QUARTERLY NATIONAL ACCOUNTS ESTIMATION The quarterly estimates for economic activity and expenditure components are derived from the monthly/ quarterly information on quantity, value and price. The estimates were done at current and constant prices. Subsequently, the quarterly estimates were aligned with the annual estimates by using the benchmarking technique. This technique is applied for quarterly estimates up to year 2011 and in some instances up to 2012/ 2013. Estimating quarterly GDP is an integral part of annual estimates. Hence, annual data sources and methods has been used as well for references.
CUKAI Di dalam perakaunan negara, cukai dinyatakan dalam dua bentuk iaitu:
a) CUKAI TIDAK LANGSUNG
Cukai tidak langsung dianggap sebagai kos pengeluaran, di mana ia adalah sebahagian daripada komponen nilai ditambah. Oleh itu, cukai tidak langsung perlu ditambah pada nilai barangan dan perkhidmatan. Cukai tidak langsung termasuk cukai jualan, cukai nilai ditambah, duti eksais, cukai pintu dan lain-lain.
b) CUKAI LANGSUNG
Cukai langsung ialah cukai ke atas keuntungan atau pendapatan, di mana ia merupakan pengagihan semula pendapatan dari sektor swasta kepada sektor kerajaan dan bukan dalam bentuk kos pengeluaran. Dalam konteks Malaysia, cukai pendapatan merupakan cukai langsung yang paling utama.
TAXES In national accounts, taxes are expressed in two forms:
a) INDIRECT TAXES
Indirect taxes are regarded as a cost of production, which are part of value added component. Hence, indirect taxes must be added to the value of goods and services. Indirect taxes include sales tax, value added taxes, excise duties, quit rent and etc.
b) DIRECT TAXES
Direct taxes are taxes on profits or incomes, which constitute of a redistribution of income from the private sector to the government and it is not in the form of production cost. In Malaysia’s context, income tax is the most significant direct tax.
NOTA TEKNIKAL TECHNICAL NOTES
48
PELARASAN MUSIM
Data siri masa amat berguna bagi mengenalpasti
ciri-ciri penting dalam ekonomi seperti arah, titik
perubahan dan keselarian indikator ekonomi yang
lain. Kadangkala, ciri-ciri ini sukar dilihat kerana
pergerakan musim. Sehubungan itu, adalah
penting untuk menghilangkan kesan ini dari data
siri masa dengan melaksanakan pelarasan musim.
Pelarasan musim adalah satu teknik statistik yang
digunakan untuk mengeluarkan kesan musim dan
kalendar yang mengganggu pergerakan sebenar
siri masa. Objektif proses ini adalah untuk
menggambarkan tren dan pergerakan jangka
pendek dalam siri masa.
a. KOMPONEN DATA SIRI MASA
Data siri masa merupakan kombinasi tiga jenis
komponen yang berbeza iaitu Trend-Cycle, Kesan
musim dan Luar jangkaan. Setiap komponen
mewakili kesan daripada peristiwa-peristiwa
sebenar yang berlaku ke atas data:
Trend-Cycle mewakili tren dan arah tuju sesuatu
siri. Ia meliputi aliran jangka panjang siri tersebut di
samping kitaran perniagaan jangka sederhana.
Kesan bermusim terdiri daripada kesan musim
tetap dan kesan musim bergerak. Kesan musim
tetap ialah kitaran corak yang terhasil daripada
perubahan musim seperti;
Cuaca: contohnya, musim monsun biasanya
berlaku pada suku keempat setiap tahun;
Prosedur pentadbiran: contohnya, tarikh
permulaan dan akhir penggal persekolahan;
Acara sosial/ kebudayaan/ keagamaan:
contohnya jualan runcit akan meningkat setiap
kali menjelang musim perayaan.
SEASONAL ADJUSTMENT
Time series data are very useful in identifying the
important features of economic series such as
direction, turning point and consistency between
other economic indicators. Sometimes, these
features are difficult to observe due to seasonal
movements. Therefore, it is essential to remove the
seasonal effects from the time series data by
applying seasonal adjustment.
Seasonal adjustment is a statistical technique to
remove seasonal and calendar effects, which may
otherwise conceal and distort the true underlying
movement of time series. The objective of the
process is to highlight the underlying trends and
short-term movements in the series.
a. COMPONENTS OF A TIME SERIES
Time series is a combination of three different
components namely Trend-cycle, Seasonal
effects and Irregular. Each components
represents the impact of real world events on the
data:
Trend-cycle represents the underlying trend and
direction of the series. It captures the long-term
trend of the series as well as the medium-term
business cycles.
Seasonal effects comprises stable seasonal
effects and moving seasonal effects. Stable
seasonal effects are cyclical patterns that may
evolve as the result of changes associated with the
seasons such as;
Weather: for example, the monsoon season
usually occur in fourth quarter of the year;
Administrative procedures: for example, the
beginning and end dates of the school year;
Social/ cultural/ religious events: for example,
retail sales increasing during festive seasons.
NOTA TEKNIKAL TECHNICAL NOTES
49
Manakala kesan musim bergerak adalah
berkaitan dengan faktor-faktor yang berlaku
dalam bulan atau suku tahun berbeza pada
setiap tahun. Ianya termasuklah:
Kesan hari urusniaga yang disebabkan oleh
perbezaan jumlah hari dan minggu dari tahun
ke tahun; contohnya kos perbelanjaan di
pasaraya lebih tinggi bagi bulan yang
mempunyai lima minggu berbanding empat
minggu;
Cuti bergerak yang mungkin berlaku dalam
bulan yang berbeza dari tahun ke tahun,
seperti Hari Raya Aidilfitri yang boleh berlaku
dalam suku tahun yang berbeza.
Komponen Luar Jangkaan boleh terhasil
daripada faktor-faktor yang tidak dapat dijangka
seperti: ralat pensampelan, ralat bukan
pensampelan, cuaca yang tidak menentu,
bencana alam, polisi baru kerajaan dan corak
permintaan di luar jangkaan.
b. MODEL PENGHURAIAN
Prosedur pelarasan musim biasanya menggunakan
kaedah penghuraian data siri masa kepada
komponen-komponen tersembunyi yang
menggambarkan pergerakan trend-cycle, faktor
musim dan elemen luar jangkaan. Selain itu,
adalah diandaikan bahawa kombinasi data siri
masa ini boleh berlaku secara additive atau
multiplicative.
Dalam penghuraian multiplicative, kesan musim
berubah secara berkadar dengan tren. Sekiranya
tren meningkat, maka kesan musim juga akan
meningkat. Sementara itu, sekiranya tren menurun,
kesan musim turut akan berkurangan. Dalam
penghuraian additive, kesan bermusim kekal pada
nilai yang sama tanpa mengira pergerakan tren.
Secara praktikalnya, kebanyakan siri masa
ekonomi menunjukkan hubungan multiplicative
yang kebiasaannya memberikan hasil yang lebih
tepat.
Meanwhile, moving seasonal effects are related
to the factors which occur in the different month
or quarter of each year. They include:
Trading day effects which are caused by
months having different numbers of day and
week from year to year: for example, spending
in supermarket is likely to be higher in a month
with five weeks rather than four weeks;
Moving holidays which may fall in different
months from year to year, for example Eid-ul
Fitr can occur in different quarter.
Irregular components may occur due to
unpredictable factors, such as: sampling error,
non-sampling error, unseasonable weather,
natural disasters, new government policies and
unexpected demand pattern.
b. DECOMPOSITION MODEL
Seasonal adjustment procedures commonly use a
decomposition of a time series into unobservable
components that reflect trend-cycle, seasonal and
irregular movements. Further, it is assumed that the
series can be made up by combining these
components either additively or multiplicatively.
In a multiplicative decomposition, the seasonal
effects change proportionately with the trend. If the
trend rises, the seasonal effects increase
accordingly, while if the trend moves downward the
seasonal effects will diminish. In an additive
decomposition, the seasonal effects remain broadly
constant no matter which direction the trend is
moving in.
In practice, most economic time series exhibit a
multiplicative relationship and hence, the
multiplicative decomposition usually provides the
best fit.
NOTA TEKNIKAL TECHNICAL NOTES
50
Namun begitu, penghuraian multiplicative tidak
boleh dilaksanakan sekiranya terdapat nilai kosong
atau negatif dalam siri masa yang dikaji.
Dengan meletakkan nilai dalam satu tempoh t ke
atas data siri masa yang belum dilaraskan (ut) dan
nilai ke atas setiap komponen trend-cycle (ct),
faktor bermusim (st) dan faktor luar jangkaan (it)
masing-masing, model penghuraian multiplicative
yang digunakan dalam pengiraan pelarasan musim
boleh ditunjukkan seperti berikut;
ut = ct * st * it
Nilai pelarasan musim pada tempoh t bagi satu siri
masa (at) diperoleh melalui;
at = (ut / st) = (ct * it)
c. X12-ARIMA
Jabatan Perangkaan Malaysia menggunakan
program X12-ARIMA yang dibangunkan oleh US
Census Bureau untuk melaksanakan pelarasan
musim. Program ini digunakan secara meluas di
kebanyakan agensi statistik nasional dan agensi
antarabangsa.
Pelarasan musim yang menggunakan X12-ARIMA
mempunyai beberapa syarat minimum bagi
pelaksanaan beberapa fungsi:
Minimum 3 tahun data siri masa untuk
X12-ARIMA mengeluarkan model atau
perkara-perkara berhubung dengan pelarasan
musim.
Data 5 tahun dan 3 bulan (5 tahun dan satu
suku tahun) diperlukan untuk X12-ARIMA
menyediakan model ARIMA secara automatik
dan mengira dengan tepat semua kriteria yang
diperlukan untuk menguji model (terutamanya
average forecast error bagi tempoh 3 tahun
terakhir). Sekiranya siri data tidak mencukupi,
pengguna boleh menggunakan model sendiri.
X12-ARIMA menggunakan semua data yang
tersedia semasa menyediakan model ARIMA.
However, a multiplicative decomposition cannot be
implemented if any zero or negative values
appear in the time series.
By denoting the value in period t of an unadjusted
time series (ut) and the respective values of its
components trend-cycle (ct), seasonal factor (st)
and irregular (it), the multiplicative decomposition
model, as used for seasonal adjustment
calculations can be written as;
ut = ct * st * it
The seasonally adjusted value in period t for a time
series (at) is then obtained as;
at = (ut / st) = (ct * it)
c. X12-ARIMA
DOSM uses the X12-ARIMA programme which was
developed by the US Census Bureau in carrying
out seasonal adjustment. This programme is widely
used among national statistical offices and
international agencies.
Seasonal adjustment by X12-ARIMA has a few
absolute minimum for certain functions to work:
3 years of data are the minimum for
X12-ARIMA to model or do any sort of
seasonal adjustment.
5 years and 3 months (5 years and one
quarter) of data are needed for X12-ARIMA to
automatically fit an ARIMA model and to
calculate correctly all the criteria to test the
models (especially the average forecast error
for the last 3 years). If there is less data, then
the user can impose their own model.
X12-ARIMA uses all the data available when
fitting an ARIMA model.
NOTA TEKNIKAL TECHNICAL NOTES
51
d. KESAN CUTI BERGERAK DI MALAYSIA
Data siri masa ekonomi Malaysia dipengaruhi oleh
perayaan-perayaan utama keagamaan seperti Hari
Raya Aidilfitri bagi umat Islam, Tahun Baru Cina
bagi kaum Cina dan Deepavali bagi kaum India.
Perayaan utama di negara ini kebiasaannya
berkaitan dengan aktiviti keagamaan dan tarikh
perayaan tersebut ditentukan oleh kalendar agama
masing-masing. Tarikh cuti ini tidak sejajar dengan
kalendar Gregorian. Oleh itu, tarikh tersebut
cenderung untuk bergerak di sepanjang kalendar
Gregorian dan memberikan kesan musim kepada
siri masa ekonomi. Cuti yang tidak tetap ini
memberikan impak besar terhadap data siri masa.
Oleh itu, langkah perlu diambil dalam
melaksanakan proses pelarasan musim bagi
mengelakkan kekeliruan dalam data pelarasan
musim dan anggaran tren. Tambahan pula, kesan
cuti tidak tetap boleh merumitkan pentafsiran data.
Pendekatan yang digunakan untuk pelarasan
musim di Malaysia ialah Seasonal Adjustment for
Malaysia (SEAM). SEAM adalah satu prosedur
untuk menyingkirkan kesan cuti bergerak bagi data
yang terpilih dalam siri masa ekonomi Malaysia
dengan memperkenalkan beberapa langkah untuk
mengatasi prosedur pelarasan musim yang sedia
ada. Untuk melaksanakan prosedur SEAM,
program X-ARIMA yang boleh didapati dalam
Statistical Analysis Software (SAS) digunakan.
e. KAEDAH PELARASAN TIDAK LANGSUNG
Jabatan Perangkaan Malaysia telah menjalankan
ujian pelarasan musim ke atas 39 jenis aktiviti
ekonomi dari segi penawaran dan 5 jenis
komponen dari segi permintaan. KDNK pelarasan
musim diperoleh secara tidak langsung dengan
menjumlahkan 39 jenis aktiviti ekonomi yang telah
diselaraskan musim. Perbezaan di antara
penawaran dan permintaan yang telah
diselaraskan musim akan diletakkan dalam
perubahan inventori.
d. MOVING HOLIDAY EFFECT IN MALAYSIA
Malaysia’s economic time series data are affected
by major religious festivals such as the Eid-ul Fitr
for the Muslims, the Chinese New Year for the
Chinese and the Deepavali for the Indian.
The major festivals in this country are usually
related to the religious activities and the dates are
determined by the respective religious calendar.
The dates of these holidays are not in line with the
Gregorian calendar. Hence, they tend to move
along the Gregorian calendar and strong seasonal
influence on the economic time series. Since, these
non-fixed holidays have a large impacts on the
times series data, they need to be taken into
account when performing seasonal adjustment
process to avoid confusion in seasonally adjusted
data and trend estimates. Furthermore, the
presence of non-fixed holiday effects may
complicate the interpretation of the data.
The approach used for seasonal adjustment in
Malaysia is the Seasonal Adjustment for Malaysia
(SEAM). SEAM is a procedure to remove moving
holiday effects on the selected Malaysian economic
time series data by introducing steps that can be
used to overcome the limitations of the existing
seasonal adjustment procedure. To apply the
SEAM procedure, the X-ARIMA programme which
is available in Statistical Analysis Software (SAS) is
used.
e. INDIRECT METHOD OF ADJUSTMENT
DOSM has carried out the seasonal adjustment test
on 39 types of economic activities on the supply
side and 5 types of components on the demand
side. The seasonally adjusted GDP is arrived
indirectly by summing up the 39 types of seasonal
adjusted economic activities. The balancing item
between the seasonally adjusted supply and
demand sides will be added up in changes in
inventories.
NOTA TEKNIKAL TECHNICAL NOTES
52
PENERBITAN DAN SEMAKAN DATA Anggaran KDNK suku tahunan bermula dari suku pertama 2011 hingga suku pertama 2014 telah disemak semula berdasarkan kepada anggaran tahunan yang telah dikemaskini.
Praktis yang diamalkan oleh Jabatan Perangkaan Malaysia bagi semakan data ialah : Suku Tahun Pertama, Kedua, Ketiga dan Keempat: Anggaran pertama akan dikeluarkan 7 minggu selepas suku tahun rujukan. Anggaran semakan akan dikeluarkan pada suku tahun berikutnya. Anggaran tahunan awalan: Tidak lewat daripada 7 minggu selepas berakhirnya tahun rujukan berkenaan seiring dengan anggaran suku tahunan keempat. Anggaran tahunan disemak bagi tahun semasa dan dua tahun ke belakang berdasarkan data terkini banci/ penyiasatan dan sumber-sumber lain. Anggaran bagi dua belas suku tahunan ke belakang turut diselaraskan dengan semakan anggaran tahunan. Anggaran semakan ini dikeluarkan dalam tempoh lima bulan selepas berakhirnya tahun semasa.
PUBLICATION AND DATA REVISION The quarterly GDP estimates from first quarter of 2011 to first quarter of 2014 were revised based on updated annual estimates. The practice adopted by DOSM for data revision is: First, Second, Third and Fourth Quarter: First estimate will be released 7 weeks after the end of the reference quarter. Revised estimates will be produced at the following quarter. Preliminary annual estimates: Not later than 7 weeks after the end of the particular reference year parallel with estimates of fourth quarter. Revised annual estimates for the current year and previous two years are based on the latest census/ surveys data available and other sources. The estimates of previous twelve quarters also have been revised to align with the revision of annual estimates. The revision estimates is produced five months after the end of current year.
METODOLOGI METHODOLOGY
53
Kuantiti pengeluaran dan maklumat harga berkaitan secara suku tahunan digunakan untuk mendapat nilai output pada harga semasa dan malar seperti berikut:
Getah: pengeluaran getah;
Kelapa Sawit: pengeluaran minyak sawit mentah dan isi rong sawit;
Ternakan: indikator berkaitan;
Pertanian Lain: indikator berkaitan;
Perhutanan dan Pembalakan: pengeluaran kayu balak; dan
Perikanan: kuantiti pendaratan ikan laut dan akuakultur.
Nisbah input-output terkini pada harga malar digunakan untuk mendapatkan penggunaan perantaraan pada harga malar; yang kemudiannya dinaikkan untuk mendapatkan nilai penggunaan perantaraan pada harga semasa. Nilai ditambah diperoleh sebagai baki hasil tolak penggunaan perantaraan daripada output.
Kuantiti pengeluaran dan maklumat harga berkaitan secara suku tahunan digunakan untuk mendapat nilai output pada harga semasa dan malar seperti berikut:
Minyak Mentah, Kondensat dan Gas Asli: pengeluaran minyak mentah, kondensat dan gas asli; dan
Perlombongan Lain: kuantiti mengikut jenis mineral.
Nisbah input-output terkini pada harga malar digunakan untuk mendapatkan penggunaan perantaraan pada harga malar; yang kemudiannya dinaikkan untuk mendapatkan nilai penggunaan perantaraan pada harga semasa. Nilai ditambah diperoleh sebagai baki hasil tolak penggunaan perantaraan daripada output.
Quantity of production and relevant prices information on quarterly basis are used to obtain output at current and constant prices as follows:
Rubber: production of rubber;
Oil Palm: production of crude palm oil and palm kernel;
Livestock: relevant indicators;
Other Agriculture: relevant indicators;
Forestry and Logging: production of logs; and
Fishing: quantity of landed marine fish and aquaculture.
The latest available constant prices input-output ratio is used to derive intermediate consumption at constant prices; inflating this gives intermediate consumption at current prices. Value added are derived as residuals by subtracting intermediate consumption from output.
Quantity of production and relevant prices information on quarterly basis are used to obtain output at current and constant prices as follows:
Crude Oil, Condensate and Natural Gas: production of crude oil, condensate and natural gas; and
Other Mining: quantity by type of minerals. The latest available constant prices input-output ratio is used to derive intermediate consumption at constant prices; inflating this gives intermediate consumption at current prices. Value added are derived as residuals by subtracting intermediate consumption from output.
SEKTOR PERTANIAN AGRICULTURE SECTOR
ANGGARAN PENGELUARAN/ ESTIMATION OF PRODUCTION
SEKTOR PERLOMBONGAN DAN PENGKUARIAN
MINING AND QUARRYING SECTOR
53
METODOLOGI METHODOLOGY
54
Penyiasatan Pembuatan Bulanan, Indeks Pengeluaran Perindustrian dan indeks harga berkaitan digunakan untuk membuat anggaran output dan nilai ditambah pada harga semasa dan malar.
Nilai kerja binaan secara suku tahunan digunakan untuk menganggar output pada harga semasa.
Nisbah input-output terkini pada harga malar digunakan untuk mendapatkan penggunaan perantaraan pada harga malar; yang kemudiannya dinaikkan untuk mendapatkan nilai penggunaan perantaraan pada harga semasa. Nilai ditambah diperoleh sebagai baki hasil tolak penggunaan perantaraan daripada output.
PERKHIDMATAN SWASTA Output bagi sektor Perkhidmatan Swasta dianggarkan pada harga semasa dan malar berdasarkan maklumat suku tahunan daripada pelbagai sumber yang merangkumi subsektor seperti berikut:
Elektrik & Gas dan Air Kuantiti jualan elektrik, gas dan air digunakan untuk mengganggar output pada harga malar.
Perdagangan Borong & Runcit Output pada harga semasa digerakkan berdasarkan indikator nilai jualan yang diperoleh daripada Penyiasatan Perdagangan Edaran Bulanan dan Indeks Perdagangan Edaran.
Penginapan, Restoran, Pengangkutan & Penyimpanan, Komunikasi, Pendidikan Swasta dan Kesihatan Swasta Output pada harga semasa digerakkan berdasarkan maklumat hasil dan output yang diperoleh daripada Penyiasatan Perkhidmatan Suku Tahunan.
The Monthly Manufacturing Survey, Industrial Production Index and relevant price indices are used to generate output and value added at current and constant prices.
Value of work done on quarterly basis is used to estimate output at current prices.
The latest available constant prices input-output ratio is used to derive intermediate consumption at constant prices; inflating this gives intermediate consumption at current prices. Value added are derived as residuals by subtracting intermediate consumption from output.
PRIVATE SERVICES Output for Private Services sector is estimated at current and constant prices based on quarterly information from various sources which applies for the following sub-sectors:
Electricity & Gas and Water Sales volume of electricity, gas and water are used to derive output at constant prices.
Wholesale & Retail Trade The current prices of output are moved by sales value indicators that obtained from Monthly Survey of Distributive Trade and Index of Distributive Trade.
Accommodation, Restaurants, Transport & Storage, Communication, Private Education and Private Health The current prices of output are moved by revenue information or output obtained from Quarterly Survey of Services.
SEKTOR PEMBUATAN MANUFACTURING SECTOR
SEKTOR PEMBINAAN CONSTRUCTION SECTOR
SEKTOR PERKHIDMATAN SERVICES SECTOR
METODOLOGI METHODOLOGY
55
Kewangan Output utama terdiri daripada caj perkhidmatan ketara dan FISIM (dikira berdasarkan kaedah reference rate). Anggaran output Kewangan pada harga semasa diperoleh berdasarkan pergerakan caj perkhidmatan ketara dan FISIM. Agihan FISIM dibuat mengikut komposisi stok pinjaman dan deposit dalam sistem perbankan.
Insurans Nilai output yang meliputi pendapatan premium, pendapatan pelaburan (premium tambahan) dan tuntutan dibayar digunakan untuk mendapatkan output pada harga semasa.
Hartanah Pelbagai indikator seperti bilangan unit rumah, ruang niaga diduduki dalam kompleks perniagaan dan pejabat binaan khas serta nilai transaksi hartanah digunakan bagi menganggar output pada harga malar.
Perkhidmatan Perniagaan Maklumat suku tahunan bagi pendapatan, hasil dan jualan digunakan untuk menganggar output pada harga semasa.
Kediaman yang Didiami oleh Pemilik Anggaran suku tahunan pada harga malar diekstrapolasi berdasarkan peratus perubahan penduduk dan mengambil kira faktor pertambahan pemilikan rumah.
Perkhidmatan Lain Industri ini meliputi aktiviti pawagam, perjudian, sanitasi, pusat kecantikan, gunting rambut, cucian pakaian, studio fotografi, perkhidmatan rumah urus mayat, rekreasi dan hiburan. Indikator daripada penyiasatan suku tahunan, duti perjudian, jumlah tenaga buruh dan jumlah kematian digunakan untuk mengekstrapolasi siri suku tahunan.
Bagi output yang dianggarkan pada harga semasa, nisbah input-output terkini digunakan untuk mendapatkan penggunaan perantaraan pada harga semasa. Indeks harga berkaitan digunakan untuk mendeflasi output bagi mendapatkan output pada harga malar; dan sebaliknya.
Nilai ditambah diperoleh sebagai baki hasil tolak penggunaan perantaraan daripada output.
Finance
Main output consists of explicit service charges and FISIM (calculated based on reference rate method). Estimation of Finance output at current prices is based on the movement of explicit service charges and FISIM. Allocation of FISIM is made according to the composition of stock of loans and deposits in the banking system.
Insurance Value of output which consists of premium income, investment income (premium supplements) and claims paid are used to derive the output at current prices.
Real Estate Various indicators namely the number of existing housing units, occupied retail space in shopping complex and purpose built office as well as value of property transaction are used to estimate output at constant prices.
Business Services Quarterly information on income, revenue and sales are used to estimate output at current prices.
Owner Occupied Dwellings The quarterly estimate at constant prices is extrapolated based on population percentage change with a factor to allow for increases in home ownership.
Other Services This industry includes activities for cinemas, gambling, sanitation, beauty parlours, barbers, laundries, photographic studios, funeral services, recreation and entertainment. Indicators from quarterly surveys, gambling duty, total labour force and number of deaths are used to extrapolate the quarterly series.
For output estimated at current prices, latest input-output ratio is used to derive intermediate consumption at current prices. Relevant price indices are used to deflate output to arrive at constant prices; and vice versa.
Value added are derived as residuals by subtracting intermediate consumption from output.
METODOLOGI METHODOLOGY
56
PERKHIDMATAN KERAJAAN Nilai ditambah pada harga semasa bagi Perkhidmatan Kerajaan bersamaan dengan hasil tambah pampasan pekerja, pencen yang diperuntukkan kepada pekerja yang sedang bekerja dan penggunaan modal tetap. Perkhidmatan Kerajaan pada harga semasa diperoleh secara langsung daripada akaun keempat-empat peringkat kerajaan iaitu Kerajaan Persekutuan, Kerajaan Negeri, Pihak Berkuasa Tempatan dan Badan-badan Berkanun. Bagi anggaran suku tahunan, akaun Kerajaan Persekutuan digunakan sebagai penggerak bagi keseluruhan sektor kerajaan. Indeks harga berkaitan digunakan untuk mendapatkan nilai ditambah pada harga malar.
Duti Import pada harga semasa diperoleh daripada Kastam Diraja Malaysia yang membekalkan data bulanan. Nilai pada harga malar diperoleh dengan menggunakan indeks harga berkaitan.
GOVERNMENT SERVICES Value added at current prices of Government Services equals the sum of compensation of employees, pension allocated to the current employees and consumption of fixed capital. The Government Services at current prices is compiled based on accounts of four levels of government namely Federal, State, Local Authority and Statutory Bodies. For quarterly estimates, the Federal Government account is used as movers for the whole government sector. Relevant price indices are used to obtain the constant value added.
Import duties at current prices are obtained from Royal Malaysian Customs Department which provides monthly data. Value at constant prices is derived by using relevant price indices.
DUTI IMPORT IMPORT DUTIES
METODOLOGI METHODOLOGY
57
PERBELANJAAN PENGGUNAAN AKHIR KERAJAAN
GOVERNMENT FINAL CONSUMPTION EXPENDITURE
Perbelanjaan Penggunaan Akhir Kerajaan diukur sebagai hasil tambah nilai ditambah, input perantaraan dan FISIM, ditolak nilai barang dan perkhidmatan yang dikeluarkan oleh kerajaan. Nilai ditambah dikira sebagai hasil tambah pampasan pekerja, pencen yang diperuntukkan kepada pekerja yang sedang bekerja dan penggunaan modal tetap. Anggaran penggunaan perantaraan diperoleh dengan mengira nilai barang dan perkhidmatan yang digunakan dalam perkhidmatan kerajaan. Bagi siri suku tahunan, akaun Kerajaan Persekutuan diguna sebagai penggerak kepada keseluruhan sektor kerajaan. Dengan mengandaikan nisbah Kerajaan Persekutuan daripada keseluruhan Kerajaan tetap sama seperti tahun sebelumnya yang mana anggaran tahunan telah dibuat.
Harga malar bagi nilai ditambah, penggunaan perantaraan dan nilai jualan dideflasi menggunakan indeks harga yang bersesuaian.
Perbelanjaan penggunaan isi rumah suku tahunan dianalisa berdasarkan kumpulan barangan dan perkhidmatan seperti yang dikelaskan dalam COICOP. Sumber utama adalah Penyiasatan Perdagangan Edaran Bulanan dan Penyiasatan Perkhidmatan Suku Tahunan. Maklumat tambahan seperti pinjaman dan deposit oleh isi rumah, pembayaran premium insurans hayat dan am terpilih, maklumat bekalan elektrik untuk residen, komponen pengangkutan terpilih, komunikasi, perkhidmatan persendirian dan perkhidmatan perniagaan juga digunakan dalam penganggaran. FISIM turut dimasukkan dalam anggaran perbelanjaan ini. Perbelanjaan residen di luar negara dan perbelanjaan bukan residen di pasaran domestik diperoleh daripada Perangkaan Imbangan Pembayaran.
Government Final Consumption Expenditure is measured with the sum of value added, intermediate consumption and FISIM, less revenue from sales of goods and services produced by government.
Value added is calculated as the sum of compensation of employees, pension allocated to the current employees and consumption of fixed capital. The estimate of intermediate consumption is obtained by calculating the value of goods and services used in the production of government services.
For the quarterly series, the Federal Government accounts are used as a mover for the whole government sector. With assumption that the proportion of Federal Government to total Government remains the same as the previous year for which annual estimates have been made.
The constant prices estimates of value added, intermediate consumption and sales are deflated by using relevant prices.
The quarterly household consumption expenditure is analysed by goods and services group as classified in COICOP. Monthly Survey of Distributive Trade and Quarterly Survey of Services are the main data sources. Additional information such as loans and deposits by households, life and selected general insurance premiums paid, information on utilities for residence, selected components of transport, communication, private services and business services are also used in the estimation. FISIM is also included in the estimation of expenditure. Expenditure by residents purchased abroad and expenditure by non-residents in domestic market are obtained from the Balance of Payments Statistics.
PERBELANJAAN PENGGUNAAN AKHIR SWASTA
PRIVATE FINAL CONSUMPTION EXPENDITURE
ANGGARAN PERBELANJAAN/ ESTIMATION OF EXPENDITURE
METODOLOGI METHODOLOGY
58
PMTK mengikut jenis aset terbahagi kepada tiga jenis aset utama iaitu struktur, jentera dan kelengkapan dan aset lain. Struktur dikira berdasarkan kepada nilai output dari aktiviti pembinaan serta maklumat penyiasatan pelaburan minyak dan gas. Kos pemindahan hak milik ke atas struktur dianggarkan dan ditambah untuk mendapatkan nilai pada harga pembeli.
Jentera dan kelengkapan dianggarkan dengan menggunakan nisbah PMTK yang diperoleh dari SUT 2005.
Untuk aset lain seperti aset hiburan, sastera dan salinan asal artistik, baka ternakan, tanaman, perbelanjaan R&D dan sistem persenjataan, nilai diperoleh daripada pelbagai sumber.
PMTK Awam diperoleh daripada perbelanjaan ke atas aset oleh sektor awam melalui maklumat Akaun Kewangan Kerajaan Am dan Penyiasatan Suku Tahunan Perbelanjaan Modal Perbadanan Awam.
Perbelanjaan untuk sistem persenjataan telah diambil kira dalam anggaran PMTK Awam.
PMTK Swasta dianggar menggunakan maklumat dari penyiasatan ke atas pertubuhan swasta dan pelbagai sumber data pentadbiran yang berkaitan.
PMTK pada harga malar diperoleh dengan mendeflasi nilai PMTK pada harga semasa dengan indeks harga berkaitan.
Perubahan dalam inventori dikira berdasarkan Penyiasatan Pembuatan Bulanan dan penyiasatan bulanan/ suku tahunan industri lain. Perubahan inventori bagi komoditi pertanian utama diperoleh daripada data pentadbiran agensi-agensi yang berkaitan.
Ukuran kuantiti bagi inventori ditukarkan kepada nilai menggunakan harga purata tahun asas; perbezaan antara inventori akhir dan inventori awal dalam harga tahunan asas memberikan perubahan inventori pada harga malar. Begitu juga, inventori akhir dinilai pada harga purata bagi suku tahunan rujukan tolak inventori awal yang dinilai pada harga purata bagi suku tahunan sebelumnya memberikan perubahan dalam inventori pada harga semasa.
GFCF is divided into three major type of assets i.e. structure, machinery and equipment, and other assets. The structure is calculated based on the value of output from construction activities coupled with information oil & gas investment survey. The costs of ownership transfer for structure are estimated and appended; to obtain the value at purchasers’ prices.
The machinery and equipment are estimated by applying GFCF ratio obtained from SUT 2005.
For the other type of assets such as entertainment, literary & artistic original, breeding stock, capitalised planting, R&D expenditure and weapons systems, the values are obtained from various sources.
Public GFCF is obtained from the expenditure on assets by public sector from the General Government Accounts and also Quarterly Survey of Capital Expenditure for Public Corporation.
Expenditure on weapons systems is also included in the Public GFCF estimation.
The estimates of Private GFCF are derived from information of surveys on the private establishments and various related administrative data.
GFCF at constant prices is obtained by deflating the GFCF at current prices with the relevant price index.
Measures of changes in inventories are built up from the Monthly Manufacturing Survey and monthly/ quarterly survey of other industries. Changes in inventories of major agriculture commodities are obtained from the administrative data of the relevant agencies.
Quantity measures on inventories are converted to values using base year average prices; the difference between closing inventories and opening inventories in base year prices gives the changes in inventories at constant prices. Similarly, closing inventories valued at the average price of the reference quarter less the opening inventories valued at the average price of the previous quarter gives changes in inventories at current prices.
PEMBENTUKAN MODAL TETAP KASAR (PMTK)
GROSS FIXED CAPITAL FORMATION (GFCF)
PERUBAHAN DALAM INVENTORI CHANGES IN INVENTORIES
METODOLOGI METHODOLOGY
59
Barangan berharga bermaksud barangan yang dibeli dengan tujuan untuk pelaburan di mana pembelian tersebut dibuat dengan andaian bahawa nilai barang tersebut akan meningkat pada masa akan datang. Antara contoh barangan berharga adalah logam dan batu berharga, barang antik, barang seni dan sebagainya. Nilai pada harga semasa diperoleh dari pelbagai indikator dan sumber data termasuklah data import, penyiasatan pembuatan dan perdagangan edaran. Data ini kemudiannya dideflasi dengan harga yang berkaitan untuk mendapatkan nilai pada harga malar.
Siri harga semasa bagi item ini adalah berdasarkan kepada anggaran imbangan pembayaran. Perdagangan barangan adalah item utama dalam nilai import dan eksport di mana perangkaan perdagangan memberikan ukuran nilai semasa. Aliran perdagangan perkhidmatan dianggarkan daripada penyiasatan suku tahunan yang dijalankan oleh Jabatan Perangkaan Malaysia.
Harga yang berkaitan, kadar tukaran dan indeks harga antarabangsa yang disesuaikan dengan perubahan kadar tukaran digunakan untuk mendapatkan harga malar.
Anggaran suku tahunan dan tahunan akan diselaraskan di mana yang perlu. Dalam situasi di mana akaun tahunan dan suku tahunan menggunakan sumber data yang sama, pelarasan suku tahunan tidak perlu dipadankan dengan akaun tahunan.
Dalam keadaan lain di mana akaun tahunan dan suku tahunan menggunakan sumber data yang berbeza dan apabila akaun suku tahunan diekstrapolasi dengan menggunakan teknik tanda aras tahunan, anggaran suku tahunan diselaraskan dengan anggaran tahunan. Pelarasan suku tahunan dibuat dengan menggunakan teknik tanda aras. Ini membolehkan akaun suku tahunan dijumlahkan untuk mendapatkan akaun tahunan serta mengekalkan arah aliran suku tahunan.
Dalam penerbitan ini, pelarasan antara penawaran dan permintaan barangan dan perkhidmatan adalah berdasarkan amalan terbaik, menggunakan maklumat terbaik yang ada dan pengetahuan national accountants berkenaan setiap item yang menyumbang kepada KDNK.
Valuables are defined as products bought for the purpose of investment where the purchase is made with the assumption that the value of the products will increase in the future. Examples of valuables are precious metals and stones, antiques, works of art and etc. Value at current prices is obtained from various indicators and data sources such as imports data, manufacturing survey and distributive trade. These data are then deflated by the relevant price indices to arrive the value at constant prices.
The current price series for these items are based on the balance of payments estimates. The merchandise trade is the major item in both imports and exports value which the trade statistics provides the measure of the current value. Services trade flows are estimated from quarterly survey conducted by DOSM.
Relevant prices, exchange rates and international price indices adjusted for exchange rate changes are used to obtain constant price estimates.
Quarterly and annual estimates are reconciled where necessary. In situation, whereby the annual and quarterly accounts uses the same data sources, no reconciliation of the quarterly need to be made to fit the annual accounts.
In other cases, whereby the annual and quarterly accounts uses different data sources and if the quarterly accounts are extrapolated by using annual benchmarks, quarterly estimates are reconciled with the annual estimates. Reconciliation of quarterly is made by using the benchmarking technique. This allows the quarterly accounts to be summed up to the annual accounts while maintaining the quarterly trend.
In this publication reconciliation between supply and use of goods and services is based on the best practice, make use of the best available information and knowledge that the national accountants have on item that contributing to the GDP.
BARANGAN BERHARGA VALUABLES
EKSPORT DAN IMPORT EXPORTS AND IMPORTS
PELARASAN RECONCILIATION
SUMBER DATA
DATA SOURCES
60
GETAH RUBBER
KELAPA SAWIT OIL PALM
TERNAKAN LIVESTOCK
PERTANIAN LAIN OTHER AGRICULTURE
Perangkaan Getah Bulanan, Malaysia Monthly Rubber Statistics, Malaysia
Perangkaan Getah Tahunan, Malaysia Annual Rubber Statistics, Malaysia
Lembaga Getah Malaysia Malaysian Rubber Board
Perangkaan Perdagangan Luar Negeri External Trade Statistics
Lembaga Minyak Sawit Malaysia Malaysian Palm Oil Board
Perangkaan Perdagangan Luar Negeri External Trade Statistics
Jabatan Perkhidmatan Veterinar, Semenanjung Malaysia Department of Veterinary Services, Peninsular Malaysia
Jabatan Perkhidmatan Veterinar, Sabah Department of Veterinary Services, Sabah
Jabatan Perkhidmatan Veterinar, Sarawak Department of Veterinary Services, Sarawak
Perangkaan Perdagangan Luar Negeri External Trade Statistics
Penyiasatan Suku Tahunan Akaun Negara Quarterly National Accounts Survey
Jabatan Pertanian Malaysia Department of Agriculture, Malaysia
Lembaga Perindustrian Nanas, Malaysia Malaysian Pineapple Industry Board
Lembaga Kenaf dan Tembakau Negara, Malaysia National Kenaf and Tobacco Board, Malaysia
Lembaga Lada Malaysia Malaysian Pepper Board
Lembaga Pemasaran Pertanian Persekutuan Federal Agriculture Marketing Authority
Lembaga Koko Malaysia Malaysian Cocoa Board
Penyiasatan Suku Tahunan Akaun Negara Quarterly National Accounts Survey
Perangkaan Perdagangan Luar Negeri External Trade Statistics
SEKTOR PERTANIAN/ AGRICULTURE SECTOR

SUMBER DATA
DATA SOURCES
61
PERHUTANAN DAN PEMBALAKAN FORESTRY AND LOGGING
PERIKANAN FISHING
MINYAK MENTAH, KONDENSAT DAN GAS ASLI CRUDE OIL, CONDENSATE AND NATURAL GAS
PERLOMBONGAN LAIN OTHER MINING
PEMBUATAN MANUFACTURING
PEMBINAAN CONSTRUCTION
ELEKTRIK DAN GAS ELECTRICITY AND GAS
Jabatan Perhutanan, Semenanjung Malaysia Department of Forestry, Peninsular Malaysia
Jabatan Perhutanan, Sabah Department of Forestry, Sabah
Jabatan Perhutanan, Sarawak Department of Forestry, Sarawak
Perangkaan Perdagangan Luar Negeri External Trade Statistics
Dasar Perindustrian Kayu Negara (NATIP) National Timber Industry Policy (NATIP)
Jabatan Perikanan Malaysia Department of Fisheries, Malaysia
Perangkaan Perdagangan Luar Negeri External Trade Statistics
Petroliam Nasional Berhad (PETRONAS) Petroliam Nasional Berhad (PETRONAS)
Perangkaan Perdagangan Luar Negeri External Trade Statistics
Jabatan Mineral dan Geosains Malaysia Minerals & Geoscience Department Malaysia
Industri pembinaan/ Construction industry
Penyiasatan Pembuatan Bulanan Monthly Manufacturing Survey
Indeks Pengeluaran Perindustrian Industrial Production Index
Perangkaan Perdagangan Luar Negeri External Trade Statistics
Statistik Pembinaan Suku Tahunan Quarterly Construction Statistics
Pengeluar dan pembekal bekalan elektrik The producers and distributors of electricity
Pengedar gas Gas distributor
SEKTOR PERLOMBONGAN DAN PENGKUARIAN/ MINING AND QUARRYING SECTOR
SEKTOR PEMBUATAN/ MANUFACTURING SECTOR
SEKTOR PEMBINAAN/ CONSTRUCTION SECTOR
SEKTOR PERKHIDMATAN/ SERVICES SECTOR
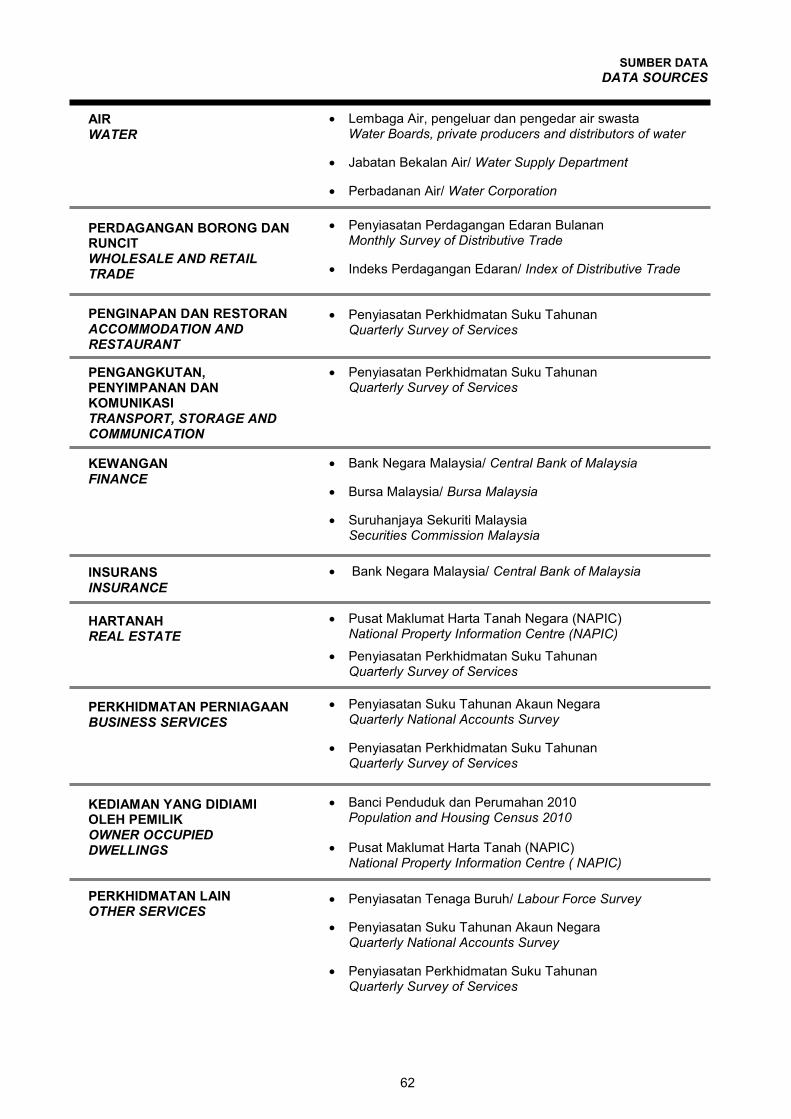
SUMBER DATA
DATA SOURCES
62
AIR WATER
PERDAGANGAN BORONG DAN RUNCIT WHOLESALE AND RETAIL TRADE
PENGINAPAN DAN RESTORAN ACCOMMODATION AND RESTAURANT
PENGANGKUTAN, PENYIMPANAN DAN KOMUNIKASI TRANSPORT, STORAGE AND COMMUNICATION
KEWANGAN FINANCE
INSURANS INSURANCE
HARTANAH REAL ESTATE
PERKHIDMATAN PERNIAGAAN BUSINESS SERVICES
KEDIAMAN YANG DIDIAMI OLEH PEMILIK OWNER OCCUPIED DWELLINGS
PERKHIDMATAN LAIN OTHER SERVICES
Lembaga Air, pengeluar dan pengedar air swasta Water Boards, private producers and distributors of water
Jabatan Bekalan Air/ Water Supply Department
Perbadanan Air/ Water Corporation
Penyiasatan Perdagangan Edaran Bulanan
Monthly Survey of Distributive Trade
Indeks Perdagangan Edaran/ Index of Distributive Trade
Penyiasatan Perkhidmatan Suku Tahunan Quarterly Survey of Services
Penyiasatan Perkhidmatan Suku Tahunan Quarterly Survey of Services
Bank Negara Malaysia/ Central Bank of Malaysia
Bursa Malaysia/ Bursa Malaysia
Suruhanjaya Sekuriti Malaysia Securities Commission Malaysia
Bank Negara Malaysia/ Central Bank of Malaysia
Pusat Maklumat Harta Tanah Negara (NAPIC) National Property Information Centre (NAPIC)
Penyiasatan Perkhidmatan Suku Tahunan Quarterly Survey of Services
Penyiasatan Suku Tahunan Akaun Negara Quarterly National Accounts Survey
Penyiasatan Perkhidmatan Suku Tahunan Quarterly Survey of Services
Banci Penduduk dan Perumahan 2010
Population and Housing Census 2010
Pusat Maklumat Harta Tanah (NAPIC) National Property Information Centre ( NAPIC)
Penyiasatan Tenaga Buruh/ Labour Force Survey
Penyiasatan Suku Tahunan Akaun Negara Quarterly National Accounts Survey
Penyiasatan Perkhidmatan Suku Tahunan Quarterly Survey of Services
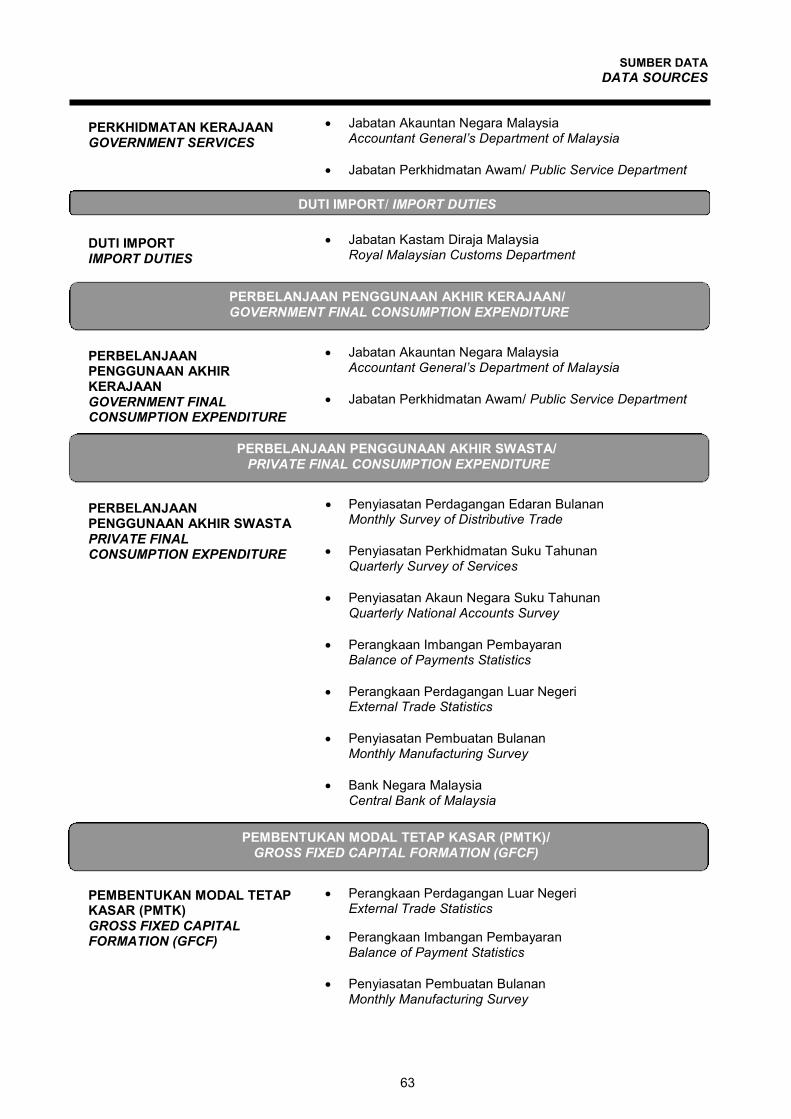
SUMBER DATA
DATA SOURCES
63
PERKHIDMATAN KERAJAAN GOVERNMENT SERVICES
DUTI IMPORT IMPORT DUTIES
PERBELANJAAN PENGGUNAAN AKHIR KERAJAAN GOVERNMENT FINAL CONSUMPTION EXPENDITURE
PERBELANJAAN PENGGUNAAN AKHIR SWASTA PRIVATE FINAL CONSUMPTION EXPENDITURE
PEMBENTUKAN MODAL TETAP KASAR (PMTK) GROSS FIXED CAPITAL FORMATION (GFCF)
Jabatan Akauntan Negara Malaysia Accountant General’s Department of Malaysia
Jabatan Perkhidmatan Awam/ Public Service Department
Jabatan Kastam Diraja Malaysia Royal Malaysian Customs Department
Jabatan Akauntan Negara Malaysia Accountant General’s Department of Malaysia
Jabatan Perkhidmatan Awam/ Public Service Department
Penyiasatan Perdagangan Edaran Bulanan Monthly Survey of Distributive Trade
Penyiasatan Perkhidmatan Suku Tahunan Quarterly Survey of Services
Penyiasatan Akaun Negara Suku Tahunan Quarterly National Accounts Survey
Perangkaan Imbangan Pembayaran Balance of Payments Statistics
Perangkaan Perdagangan Luar Negeri External Trade Statistics
Penyiasatan Pembuatan Bulanan Monthly Manufacturing Survey
Bank Negara Malaysia Central Bank of Malaysia
Perangkaan Perdagangan Luar Negeri External Trade Statistics
Perangkaan Imbangan Pembayaran Balance of Payment Statistics
Penyiasatan Pembuatan Bulanan Monthly Manufacturing Survey
DUTI IMPORT/ IMPORT DUTIES
PERBELANJAAN PENGGUNAAN AKHIR KERAJAAN/ GOVERNMENT FINAL CONSUMPTION EXPENDITURE
PERBELANJAAN PENGGUNAAN AKHIR SWASTA/ PRIVATE FINAL CONSUMPTION EXPENDITURE
PEMBENTUKAN MODAL TETAP KASAR (PMTK)/ GROSS FIXED CAPITAL FORMATION (GFCF)
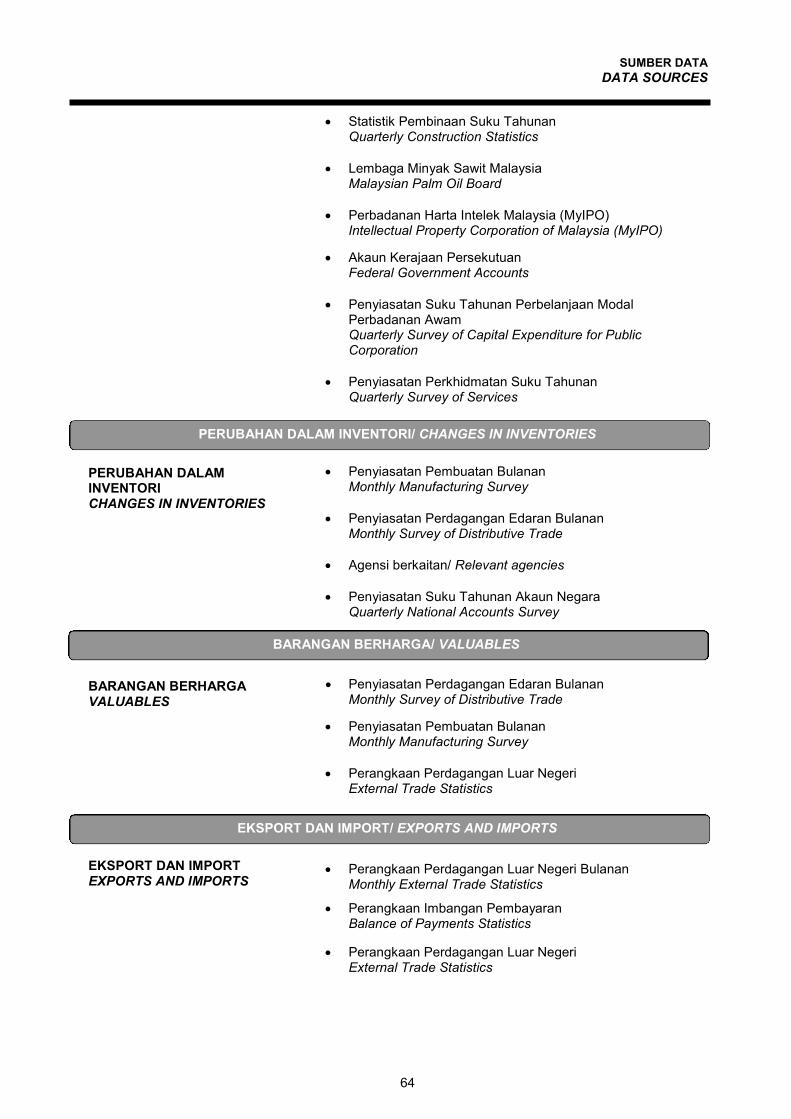
SUMBER DATA
DATA SOURCES
64
PERUBAHAN DALAM INVENTORI CHANGES IN INVENTORIES
BARANGAN BERHARGA VALUABLES
EKSPORT DAN IMPORT EXPORTS AND IMPORTS
Statistik Pembinaan Suku Tahunan Quarterly Construction Statistics
Lembaga Minyak Sawit Malaysia Malaysian Palm Oil Board
Perbadanan Harta Intelek Malaysia (MyIPO) Intellectual Property Corporation of Malaysia (MyIPO)
Akaun Kerajaan Persekutuan Federal Government Accounts
Penyiasatan Suku Tahunan Perbelanjaan Modal Perbadanan Awam Quarterly Survey of Capital Expenditure for Public Corporation
Penyiasatan Perkhidmatan Suku Tahunan Quarterly Survey of Services
Penyiasatan Pembuatan Bulanan Monthly Manufacturing Survey
Penyiasatan Perdagangan Edaran Bulanan Monthly Survey of Distributive Trade
Agensi berkaitan/ Relevant agencies
Penyiasatan Suku Tahunan Akaun Negara Quarterly National Accounts Survey
Penyiasatan Perdagangan Edaran Bulanan Monthly Survey of Distributive Trade
Penyiasatan Pembuatan Bulanan Monthly Manufacturing Survey
Perangkaan Perdagangan Luar Negeri External Trade Statistics
Perangkaan Perdagangan Luar Negeri Bulanan Monthly External Trade Statistics
Perangkaan Imbangan Pembayaran Balance of Payments Statistics
Perangkaan Perdagangan Luar Negeri External Trade Statistics
PERUBAHAN DALAM INVENTORI/ CHANGES IN INVENTORIES
BARANGAN BERHARGA/ VALUABLES
EKSPORT DAN IMPORT/ EXPORTS AND IMPORTS
SEKSYEN 5:
GLOSARI
SECTION 5: GLOSSARY

Glossary The following glossary of terms is drawn from 1993 & 2008 SNA
65
A Account
An account is a tool which records, for a given aspect of economic life, the uses and resources or the changes in assets and the changes in liabilities and/or the stock of assets and liabilities existing at a certain time.
Accrual accounting Accrual accounting records flows at the time economic value is created, transformed, exchanged, transferred or extinguished, so flows which imply a change of ownership are entered when ownership passes, services are recorded when provided, output at the time products are created and intermediate consumption when materials and supplies are being used.
Actual final consumption of general government Actual final consumption of general government is measured by the value of the collective consumption services provided to the community, or large sections of the community, by general government; it is derived from their final consumption expenditure by subtracting the value of social transfers in kind payable.
Actual final consumption of households Actual final consumption of households is the value of the consumption goods acquired by households, whether by purchase or by transfer from government units or NPISHs, and used by them for the satisfaction of their needs and wants; it is derived from their final consumption expenditure by adding the value of social transfers in kind receivable.
Ancillary activity An ancillary activity is a supporting activity undertaken within an enterprise in order to create the conditions within which the principal or secondary activities can be carried out.
Asset An asset is a store of value representing a benefit or series of benefits accruing to the economic owner by holding or using the entity over a period of time. It is a means of carrying forward value from one accounting period to another.
B Balance of payments
The balance of payments is a statistical statement that systematically summarises, for a specific time period, the economic transactions of an economy with the rest of the world.
Base period The period that provides the weights for an index is described as the base period.
Basic price The basic price is the amount receivable by the producer from the purchaser for a unit of a good or service produced as output minus any tax payable, and plus any subsidy receivable, on that unit as a consequence of its production or sale; it excludes any transport charges invoiced separately by the producer.
C Cash accounting
Cash accounting records only cash payments and record them at the times these payments occur.
Central bank A central bank is the public financial corporation which is a monetary authority: that is, which issues banknotes and sometimes coins and may hold all or part of the international reserves of the country.
Central government Central government is the body whose political authority extends over the entire territory of the country and which has the authority to impose taxes on all resident and non-resident units engaged in economic activities within the country.
Centre of economic interest An institutional unit is said to have a centre of economic interest within a country when there exists some location within the economic territory of the country on, or from, which it engages, and intends to continue to engage, in economic activities and transactions on a significant scale, either indefinitely or over a finite but long period of time.
Changes in inventories (including work-in-progress) Changes in inventories are measured by the value of the entries into inventories less the value of withdrawals and less the value of any recurrent losses of goods held in inventories during the accounting period.
C.i.f. Price
The c.i.f. price (i.e. cost, insurance and freight price) is the price of a good delivered at the frontier of the importing country, or the price of a service delivered to a resident before the payment of any import duties or other taxes on imports or trade and transport margins within the country.
Glossary
66
Collective consumption service A collective consumption service is a service provided by general government simultaneously to all members of the community or to all members of a particular section of the community, such as all households living in a particular region.
Compensation of employees Compensation of employees is the total remuneration, in cash or in kind, payable by an enterprise to an employee in return for work done by the latter during the accounting period.
Computer software Computer software consists of computer programs, program descriptions and supporting materials for both systems and applications software.
Constant prices Constant prices are obtained by directly factoring changes over time in the values of flows of goods and services into two components reflecting changes in the prices of the goods and services concerned and changes in their volumes (i.e. changes in "constant price terms").
Consumption Consumption is an activity in which institutional units use up goods or services; consumption can be either intermediate or final.
Consumption of fixed capital Consumption of fixed capital represents the reduction in the value of the fixed assets used in production during the accounting period resulting from physical deterioration, normal obsolescence or nominal accidental damage.
Cultivated assets Cultivated assets are livestock for breeding, dairy, draught, etc. and vineyards, orchards and other plantations of trees yielding repeat products that are under the direct control, responsibility and management of institutional units.
Current account (balance of payments) The current account (balance of payments) shows details of goods and services, income, and current transfers.
Current transfer A current transfer is a transaction in which one institutional unit provides a good, service or asset to another unit without receiving from the latter any good, service or asset directly in return as counterpart and does not oblige one or both parties to acquire, or dispose of, an asset.
D Domestic output
Domestic output is output produced by resident enterprises.
Double deflation Double deflation is a method whereby gross value added is measured at constant prices by subtracting intermediate consumption at constant prices from output at constant prices.
Durable goods Durable goods are one which may be used repeatedly or continuously over a period of more than a year, assuming a normal or average rate of physical usage.
Disposable income Disposable income is the balancing item in the secondary distribution of income account. It is derived from the balance of primary incomes of an institutional unit or sector by adding all current transfers, except social transfers in kind, receivable by that unit or sector and subtracting all current transfers, except social transfers in kind, payable by that unit or sector.
E Economic territory (of a country)
The economic territory of a country consists of the geographic territory administered by a government within which persons, goods, and capital circulate freely.
Economic territory (of an international organisation) The economic territory of an international organisation consists of the territorial enclave, or enclaves, over which it has jurisdiction; these consist of clearly demarcated areas of land or structures which the international organisation owns or rents and which it uses for the purposes for which the organisation was created by formal agreement with the country, or countries, in which the enclave or enclaves are physically located.
Economically significant prices Prices are said to be economically significant when they have a significant influence on the amounts the producers are willing to supply and on the amounts purchasers wish to buy.
Establishment An establishment is an enterprise, or part of an enterprise, that is situated in a single location and in which only a single (non-ancillary) productive activity is carried out or in which the principal productive activity accounts for most of the value added.
Glossary
67
Expenditures Expenditures are the values of the amounts that buyers pay, or agree to pay, to sellers in exchange for goods or services that sellers provide to them or to other institutional units designated by the buyers.
Excise duties Excise duties consist of special taxes levied on specific kinds of goods, typically alcoholic beverages, tobacco and fuels; they may be imposed at any stage of production or distribution and are usually assessed by reference to the weight or strength or quantity of the product.
Export duties Export duties consist of general or specific taxes on goods or services that become payable when the goods leave the economic territory or when the services are delivered to non-residents; profits of export monopolies and taxes resulting from multiple exchange rates are excluded.
Export taxes Export taxes consists of taxes on goods or services that become payable to government when the goods leave the economic territory or when the services are delivered to non-residents.
Exports of goods Exports of goods consist of exports of the following items from residents to non-residents, generally with a change of ownership being involved: general merchandise, goods for processing, repairs on goods, goods procured in foreign ports by domestic carriers and non-monetary gold.
Exports of services Exports of services consist of the following services provided by residents to non-residents: transportation; travel; communications; construction; insurance; financial; computer and information; royalties and licence fees; other business services; personal, cultural, and recreational services; and government services n.i.e.
F Final consumption
Final consumption consists of goods and services used by individual households or the community to satisfy their individual or collective needs or wants.
Final consumption expenditure of government General government final consumption expenditure consists of expenditure, including expenditure whose value must be estimated indirectly, incurred by general government on both individual consumption goods and services and collective consumption services.
Final consumption expenditure of households
Household final consumption expenditure consists of the expenditure, including expenditure whose value must be estimated indirectly, incurred by resident households on individual consumption goods and services, including those sold at prices that are not economically significant and including consumption goods and services acquired abroad.
Final consumption expenditure of NPISHs Final consumption expenditure of NPISHs consists of the expenditure, including expenditure whose value must be estimated indirectly, incurred by resident NPISHs on individual consumption goods and services and possibly on collective consumption services.
Financial auxiliaries
Financial auxiliaries consist of financial corporations that are principally engaged in activities associated with transactions in financial assets and liabilities or with providing the regulatory context for these transactions but in circumstances that do not involve the auxiliary taking ownership of the financial assets and liabilities being transacted.
Financial intermediaries Financial intermediaries are units which incur liabilities on their own account on financial markets by borrowing funds which they lend on different terms and conditions to other institutional units.
Financial intermediation Financial intermediation is a productive activity in which an institutional unit incurs liabilities on its own account for the purpose of acquiring financial assets by engaging in financial transactions on the market.
Financial intermediation services indirectly measured (FISIM)
Financial intermediation services indirectly measured (FISIM) is an indirect measure of the value of financial intermediation services provided but for which financial institutions do not charge explicitly.
Glossary
68
Financial lease A financial lease is a contract between lessor and lessee whereby the lessor purchases a good that is put at the disposal of the lessee and the lessee pays rentals that enable the lessor, over the period of the contract to cover all or virtually all costs, including interest.
Finished goods - inventories Inventories of finished goods consist of goods that are ready for sale or shipment by the producer but which are still held by the producer.
Fixed asset - existing An existing fixed asset is one which has already been acquired by at least one resident user, or produced on own account, and whose value has, therefore, already been included in the gross fixed capital formation of at least one user at some earlier point in time in the current or some previous accounting period.
F.o.b. price The f.o.b. price (free on board price) is the c.i.f. price less the costs of transportation, together with insurance charges, between the customs frontier of the exporting (importing) country and that of the importing (exporting) country.
Functional classifications Functional classifications provide a means of classifying, by purpose or socio-economic objective, certain transactions of producers and of three institutional sectors - namely households, general government and non-profit institutions serving households (NPISHs).
G General government
The general government sector consists of the totality of institutional units which, in addition to fulfilling their political responsibilities and their role of economic regulation, produce principally non-market services (possibly goods) for individual or collective consumption and redistribute income and wealth.
Goods Goods are physical objects for which a demand exists, over which ownership rights can be established and whose ownership can be transferred from one institutional unit to another by engaging in transactions on markets.
Goods for resale - inventories
Inventories of goods for resale are goods acquired by enterprises, such as wholesalers and retailers, for the purpose of reselling them without further processing (that is, not transformed other
than by presenting them in ways that are attractive to the customer).
Government final consumption expenditure Government final consumption expenditure consists of expenditure, including imputed expenditure, incurred by general government on both individual consumption goods and services and collective consumption services.
Gross The term "gross" is a common means of referring to values before deducting consumption of fixed capital (generally used as in "gross capital stock" or "gross domestic product").
Gross capital formation Gross capital formation is measured by the total value of the gross fixed capital formation, changes in inventories and acquisitions less disposals of valuables for a unit or sector.
Gross domestic product (GDP) - expenditure
based Consumption expenditure-based gross domestic product is total final expenditures at purchasers' prices, less the f.o.b. value of imports of goods and services.
Gross domestic product (GDP) - income based Income-based gross domestic product is compensation of employees, plus taxes less subsidies on production and imports, plus gross mixed income, plus gross operating surplus.
Gross domestic product (GDP) at output based Output-based gross domestic product is the sum of the gross values added of all resident producers at basic prices, plus all taxes less subsides on products.
Gross domestic product (GDP) - market prices Gross domestic product at market prices is the sum of the gross values added of all resident producers at market prices, plus taxes less subsidies on imports.
Gross fixed capital formation Gross fixed capital formation is measured by the total value of a producer's acquisitions, less disposals, of fixed assets during the accounting period plus certain additions to the value of non-produced assets (such as land or subsoil assets) realised by the productive activity of institutional units.
Glossary
69
Gross national disposable income Gross national disposable income may be derived from gross national income by adding all current transfers in cash or in kind receivable by resident institutional units from non-resident units and subtracting all current transfers in cash or in kind payable by resident institutional units to non-resident units.
Gross national income (GNI) Gross national income (GNI) is the aggregate value of the gross balances of primary income for all sectors; (gross national income is identical to gross national product (GNP) as hitherto understood in national accounts generally).
Gross saving Gross saving is gross disposable income less final consumption expenditure.
Gross value added Gross value added is the value of output less the value of intermediate consumption; it is a measure of the contribution to GDP made by an individual producer, industry or sector.
Gross value added at basic prices Gross value added at basic prices is output valued at basic prices less intermediate consumption valued at purchasers' prices.
Gross value added at producers' prices Gross value added at producers' prices is output valued at producers' prices less intermediate consumption valued at purchasers' prices.
H Holding gains
Positive or negative holding gains may accrue during the accounting period to the owners of financial and non-financial assets and liabilities as a result of a change in their prices (holding gains are sometimes referred to as "capital gains").
Household A household is a group of persons who share the same living accommodation, who pool some, or all, of their income and wealth and who consume certain types of goods and services collectively, mainly housing and food.
Household actual final consumption Household actual final consumption consists of the consumption goods or services acquired by individual households by expenditures or through social transfers in kind received from government units or non-profit institutions serving households (NPISHs).
Household final consumption expenditure Household final consumption expenditure consists of the expenditure, including expenditure whose value must be estimated indirectly, incurred by resident households on individual consumption goods and services, including those sold at prices that are not economically significant and including consumption goods and services acquired abroad.
I Illegal production
Illegal production is the production of goods or services whose sale, distribution or possession is forbidden by law; and production activities which are usually legal but which become illegal when carried out by unauthorised producers. The scope of illegal production varies depending on the laws in place in individual countries (e.g. prostitution is legal in some countries but illegal in others).
Import duties
Import duties consist of customs duties, or other import charges, that are payable on goods of a particular type when they enter the economic territory.
Imports of goods Imports of goods consist of imports of the following items from non-residents to residents, generally with a change of ownership being involved; general merchandise, goods for processing, repairs on goods, goods procured in foreign ports by domestic carriers and non-monetary gold.
Imports of services Imports of services consist of the following services purchased by residents from non-residents: transportation; travel; communications; construction; insurance; financial; computer and information; royalties and licence fees; other business services; personal, cultural, and recreational services; and government services n.i.e.
Income Income is the maximum amount that a household, or other unit, can consume without reducing its real net worth.
Income from abroad - net Net income from abroad is the difference between the total values of the primary incomes receivable from and payable to non-residents.
Glossary
70
Income in kind received by employees Income in kind received by employees is measured by the value of the goods and services provided by employers to their employees in remuneration for work done.
Industry An industry consists of a group of establishments engaged in the same, or similar, kinds of activity.
Indirect taxes As traditionally understood, indirect taxes are taxes that supposedly can be passed on, in whole or in part, to other institutional units by increasing the prices of the goods or services sold.
Insurance The activity of insurance is intended to provide individual institutional units exposed to certain risks with financial protection against the consequences of the occurrence of specified events; it is also a form of financial intermediation in which funds are collected from policyholders and invested in financial or other assets which are held as technical reserves to meet future claims arising from the occurrence of the events specified in the insurance policies.
Intellectual property products Intellectual property products are the result of research, development, investigation or innovation leading to knowledge that the developers can market or use to their own benefit in production because use of the knowledge is restricted by means of legal or other protection.
Interest Interest is a form of income that is receivable by the owners of certain kinds of financial assets, namely: deposits, debt securities, loans and (possibly) other accounts receivable for putting the financial asset at the disposal of another institutional unit
Intermediate consumption Intermediate consumption consists of the value of the goods and services consumed as inputs by a process of production, excluding fixed assets whose consumption is recorded as consumption of fixed capital.
Inventories Inventories consist of stocks of outputs that are still held by the units that produced them prior to their being further processed, sold, delivered to other units or used in other ways and stocks of products acquired from other units that are intended to be used for intermediate consumption or for resale without further processing.
Inventories of finished goods Inventories of finished goods consist of goods that are ready for sale or shipment, but held by the producer.
Inventories of goods for resale Inventories of goods for resale consist of goods acquired by enterprises, such as wholesalers and retailers, for the purpose of reselling them without further processing (that is, not transformed other than by presenting them in ways that are attractive to the customer).
Inventories of materials and supplies Inventories of materials and supplies are goods that their owners intend to use as intermediate inputs in their own production processes, not to resell.
Inventories of work-in progress Inventories of work-in progress consist of goods and services that are partially completed but that are not usually turned over to other units without further processing or that are not mature and whose production process will be continued in a subsequent period by the same producer.
K Kind-of-activity unit
A kind-of-activity unit is an enterprise, or a part of an enterprise, which engages in only one kind of (non-ancillary) productive activity or in which the principal productive activity accounts for most of the value added.
L Land
Land consists of the ground, including the soil covering and any associated surface waters, over which ownership rights are enforced and from which economic benefits can be derived by their owners by holding or using them.
Land improvements Land improvements are the result of actions that lead to major improvements in the quantity, quality or productivity of land, or prevent its deterioration.
Land under cultivation
Land under cultivation is land on which agricultural or horticultural production is carried on for commercial or subsistence purposes, including, in principle, land under plantations, orchards and vineyards.
Glossary
71
Laspeyres price index A Laspeyres price index is a weighted arithmetic average of price relatives using the values of the earlier period as weights.
Laspeyres volume index
A Laspeyres volume index is a weighted arithmetic average of quantity relatives using the values of the earlier period as weights.
Legal entity
Legal entity a legal or social entity is one whose existence is recognized by law or society independently of the persons, or other entities, that may own or control it.
Livestock for breeding, dairy, draught, etc.
Livestock for breeding, dairy, draught, etc consist of livestock that are cultivated for the products they provide year after year.
Loans
Loans are financial assets that are created when a creditor lends funds directly to a debtor, and are evidenced by documents that are not negotiable.
Local government
Local government units are institutional units whose fiscal, legislative and executive authority extends over the smallest geographical areas distinguished for administrative and political purposes.
M Machinery and equipment
Machinery and equipment cover transport equipment, machinery for information, communication and telecommunications (ICT) equipment, and other machinery and equipment.
Margin (trade)
A trade margin is the difference between the actual or imputed price realised on a good purchased for resale (either wholesale or retail) and the price that would have to be paid by the distributor to replace the good at the time it is sold or otherwise disposed of.
Market establishments Market establishments produce mostly goods and services for sale at prices which are economically significant.
Market non-profit institutions serving businesses Market non-profit institutions serving businesses are created by associations of the businesses
whose interests they are designed to promote and usually financed by contributions or subscriptions from the group of businesses concerned; the subscriptions are treated not as transfers but as payments for services rendered.
Market output Market output consists of output intended for sale at economically significant prices.
Market prices Market prices for transactions are the amounts of money willing buyers pay to acquire something from willing sellers.
Market producers Market producers are establishments, all or most of whose output is market production.
Market price equivalents
Market price equivalents are proxies, or substitute measures, for market prices in those cases for which no actual market prices have been set; a customary approach is to construct such prices by analogy with known market prices established under conditions that are considered essentially the same.
Materials and supplies inventories
Inventories of materials and supplies are goods that their owners intend to use as intermediate inputs in their own production processes, not to resell.
Mineral exploration Mineral exploration consists of the value of expenditures on exploration for petroleum and natural gas and for non-petroleum deposits. it includes prelicence costs, licence and acquisition costs, appraisal costs and the costs of actual test drilling and boring, as well as the costs of aerial and other surveys, transportation costs, etc, incurred to make it possible to carry out the tests.
N
National income At the level of the total economy, national income is the total value of the primary incomes receivable within the economy less the total of the primary incomes payable by resident units.
Net domestic product (NDP) Net domestic product (NDP) is defined as gross domestic product (GDP) less the consumption of fixed capital.
Glossary
72
Net primary income from abroad Net primary income from abroad is defined as the total value of the primary income receivable by an institutional unit or sector from abroad less the total of the primary income payable abroad.
Net value added Net value added is the value of output less the values of both intermediate consumption and consumption of fixed capital.
Non-durable good A non-durable good is one which is used up entirely in less than a year, assuming a normal or average rate of physical usage.
Non-life insurance claims Non-life insurance claims are the amounts payable in settlement of damages that result from an event covered by a non-life insurance policy during the current accounting period.
Non-life insurance premiums Non-life insurance premiums comprise both the actual premiums payable by policyholders to obtain insurance cover during the accounting period (premiums earned) and the premium supplements payable out of the property income attributed to insurance policyholders, but excluding social contributions.
Non-market producers Non-market producers consist of establishments owned by government units or NPISHs that supply goods or services free, or at prices that are not economically significant, to households or the community as a whole.
Non-profit institutions (NPIs) Non-profit institutions (NPIs) are legal or social entities created for the purpose of producing goods and services whose status does not permit them to be a source of income, profit or other financial gain for the units that establish, control or finance them.
Non-profit institutions engaged in market production Non-profit institutions engaged in market production consist of those NPIs which charge fees determined by their costs of production and which are sufficiently high to have a significant influence on the demand for their services, but any surpluses such institutions make must be retained within those institutions as their status as "Non-profit institutions (NPIs)" prevents them from distributing them to others.
Non-profit institutions engaged in non-market production Non-profit institutions engaged in non-market production are NPIs that are incapable of providing financial gain to the units which control or manage them, and which must rely principally on funds other than receipts from sales to cover their costs of production or other activities.
Non-profit institutions serving households (NPISHs) Non-profit institutions serving households (NPISHs) consist of non-market NPIs that are not controlled by government.
Non-resident A unit is non-resident if its centre of economic interest is not in the domestic economic territory (i.e. it operates from abroad).
Non-residential buildings Non-residential buildings are buildings other than dwellings, including fixtures, facilities and equipment that are integral parts of the structures and costs of site clearance and preparation.
NPISH final consumption expenditure Final consumption expenditure of NPISHs consists of the expenditure, including imputed expenditure, incurred by resident NPISHs on individual consumption goods and services.
O Operating lease
An operating lease is one where the legal owner is also the economic owner and accepts the operating risks and receives the economic benefits from the asset by using it in a productive activity.
Operating surplus Operating surplus is described as mixed income because it implicitly contains an element of remuneration for work done by the owner, or other members of the household, that cannot be separately identified from the return to the owner as entrepreneur.
Output produced for own final use Output for own final use consists of products retained by the producer for his own use as final consumption or capital formation
Output Output is defined as the goods and services produced by an establishment, excluding the value of any goods and services used in an activity for which the establishment does not
Glossary
73
assume the risk of using the products in production, and excluding the value of goods and services consumed by the same establishment except for goods and services used for capital formation (fixed capital or changes in inventories) or own final consumption.
Own-account producers Own-account producers consist of establishments engaged in gross fixed capital formation for the enterprises of which they form part or unincorporated enterprises owned by households all or most of whose output is intended for final consumption or gross fixed capital formation by those households.
Own-account workers Own-account workers are self-employed persons without paid employees.
P Paasche price index
A Paasche price index is the harmonic average of price relatives using the values of the later period as weights.
Paasche volume index A Paasche volume index is the harmonic average of volume relatives using the values of the later period as weights.
Payments in kind other than remuneration in kind Payments in kind other than remuneration in kind occur when any of a wide variety of payments are made in the form of goods and services rather than money.
Pension funds Pension funds are units established for purposes of providing benefits on retirement for specific groups of employees; they have their own assets and liabilities, and they engage in financial transactions in the market on their own account; these funds are organised, and directed, by individual private or government employers, or jointly by individual employers and their employees.
Price The price of a good or service is defined as the value of one unit of that good or service.
Price index A price index is an average of the proportionate changes in the prices of a specified set of goods and services between two periods of time.
Primary incomes Primary incomes are incomes that accrue to institutional units as a consequence of their involvement in processes of production or ownership of assets that may be needed for purposes of production.
Principal activity The principal activity of a producer unit is the activity whose value added exceeds that of any other activity carried out within the same unit.
Producer's price A producer's price is the amount receivable by the producer from the purchaser for a unit of a good or service produced as output minus any VAT, or similar deductible tax, invoiced to the purchaser; it excludes any transport charges invoiced separately by the producer.
Production Production is an activity, carried out under the responsibility, control and management of an institutional unit, that uses inputs of labour, capital, and goods and services to produce outputs of goods and services.
Production account The production account records the activity of producing goods and services as defined within the SNA.
Production boundary The production boundary includes all production actually destined for the market, whether for sale or barter, all goods or services provided free to individual households or collectively to the community by government units or NPISHs, all goods produced for own use, own-account production of housing services and services produced by employing paid domestic staff.
Property income Property income is the sum of investment income and rent.
Purchaser’s price The purchaser’s price is the amount paid by the purchaser, excluding any VAT or similar tax deductible by the purchaser, in order to take delivery of a unit of a good or service at the time and place required by the purchaser. The purchaser’s price of a good includes any transport charges paid separately by the purchaser to take delivery at the required time and place.
Glossary
74
Purchasing power parity (PPP) A purchasing power parity (PPP) is defined as the number of units of B’s currency that are needed in B to purchase the same quantity of individual good or service as one unit of A’s currency will purchase in A.
Q Quasi-corporations
Quasi-corporations are unincorporated
enterprises that function as if they were corporations, and which have complete sets of accounts, including balance sheets.
R Real holding gains and losses
A real holding gain (loss) is the amount by which the value of an asset increases (decreases) over the neutral holding gain for the period, in the absence of transactions and other changes in the volume of assets.
Real interest Real interest is the difference between an actual payment of nominal interest and a payment equal to the loss of purchasing power on the monetary value of the principal during the accounting period.
Reference rate of interest The reference rate of interest (to be used in allocating FISIM) is the pure cost of borrowing funds (i.e. a rate from which the risk premium has been eliminated to the greatest extent possible and which does not include any intermediation services).
Remuneration in kind Remuneration in kind occurs when an employee accepts payment in the form of goods and services instead of money.
Rent Rent is the income receivable by the owner of a natural resource (the lessor or landlord) for putting the natural resource at the disposal of another institutional unit (a lessee or tenant) for use of the natural resource in production.
Rental The rental is the amount payable by the user of a fixed asset to its owner, under an operating lease or similar contract, for the right to use that asset in production for a specified period of time.
Rents on subsoil assets Rents on subsoil assets are a form of property income; they consist of the payments made to the owners of the subsoil assets by institutional units permitting them to extract the subsoil deposits over a specified period.
Research and development Research and development consists of the value of expenditures on creative work undertaken on a systematic basis in order to increase the stock of knowledge, including knowledge of man, culture and society, and use of this stock of knowledge to devise new applications. This does not extend to including human capital as assets within the SNA.
Residence The residence of each institutional unit is the economic territory with which it has the strongest connection, in other words, its centre of predominant economic interest.
Rest of the world The rest of the world consists of all non-resident institutional units that enter into transactions with resident units, or have other economic links with resident units.
S Saving
Saving represents that part of disposable income (adjusted for the change in pension entitlements) that is not spent on final consumption goods and services.
Services Services are the result of a production activity that changes the conditions of the consuming units, or facilitates the exchange of products or financial assets.
Single indicator method of deflation A single indicator method of deflation is a means of estimating the volume movements of value added directly using only one time series instead of double deflation.
Social security schemes Social security schemes are schemes imposed and controlled by government units for the purpose of providing social benefits to members of the community as a whole, or of particular sections of the community.
Social transfers in kind Social transfers in kind consist of goods and services provided to households by government and NPISHs either free or at prices that are not economically significant.
Glossary
75
State government State governments are institutional units exercising some of the functions of government at a level below that of central government and above that of the governmental institutional units existing at a local level; they are institutional units whose fiscal, legislative and executive authority extends only over the individual "states" (often referred to as "provinces") into which the country as a whole may be divided.
Subsidies Subsidies are current unrequited payments that government units, including non-resident government units, make to enterprises on the basis of the levels of their production activities or the quantities or values of the goods or services which they produce, sell or import.
T Taxes on products
Taxes on products, excluding VAT, import and export taxes, consist of taxes on goods and services that become payable as a result of the production, sale, transfer, leasing or delivery of those goods or services, or as a result of their use for own consumption or own capital formation.
Taxes and duties on imports Taxes and duties on imports, excluding VAT, consist of taxes on goods and services that become payable at the moment when the goods cross the national or customs frontiers of the economic territory or when the services are delivered by non-resident producers to resident institutional units.
Taxes on entertainment Taxes on entertainment consist of any taxes which are levied specifically on the entertainment itself (such as on an entry ticket) and which are not part of some broader tax such as a VAT.
Taxes on imports Taxes on imports consist of taxes and duties on imports that become payable when goods enter the economic territory by crossing the frontier or when services are delivered to resident units by non-resident units.
Taxes on international transactions Taxes on international transactions consist of taxes on travel abroad, foreign remittances, foreign investments, etc. except those payable by producers (such taxes payable by producers are part of taxes on production while those payable by non-producers are part of other current taxes).
Taxes on land, buildings or other structures Taxes on land, buildings or other structures consist of taxes payable regularly, usually each year, in respect of the use or ownership of land, buildings or other structures utilised by enterprises in production, whether the enterprises own or rent such assets.
Taxes on lotteries, gambling and betting Taxes on lotteries, gambling and betting consist of any taxes, other than taxes on winnings, which are levied on these types of operations; they are typically levied as a percentage of the operator’s turnover.
Taxes less subsidies on production Taxes less subsidies on production consist of taxes payable or subsidies receivable on goods or services produced as outputs and other taxes or subsidies on production, such as those payable on the labour, machinery, buildings or other assets used in production.
Taxes on specific services Taxes on specific services consist of all taxes assessed on the payment for specific services such as taxes on transportation, communications, insurance, advertising, hotels or lodging, restaurants, entertainment, gambling and lotteries, sporting events, etc.
Taxes on the use of fixed assets
Taxes on the use of fixed assets include taxes levied periodically on the use of vehicles, ships, aircraft or other machinery or equipment used by enterprises for purposes of production, whether such assets are owned or rented.
Time of acquisition The times at which goods and services are acquired are when the change of ownership occurs or the delivery of the services is completed.
Time of recording Transactions between institutional units have to be recorded when claims and obligations arise, are transformed or are cancelled - that is, on an accrual basis.
Total economy The total economy is defined as the entire set of resident institutional units.
Total final consumption Total final consumption is the total value of all expenditures on individual and collective consumption goods and services incurred by resident households, resident NPISHs serving households and general government units.
Glossary
76
Trade margin A trade margin is the difference between the actual or imputed price realised on a good purchased for resale (either wholesale or retail) and the price that would have to be paid by the distributor to replace the good at the time it is sold or otherwise disposed of.
Trading gains and losses
The trading gain or loss from changes in the terms of trade is the difference between real GDI and GDP in volume terms.
Transfer
A transfer is a transaction in which one institutional unit provides a good, service or asset to another unit without receiving from the latter any good, service or asset in return as a direct counterpart.
Transport equipment
Transport equipment consists of equipment for moving people and objects.
Transport margins
A transport margin consists of those transport charges paid separately by the purchaser in taking delivery at the required time and place.
V Valuables
Valuables are produced goods of considerable value that are not used primarily for production or consumption but are held as store of value over time.
Value added - gross Gross value added is the value of output less the value of intermediate consumption; it is a measure of the contribution to GDP made by an individual producer, industry or sector.
Volume index A volume index is an average of the proportionate changes in the quantities of a specified set of goods or services between two periods of time.
W Weapons systems
Weapon Systems include vehicles and other equipment such as warships, submarines, military aircraft, tanks, missile carriers and launchers, etc. are recognised as produced assets.
Wages and salaries Wages and salaries consist of the sum of wages and salaries in cash and wages and salaries in kind.
Wages and salaries in cash
Wages and salaries in cash consist of wages or salaries payable at regular weekly, monthly or other intervals, including payments by results and piecework payments; plus allowances such as those for working overtime; plus amounts paid to employees away from work for on holiday; plus ad hoc bonuses and similar payments; plus commissions, gratuities and tips received by employees.
Wages and salaries in kind
Wages and salaries in kind consist of remuneration in the form of goods and/or services that are not necessary for work and can be used by employees in their own time, and at their own discretion, for the satisfaction of their own needs or want or those of other members of their households.
Work-in-progress
Work-in-progress consists of output produced by an enterprise that is not yet sufficiently processed to be in a state in which it is normally supplied to other institutional units.
Work-in-progress on cultivated biological resources Work-in-progress on cultivated biological resources consists of output that is not yet sufficiently mature to be in a state in which it is normally supplied to other institutional units.

DISEMAK OLEH :
TANDATANGAN :