malaysia industry
TRANSCRIPT
8/10/2019 Malaysia Industry
http://slidepdf.com/reader/full/malaysia-industry 1/16
Productivity Performance of the
Manufacturing SectorIn this chapter:
• Electrical & Electronics
• Palm Oil Industry
• Basic Metals
• Chemicals & Chemical Products
• Basic Pharmaceutical Products
8/10/2019 Malaysia Industry
http://slidepdf.com/reader/full/malaysia-industry 2/16
PRODUCTIVITYPERFORMANCE OF THE
MANUFACTURING
SECTOR
P
roductivity growth in the manufacturing
sector rose to 5.4% to RM88,389 in 2013 from
4.5% in 2012. It continues to be the second
largest contributor to national GDP, with its share of
GDP growing by 3.4% to RM193 billion. The sector also
employed 2.2 million people, comprising 16.8% of the
country’s total employment.
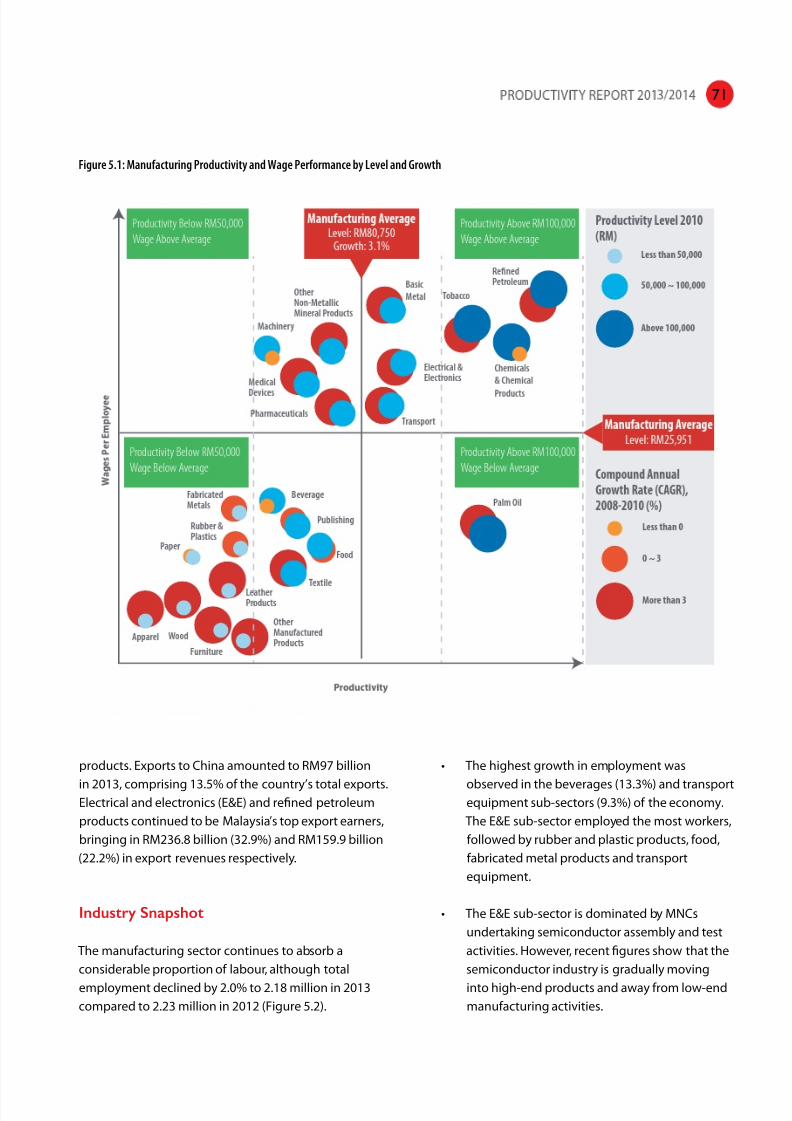
As one of the main engines for economic growth, three
sub-sectors of manufacturing (palm oil, electrical and
electronics and refined petroleum products) have been
identified as NKEAs to raise Gross National Income (GNI)
and create greater employment opportunities towardsachieving a high income economy by 2020. Besides
these NKEAs, several sub-sectors have the potential to
grow further such as transport equipment, chemical
and chemical products, basic pharmaceutical products
and basic metals (Figure 5.1). These sub-sectors all have
high productivity growth rates and could potentially
generate higher wage jobs.
The manufacturing sector consists of export-oriented
and domestic-oriented industries. China, Singapore,
the European Union, Japan and the USA are the main
export destinations for Malaysia’s manufactured
Productivity growth within the
manufacturing sector increasedto 5.4% to RM88,389 in 2013
boosted by high productivity
growth rates within the transport
equipment (10%), textiles (8.5%)
and other non-metallic mineral
products (8.0%) sub-sectors.
8/10/2019 Malaysia Industry
http://slidepdf.com/reader/full/malaysia-industry 3/16
products. Exports to China amounted to RM97 billion
in 2013, comprising 13.5% of the country’s total exports.Electrical and electronics (E&E) and refined petroleum
products continued to be Malaysia’s top export earners,
bringing in RM236.8 billion (32.9%) and RM159.9 billion
(22.2%) in export revenues respectively.
Industry Snapshot
The manufacturing sector continues to absorb a
considerable proportion of labour, although total
employment declined by 2.0% to 2.18 million in 2013
compared to 2.23 million in 2012 (Figure 5.2).
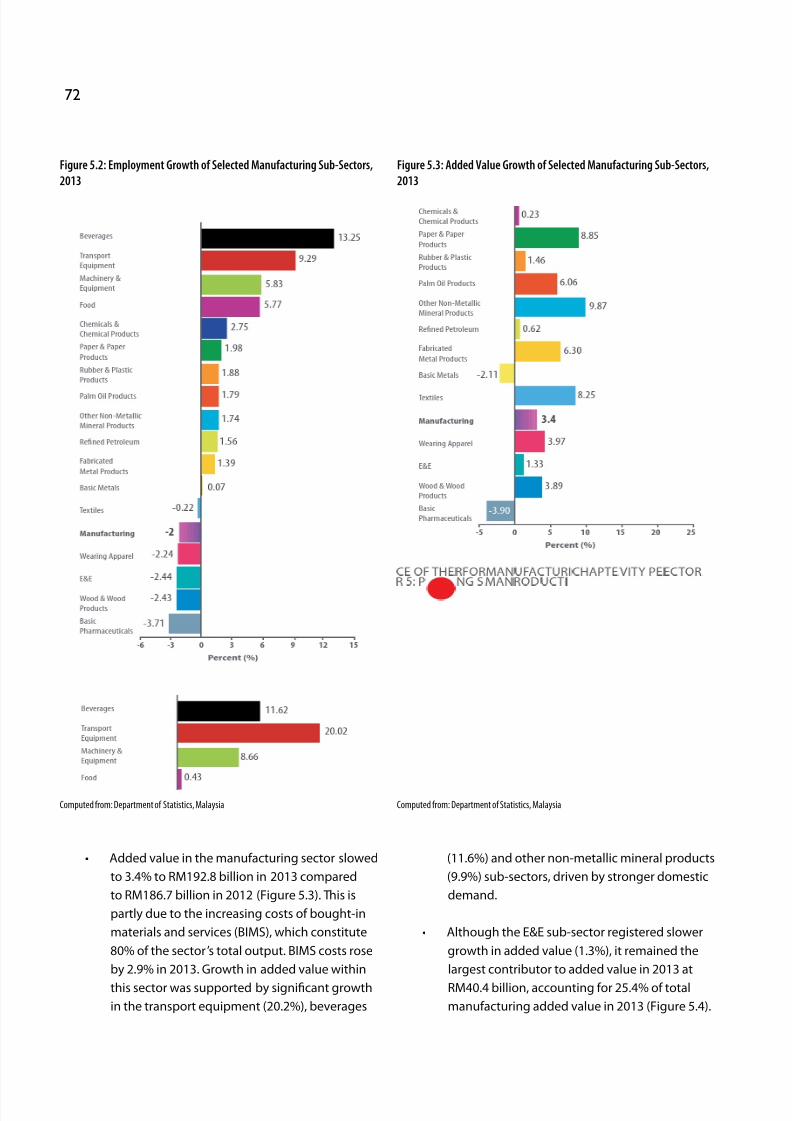
• The highest growth in employment was
observed in the beverages (13.3%) and transportequipment sub-sectors (9.3%) of the economy.
The E&E sub-sector employed the most workers,
followed by rubber and plastic products, food,
fabricated metal products and transport
equipment.
• The E&E sub-sector is dominated by MNCs
undertaking semiconductor assembly and test
activities. However, recent figures show that the
semiconductor industry is gradually moving
into high-end products and away from low-end
manufacturing activities.
Figure 5.1: Manufacturing Productivity and Wage Performance by Level and Growth
71
8/10/2019 Malaysia Industry
http://slidepdf.com/reader/full/malaysia-industry 4/16
• Added value in the manufacturing sector slowed
to 3.4% to RM192.8 billion in 2013 compared
to RM186.7 billion in 2012 (Figure 5.3). This is
partly due to the increasing costs of bought-in
materials and services (BIMS), which constitute
80% of the sector ’s total output. BIMS costs rose
by 2.9% in 2013. Growth in added value within
this sector was supported by significant growth
in the transport equipment (20.2%), beverages
(11.6%) and other non-metallic mineral products
(9.9%) sub-sectors, driven by stronger domestic
demand.
• Although the E&E sub-sector registered slower
growth in added value (1.3%), it remained the
largest contributor to added value in 2013 at
RM40.4 billion, accounting for 25.4% of total
manufacturing added value in 2013 (Figure 5.4).
Figure 5.2: Employment Growth of Selected Manufacturing Sub-Sectors,
2013
Computed from: Department of Statistics, Malaysia
Figure 5.3: Added Value Growth of Selected Manufacturing Sub-Sectors,
2013
Computed from: Department of Statistics, Malaysia
72

8/10/2019 Malaysia Industry
http://slidepdf.com/reader/full/malaysia-industry 5/16
• Exports for the E&E sub-sector increased by
2.4% compared to 2012, due in part to the
recovery of the global semiconductor industry.
Demand for semiconductors was strongest
in China, Singapore, the USA and Germany.
China remained the principal export market for
Malaysia’s E&E producers, buying 17% (RM40.2
billion) of the country’s total exports.
• The refined petroleum and chemicals and
chemical products sub-sectors were the second
(15.9%) and third (10.6%) largest contributors to
added value.
• Although added value growth within the
transport equipment sub-sector was higher in
2013, its total contribution was still four times
less than that of the E&E sub-sector.
Figure 5.4: Added Value Contribution of Selected Manufacturing Sub-Sectors, 2013
Computed from: Department of Statistics, Malaysia
73
8/10/2019 Malaysia Industry
http://slidepdf.com/reader/full/malaysia-industry 6/16
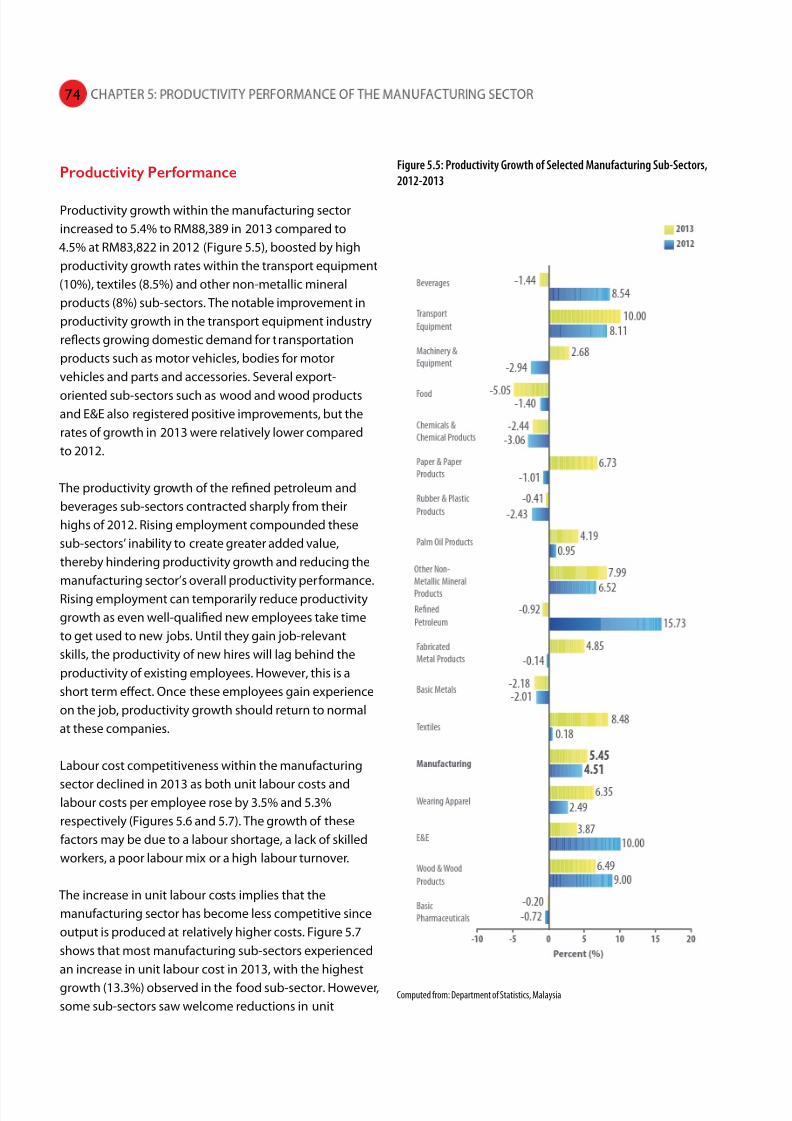
Productivity Performance
Productivity growth within the manufacturing sector
increased to 5.4% to RM88,389 in 2013 compared to
4.5% at RM83,822 in 2012 (Figure 5.5), boosted by high
productivity growth rates within the transport equipment
(10%), textiles (8.5%) and other non-metallic mineral
products (8%) sub-sectors. The notable improvement in
productivity growth in the transport equipment industry
reflects growing domestic demand for transportation
products such as motor vehicles, bodies for motor
vehicles and parts and accessories. Several export-
oriented sub-sectors such as wood and wood products
and E&E also registered positive improvements, but the
rates of growth in 2013 were relatively lower compared
to 2012.
The productivity growth of the refined petroleum and
beverages sub-sectors contracted sharply from their
highs of 2012. Rising employment compounded these
sub-sectors’ inability to create greater added value,
thereby hindering productivity growth and reducing the
manufacturing sector’s overall productivity performance.
Rising employment can temporarily reduce productivity
growth as even well-qualified new employees take time
to get used to new jobs. Until they gain job-relevant
skills, the productivity of new hires will lag behind the
productivity of existing employees. However, this is a
short term effect. Once these employees gain experience
on the job, productivity growth should return to normal
at these companies.
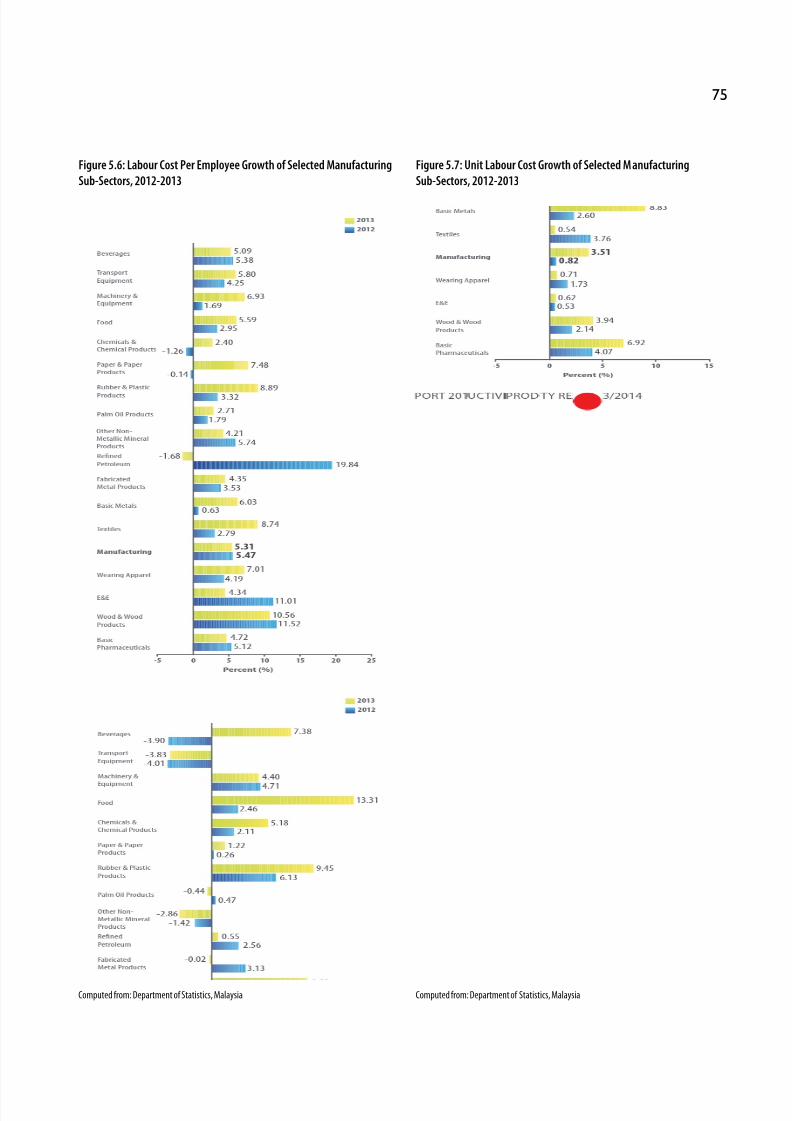
Labour cost competitiveness within the manufacturing
sector declined in 2013 as both unit labour costs andlabour costs per employee rose by 3.5% and 5.3%
respectively (Figures 5.6 and 5.7). The growth of these
factors may be due to a labour shortage, a lack of skilled
workers, a poor labour mix or a high labour turnover.
The increase in unit labour costs implies that the
manufacturing sector has become less competitive since
output is produced at relatively higher costs. Figure 5.7
shows that most manufacturing sub-sectors experienced
an increase in unit labour cost in 2013, with the highest
growth (13.3%) observed in the food sub-sector. However,
some sub-sectors saw welcome reductions in unit
Figure 5.5: Productivity Growth of Selected Manufacturing Sub-Sectors,
2012-2013
Computed from: Department of Statistics, Malaysia
74
8/10/2019 Malaysia Industry
http://slidepdf.com/reader/full/malaysia-industry 7/16
Figure 5.6: Labour Cost Per Employee Growth of Selected Manufacturing
Sub-Sectors, 2012-2013
Computed from: Department of Statistics, Malaysia
Figure 5.7: Unit Labour Cost Growth of Selected Manufacturing
Sub-Sectors, 2012-2013
Computed from: Department of Statistics, Malaysia
75
8/10/2019 Malaysia Industry
http://slidepdf.com/reader/full/malaysia-industry 8/16
labour cost ratios including transport equipment, other
non-metallic mineral products, palm oil and fabricatedproducts.
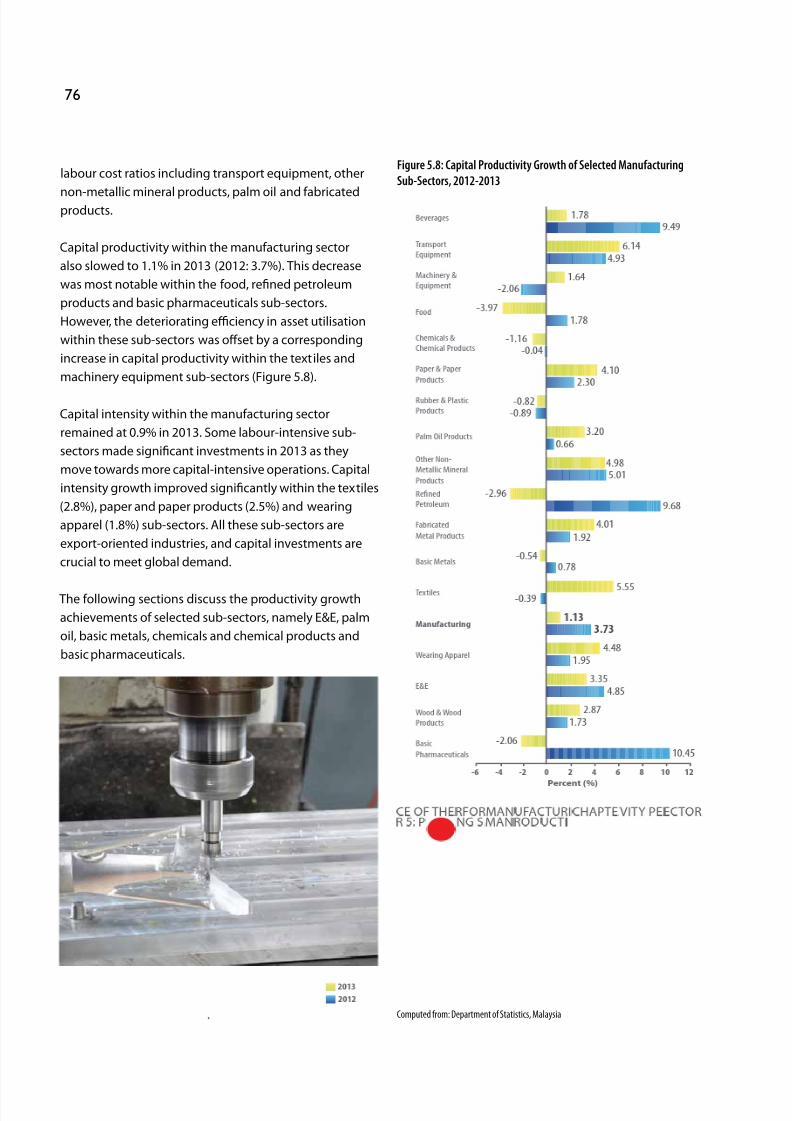
Capital productivity within the manufacturing sector
also slowed to 1.1% in 2013 (2012: 3.7%). This decrease
was most notable within the food, refined petroleum
products and basic pharmaceuticals sub-sectors.
However, the deteriorating efficiency in asset utilisation
within these sub-sectors was offset by a corresponding
increase in capital productivity within the textiles and
machinery equipment sub-sectors (Figure 5.8).
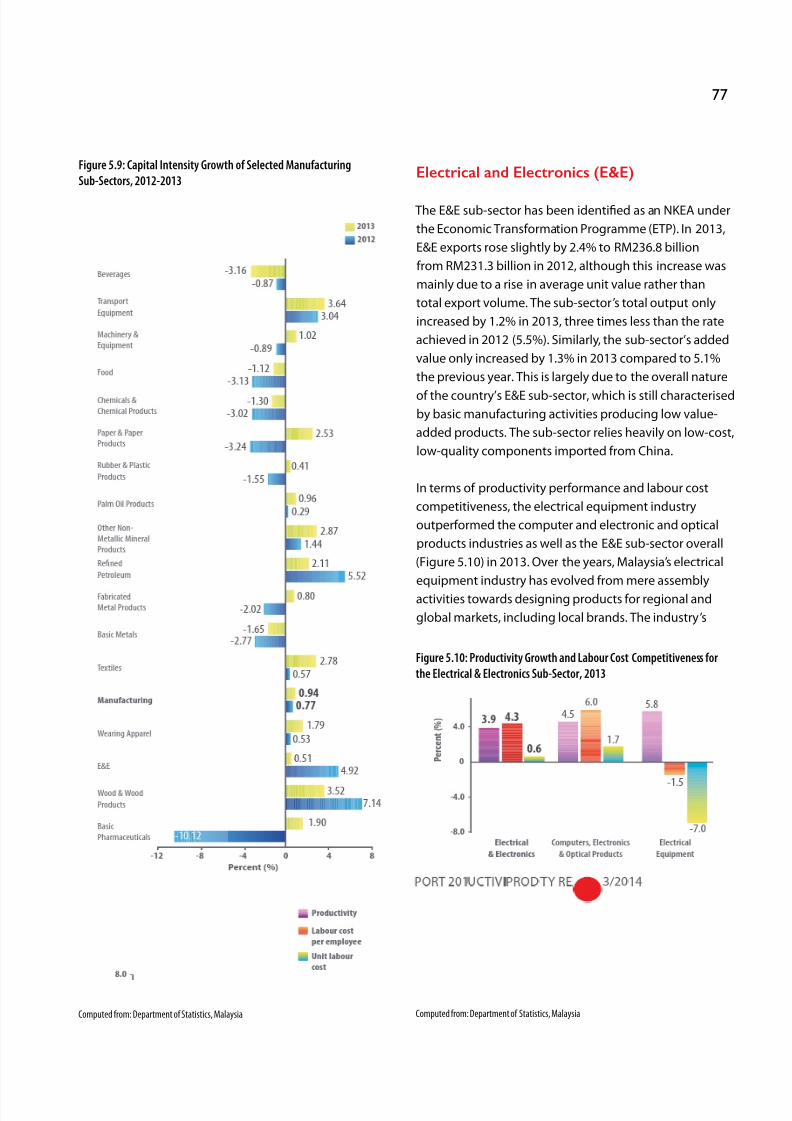
Capital intensity within the manufacturing sector
remained at 0.9% in 2013. Some labour-intensive sub-
sectors made significant investments in 2013 as they
move towards more capital-intensive operations. Capital
intensity growth improved significantly within the textiles
(2.8%), paper and paper products (2.5%) and wearing
apparel (1.8%) sub-sectors. All these sub-sectors are
export-oriented industries, and capital investments are
crucial to meet global demand.
The following sections discuss the productivity growth
achievements of selected sub-sectors, namely E&E, palm
oil, basic metals, chemicals and chemical products and
basic pharmaceuticals.
Figure 5.8: Capital Productivity Growth of Selected Manufacturing
Sub-Sectors, 2012-2013
Computed from: Department of Statistics, Malaysia
76
8/10/2019 Malaysia Industry
http://slidepdf.com/reader/full/malaysia-industry 9/16
Electrical and Electronics (E&E)
The E&E sub-sector has been identified as an NKEA under
the Economic Transformation Programme (ETP). In 2013,
E&E exports rose slightly by 2.4% to RM236.8 billion
from RM231.3 billion in 2012, although this increase was
mainly due to a rise in average unit value rather than
total export volume. The sub-sector’s total output only
increased by 1.2% in 2013, three times less than the rate
achieved in 2012 (5.5%). Similarly, the sub-sector’s added
value only increased by 1.3% in 2013 compared to 5.1%
the previous year. This is largely due to the overall nature
of the country’s E&E sub-sector, which is still characterised
by basic manufacturing activities producing low value-
added products. The sub-sector relies heavily on low-cost,
low-quality components imported from China.
In terms of productivity performance and labour cost
competitiveness, the electrical equipment industry
outperformed the computer and electronic and optical
products industries as well as the E&E sub-sector overall
(Figure 5.10) in 2013. Over the years, Malaysia’s electrical
equipment industry has evolved from mere assembly
activities towards designing products for regional and
global markets, including local brands. The industry’s
Figure 5.9: Capital Intensity Growth of Selected Manufacturing
Sub-Sectors, 2012-2013
Computed from: Department of Statistics, Malaysia
Figure 5.10: Productivity Growth and Labour Cost Competitiveness for
the Electrical & Electronics Sub-Sector, 2013
Computed from: Department of Statistics, Malaysia
77
8/10/2019 Malaysia Industry
http://slidepdf.com/reader/full/malaysia-industry 10/16
productivity performance as well as labour cost
competitiveness shows that its capabilities and skills havedeveloped significantly. Besides household appliances
such as air-conditioners, refrigerators, washing machines,
vacuum cleaners and other electrical appliances, the
industry is also a major producer of electrical industrial
equipment and electrical components. In other countries
such as Japan, the E&E sub-sector is moving toward
higher value goods and green technology products.
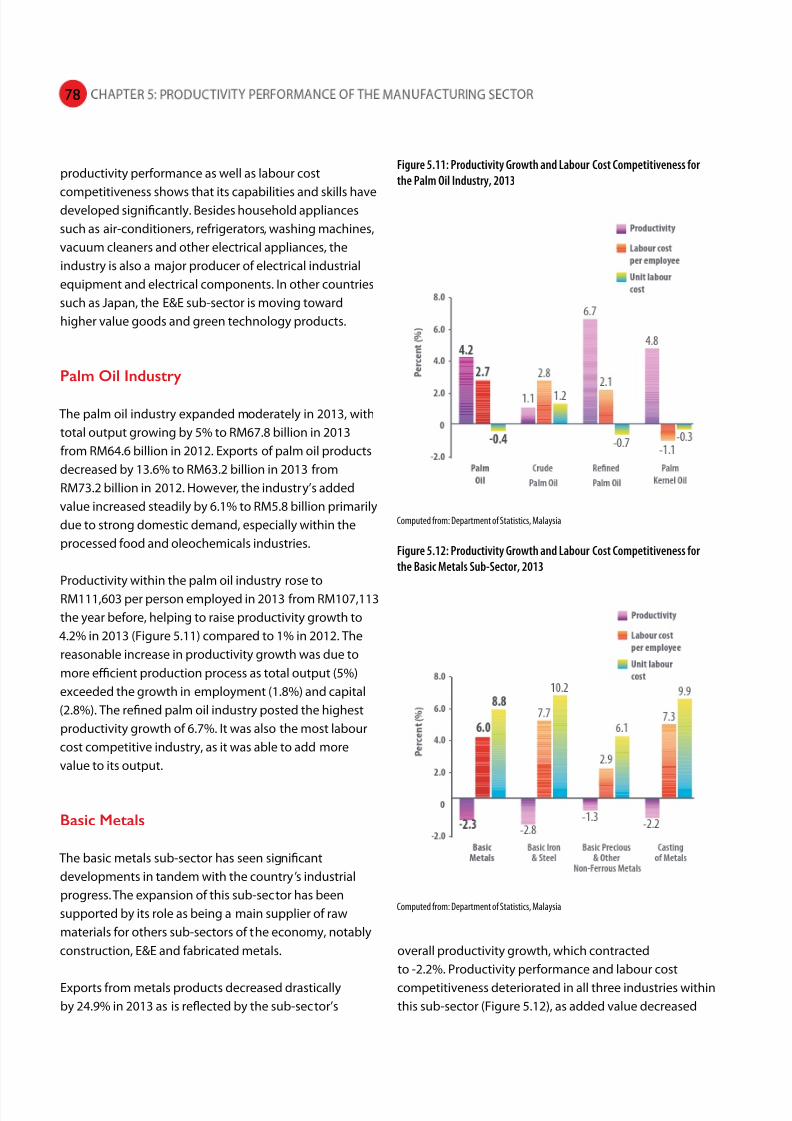
Palm Oil Industry
The palm oil industry expanded moderately in 2013, with
total output growing by 5% to RM67.8 billion in 2013
from RM64.6 billion in 2012. Exports of palm oil products
decreased by 13.6% to RM63.2 billion in 2013 from
RM73.2 billion in 2012. However, the industry’s added
value increased steadily by 6.1% to RM5.8 billion primarily
due to strong domestic demand, especially within the
processed food and oleochemicals industries.
Productivity within the palm oil industry rose to
RM111,603 per person employed in 2013 from RM107,113
the year before, helping to raise productivity growth to
4.2% in 2013 (Figure 5.11) compared to 1% in 2012. The
reasonable increase in productivity growth was due to
more efficient production process as total output (5%)
exceeded the growth in employment (1.8%) and capital
(2.8%). The refined palm oil industry posted the highest
productivity growth of 6.7%. It was also the most labour
cost competitive industry, as it was able to add more
value to its output.
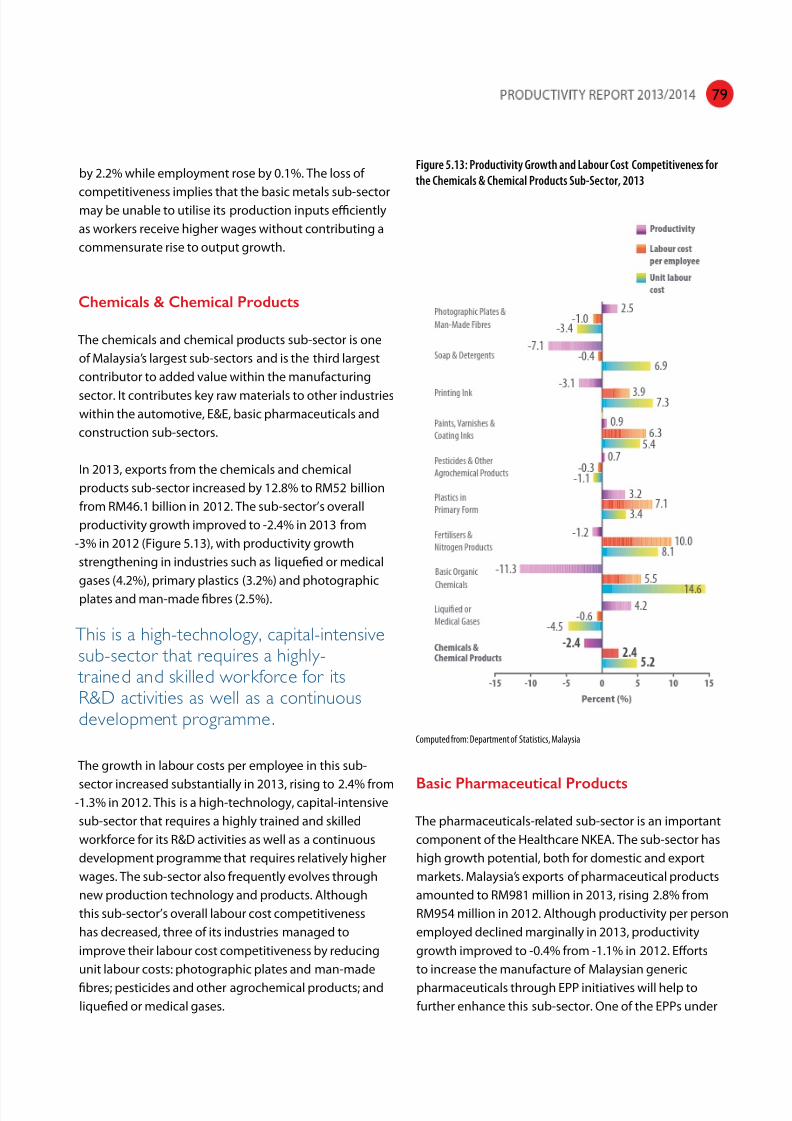
Basic Metals
The basic metals sub-sector has seen significant
developments in tandem with the country’s industrial
progress. The expansion of this sub-sector has been
supported by its role as being a main supplier of raw
materials for others sub-sectors of the economy, notably
construction, E&E and fabricated metals.
Exports from metals products decreased drastically
by 24.9% in 2013 as is reflected by the sub-sector’s
overall productivity growth, which contracted
to -2.2%. Productivity performance and labour cost
competitiveness deteriorated in all three industries within
this sub-sector (Figure 5.12), as added value decreased
Figure 5.11: Productivity Growth and Labour Cost Competitiveness for
the Palm Oil Industry, 2013
Computed from: Department of Statistics, Malaysia
Figure 5.12: Productivity Growth and Labour Cost Competitiveness for
the Basic Metals Sub-Sector, 2013
Computed from: Department of Statistics, Malaysia
78
8/10/2019 Malaysia Industry
http://slidepdf.com/reader/full/malaysia-industry 11/16
by 2.2% while employment rose by 0.1%. The loss of
competitiveness implies that the basic metals sub-sectormay be unable to utilise its production inputs efficiently
as workers receive higher wages without contributing a
commensurate rise to output growth.
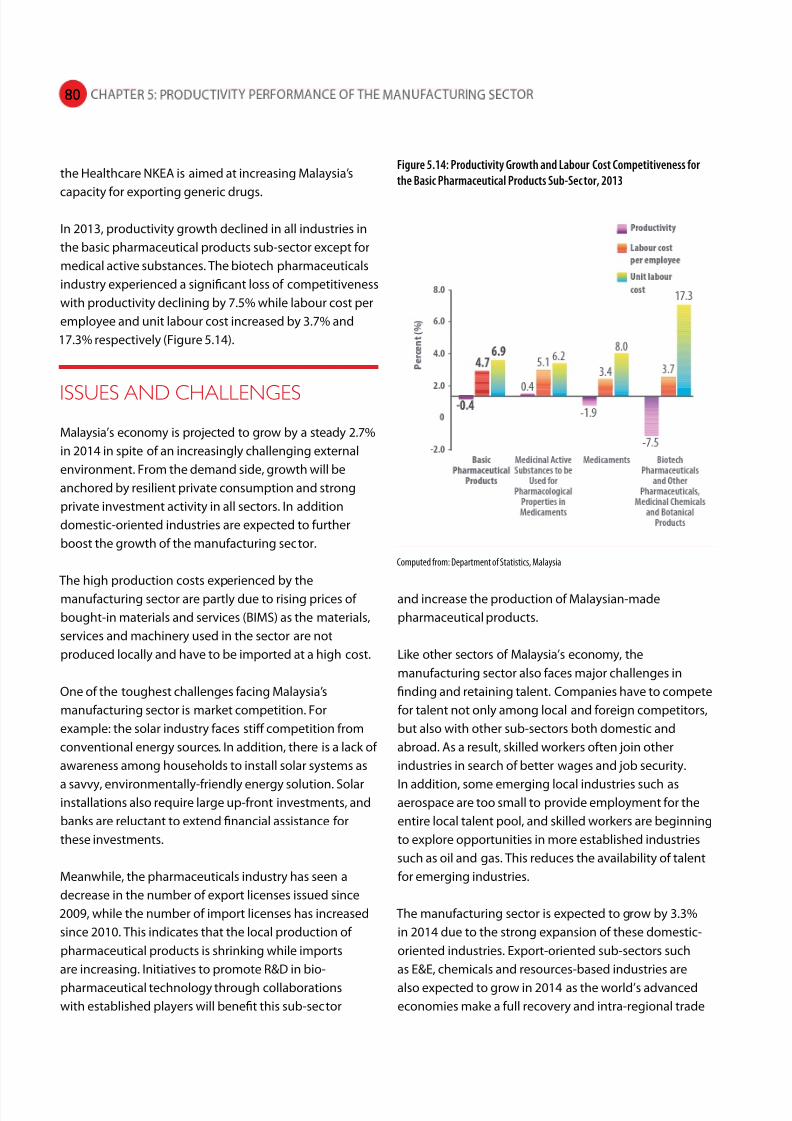
Chemicals & Chemical Products
The chemicals and chemical products sub-sector is one
of Malaysia’s largest sub-sectors and is the third largest
contributor to added value within the manufacturing
sector. It contributes key raw materials to other industries
within the automotive, E&E, basic pharmaceuticals and
construction sub-sectors.
In 2013, exports from the chemicals and chemical
products sub-sector increased by 12.8% to RM52 billion
from RM46.1 billion in 2012. The sub-sector’s overall
productivity growth improved to -2.4% in 2013 from
-3% in 2012 (Figure 5.13), with productivity growth
strengthening in industries such as liquefied or medical
gases (4.2%), primary plastics (3.2%) and photographic
plates and man-made fibres (2.5%).
This is a high-technology, capital-intensivesub-sector that requires a highly-
trained and skilled workforce for itsR&D activities as well as a continuousdevelopment programme.
The growth in labour costs per employee in this sub-
sector increased substantially in 2013, rising to 2.4% from-1.3% in 2012. This is a high-technology, capital-intensive
sub-sector that requires a highly trained and skilled
workforce for its R&D activities as well as a continuous
development programme that requires relatively higher
wages. The sub-sector also frequently evolves through
new production technology and products. Although
this sub-sector’s overall labour cost competitiveness
has decreased, three of its industries managed to
improve their labour cost competitiveness by reducing
unit labour costs: photographic plates and man-made
fibres; pesticides and other agrochemical products; and
liquefied or medical gases.
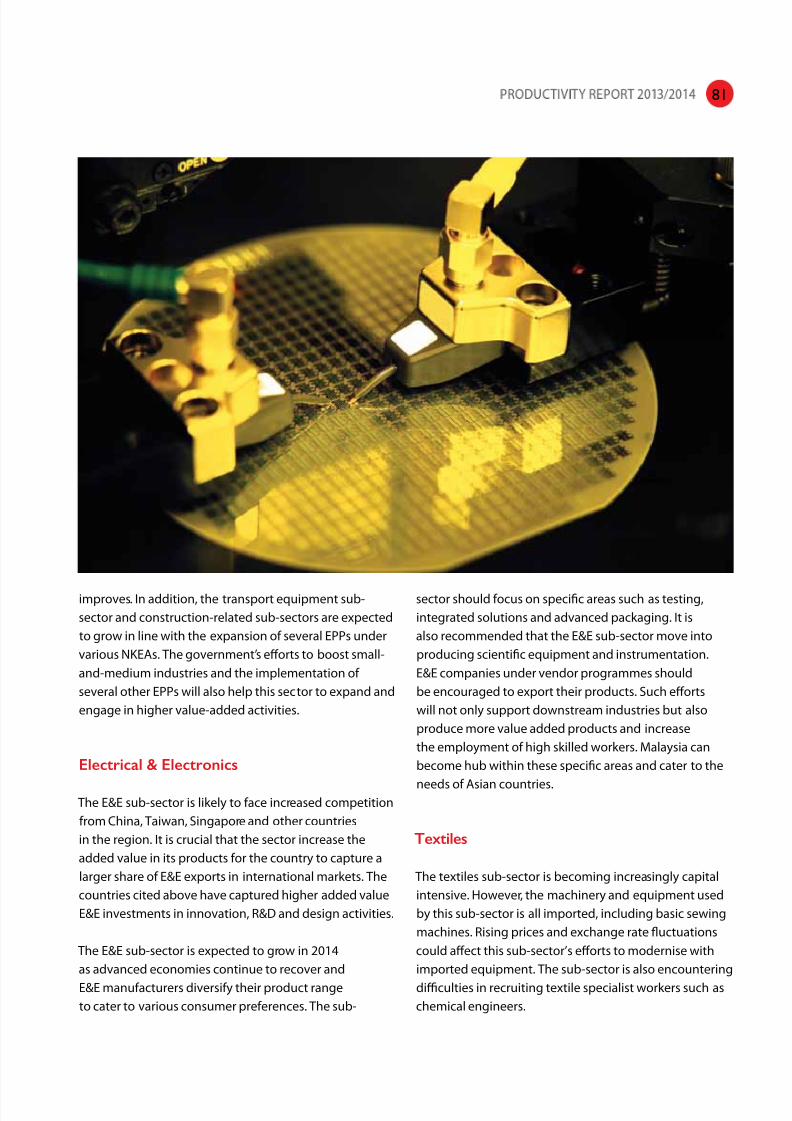
Basic Pharmaceutical Products
The pharmaceuticals-related sub-sector is an important
component of the Healthcare NKEA. The sub-sector has
high growth potential, both for domestic and export
markets. Malaysia’s exports of pharmaceutical products
amounted to RM981 million in 2013, rising 2.8% from
RM954 million in 2012. Although productivity per person
employed declined marginally in 2013, productivity
growth improved to -0.4% from -1.1% in 2012. Efforts
to increase the manufacture of Malaysian generic
pharmaceuticals through EPP initiatives will help to
further enhance this sub-sector. One of the EPPs under
Figure 5.13: Productivity Growth and Labour Cost Competitiveness for
the Chemicals & Chemical Products Sub-Sec tor, 2013
Computed from: Department of Statistics, Malaysia
79
8/10/2019 Malaysia Industry
http://slidepdf.com/reader/full/malaysia-industry 12/16
the Healthcare NKEA is aimed at increasing Malaysia’s
capacity for exporting generic drugs.
In 2013, productivity growth declined in all industries in
the basic pharmaceutical products sub-sector except for
medical active substances. The biotech pharmaceuticals
industry experienced a significant loss of competitiveness
with productivity declining by 7.5% while labour cost per
employee and unit labour cost increased by 3.7% and
17.3% respectively (Figure 5.14).
ISSUES AND CHALLENGES
Malaysia’s economy is projected to grow by a steady 2.7%
in 2014 in spite of an increasingly challenging external
environment. From the demand side, growth will be
anchored by resilient private consumption and strong
private investment activity in all sectors. In addition
domestic-oriented industries are expected to further
boost the growth of the manufacturing sector.
The high production costs experienced by the
manufacturing sector are partly due to rising prices of
bought-in materials and services (BIMS) as the materials,
services and machinery used in the sector are not
produced locally and have to be imported at a high cost.
One of the toughest challenges facing Malaysia’s
manufacturing sector is market competition. For
example: the solar industry faces stiff competition from
conventional energy sources. In addition, there is a lack of
awareness among households to install solar systems as
a savvy, environmentally-friendly energy solution. Solarinstallations also require large up-front investments, and
banks are reluctant to extend financial assistance for
these investments.
Meanwhile, the pharmaceuticals industry has seen a
decrease in the number of export licenses issued since
2009, while the number of import licenses has increased
since 2010. This indicates that the local production of
pharmaceutical products is shrinking while imports
are increasing. Initiatives to promote R&D in bio-
pharmaceutical technology through collaborations
with established players will benefit this sub-sector
and increase the production of Malaysian-made
pharmaceutical products.
Like other sectors of Malaysia’s economy, the
manufacturing sector also faces major challenges in
finding and retaining talent. Companies have to compete
for talent not only among local and foreign competitors,
but also with other sub-sectors both domestic and
abroad. As a result, skilled workers often join other
industries in search of better wages and job security.
In addition, some emerging local industries such asaerospace are too small to provide employment for the
entire local talent pool, and skilled workers are beginning
to explore opportunities in more established industries
such as oil and gas. This reduces the availability of talent
for emerging industries.
The manufacturing sector is expected to grow by 3.3%
in 2014 due to the strong expansion of these domestic-
oriented industries. Export-oriented sub-sectors such
as E&E, chemicals and resources-based industries are
also expected to grow in 2014 as the world’s advanced
economies make a full recovery and intra-regional trade
Figure 5.14: Productivity Growth and Labour Cost Competitiveness for
the Basic Pharmaceutical Products Sub-Sec tor, 2013
Computed from: Department of Statistics, Malaysia
80
8/10/2019 Malaysia Industry
http://slidepdf.com/reader/full/malaysia-industry 13/16
improves. In addition, the transport equipment sub-
sector and construction-related sub-sectors are expected
to grow in line with the expansion of several EPPs under
various NKEAs. The government’s efforts to boost small-
and-medium industries and the implementation of
several other EPPs will also help this sector to expand and
engage in higher value-added activities.
Electrical & Electronics
The E&E sub-sector is likely to face increased competition
from China, Taiwan, Singapore and other countries
in the region. It is crucial that the sector increase the
added value in its products for the country to capture a
larger share of E&E exports in international markets. The
countries cited above have captured higher added value
E&E investments in innovation, R&D and design activities.
The E&E sub-sector is expected to grow in 2014
as advanced economies continue to recover and
E&E manufacturers diversify their product range
to cater to various consumer preferences. The sub-
sector should focus on specific areas such as testing,
integrated solutions and advanced packaging. It is
also recommended that the E&E sub-sector move into
producing scientific equipment and instrumentation.
E&E companies under vendor programmes should
be encouraged to export their products. Such efforts
will not only support downstream industries but also
produce more value added products and increase
the employment of high skilled workers. Malaysia can
become hub within these specific areas and cater to the
needs of Asian countries.
Textiles
The textiles sub-sector is becoming increasingly capital
intensive. However, the machinery and equipment used
by this sub-sector is all imported, including basic sewing
machines. Rising prices and exchange rate fluctuations
could affect this sub-sector’s efforts to modernise with
imported equipment. The sub-sector is also encountering
difficulties in recruiting textile specialist workers such as
chemical engineers.
81
8/10/2019 Malaysia Industry
http://slidepdf.com/reader/full/malaysia-industry 14/16
In order for the textile sub-sector to produce higher value
added products, it needs the support of other industriessuch as petrochemicals. Korea has already moved
into upstream textile industries focused on producing
synthetic fabrics such as artificial silk. If Malaysia takes
similar steps to promote these types of products, the
textile sub-sector will not only increase its added
value but also help other industries to grow such as
petrochemicals and transport and storage.
It is recommended that the government reconsider
the textile industry cluster approach to promoting
industrial development within this sub-sector to create
multiplier effects throughout the manufacturing sector.
To address the shortage of skilled talent, the government
should encourage Technical Education and Vocational
Training (TEVT) within textile job specialisations by
certifying graduates that are accredited and recognised
internationally.
Palm Oil Industry
From the supply side, the palm oil industry is expected
to continue to progress at a steady rate as the Palm Oil
Industry Cluster (POIC) project in Sabah commences
operations in downstream activities. Declining
international prices for seed products might limit further
expansion for the time being, but as the economies of
China, the USA and the European Union continue to
improve, it is anticipated that overseas demand for palm
oil products will rise in tandem with increased spending.
Penetrating new markets in other regions will increase
the exports of palm oil products and facilitate furtherexpansion of this industry in the future.
Pharmaceuticals
The basic pharmaceutical products sub-sector had a
tough year in 2013. However, growing domestic demand
for healthcare services and increased sales of generic
drugs in developed and emerging markets will allow this
sub-sector the opportunity to recover in 2014. Over the
last few years, the industry has also made substantial
investments to upgrade its processes to meet the latest
Good Manufacturing Practices (GMP) requirements,
which is important for penetrating the global market.
Chemicals & Chemical Products
The chemicals and chemical products sub-sector will
strengthen further in 2014 supported by its remarkable
growth in 2013 and continued strong external demand.
From the supply-side, the sub-sector should consider
strategic measures for reducing production costs such
as wages and prices. It is also crucial that the sub-
sector improve its adoption of information technology
to enhance operational efficiency. Expansions in
other industries such as automotive, construction,
infrastructure, E&E and personal care products will also
increase demand for chemical intermediate inputs and
have a positive impact on this sub-sector.
Basic Metals
The basic metals sub-sector had an unfavourable
2013 due to slow growth and a contraction in global
demand. Nonetheless, the sub-sector is expected to
recover in 2014 as a new iron ore transhipment hub
and palletisation plant in Perak begins operations. This
is expected to increase total output growth and value
added in this sub-sector. Although most of the iron ore
will be shipped to China, Japan and Korea, this ‘virtual
mine’ will allow Malaysian mills to purchase virgin iron
units at a discount compared to other countries in
the region. For the sub-sector to stay competitive, it is
crucial that it focuses on reducing production costs andimproving the skills of its workforce.
Transport Equipment
The transport equipment sub-sector experienced a
surge in value added growth and productivity in 2013.
However, the sub-sector also depends on expensive
material imports for its operations, particularly within
the aerospace industry. These imports may push up
production costs in the long term and undermine the
sub-sector’s ability to improve productivity.
82

8/10/2019 Malaysia Industry
http://slidepdf.com/reader/full/malaysia-industry 15/16
83

8/10/2019 Malaysia Industry
http://slidepdf.com/reader/full/malaysia-industry 16/16