malaysia industry focus malaysia gaming - dbs negative impact on genting malaysia’s domestic...
TRANSCRIPT
www.dbsvickers.com
ed-SGC / sa- WMT
No fun, no tricks, no hypes • Prospects Prospects Prospects Prospects to remain sluggishto remain sluggishto remain sluggishto remain sluggish,,,, dragged by weak dragged by weak dragged by weak dragged by weak
consumer sentiment and GST implementation consumer sentiment and GST implementation consumer sentiment and GST implementation consumer sentiment and GST implementation
• No significant developments on external frontNo significant developments on external frontNo significant developments on external frontNo significant developments on external front
• No visibleNo visibleNo visibleNo visible rererere----rating catalystsrating catalystsrating catalystsrating catalysts
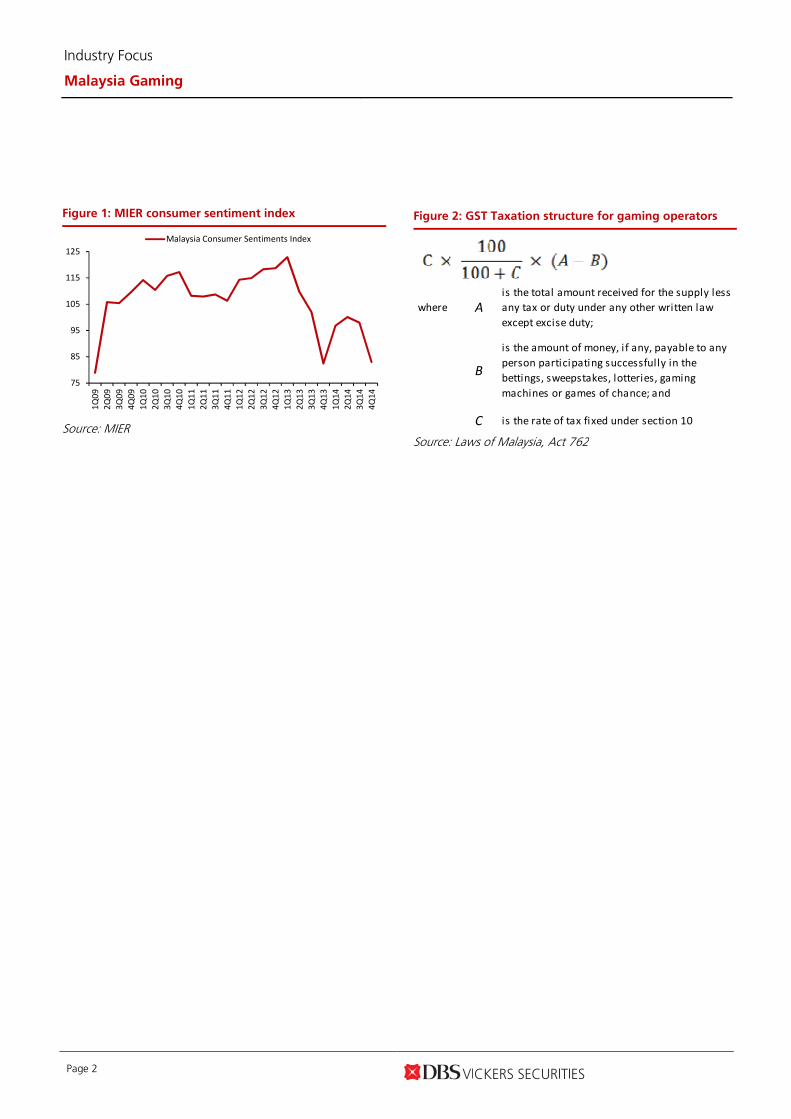
No excitement. We remain convinced there is little scope for Malaysian gaming stocks to re-rate in the near term. The Consumer Sentiment Index for 4Q2014 fell 15 points q-o-q to the year’s low of 83. The extended weak domestic consumer sentiment could further reduce discretionary spending, which could in turn, have a negative impact on Genting Malaysia’s domestic leisure & hospitality operations and NFO ticket sales.
External kickers still elusive. On the external front, there are no significant developments that could boost buying interest in domestic gaming players. Although, Genting Bhd might appeal to investors if Japan liberalises its gaming sector, as its subsidiary, Genting Singapore, is well positioned to bid for a casino licence there, there is still no committed timeline to pass the bill to legalise casinos in Japan.
GST will be a drag. We believe both Genting Group and number forecasting operators (NFOs) would have to fully absorb the GST without a corresponding reduction in gaming tax. Although the GST impact on gaming operators will not be as severe as previously feared, because the GST computation would take into account prize payouts (see Figure 2), it could still drag forward earnings of gaming players. Indeed, the imminent implementation of GST has started to dampen already-fragile consumer sentiment.
Adjusting earnings estimates, a boring game. We have revised forecast earnings and recommendations of gaming companies under our coverage, mainly to capture the impact of GST. These are reflected in the individual company reports. The sector will remain unexciting in the near term
KLCIKLCIKLCIKLCI ::::1,811.121,811.121,811.121,811.12
Analyst King Yoong CHEAH CFA +603 2604 3908 [email protected]
STOCKS
Genting BerhadGenting BerhadGenting BerhadGenting Berhad :::: Conglomerate with core businesses in leisure & hospitality and plantation as well as power and oil & gas.
Genting MalaysiaGenting MalaysiaGenting MalaysiaGenting Malaysia :::: Monopoly of Malaysian casino.
Magnum BhdMagnum BhdMagnum BhdMagnum Bhd :::: Market leader in NFO
Berjaya Sports TotoBerjaya Sports TotoBerjaya Sports TotoBerjaya Sports Toto :::: Principal activities include licensed toto betting, leasing of online lottery equipment and manufacture and distribution of computerised lottery equipment
Tables or Charts
Source: AllianceDBS
DBS Group Research . Equity DBS Group Research . Equity DBS Group Research . Equity DBS Group Research . Equity
11 Feb 2015
Malaysia Industry Focus
Malaysia Gaming
Refer to important disclosures at the end of this report
Price Price Price Price Mkt CapMkt CapMkt CapMkt Cap Target PriceTarget PriceTarget PriceTarget Price Performance (%)Performance (%)Performance (%)Performance (%)
RMRMRMRM US$mUS$mUS$mUS$m RMRMRMRM 3 mth3 mth3 mth3 mth 12 mth12 mth12 mth12 mth RatingRatingRatingRating
Genting Berhad 8.72 9,116 8.76 (6.2) (13.3) HOLD Genting Malaysia 4.08 6,505 4.10 (2.2) (4.0) HOLD Magnum Bhd 2.81 1,126 2.45 (6.6) (7.6) HOLD Berjaya Sports Toto 3.43 1,297 3.36 (3.4) (12.3) HOLD
Industry Focus
Malaysia Gaming
Page 2
Figure 2: GST Taxation structure for gaming operators
where A
is the total amount received for the supply less
any tax or duty under any other written law
except excise duty;
B
is the amount of money, i f any, payable to any
person participating successfully in the
bettings, sweepstakes, lotteries, gaming
machines or games of chance; and
C is the rate of tax fixed under section 10
Source: Laws of Malaysia, Act 762
Figure 1: MIER consumer sentiment index
75
85
95
105
115
125
1Q
09
2Q
09
3Q
09
4Q
09
1Q
10
2Q
10
3Q
10
4Q
10
1Q
11
2Q
11
3Q
11
4Q
11
1Q
12
2Q
12
3Q
12
4Q
12
1Q
13
2Q
13
3Q
13
4Q
13
1Q
14
2Q
14
3Q
14
4Q
14
Malaysia Consumer Sentiments Index
Source: MIER
www.dbsvickers.com
ed: SGC / sa: WMT
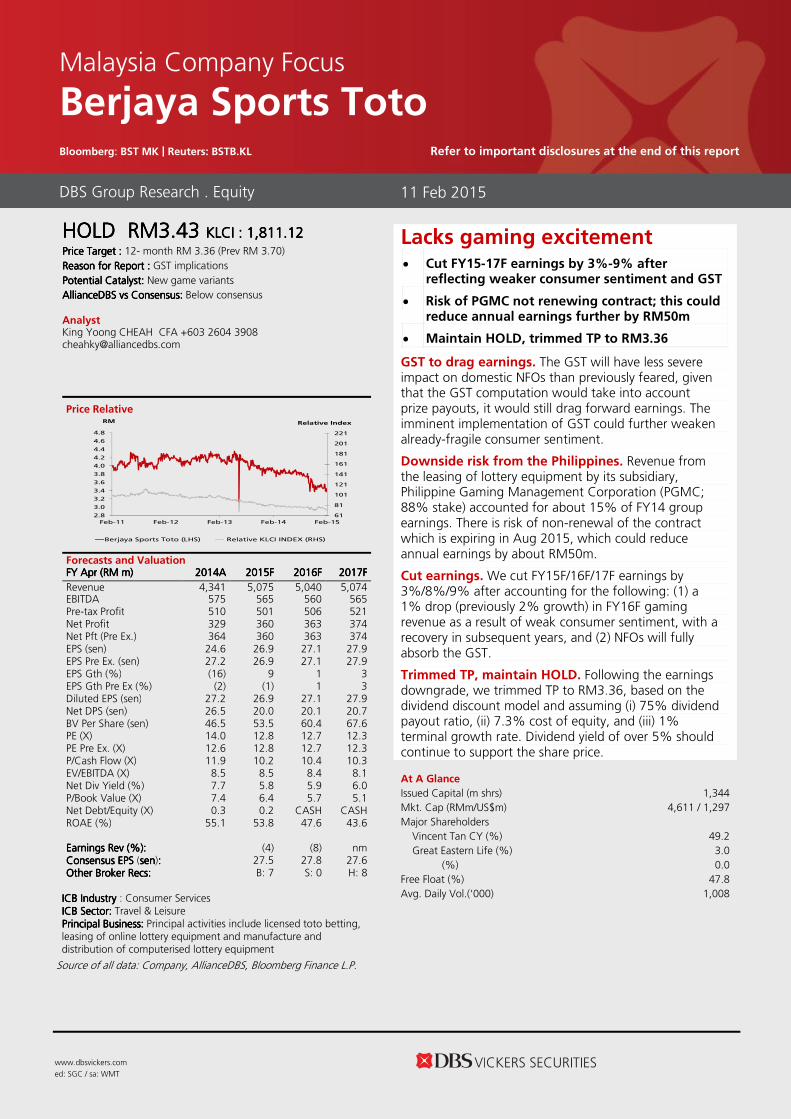
HOLD HOLD HOLD HOLD RMRMRMRM3.433.433.433.43 KLCIKLCIKLCIKLCI : : : : 1,811.121,811.121,811.121,811.12
PricePricePricePrice Target :Target :Target :Target : 12- month RM 3.36 (Prev RM 3.70)
Reason for Report :Reason for Report :Reason for Report :Reason for Report : GST implications
Potential Catalyst: Potential Catalyst: Potential Catalyst: Potential Catalyst: New game variants
AllianceDBSAllianceDBSAllianceDBSAllianceDBS vs vs vs vs Consensus:Consensus:Consensus:Consensus: Below consensus Analyst King Yoong CHEAH CFA +603 2604 3908 [email protected]
Price Relative
Forecasts and Valuation FY FY FY FY AprAprAprApr ((((RMRMRMRM m) m) m) m) 2014201420142014AAAA 2015201520152015FFFF 2016201620162016FFFF 2017201720172017FFFF
Revenue 4,341 5,075 5,040 5,074 EBITDA 575 565 560 565 Pre-tax Profit 510 501 506 521 Net Profit 329 360 363 374 Net Pft (Pre Ex.) 364 360 363 374 EPS (sen) 24.6 26.9 27.1 27.9 EPS Pre Ex. (sen) 27.2 26.9 27.1 27.9 EPS Gth (%) (16) 9 1 3 EPS Gth Pre Ex (%) (2) (1) 1 3 Diluted EPS (sen) 27.2 26.9 27.1 27.9 Net DPS (sen) 26.5 20.0 20.1 20.7 BV Per Share (sen) 46.5 53.5 60.4 67.6 PE (X) 14.0 12.8 12.7 12.3 PE Pre Ex. (X) 12.6 12.8 12.7 12.3 P/Cash Flow (X) 11.9 10.2 10.4 10.3 EV/EBITDA (X) 8.5 8.5 8.4 8.1 Net Div Yield (%) 7.7 5.8 5.9 6.0 P/Book Value (X) 7.4 6.4 5.7 5.1 Net Debt/Equity (X) 0.3 0.2 CASH CASH ROAE (%) 55.1 53.8 47.6 43.6 Earnings Rev (%):Earnings Rev (%):Earnings Rev (%):Earnings Rev (%): (4) (8) nm Consensus EPS Consensus EPS Consensus EPS Consensus EPS (sensensensen):::: 27.5 27.8 27.6 Other Broker Recs:Other Broker Recs:Other Broker Recs:Other Broker Recs: B: 7 S: 0 H: 8
ICB IndustryICB IndustryICB IndustryICB Industry : Consumer Services ICB Sector: ICB Sector: ICB Sector: ICB Sector: Travel & Leisure Principal Business:Principal Business:Principal Business:Principal Business: Principal activities include licensed toto betting, leasing of online lottery equipment and manufacture and distribution of computerised lottery equipment
Source of all data: Company, AllianceDBS, Bloomberg Finance L.P.
At A Glance Issued Capital (m shrs) 1,344 Mkt. Cap (RMm/US$m) 4,611 / 1,297 Major Shareholders Vincent Tan CY (%) 49.2 Great Eastern Life (%) 3.0 (%) 0.0 Free Float (%) 47.8 Avg. Daily Vol.(‘000) 1,008
DBS Group Research . Equity
11 Feb 2015
Malaysia Company Focus
Berjaya Sports Toto Bloomberg: BST MK | Reuters: BSTB.KL Refer to important disclosures at the end of this report
Lacks gaming excitement • Cut FY15-17F earnings by 3%-9% after
reflecting weaker consumer sentiment and GST
• Risk of PGMC not renewing contract; this could reduce annual earnings further by RM50m
• Maintain HOLD, trimmed TP to RM3.36
GST to drag earnings. The GST will have less severe impact on domestic NFOs than previously feared, given that the GST computation would take into account prize payouts, it would still drag forward earnings. The imminent implementation of GST could further weaken already-fragile consumer sentiment.
Downside risk from the Philippines. Revenue from the leasing of lottery equipment by its subsidiary, Philippine Gaming Management Corporation (PGMC; 88% stake) accounted for about 15% of FY14 group earnings. There is risk of non-renewal of the contract which is expiring in Aug 2015, which could reduce annual earnings by about RM50m.
Cut earnings. We cut FY15F/16F/17F earnings by 3%/8%/9% after accounting for the following: (1) a 1% drop (previously 2% growth) in FY16F gaming revenue as a result of weak consumer sentiment, with a recovery in subsequent years, and (2) NFOs will fully absorb the GST.
Trimmed TP, maintain HOLD. Following the earnings downgrade, we trimmed TP to RM3.36, based on the dividend discount model and assuming (i) 75% dividend payout ratio, (ii) 7.3% cost of equity, and (iii) 1% terminal growth rate. Dividend yield of over 5% should continue to support the share price.
61
81
101
121
141
161
181
201
221
2.8
3.0
3.2
3.4
3.6
3.8
4.0
4.2
4.4
4.6
4.8
Feb-11 Feb-12 Feb-13 Feb-14 Feb-15
Relative IndexRM
Berjaya Sports Toto (LHS) Relative KLCI INDEX (RHS)
Page 4
Company Focus
Berjaya Sports Toto
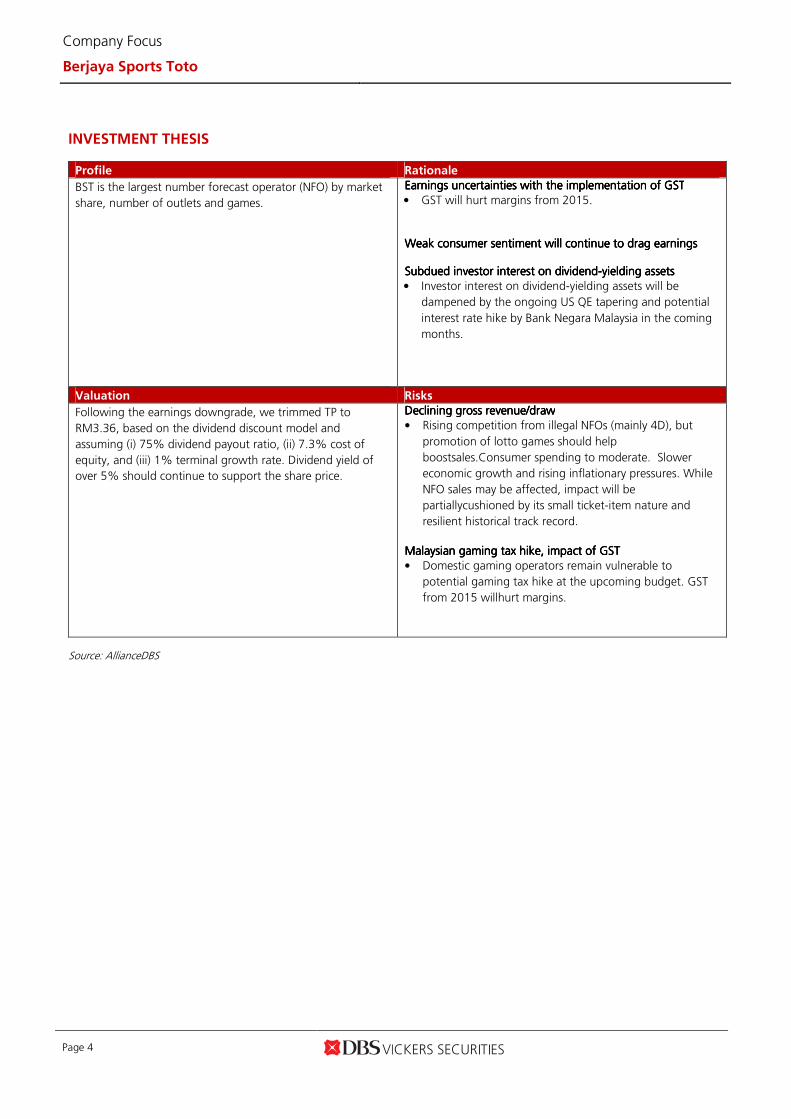
INVESTMENT THESIS
Profile Rationale
BST is the largest number forecast operator (NFO) by market
share, number of outlets and games.
Earnings uncertainties with the implementation of GSTEarnings uncertainties with the implementation of GSTEarnings uncertainties with the implementation of GSTEarnings uncertainties with the implementation of GST
• GST will hurt margins from 2015.
Weak consumer sentiment will continue to Weak consumer sentiment will continue to Weak consumer sentiment will continue to Weak consumer sentiment will continue to drag earningsdrag earningsdrag earningsdrag earnings Subdued investorSubdued investorSubdued investorSubdued investor interest on dividendinterest on dividendinterest on dividendinterest on dividend----yielding assetsyielding assetsyielding assetsyielding assets
• Investor interest on dividend-yielding assets will be
dampened by the ongoing US QE tapering and potential
interest rate hike by Bank Negara Malaysia in the coming
months.
Valuation Risks
Following the earnings downgrade, we trimmed TP to
RM3.36, based on the dividend discount model and
assuming (i) 75% dividend payout ratio, (ii) 7.3% cost of
equity, and (iii) 1% terminal growth rate. Dividend yield of
over 5% should continue to support the share price.
Declining gross revenue/drawDeclining gross revenue/drawDeclining gross revenue/drawDeclining gross revenue/draw
• Rising competition from illegal NFOs (mainly 4D), but
promotion of lotto games should help
boostsales.Consumer spending to moderate. Slower
economic growth and rising inflationary pressures. While
NFO sales may be affected, impact will be
partiallycushioned by its small ticket-item nature and
resilient historical track record.
Malaysian gaming tax hike, impact of GSTMalaysian gaming tax hike, impact of GSTMalaysian gaming tax hike, impact of GSTMalaysian gaming tax hike, impact of GST
• Domestic gaming operators remain vulnerable to
potential gaming tax hike at the upcoming budget. GST
from 2015 willhurt margins.
Source: AllianceDBS
Page 5
Company Focus
Berjaya Sports Toto
Income Statement (RM m)
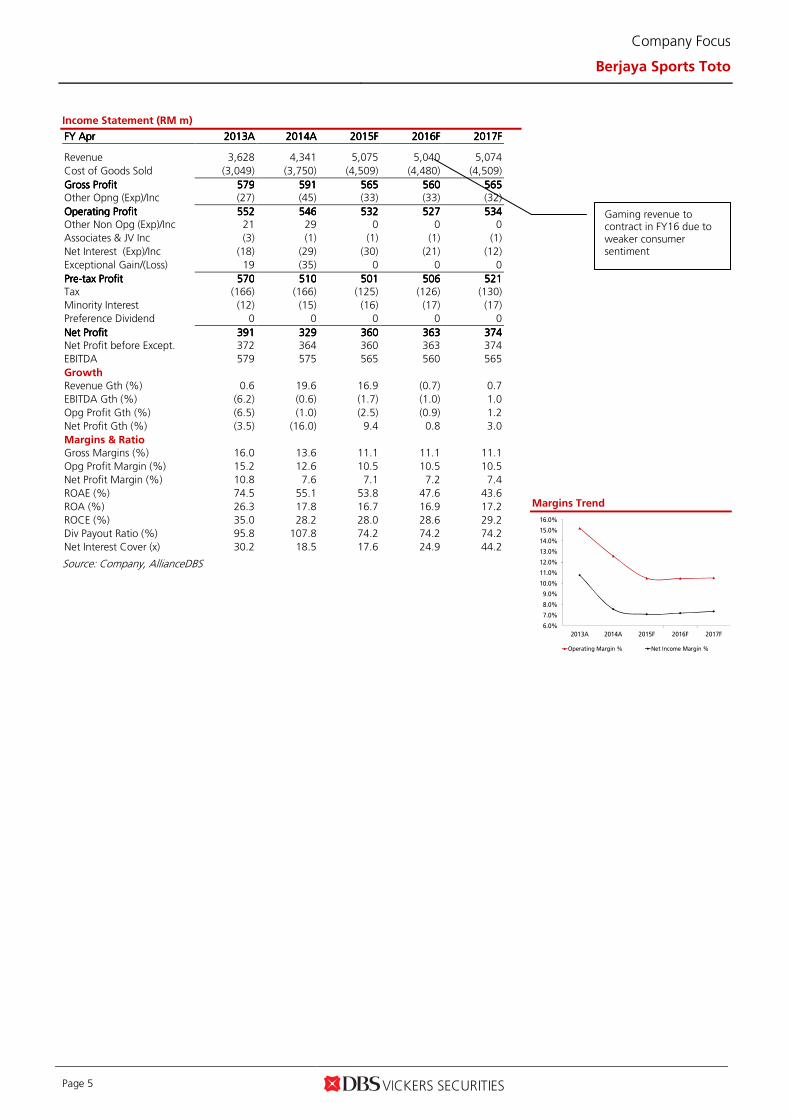
FY FY FY FY AprAprAprApr 2013201320132013AAAA 2014201420142014AAAA 2015201520152015FFFF 2016201620162016FFFF 2017201720172017FFFF
Revenue 3,628 4,341 5,075 5,040 5,074
Cost of Goods Sold (3,049) (3,750) (4,509) (4,480) (4,509)
Gross ProfitGross ProfitGross ProfitGross Profit 579579579579 591591591591 565565565565 560560560560 565565565565 Other Opng (Exp)/Inc (27) (45) (33) (33) (32)
Operating ProfitOperating ProfitOperating ProfitOperating Profit 552552552552 546546546546 532532532532 527527527527 534534534534 Other Non Opg (Exp)/Inc 21 29 0 0 0
Associates & JV Inc (3) (1) (1) (1) (1)
Net Interest (Exp)/Inc (18) (29) (30) (21) (12)
Exceptional Gain/(Loss) 19 (35) 0 0 0
PrePrePrePre----tax Profittax Profittax Profittax Profit 570570570570 510510510510 501501501501 506506506506 521521521521 Tax (166) (166) (125) (126) (130)
Minority Interest (12) (15) (16) (17) (17)
Preference Dividend 0 0 0 0 0
Net ProfitNet ProfitNet ProfitNet Profit 391391391391 329329329329 360360360360 363363363363 374374374374 Net Profit before Except. 372 364 360 363 374
EBITDA 579 575 565 560 565
Growth
Revenue Gth (%) 0.6 19.6 16.9 (0.7) 0.7
EBITDA Gth (%) (6.2) (0.6) (1.7) (1.0) 1.0
Opg Profit Gth (%) (6.5) (1.0) (2.5) (0.9) 1.2
Net Profit Gth (%) (3.5) (16.0) 9.4 0.8 3.0
Margins & Ratio
Gross Margins (%) 16.0 13.6 11.1 11.1 11.1
Opg Profit Margin (%) 15.2 12.6 10.5 10.5 10.5
Net Profit Margin (%) 10.8 7.6 7.1 7.2 7.4
ROAE (%) 74.5 55.1 53.8 47.6 43.6
ROA (%) 26.3 17.8 16.7 16.9 17.2
ROCE (%) 35.0 28.2 28.0 28.6 29.2
Div Payout Ratio (%) 95.8 107.8 74.2 74.2 74.2
Net Interest Cover (x) 30.2 18.5 17.6 24.9 44.2
Source: Company, AllianceDBS
Margins Trend
6.0%
7.0%
8.0%
9.0%
10.0%
11.0%
12.0%
13.0%
14.0%
15.0%
16.0%
2013A 2014A 2015F 2016F 2017F
Operating Margin % Net Income Margin %
Gaming revenue to contract in FY16 due to weaker consumer sentiment
Page 6
Company Focus
Berjaya Sports Toto
Quarterly / Interim Income Statement (RM m)
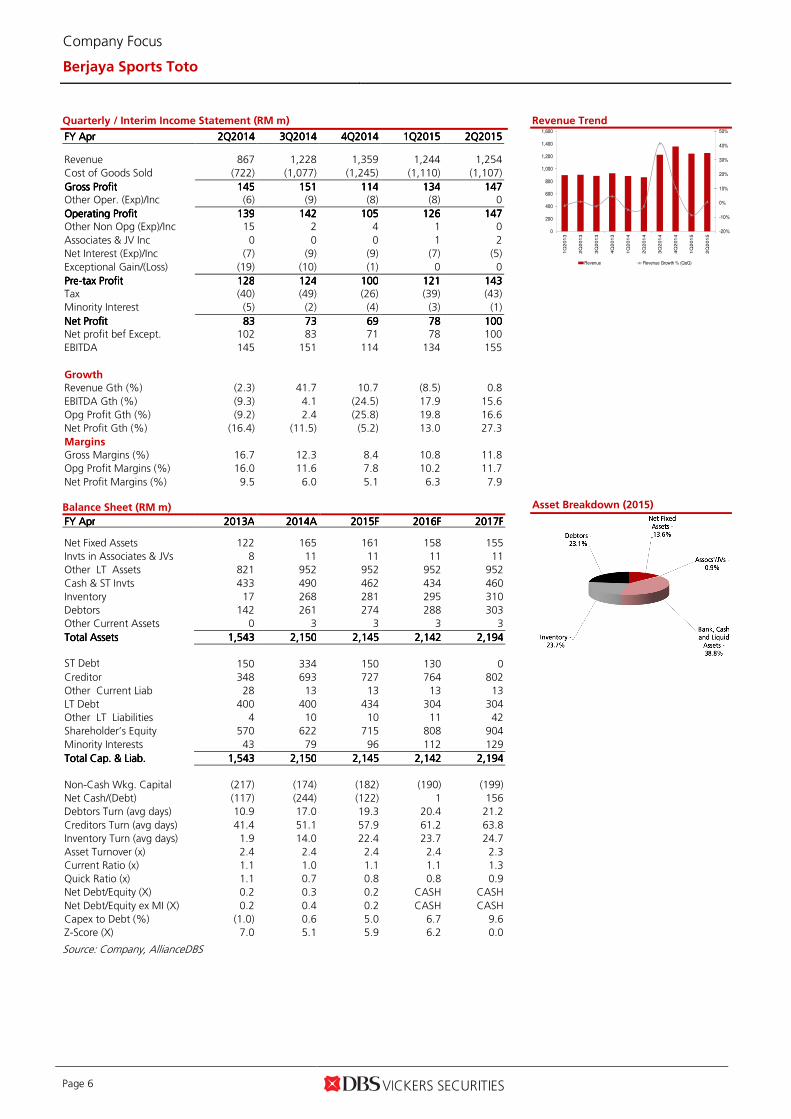
FY FY FY FY AprAprAprApr 2Q2Q2Q2Q2014201420142014 3Q3Q3Q3Q2014201420142014 4Q4Q4Q4Q2014201420142014 1Q1Q1Q1Q2015201520152015 2Q2Q2Q2Q2015201520152015
Revenue 867 1,228 1,359 1,244 1,254
Cost of Goods Sold (722) (1,077) (1,245) (1,110) (1,107)
Gross ProfitGross ProfitGross ProfitGross Profit 145145145145 151151151151 114114114114 134134134134 147147147147 Other Oper. (Exp)/Inc (6) (9) (8) (8) 0
Operating ProfitOperating ProfitOperating ProfitOperating Profit 139139139139 142142142142 105105105105 126126126126 147147147147 Other Non Opg (Exp)/Inc 15 2 4 1 0
Associates & JV Inc 0 0 0 1 2
Net Interest (Exp)/Inc (7) (9) (9) (7) (5)
Exceptional Gain/(Loss) (19) (10) (1) 0 0
PrePrePrePre----tax Profittax Profittax Profittax Profit 128128128128 124124124124 100100100100 121121121121 143143143143 Tax (40) (49) (26) (39) (43)
Minority Interest (5) (2) (4) (3) (1)
Net ProfitNet ProfitNet ProfitNet Profit 83838383 73737373 69696969 78787878 100100100100 Net profit bef Except. 102 83 71 78 100
EBITDA 145 151 114 134 155
Growth
Revenue Gth (%) (2.3) 41.7 10.7 (8.5) 0.8
EBITDA Gth (%) (9.3) 4.1 (24.5) 17.9 15.6
Opg Profit Gth (%) (9.2) 2.4 (25.8) 19.8 16.6
Net Profit Gth (%) (16.4) (11.5) (5.2) 13.0 27.3
Margins
Gross Margins (%) 16.7 12.3 8.4 10.8 11.8
Opg Profit Margins (%) 16.0 11.6 7.8 10.2 11.7
Net Profit Margins (%) 9.5 6.0 5.1 6.3 7.9 Balance Sheet (RM m)
FY FY FY FY AprAprAprApr 2013201320132013AAAA 2014201420142014AAAA 2015201520152015FFFF 2016201620162016FFFF 2017201720172017FFFF Net Fixed Assets 122 165 161 158 155
Invts in Associates & JVs 8 11 11 11 11
Other LT Assets 821 952 952 952 952
Cash & ST Invts 433 490 462 434 460
Inventory 17 268 281 295 310
Debtors 142 261 274 288 303
Other Current Assets 0 3 3 3 3
Total AssetsTotal AssetsTotal AssetsTotal Assets 1,5431,5431,5431,543 2,1502,1502,1502,150 2,1452,1452,1452,145 2,1422,1422,1422,142 2,1942,1942,1942,194
ST Debt
150 334 150 130 0
Creditor 348 693 727 764 802
Other Current Liab 28 13 13 13 13
LT Debt 400 400 434 304 304
Other LT Liabilities 4 10 10 11 42
Shareholder’s Equity 570 622 715 808 904
Minority Interests 43 79 96 112 129
Total Cap. & Liab.Total Cap. & Liab.Total Cap. & Liab.Total Cap. & Liab. 1,5431,5431,5431,543 2,1502,1502,1502,150 2,1452,1452,1452,145 2,1422,1422,1422,142 2,1942,1942,1942,194
Non-Cash Wkg. Capital (217) (174) (182) (190) (199)
Net Cash/(Debt) (117) (244) (122) 1 156
Debtors Turn (avg days) 10.9 17.0 19.3 20.4 21.2
Creditors Turn (avg days) 41.4 51.1 57.9 61.2 63.8
Inventory Turn (avg days) 1.9 14.0 22.4 23.7 24.7
Asset Turnover (x) 2.4 2.4 2.4 2.4 2.3
Current Ratio (x) 1.1 1.0 1.1 1.1 1.3
Quick Ratio (x) 1.1 0.7 0.8 0.8 0.9
Net Debt/Equity (X) 0.2 0.3 0.2 CASH CASH
Net Debt/Equity ex MI (X) 0.2 0.4 0.2 CASH CASH
Capex to Debt (%) (1.0) 0.6 5.0 6.7 9.6
Z-Score (X) 7.0 5.1 5.9 6.2 0.0
Source: Company, AllianceDBS
Revenue Trend
Asset Breakdown (2015)
-20%
-10%
0%
10%
20%
30%
40%
50%
0
200
400
600
800
1,000
1,200
1,400
1,600
1Q
201
3
2Q
201
3
3Q
201
3
4Q
201
3
1Q
201
4
2Q
201
4
3Q
201
4
4Q
201
4
1Q
201
5
2Q
201
5
Revenue Revenue Growth % (QoQ)
Page 7
Company Focus
Berjaya Sports Toto
Cash Flow Statement (RM m)
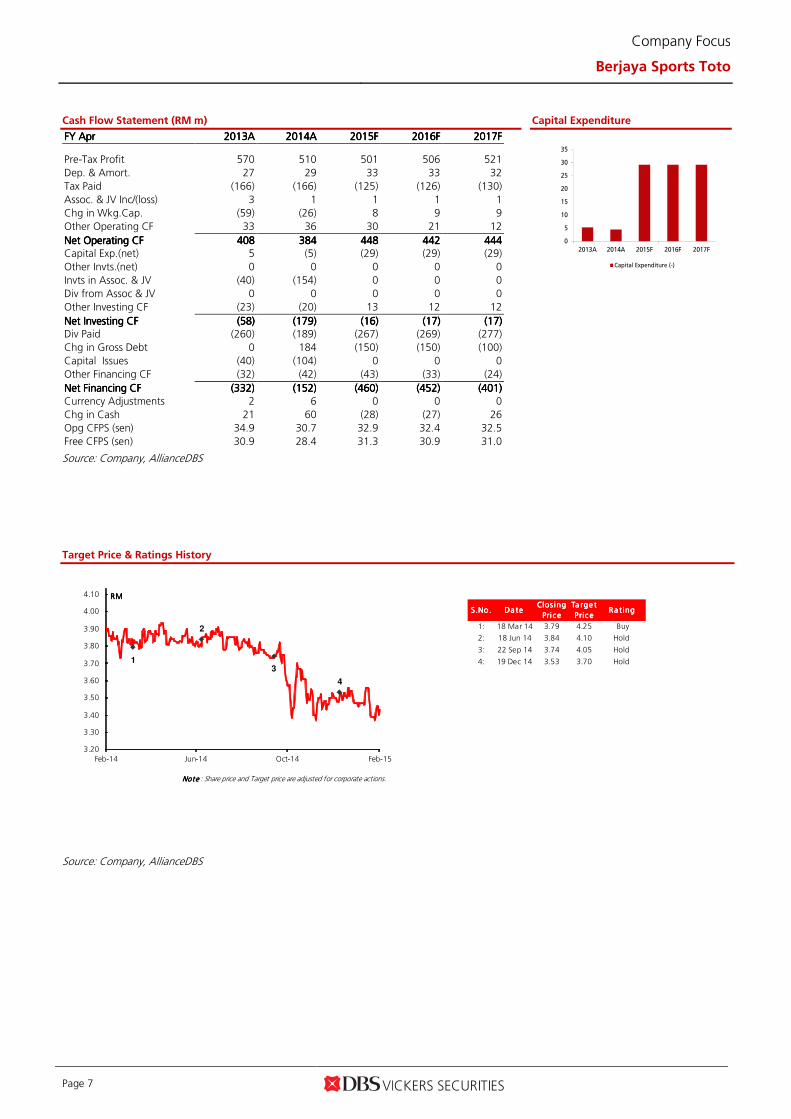
FY FY FY FY AprAprAprApr 2013201320132013AAAA 2014201420142014AAAA 2015201520152015FFFF 2016201620162016FFFF 2017201720172017FFFF
Pre-Tax Profit 570 510 501 506 521
Dep. & Amort. 27 29 33 33 32
Tax Paid (166) (166) (125) (126) (130)
Assoc. & JV Inc/(loss) 3 1 1 1 1
Chg in Wkg.Cap. (59) (26) 8 9 9
Other Operating CF 33 36 30 21 12
Net Operating CFNet Operating CFNet Operating CFNet Operating CF 408408408408 384384384384 448448448448 442442442442 444444444444 Capital Exp.(net) 5 (5) (29) (29) (29)
Other Invts.(net) 0 0 0 0 0
Invts in Assoc. & JV (40) (154) 0 0 0
Div from Assoc & JV 0 0 0 0 0
Other Investing CF (23) (20) 13 12 12
Net Investing CFNet Investing CFNet Investing CFNet Investing CF (58)(58)(58)(58) (179)(179)(179)(179) (16)(16)(16)(16) (17)(17)(17)(17) (17)(17)(17)(17) Div Paid (260) (189) (267) (269) (277)
Chg in Gross Debt 0 184 (150) (150) (100)
Capital Issues (40) (104) 0 0 0
Other Financing CF (32) (42) (43) (33) (24)
Net Financing CFNet Financing CFNet Financing CFNet Financing CF (332)(332)(332)(332) (152)(152)(152)(152) (460)(460)(460)(460) (452)(452)(452)(452) (401)(401)(401)(401)
Currency Adjustments 2 6 0 0 0
Chg in Cash 21 60 (28) (27) 26
Opg CFPS (sen) 34.9 30.7 32.9 32.4 32.5
Free CFPS (sen) 30.9 28.4 31.3 30.9 31.0
Source: Company, AllianceDBS
Capital Expenditure
Target Price & Ratings History
Source: Company, AllianceDBS
0
5
10
15
20
25
30
35
2013A 2014A 2015F 2016F 2017F
Capital Expenditure (-)
S.No .S.No .S.No .S.No . Da teDa teDa teDa teClos ing Clos ing Clos ing Clos ing
Pri c ePri c ePri c ePri c e
Ta rg e t Ta rg e t Ta rg e t Ta rg e t
Pric ePric ePric ePric eR a ting R a ting R a ting R a ting
1: 18 Mar 14 3.79 4.25 Buy
2: 18 Jun 14 3.84 4.10 Hold
3: 22 Sep 14 3.74 4.05 Hold
4: 19 Dec 14 3.53 3.70 Hold
Not e Not e Not e Not e : Share price and Target price are adjusted for corporate actions.
1
2
3
4
3.20
3.30
3.40
3.50
3.60
3.70
3.80
3.90
4.00
4.10
Feb-14 Jun-14 Oct-14 Feb-15
RMRMRMRM
www.dbsvickers.com
ed: SGC / sa: WMT
HOLD HOLD HOLD HOLD RMRMRMRM8.728.728.728.72 KLCIKLCIKLCIKLCI : : : : 1,811.121,811.121,811.121,811.12 PricePricePricePrice Target :Target :Target :Target : 12-Month RM 8.76 (Prev RM 8.90)
Reason for Report :Reason for Report :Reason for Report :Reason for Report : GST implications
Potential Catalyst: Potential Catalyst: Potential Catalyst: Potential Catalyst: Gaming liberalisation in Japan
AllianceDBSAllianceDBSAllianceDBSAllianceDBS vs vs vs vs Consensus:Consensus:Consensus:Consensus: In line with consensus Analyst King Yoong CHEAH CFA +603 2604 3908 [email protected]
Price Relative
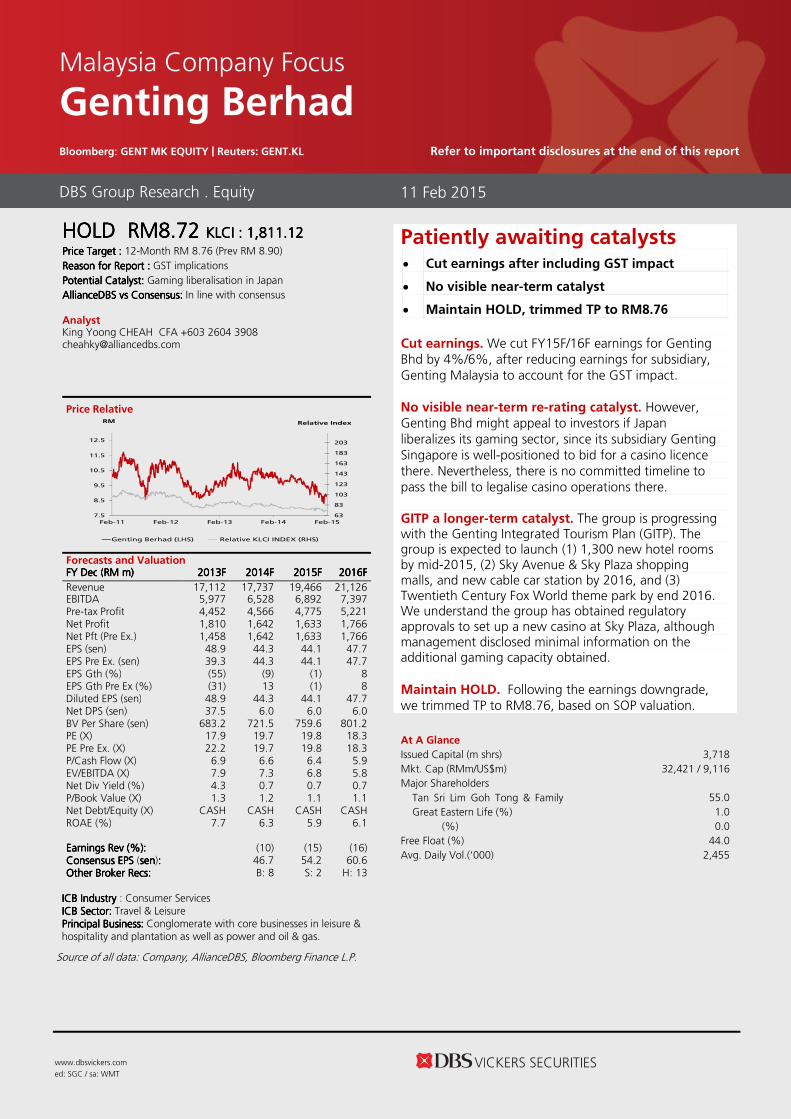
Forecasts and Valuation FY FY FY FY DecDecDecDec ((((RMRMRMRM m) m) m) m) 2013201320132013FFFF 2014201420142014FFFF 2015201520152015FFFF 2016201620162016FFFF
Revenue 17,112 17,737 19,466 21,126 EBITDA 5,977 6,528 6,892 7,397 Pre-tax Profit 4,452 4,566 4,775 5,221 Net Profit 1,810 1,642 1,633 1,766 Net Pft (Pre Ex.) 1,458 1,642 1,633 1,766 EPS (sen) 48.9 44.3 44.1 47.7 EPS Pre Ex. (sen) 39.3 44.3 44.1 47.7 EPS Gth (%) (55) (9) (1) 8 EPS Gth Pre Ex (%) (31) 13 (1) 8 Diluted EPS (sen) 48.9 44.3 44.1 47.7 Net DPS (sen) 37.5 6.0 6.0 6.0 BV Per Share (sen) 683.2 721.5 759.6 801.2 PE (X) 17.9 19.7 19.8 18.3 PE Pre Ex. (X) 22.2 19.7 19.8 18.3 P/Cash Flow (X) 6.9 6.6 6.4 5.9 EV/EBITDA (X) 7.9 7.3 6.8 5.8 Net Div Yield (%) 4.3 0.7 0.7 0.7 P/Book Value (X) 1.3 1.2 1.1 1.1 Net Debt/Equity (X) CASH CASH CASH CASH ROAE (%) 7.7 6.3 5.9 6.1 Earnings Rev (%):Earnings Rev (%):Earnings Rev (%):Earnings Rev (%): (10) (15) (16) Consensus EPS Consensus EPS Consensus EPS Consensus EPS (sensensensen):::: 46.7 54.2 60.6 Other Broker Recs:Other Broker Recs:Other Broker Recs:Other Broker Recs: B: 8 S: 2 H: 13 ICB IndustryICB IndustryICB IndustryICB Industry : Consumer Services ICB Sector: ICB Sector: ICB Sector: ICB Sector: Travel & Leisure Principal Business:Principal Business:Principal Business:Principal Business: Conglomerate with core businesses in leisure & hospitality and plantation as well as power and oil & gas.
Source of all data: Company, AllianceDBS, Bloomberg Finance L.P.
At A Glance Issued Capital (m shrs) 3,718 Mkt. Cap (RMm/US$m) 32,421 / 9,116 Major Shareholders Tan Sri Lim Goh Tong & Family (%)
55.0 Great Eastern Life (%) 1.0 (%) 0.0 Free Float (%) 44.0 Avg. Daily Vol.(‘000) 2,455
DBS Group Research . Equity
11 Feb 2015
Malaysia Company Focus
Genting Berhad Bloomberg: GENT MK EQUITY | Reuters: GENT.KL Refer to important disclosures at the end of this report
Patiently awaiting catalysts • Cut earnings after including GST impact
• No visible near-term catalyst
• Maintain HOLD, trimmed TP to RM8.76
Cut earnings. We cut FY15F/16F earnings for Genting Bhd by 4%/6%, after reducing earnings for subsidiary, Genting Malaysia to account for the GST impact. No visible near-term re-rating catalyst. However, Genting Bhd might appeal to investors if Japan liberalizes its gaming sector, since its subsidiary Genting Singapore is well-positioned to bid for a casino licence there. Nevertheless, there is no committed timeline to pass the bill to legalise casino operations there. GITP a longer-term catalyst. The group is progressing with the Genting Integrated Tourism Plan (GITP). The group is expected to launch (1) 1,300 new hotel rooms by mid-2015, (2) Sky Avenue & Sky Plaza shopping malls, and new cable car station by 2016, and (3) Twentieth Century Fox World theme park by end 2016. We understand the group has obtained regulatory approvals to set up a new casino at Sky Plaza, although management disclosed minimal information on the additional gaming capacity obtained. Maintain HOLD. Following the earnings downgrade, we trimmed TP to RM8.76, based on SOP valuation.
63
83
103
123
143
163
183
203
7.5
8.5
9.5
10.5
11.5
12.5
Feb-11 Feb-12 Feb-13 Feb-14 Feb-15
Relative IndexRM
Genting Berhad (LHS) Relative KLCI INDEX (RHS)
Page 9
Company Focus
Genting Berhad
INVESTMENT THESIS
Profile Rationale
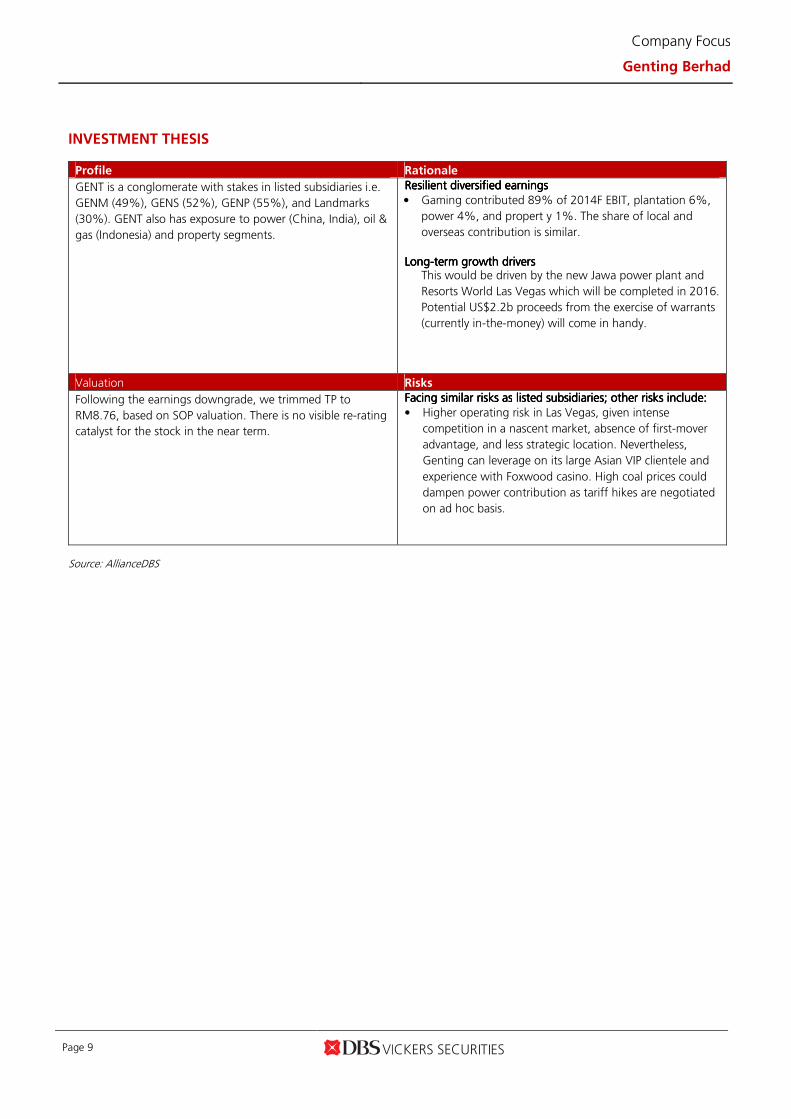
GENT is a conglomerate with stakes in listed subsidiaries i.e.
GENM (49%), GENS (52%), GENP (55%), and Landmarks
(30%). GENT also has exposure to power (China, India), oil &
gas (Indonesia) and property segments.
Resilient diversified earnings Resilient diversified earnings Resilient diversified earnings Resilient diversified earnings
• Gaming contributed 89% of 2014F EBIT, plantation 6%,
power 4%, and propert y 1%. The share of local and
overseas contribution is similar.
LongLongLongLong----term growth term growth term growth term growth driversdriversdriversdrivers This would be driven by the new Jawa power plant and
Resorts World Las Vegas which will be completed in 2016.
Potential US$2.2b proceeds from the exercise of warrants
(currently in-the-money) will come in handy.
Valuation Risks
Following the earnings downgrade, we trimmed TP to
RM8.76, based on SOP valuation. There is no visible re-rating
catalyst for the stock in the near term.
FacingFacingFacingFacing similar risks assimilar risks assimilar risks assimilar risks as listed subsidiarieslisted subsidiarieslisted subsidiarieslisted subsidiaries;;;; other risks include:other risks include:other risks include:other risks include:
• Higher operating risk in Las Vegas, given intense
competition in a nascent market, absence of first-mover
advantage, and less strategic location. Nevertheless,
Genting can leverage on its large Asian VIP clientele and
experience with Foxwood casino. High coal prices could
dampen power contribution as tariff hikes are negotiated
on ad hoc basis.
Source: AllianceDBS
Page 10
Company Focus
Genting Berhad
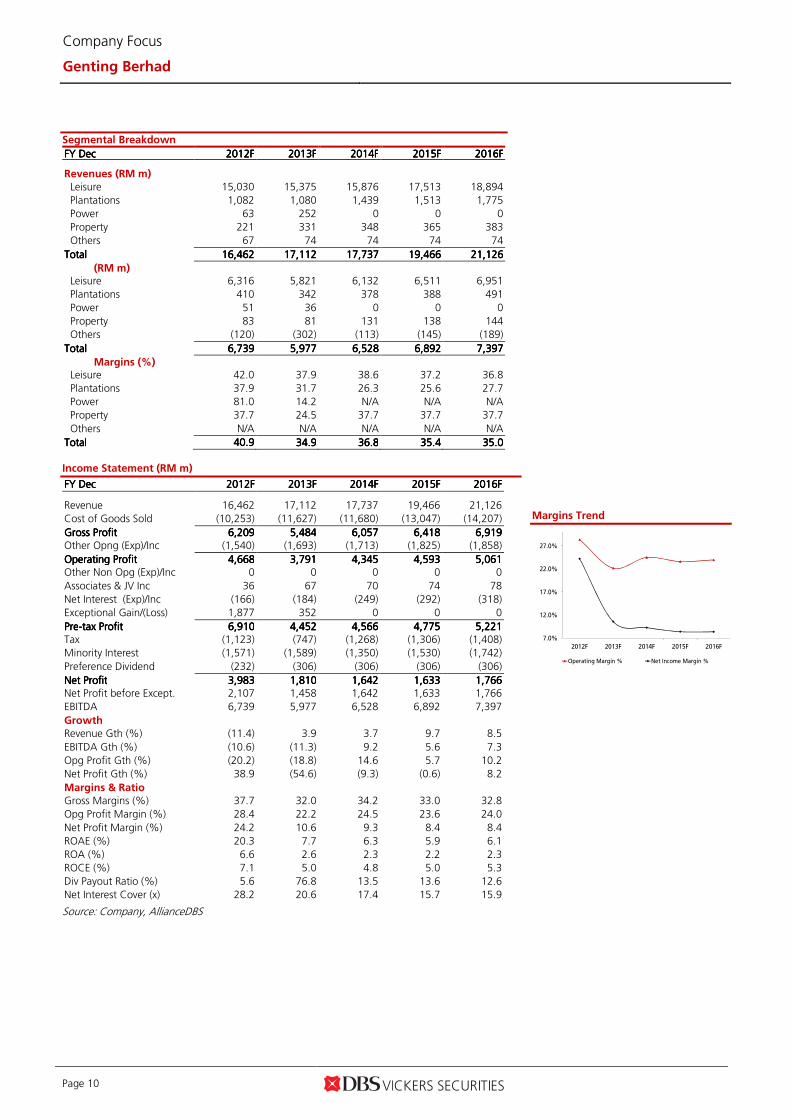
Segmental Breakdown
FY FY FY FY DecDecDecDec 2012201220122012FFFF 2013201320132013FFFF 2014201420142014FFFF 2015201520152015FFFF 2016201620162016FFFF Revenues (RM m)
Leisure 15,030 15,375 15,876 17,513 18,894
Plantations 1,082 1,080 1,439 1,513 1,775
Power 63 252 0 0 0
Property 221 331 348 365 383
Others 67 74 74 74 74
TotalTotalTotalTotal 16,46216,46216,46216,462 17,11217,11217,11217,112 17,73717,73717,73717,737 19,46619,46619,46619,466 21,12621,12621,12621,126
(RM m) Leisure 6,316 5,821 6,132 6,511 6,951
Plantations 410 342 378 388 491
Power 51 36 0 0 0
Property 83 81 131 138 144
Others (120) (302) (113) (145) (189)
TotalTotalTotalTotal 6,7396,7396,7396,739 5,9775,9775,9775,977 6,5286,5286,5286,528 6,8926,8926,8926,892 7,3977,3977,3977,397
Margins (%) Leisure 42.0 37.9 38.6 37.2 36.8
Plantations 37.9 31.7 26.3 25.6 27.7
Power 81.0 14.2 N/A N/A N/A
Property 37.7 24.5 37.7 37.7 37.7
Others N/A N/A N/A N/A N/A
TotalTotalTotalTotal 40.940.940.940.9 34.934.934.934.9 36.836.836.836.8 35.435.435.435.4 35.035.035.035.0
Income Statement (RM m)
FY FY FY FY DecDecDecDec 2012201220122012FFFF 2013201320132013FFFF 2014201420142014FFFF 2015201520152015FFFF 2016201620162016FFFF
Revenue 16,462 17,112 17,737 19,466 21,126
Cost of Goods Sold (10,253) (11,627) (11,680) (13,047) (14,207)
Gross ProfitGross ProfitGross ProfitGross Profit 6,2096,2096,2096,209 5,4845,4845,4845,484 6,0576,0576,0576,057 6,4186,4186,4186,418 6,9196,9196,9196,919 Other Opng (Exp)/Inc (1,540) (1,693) (1,713) (1,825) (1,858)
Operating ProfitOperating ProfitOperating ProfitOperating Profit 4,6684,6684,6684,668 3,7913,7913,7913,791 4,3454,3454,3454,345 4,5934,5934,5934,593 5,0615,0615,0615,061 Other Non Opg (Exp)/Inc 0 0 0 0 0
Associates & JV Inc 36 67 70 74 78
Net Interest (Exp)/Inc (166) (184) (249) (292) (318)
Exceptional Gain/(Loss) 1,877 352 0 0 0
PrePrePrePre----tax Profittax Profittax Profittax Profit 6,9106,9106,9106,910 4,4524,4524,4524,452 4,5664,5664,5664,566 4,7754,7754,7754,775 5,2215,2215,2215,221 Tax (1,123) (747) (1,268) (1,306) (1,408)
Minority Interest (1,571) (1,589) (1,350) (1,530) (1,742)
Preference Dividend (232) (306) (306) (306) (306)
Net ProfitNet ProfitNet ProfitNet Profit 3,9833,9833,9833,983 1,8101,8101,8101,810 1,6421,6421,6421,642 1,6331,6331,6331,633 1,7661,7661,7661,766 Net Profit before Except. 2,107 1,458 1,642 1,633 1,766
EBITDA 6,739 5,977 6,528 6,892 7,397
Growth
Revenue Gth (%) (11.4) 3.9 3.7 9.7 8.5
EBITDA Gth (%) (10.6) (11.3) 9.2 5.6 7.3
Opg Profit Gth (%) (20.2) (18.8) 14.6 5.7 10.2
Net Profit Gth (%) 38.9 (54.6) (9.3) (0.6) 8.2
Margins & Ratio
Gross Margins (%) 37.7 32.0 34.2 33.0 32.8
Opg Profit Margin (%) 28.4 22.2 24.5 23.6 24.0
Net Profit Margin (%) 24.2 10.6 9.3 8.4 8.4
ROAE (%) 20.3 7.7 6.3 5.9 6.1
ROA (%) 6.6 2.6 2.3 2.2 2.3
ROCE (%) 7.1 5.0 4.8 5.0 5.3
Div Payout Ratio (%) 5.6 76.8 13.5 13.6 12.6
Net Interest Cover (x) 28.2 20.6 17.4 15.7 15.9
Source: Company, AllianceDBS
Margins Trend
7.0%
12.0%
17.0%
22.0%
27.0%
2012F 2013F 2014F 2015F 2016F
Operating Margin % Net Income Margin %
Page 11
Company Focus
Genting Berhad
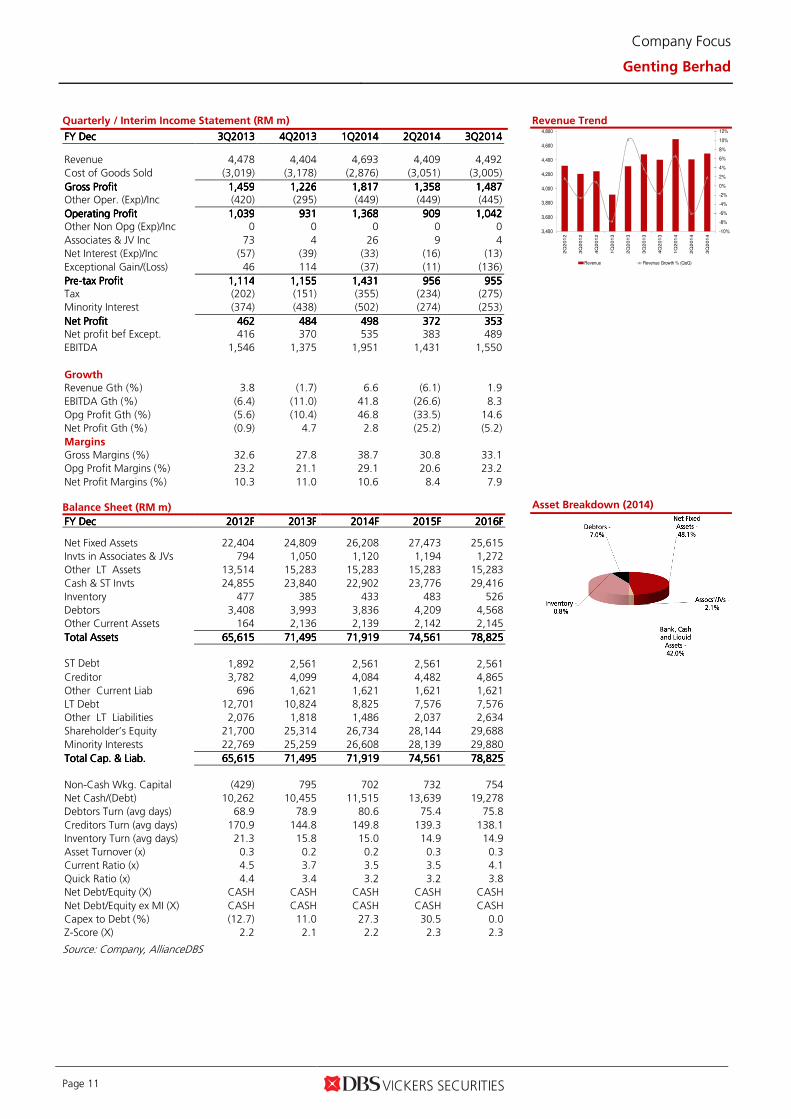
Quarterly / Interim Income Statement (RM m)
FY FY FY FY DecDecDecDec 3Q3Q3Q3Q2013201320132013 4Q4Q4Q4Q2013201320132013 1Q1Q1Q1Q2014201420142014 2Q2Q2Q2Q2014201420142014 3Q3Q3Q3Q2014201420142014
Revenue 4,478 4,404 4,693 4,409 4,492
Cost of Goods Sold (3,019) (3,178) (2,876) (3,051) (3,005)
Gross ProfitGross ProfitGross ProfitGross Profit 1,4591,4591,4591,459 1,2261,2261,2261,226 1,8171,8171,8171,817 1,3581,3581,3581,358 1,4871,4871,4871,487 Other Oper. (Exp)/Inc (420) (295) (449) (449) (445)
Operating ProfitOperating ProfitOperating ProfitOperating Profit 1,0391,0391,0391,039 931931931931 1,3681,3681,3681,368 909909909909 1,0421,0421,0421,042 Other Non Opg (Exp)/Inc 0 0 0 0 0
Associates & JV Inc 73 4 26 9 4
Net Interest (Exp)/Inc (57) (39) (33) (16) (13)
Exceptional Gain/(Loss) 46 114 (37) (11) (136)
PrePrePrePre----tax Profittax Profittax Profittax Profit 1,1141,1141,1141,114 1,1551,1551,1551,155 1,4311,4311,4311,431 956956956956 955955955955 Tax (202) (151) (355) (234) (275)
Minority Interest (374) (438) (502) (274) (253)
Net ProfitNet ProfitNet ProfitNet Profit 462462462462 484484484484 498498498498 372372372372 353353353353 Net profit bef Except. 416 370 535 383 489
EBITDA 1,546 1,375 1,951 1,431 1,550
Growth
Revenue Gth (%) 3.8 (1.7) 6.6 (6.1) 1.9
EBITDA Gth (%) (6.4) (11.0) 41.8 (26.6) 8.3
Opg Profit Gth (%) (5.6) (10.4) 46.8 (33.5) 14.6
Net Profit Gth (%) (0.9) 4.7 2.8 (25.2) (5.2)
Margins
Gross Margins (%) 32.6 27.8 38.7 30.8 33.1
Opg Profit Margins (%) 23.2 21.1 29.1 20.6 23.2
Net Profit Margins (%) 10.3 11.0 10.6 8.4 7.9 Balance Sheet (RM m)
FY FY FY FY DecDecDecDec 2012201220122012FFFF 2013201320132013FFFF 2014201420142014FFFF 2015201520152015FFFF 2016201620162016FFFF Net Fixed Assets 22,404 24,809 26,208 27,473 25,615
Invts in Associates & JVs 794 1,050 1,120 1,194 1,272
Other LT Assets 13,514 15,283 15,283 15,283 15,283
Cash & ST Invts 24,855 23,840 22,902 23,776 29,416
Inventory 477 385 433 483 526
Debtors 3,408 3,993 3,836 4,209 4,568
Other Current Assets 164 2,136 2,139 2,142 2,145
Total AssetsTotal AssetsTotal AssetsTotal Assets 65,61565,61565,61565,615 71,49571,49571,49571,495 71,91971,91971,91971,919 74,56174,56174,56174,561 78,82578,82578,82578,825
ST Debt
1,892 2,561 2,561 2,561 2,561
Creditor 3,782 4,099 4,084 4,482 4,865
Other Current Liab 696 1,621 1,621 1,621 1,621
LT Debt 12,701 10,824 8,825 7,576 7,576
Other LT Liabilities 2,076 1,818 1,486 2,037 2,634
Shareholder’s Equity 21,700 25,314 26,734 28,144 29,688
Minority Interests 22,769 25,259 26,608 28,139 29,880
Total Cap. & Liab.Total Cap. & Liab.Total Cap. & Liab.Total Cap. & Liab. 65,61565,61565,61565,615 71,49571,49571,49571,495 71,91971,91971,91971,919 74,56174,56174,56174,561 78,82578,82578,82578,825
Non-Cash Wkg. Capital (429) 795 702 732 754
Net Cash/(Debt) 10,262 10,455 11,515 13,639 19,278
Debtors Turn (avg days) 68.9 78.9 80.6 75.4 75.8
Creditors Turn (avg days) 170.9 144.8 149.8 139.3 138.1
Inventory Turn (avg days) 21.3 15.8 15.0 14.9 14.9
Asset Turnover (x) 0.3 0.2 0.2 0.3 0.3
Current Ratio (x) 4.5 3.7 3.5 3.5 4.1
Quick Ratio (x) 4.4 3.4 3.2 3.2 3.8
Net Debt/Equity (X) CASH CASH CASH CASH CASH
Net Debt/Equity ex MI (X) CASH CASH CASH CASH CASH
Capex to Debt (%) (12.7) 11.0 27.3 30.5 0.0
Z-Score (X) 2.2 2.1 2.2 2.3 2.3
Source: Company, AllianceDBS
Revenue Trend
Asset Breakdown (2014)
-10%
-8%
-6%
-4%
-2%
0%
2%
4%
6%
8%
10%
12%
3,400
3,600
3,800
4,000
4,200
4,400
4,600
4,800
2Q
201
2
3Q
201
2
4Q
201
2
1Q
201
3
2Q
201
3
3Q
201
3
4Q
201
3
1Q
201
4
2Q
201
4
3Q
201
4
Revenue Revenue Growth % (QoQ)
Page 12
Company Focus
Genting Berhad
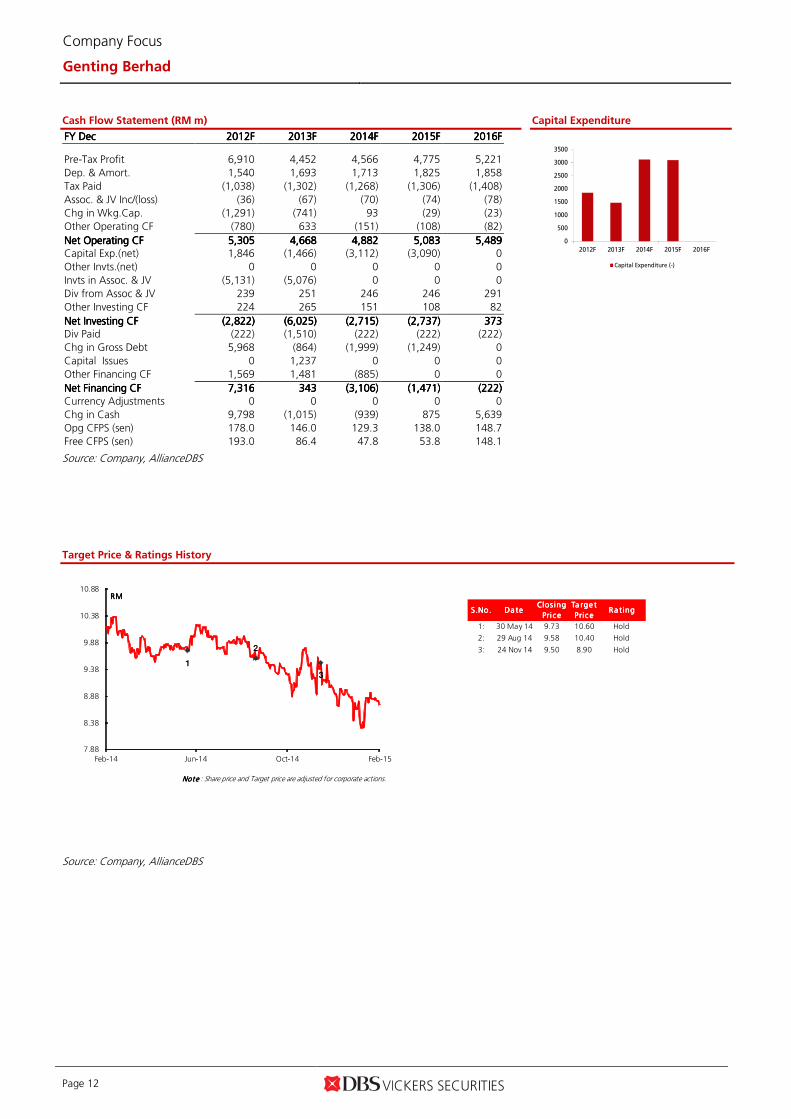
Cash Flow Statement (RM m)
FY FY FY FY DecDecDecDec 2012201220122012FFFF 2013201320132013FFFF 2014201420142014FFFF 2015201520152015FFFF 2016201620162016FFFF
Pre-Tax Profit 6,910 4,452 4,566 4,775 5,221
Dep. & Amort. 1,540 1,693 1,713 1,825 1,858
Tax Paid (1,038) (1,302) (1,268) (1,306) (1,408)
Assoc. & JV Inc/(loss) (36) (67) (70) (74) (78)
Chg in Wkg.Cap. (1,291) (741) 93 (29) (23)
Other Operating CF (780) 633 (151) (108) (82)
Net Operating CFNet Operating CFNet Operating CFNet Operating CF 5,3055,3055,3055,305 4,6684,6684,6684,668 4,8824,8824,8824,882 5,0835,0835,0835,083 5,4895,4895,4895,489 Capital Exp.(net) 1,846 (1,466) (3,112) (3,090) 0
Other Invts.(net) 0 0 0 0 0
Invts in Assoc. & JV (5,131) (5,076) 0 0 0
Div from Assoc & JV 239 251 246 246 291
Other Investing CF 224 265 151 108 82
Net Investing CFNet Investing CFNet Investing CFNet Investing CF (2,822)(2,822)(2,822)(2,822) (6,025)(6,025)(6,025)(6,025) (2,715)(2,715)(2,715)(2,715) (2,737)(2,737)(2,737)(2,737) 373373373373 Div Paid (222) (1,510) (222) (222) (222)
Chg in Gross Debt 5,968 (864) (1,999) (1,249) 0
Capital Issues 0 1,237 0 0 0
Other Financing CF 1,569 1,481 (885) 0 0
Net Financing CFNet Financing CFNet Financing CFNet Financing CF 7,3167,3167,3167,316 343343343343 (3,106)(3,106)(3,106)(3,106) (1,471)(1,471)(1,471)(1,471) (222)(222)(222)(222)
Currency Adjustments 0 0 0 0 0
Chg in Cash 9,798 (1,015) (939) 875 5,639
Opg CFPS (sen) 178.0 146.0 129.3 138.0 148.7
Free CFPS (sen) 193.0 86.4 47.8 53.8 148.1
Source: Company, AllianceDBS
Capital Expenditure
Target Price & Ratings History
Source: Company, AllianceDBS
0
500
1000
1500
2000
2500
3000
3500
2012F 2013F 2014F 2015F 2016F
Capital Expenditure (-)
S.No.S.No.S.No.S.No. Da teDa teDa teDa teClos ing Clos ing Clos ing Clos ing
Pri cePri cePri cePri ce
Ta rge t Ta rge t Ta rge t Ta rge t
Pric ePric ePric ePric eRa ting Ra ting Ra ting Ra ting
1: 30 May 14 9.73 10.60 Hold
2: 29 Aug 14 9.58 10.40 Hold
3: 24 Nov 14 9.50 8.90 Hold
Note Note Note Note : Share price and Target price are adjusted for corporate actions.
1
2
3
7.88
8.38
8.88
9.38
9.88
10.38
10.88
Feb-14 Jun-14 Oct-14 Feb-15
RMRMRMRM
www.dbsvickers.com
ed: SGC / sa: WMT
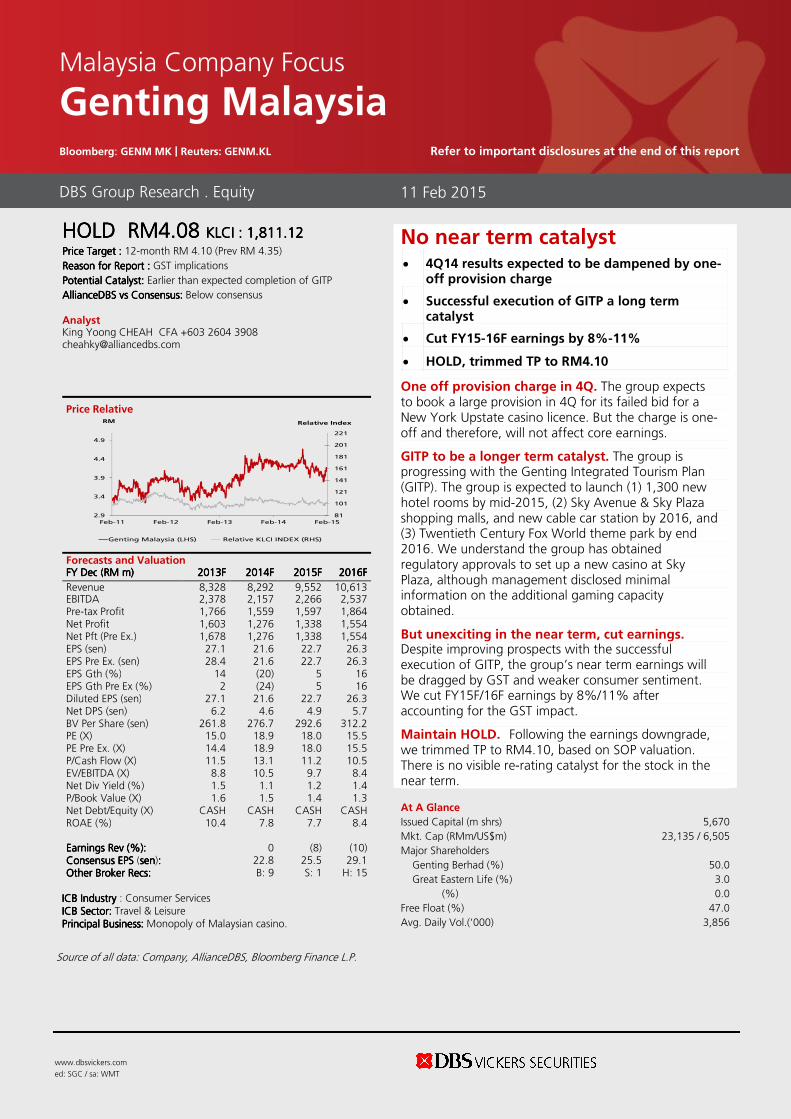
HOLD HOLD HOLD HOLD RMRMRMRM4.084.084.084.08 KLCIKLCIKLCIKLCI : : : : 1,811.121,811.121,811.121,811.12 Price Target Price Target Price Target Price Target :::: 12-month RM 4.10 (Prev RM 4.35)
Reason for Report :Reason for Report :Reason for Report :Reason for Report : GST implications
Potential Catalyst: Potential Catalyst: Potential Catalyst: Potential Catalyst: Earlier than expected completion of GITP
AllianceDBSAllianceDBSAllianceDBSAllianceDBS vs Consensus:vs Consensus:vs Consensus:vs Consensus: Below consensus Analyst King Yoong CHEAH CFA +603 2604 3908 [email protected]
Price Relative
Forecasts and Valuation FY FY FY FY DecDecDecDec ((((RMRMRMRM m) m) m) m) 2013201320132013FFFF 2014201420142014FFFF 2015201520152015FFFF 2016201620162016FFFF
Revenue 8,328 8,292 9,552 10,613 EBITDA 2,378 2,157 2,266 2,537 Pre-tax Profit 1,766 1,559 1,597 1,864 Net Profit 1,603 1,276 1,338 1,554 Net Pft (Pre Ex.) 1,678 1,276 1,338 1,554 EPS (sen) 27.1 21.6 22.7 26.3 EPS Pre Ex. (sen) 28.4 21.6 22.7 26.3 EPS Gth (%) 14 (20) 5 16 EPS Gth Pre Ex (%) 2 (24) 5 16 Diluted EPS (sen) 27.1 21.6 22.7 26.3 Net DPS (sen) 6.2 4.6 4.9 5.7 BV Per Share (sen) 261.8 276.7 292.6 312.2 PE (X) 15.0 18.9 18.0 15.5 PE Pre Ex. (X) 14.4 18.9 18.0 15.5 P/Cash Flow (X) 11.5 13.1 11.2 10.5 EV/EBITDA (X) 8.8 10.5 9.7 8.4 Net Div Yield (%) 1.5 1.1 1.2 1.4 P/Book Value (X) 1.6 1.5 1.4 1.3 Net Debt/Equity (X) CASH CASH CASH CASH ROAE (%) 10.4 7.8 7.7 8.4 Earnings Rev (%):Earnings Rev (%):Earnings Rev (%):Earnings Rev (%): 0 (8) (10) Consensus EPS Consensus EPS Consensus EPS Consensus EPS (sensensensen):::: 22.8 25.5 29.1 Other Broker Recs:Other Broker Recs:Other Broker Recs:Other Broker Recs: B: 9 S: 1 H: 15 ICB IndustryICB IndustryICB IndustryICB Industry : Consumer Services ICB Sector: ICB Sector: ICB Sector: ICB Sector: Travel & Leisure Principal Business:Principal Business:Principal Business:Principal Business: Monopoly of Malaysian casino.
Source of all data: Company, AllianceDBS, Bloomberg Finance L.P.
At A Glance Issued Capital (m shrs) 5,670 Mkt. Cap (RMm/US$m) 23,135 / 6,505 Major Shareholders Genting Berhad (%) 50.0 Great Eastern Life (%) 3.0 (%) 0.0 Free Float (%) 47.0 Avg. Daily Vol.(‘000) 3,856
DBS Group Research . Equity
11 Feb 2015
Malaysia Company Focus
Genting Malaysia Bloomberg: GENM MK | Reuters: GENM.KL Refer to important disclosures at the end of this report
No near term catalyst • 4Q14 results expected to be dampened by one-
off provision charge
• Successful execution of GITP a long term catalyst
• Cut FY15-16F earnings by 8%-11%
• HOLD, trimmed TP to RM4.10
One off provision charge in 4Q. The group expects to book a large provision in 4Q for its failed bid for a New York Upstate casino licence. But the charge is one-off and therefore, will not affect core earnings.
GITP to be a longer term catalyst. The group is progressing with the Genting Integrated Tourism Plan (GITP). The group is expected to launch (1) 1,300 new hotel rooms by mid-2015, (2) Sky Avenue & Sky Plaza shopping malls, and new cable car station by 2016, and (3) Twentieth Century Fox World theme park by end 2016. We understand the group has obtained regulatory approvals to set up a new casino at Sky Plaza, although management disclosed minimal information on the additional gaming capacity obtained.
But unexciting in the near term, cut earnings. Despite improving prospects with the successful execution of GITP, the group’s near term earnings will be dragged by GST and weaker consumer sentiment. We cut FY15F/16F earnings by 8%/11% after accounting for the GST impact.
Maintain HOLD. Following the earnings downgrade, we trimmed TP to RM4.10, based on SOP valuation. There is no visible re-rating catalyst for the stock in the near term.
81
101
121
141
161
181
201
221
2.9
3.4
3.9
4.4
4.9
Feb-11 Feb-12 Feb-13 Feb-14 Feb-15
Relative IndexRM
Genting Malaysia (LHS) Relative KLCI INDEX (RHS)
Page 14
Company Focus
Genting Malaysia
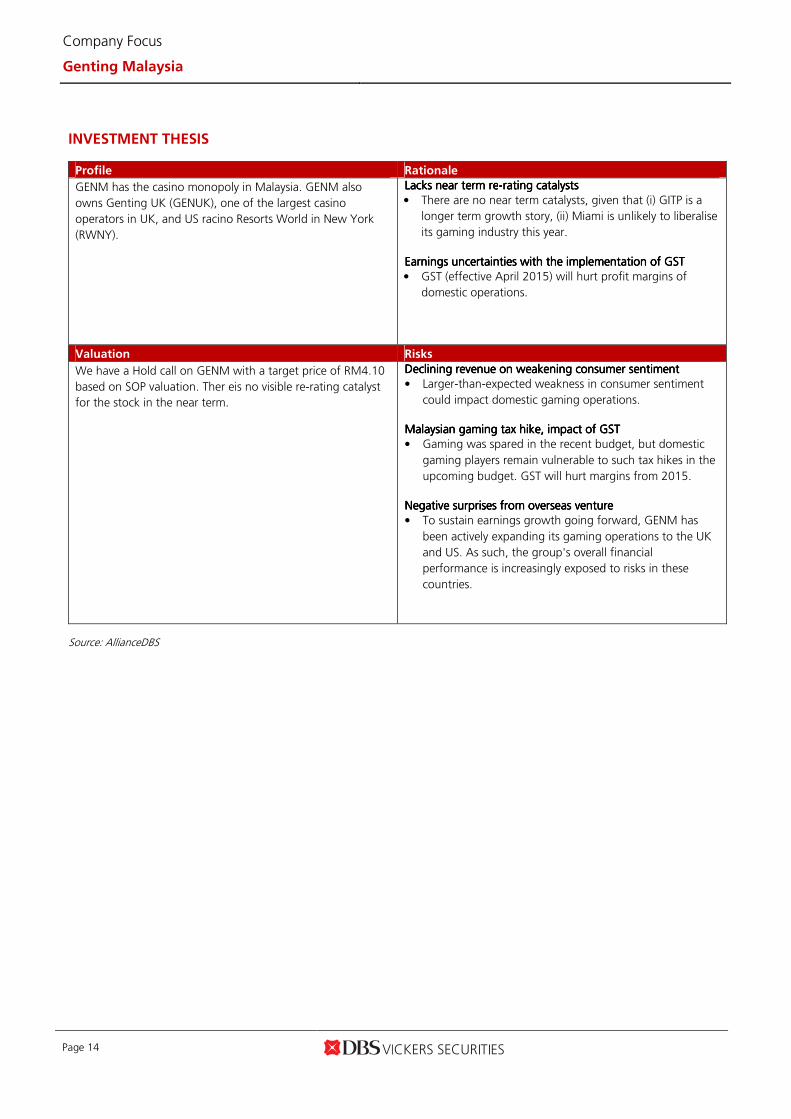
INVESTMENT THESIS
Profile Rationale
GENM has the casino monopoly in Malaysia. GENM also
owns Genting UK (GENUK), one of the largest casino
operators in UK, and US racino Resorts World in New York
(RWNY).
LackLackLackLackssss near term renear term renear term renear term re----rating catalysts rating catalysts rating catalysts rating catalysts
• There are no near term catalysts, given that (i) GITP is a
longer term growth story, (ii) Miami is unlikely to liberalise
its gaming industry this year.
Earnings uncertainties with the implementation of GST Earnings uncertainties with the implementation of GST Earnings uncertainties with the implementation of GST Earnings uncertainties with the implementation of GST
• GST (effective April 2015) will hurt profit margins of
domestic operations.
Valuation Risks
We have a Hold call on GENM with a target price of RM4.10
based on SOP valuation. Ther eis no visible re-rating catalyst
for the stock in the near term.
Declining revenue on weakening consumer sentiment Declining revenue on weakening consumer sentiment Declining revenue on weakening consumer sentiment Declining revenue on weakening consumer sentiment
• Larger-than-expected weakness in consumer sentiment
could impact domestic gaming operations.
Malaysian gaming tax hike, impact of GST Malaysian gaming tax hike, impact of GST Malaysian gaming tax hike, impact of GST Malaysian gaming tax hike, impact of GST
• Gaming was spared in the recent budget, but domestic
gaming players remain vulnerable to such tax hikes in the
upcoming budget. GST will hurt margins from 2015.
Negative surprises from overseas venture Negative surprises from overseas venture Negative surprises from overseas venture Negative surprises from overseas venture
• To sustain earnings growth going forward, GENM has
been actively expanding its gaming operations to the UK
and US. As such, the group's overall financial
performance is increasingly exposed to risks in these
countries.
Source: AllianceDBS
Page 15
Company Focus
Genting Malaysia
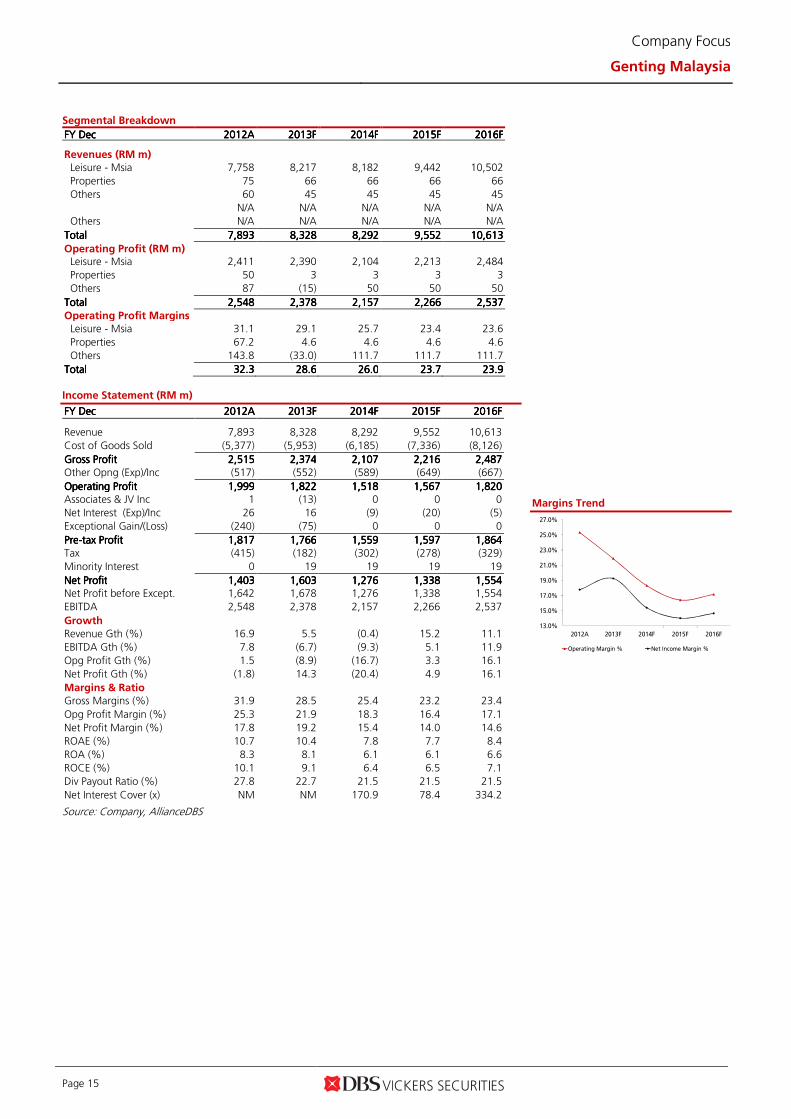
Segmental Breakdown
FY FY FY FY DecDecDecDec 2012201220122012AAAA 2013201320132013FFFF 2014201420142014FFFF 2015201520152015FFFF 2016201620162016FFFF Revenues (RM m)
Leisure - Msia 7,758 8,217 8,182 9,442 10,502
Properties 75 66 66 66 66
Others 60 45 45 45 45
N/A N/A N/A N/A N/A
Others N/A N/A N/A N/A N/A
TotalTotalTotalTotal 7,8937,8937,8937,893 8,3288,3288,3288,328 8,2928,2928,2928,292 9,5529,5529,5529,552 10,61310,61310,61310,613
Operating Profit (RM m) Leisure - Msia 2,411 2,390 2,104 2,213 2,484
Properties 50 3 3 3 3
Others 87 (15) 50 50 50
TotalTotalTotalTotal 2,5482,5482,5482,548 2,3782,3782,3782,378 2,1572,1572,1572,157 2,2662,2662,2662,266 2,5372,5372,5372,537
Operating Profit Margins (%)
Leisure - Msia 31.1 29.1 25.7 23.4 23.6
Properties 67.2 4.6 4.6 4.6 4.6
Others 143.8 (33.0) 111.7 111.7 111.7
TotalTotalTotalTotal 32.332.332.332.3 28.628.628.628.6 26.026.026.026.0 23.723.723.723.7 23.923.923.923.9
Income Statement (RM m)
FY FY FY FY DecDecDecDec 2012201220122012AAAA 2013201320132013FFFF 2014201420142014FFFF 2015201520152015FFFF 2016201620162016FFFF
Revenue 7,893 8,328 8,292 9,552 10,613
Cost of Goods Sold (5,377) (5,953) (6,185) (7,336) (8,126)
Gross ProfitGross ProfitGross ProfitGross Profit 2,5152,5152,5152,515 2,3742,3742,3742,374 2,1072,1072,1072,107 2,2162,2162,2162,216 2,4872,4872,4872,487
Other Opng (Exp)/Inc (517) (552) (589) (649) (667)
Operating ProfitOperating ProfitOperating ProfitOperating Profit 1,9991,9991,9991,999 1,8221,8221,8221,822 1,5181,5181,5181,518 1,5671,5671,5671,567 1,8201,8201,8201,820 Associates & JV Inc 1 (13) 0 0 0
Net Interest (Exp)/Inc 26 16 (9) (20) (5)
Exceptional Gain/(Loss) (240) (75) 0 0 0
PrePrePrePre----tax Profittax Profittax Profittax Profit 1,8171,8171,8171,817 1,7661,7661,7661,766 1,5591,5591,5591,559 1,5971,5971,5971,597 1,8641,8641,8641,864
Tax (415) (182) (302) (278) (329)
Minority Interest 0 19 19 19 19
Net ProfitNet ProfitNet ProfitNet Profit 1,4031,4031,4031,403 1,6031,6031,6031,603 1,2761,2761,2761,276 1,3381,3381,3381,338 1,5541,5541,5541,554 Net Profit before Except. 1,642 1,678 1,276 1,338 1,554
EBITDA 2,548 2,378 2,157 2,266 2,537
Growth
Revenue Gth (%) 16.9 5.5 (0.4) 15.2 11.1
EBITDA Gth (%) 7.8 (6.7) (9.3) 5.1 11.9
Opg Profit Gth (%) 1.5 (8.9) (16.7) 3.3 16.1
Net Profit Gth (%) (1.8) 14.3 (20.4) 4.9 16.1
Margins & Ratio
Gross Margins (%) 31.9 28.5 25.4 23.2 23.4
Opg Profit Margin (%) 25.3 21.9 18.3 16.4 17.1
Net Profit Margin (%) 17.8 19.2 15.4 14.0 14.6
ROAE (%) 10.7 10.4 7.8 7.7 8.4
ROA (%) 8.3 8.1 6.1 6.1 6.6
ROCE (%) 10.1 9.1 6.4 6.5 7.1
Div Payout Ratio (%) 27.8 22.7 21.5 21.5 21.5
Net Interest Cover (x) NM NM 170.9 78.4 334.2
Source: Company, AllianceDBS
Margins Trend
13.0%
15.0%
17.0%
19.0%
21.0%
23.0%
25.0%
27.0%
2012A 2013F 2014F 2015F 2016F
Operating Margin % Net Income Margin %
Page 16
Company Focus
Genting Malaysia
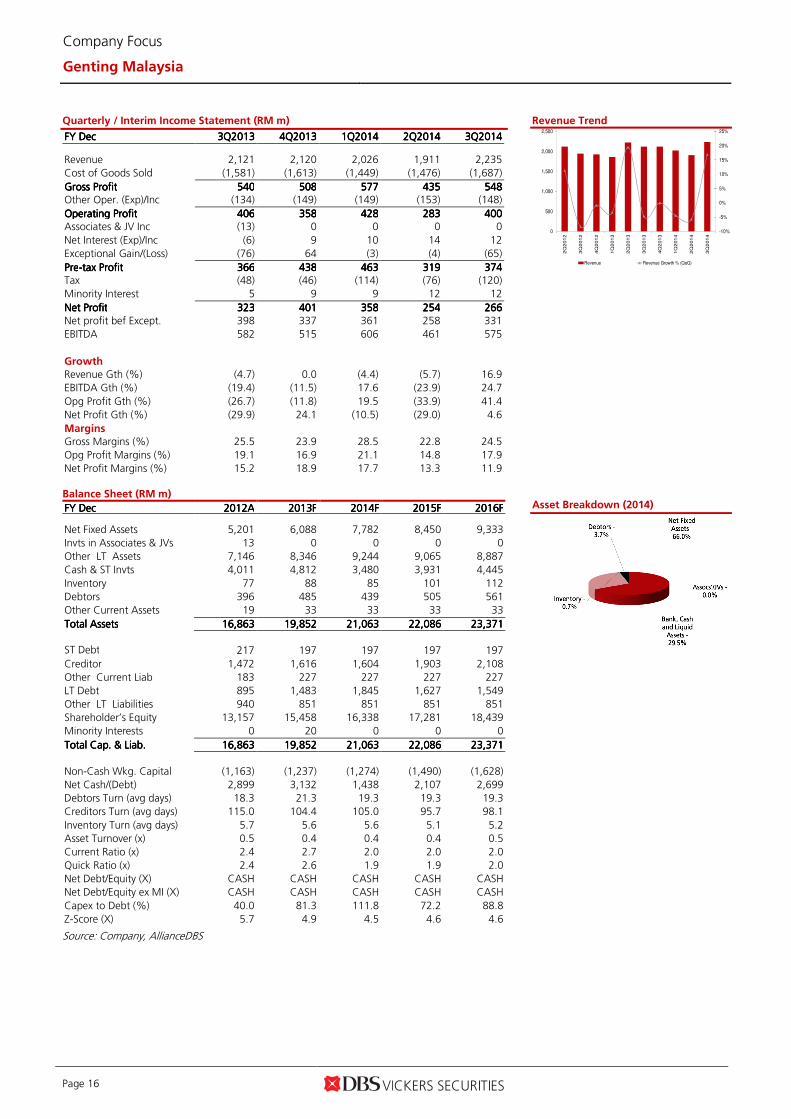
Quarterly / Interim Income Statement (RM m)
FY FY FY FY DecDecDecDec 3Q3Q3Q3Q2013201320132013 4Q4Q4Q4Q2013201320132013 1Q1Q1Q1Q2014201420142014 2Q2Q2Q2Q2014201420142014 3Q3Q3Q3Q2014201420142014
Revenue 2,121 2,120 2,026 1,911 2,235
Cost of Goods Sold (1,581) (1,613) (1,449) (1,476) (1,687)
Gross ProfitGross ProfitGross ProfitGross Profit 540540540540 508508508508 577577577577 435435435435 548548548548 Other Oper. (Exp)/Inc (134) (149) (149) (153) (148)
Operating ProfitOperating ProfitOperating ProfitOperating Profit 406406406406 358358358358 428428428428 283283283283 400400400400 Associates & JV Inc (13) 0 0 0 0
Net Interest (Exp)/Inc (6) 9 10 14 12
Exceptional Gain/(Loss) (76) 64 (3) (4) (65)
PrePrePrePre----tax Profittax Profittax Profittax Profit 366366366366 438438438438 463463463463 319319319319 374374374374 Tax (48) (46) (114) (76) (120)
Minority Interest 5 9 9 12 12
Net ProfitNet ProfitNet ProfitNet Profit 323323323323 401401401401 358358358358 254254254254 266266266266
Net profit bef Except. 398 337 361 258 331
EBITDA 582 515 606 461 575
Growth
Revenue Gth (%) (4.7) 0.0 (4.4) (5.7) 16.9
EBITDA Gth (%) (19.4) (11.5) 17.6 (23.9) 24.7
Opg Profit Gth (%) (26.7) (11.8) 19.5 (33.9) 41.4
Net Profit Gth (%) (29.9) 24.1 (10.5) (29.0) 4.6
Margins
Gross Margins (%) 25.5 23.9 28.5 22.8 24.5
Opg Profit Margins (%) 19.1 16.9 21.1 14.8 17.9
Net Profit Margins (%) 15.2 18.9 17.7 13.3 11.9
Balance Sheet (RM m)
FY FY FY FY DecDecDecDec 2012201220122012AAAA 2013201320132013FFFF 2014201420142014FFFF 2015201520152015FFFF 2016201620162016FFFF Net Fixed Assets 5,201 6,088 7,782 8,450 9,333
Invts in Associates & JVs 13 0 0 0 0
Other LT Assets 7,146 8,346 9,244 9,065 8,887
Cash & ST Invts 4,011 4,812 3,480 3,931 4,445
Inventory 77 88 85 101 112
Debtors 396 485 439 505 561
Other Current Assets 19 33 33 33 33
Total AssetsTotal AssetsTotal AssetsTotal Assets 16,86316,86316,86316,863 19,85219,85219,85219,852 21,06321,06321,06321,063 22,08622,08622,08622,086 23,37123,37123,37123,371
ST Debt
217 197 197 197 197
Creditor 1,472 1,616 1,604 1,903 2,108
Other Current Liab 183 227 227 227 227
LT Debt 895 1,483 1,845 1,627 1,549
Other LT Liabilities 940 851 851 851 851
Shareholder’s Equity 13,157 15,458 16,338 17,281 18,439
Minority Interests 0 20 0 0 0
Total Cap. & Liab.Total Cap. & Liab.Total Cap. & Liab.Total Cap. & Liab. 16,86316,86316,86316,863 19,85219,85219,85219,852 21,06321,06321,06321,063 22,08622,08622,08622,086 23,37123,37123,37123,371
Non-Cash Wkg. Capital (1,163) (1,237) (1,274) (1,490) (1,628)
Net Cash/(Debt) 2,899 3,132 1,438 2,107 2,699
Debtors Turn (avg days) 18.3 21.3 19.3 19.3 19.3
Creditors Turn (avg days) 115.0 104.4 105.0 95.7 98.1
Inventory Turn (avg days) 5.7 5.6 5.6 5.1 5.2
Asset Turnover (x) 0.5 0.4 0.4 0.4 0.5
Current Ratio (x) 2.4 2.7 2.0 2.0 2.0
Quick Ratio (x) 2.4 2.6 1.9 1.9 2.0
Net Debt/Equity (X) CASH CASH CASH CASH CASH
Net Debt/Equity ex MI (X) CASH CASH CASH CASH CASH
Capex to Debt (%) 40.0 81.3 111.8 72.2 88.8
Z-Score (X) 5.7 4.9 4.5 4.6 4.6
Source: Company, AllianceDBS
Revenue Trend
Asset Breakdown (2014)
-10%
-5%
0%
5%
10%
15%
20%
25%
0
500
1,000
1,500
2,000
2,500
2Q
201
2
3Q
201
2
4Q
201
2
1Q
201
3
2Q
201
3
3Q
201
3
4Q
201
3
1Q
201
4
2Q
201
4
3Q
201
4
Revenue Revenue Growth % (QoQ)
Page 17
Company Focus
Genting Malaysia
Cash Flow Statement (RM m)
FY FY FY FY DecDecDecDec 2012201220122012AAAA 2013201320132013FFFF 2014201420142014FFFF 2015201520152015FFFF 2016201620162016FFFF
Pre-Tax Profit 1,817 1,766 1,559 1,597 1,864
Dep. & Amort. 517 552 589 649 667
Tax Paid (494) (479) (302) (278) (329)
Assoc. & JV Inc/(loss) (1) 13 0 0 0
Chg in Wkg.Cap. (87) 222 37 216 138
Other Operating CF 177 27 (41) (30) (45)
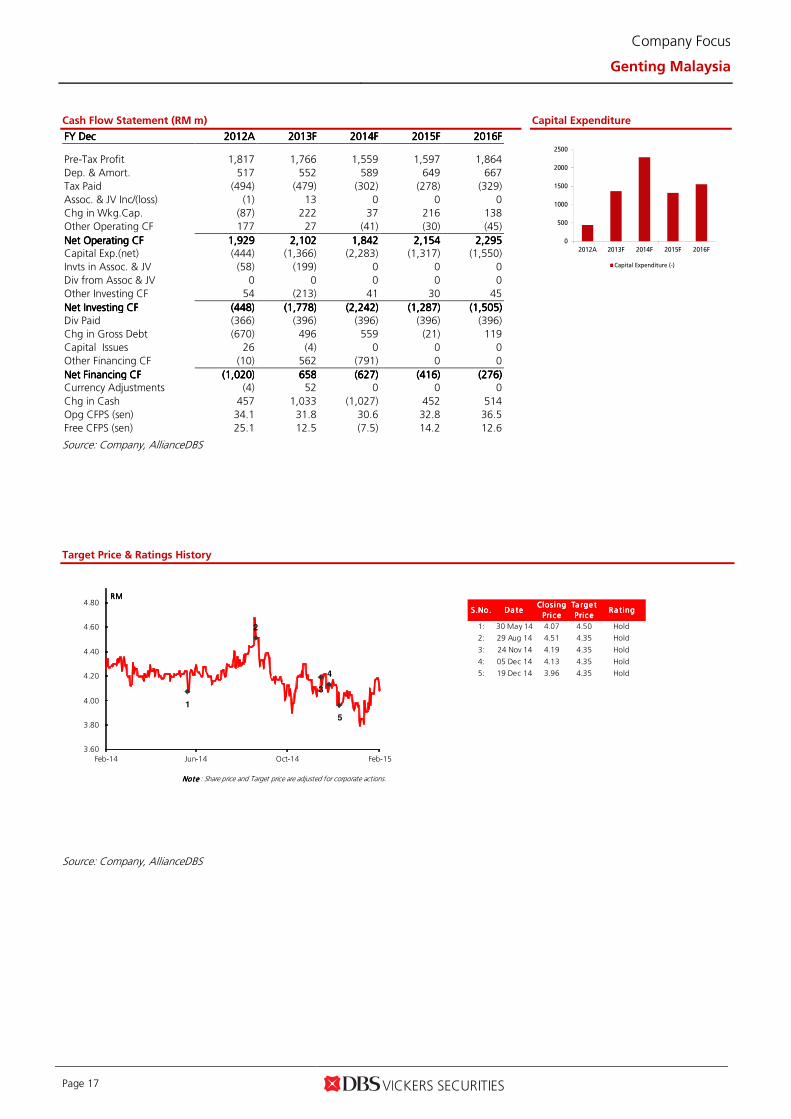
Net Operating CFNet Operating CFNet Operating CFNet Operating CF 1,9291,9291,9291,929 2,1022,1022,1022,102 1,8421,8421,8421,842 2,1542,1542,1542,154 2,2952,2952,2952,295 Capital Exp.(net) (444) (1,366) (2,283) (1,317) (1,550)
Invts in Assoc. & JV (58) (199) 0 0 0
Div from Assoc & JV 0 0 0 0 0
Other Investing CF 54 (213) 41 30 45
Net Investing CFNet Investing CFNet Investing CFNet Investing CF (448)(448)(448)(448) (1,778)(1,778)(1,778)(1,778) (2,242)(2,242)(2,242)(2,242) (1,287)(1,287)(1,287)(1,287) (1,505)(1,505)(1,505)(1,505)
Div Paid (366) (396) (396) (396) (396)
Chg in Gross Debt (670) 496 559 (21) 119
Capital Issues 26 (4) 0 0 0
Other Financing CF (10) 562 (791) 0 0
Net Financing CFNet Financing CFNet Financing CFNet Financing CF (1,020)(1,020)(1,020)(1,020) 658658658658 (627)(627)(627)(627) (416)(416)(416)(416) (276)(276)(276)(276) Currency Adjustments (4) 52 0 0 0
Chg in Cash 457 1,033 (1,027) 452 514
Opg CFPS (sen) 34.1 31.8 30.6 32.8 36.5
Free CFPS (sen) 25.1 12.5 (7.5) 14.2 12.6
Source: Company, AllianceDBS
Capital Expenditure
Target Price & Ratings History
Source: Company, AllianceDBS
0
500
1000
1500
2000
2500
2012A 2013F 2014F 2015F 2016F
Capital Expenditure (-)
S.No.S.No.S.No.S.No. Da teDa teDa teDa teClos ing Clos ing Clos ing Clos ing
Pri cePri cePri cePri ce
Ta rge t Ta rge t Ta rge t Ta rge t
Pric ePric ePric ePric eRa ting Ra ting Ra ting Ra ting
1: 30 May 14 4.07 4.50 Hold
2: 29 Aug 14 4.51 4.35 Hold
3: 24 Nov 14 4.19 4.35 Hold
4: 05 Dec 14 4.13 4.35 Hold
5: 19 Dec 14 3.96 4.35 Hold
Note Note Note Note : Share price and Target price are adjusted for corporate actions.
1
2
3
4
5
3.60
3.80
4.00
4.20
4.40
4.60
4.80
Feb-14 Jun-14 Oct-14 Feb-15
RMRMRMRM
www.dbsvickers.com
ed: SGC / sa: WMT
HOLDHOLDHOLDHOLD RMRMRMRM2.812.812.812.81 KLCIKLCIKLCIKLCI : : : : 1,811.121,811.121,811.121,811.12 Price Target :Price Target :Price Target :Price Target : 12-Month RM 2.45 (Prev RM 2.74)
Reason for Report :Reason for Report :Reason for Report :Reason for Report : GST implications
Potential Catalyst: Potential Catalyst: Potential Catalyst: Potential Catalyst: New game variants
AllianceDBSAllianceDBSAllianceDBSAllianceDBS vs vs vs vs Consensus:Consensus:Consensus:Consensus: Below consensus Analyst King Yoong CHEAH CFA +603 2604 3908 [email protected]
Price Relative
Forecasts and Valuation FY FY FY FY DecDecDecDec ((((RMRMRMRM m) m) m) m) 2013201320132013AAAA 2014201420142014AAAA 2015201520152015AAAA 2016201620162016FFFF
Revenue 2,991 2,885 2,955 2,985 EBITDA 473 440 413 405 Pre-tax Profit 347 387 365 364 Net Profit 268 260 248 251 Net Pft (Pre Ex.) 327 260 248 251 EPS (sen) 18.7 18.2 17.4 17.6 EPS Pre Ex. (sen) 22.9 18.2 17.4 17.6 EPS Gth (%) (21) (3) (4) 1 EPS Gth Pre Ex (%) 26 (20) (4) 1 Diluted EPS (sen) 22.9 18.2 17.4 17.6 Net DPS (sen) 17.9 20.0 14.8 14.9 BV Per Share (sen) 172.4 195.1 193.3 195.9 PE (X) 15.0 15.4 16.1 16.0 PE Pre Ex. (X) 12.3 15.4 16.1 16.0 P/Cash Flow (X) 8.6 6.3 23.3 17.3 EV/EBITDA (X) 9.7 9.7 10.5 10.7 Net Div Yield (%) 6.4 7.1 5.3 5.3 P/Book Value (X) 1.6 1.4 1.5 1.4 Net Debt/Equity (X) 0.2 0.1 0.1 0.1 ROAE (%) 9.1 9.8 8.9 9.0 Earnings Rev (%):Earnings Rev (%):Earnings Rev (%):Earnings Rev (%): (4) (22) (25) Consensus EPS Consensus EPS Consensus EPS Consensus EPS (sensensensen):::: 27.6 27.6 N/A Other Broker Recs:Other Broker Recs:Other Broker Recs:Other Broker Recs: B: 2 S: 0 H: 7 ICB IndustryICB IndustryICB IndustryICB Industry : Financials ICB Sector: ICB Sector: ICB Sector: ICB Sector: General Financial Principal Business:Principal Business:Principal Business:Principal Business: Market leader in NFO
Source of all data: Company, AllianceDBS, Bloomberg Finance L.P.
At A Glance Issued Capital (m shrs) 1,425 Mkt. Cap (RMm/US$m) 4,003 / 1,126 Major Shareholders Casi Management Sdn Bhd (%) 28.4 Asia 4D Holdings Ltd (%) 11.2 (%) 0.0 Free Float (%) 60.4 Avg. Daily Vol.(‘000) 642
DBS Group Research . Equity
11 Feb 2015
Malaysia Company Focus
Magnum Bloomberg: MAG MK | Reuters: MAGM.KL Refer to important disclosures at the end of this report
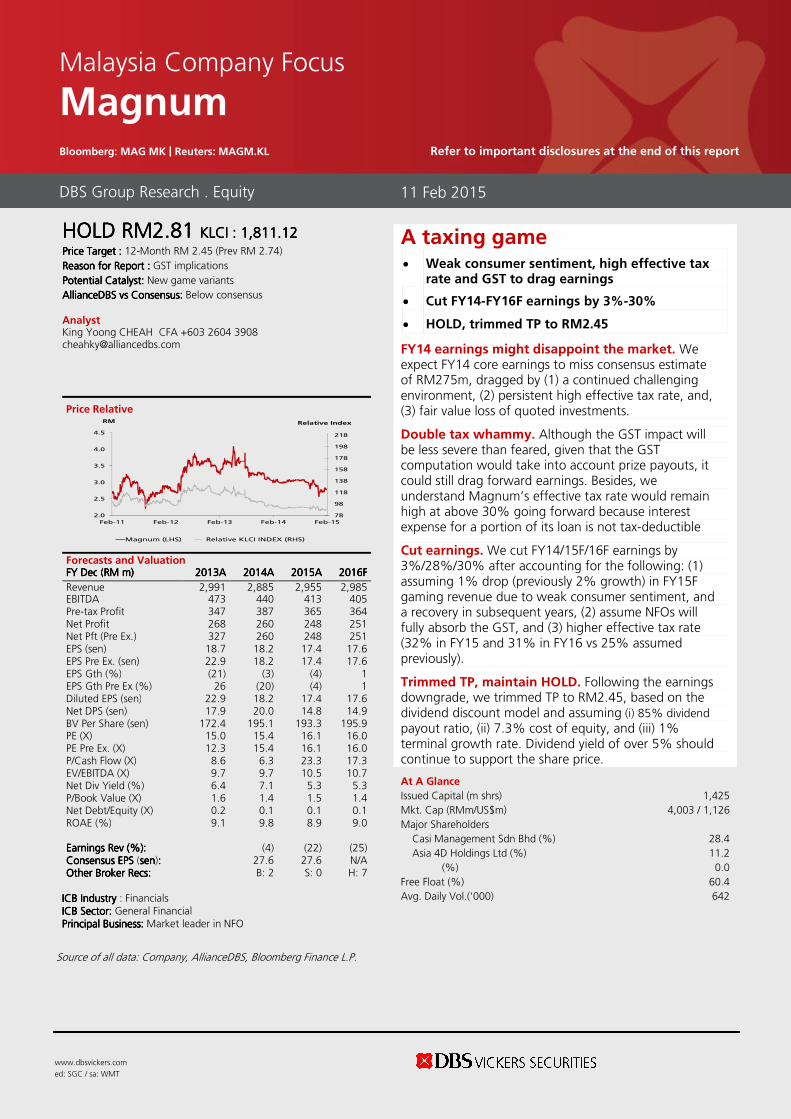
A taxing game • Weak consumer sentiment, high effective tax
rate and GST to drag earnings
• Cut FY14-FY16F earnings by 3%-30%
• HOLD, trimmed TP to RM2.45
FY14 earnings might disappoint the market. We expect FY14 core earnings to miss consensus estimate of RM275m, dragged by (1) a continued challenging environment, (2) persistent high effective tax rate, and, (3) fair value loss of quoted investments.
Double tax whammy. Although the GST impact will be less severe than feared, given that the GST computation would take into account prize payouts, it could still drag forward earnings. Besides, we understand Magnum’s effective tax rate would remain high at above 30% going forward because interest expense for a portion of its loan is not tax-deductible
Cut earnings. We cut FY14/15F/16F earnings by 3%/28%/30% after accounting for the following: (1) assuming 1% drop (previously 2% growth) in FY15F gaming revenue due to weak consumer sentiment, and a recovery in subsequent years, (2) assume NFOs will fully absorb the GST, and (3) higher effective tax rate (32% in FY15 and 31% in FY16 vs 25% assumed previously).
Trimmed TP, maintain HOLD. Following the earnings downgrade, we trimmed TP to RM2.45, based on the dividend discount model and assuming (i) 85% dividend
payout ratio, (ii) 7.3% cost of equity, and (iii) 1% terminal growth rate. Dividend yield of over 5% should continue to support the share price.
78
98
118
138
158
178
198
218
2.0
2.5
3.0
3.5
4.0
4.5
Feb-11 Feb-12 Feb-13 Feb-14 Feb-15
Relative IndexRM
Magnum (LHS) Relative KLCI INDEX (RHS)
Page 19
Company Focus
Magnum
INVESTMENT THESIS
Profile Rationale
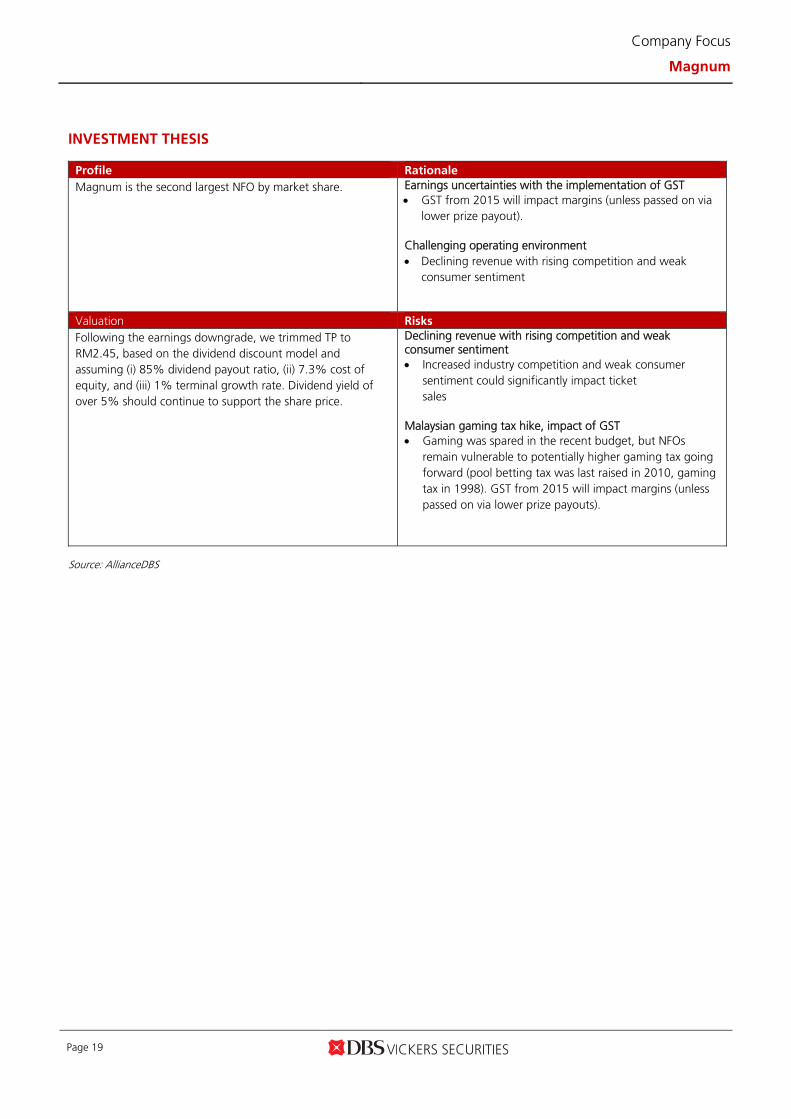
Magnum is the second largest NFO by market share.
Earnings uncertainties with the implementation of GST GST from 2015 will impact margins (unless passed on via
lower prize payout).
Challenging operating environment Declining revenue with rising competition and weak
consumer sentiment
Valuation Risks
Following the earnings downgrade, we trimmed TP to RM2.45, based on the dividend discount model and assuming (i) 85% dividend payout ratio, (ii) 7.3% cost of equity, and (iii) 1% terminal growth rate. Dividend yield of over 5% should continue to support the share price.
Declining revenue with rising competition and weak consumer sentiment Increased industry competition and weak consumer
sentiment could significantly impact ticket sales
Malaysian gaming tax hike, impact of GST Gaming was spared in the recent budget, but NFOs
remain vulnerable to potentially higher gaming tax going forward (pool betting tax was last raised in 2010, gaming tax in 1998). GST from 2015 will impact margins (unless passed on via lower prize payouts).
Source: AllianceDBS
Page 20
Company Focus
Magnum
Key Assumptions
Segmental Breakdown
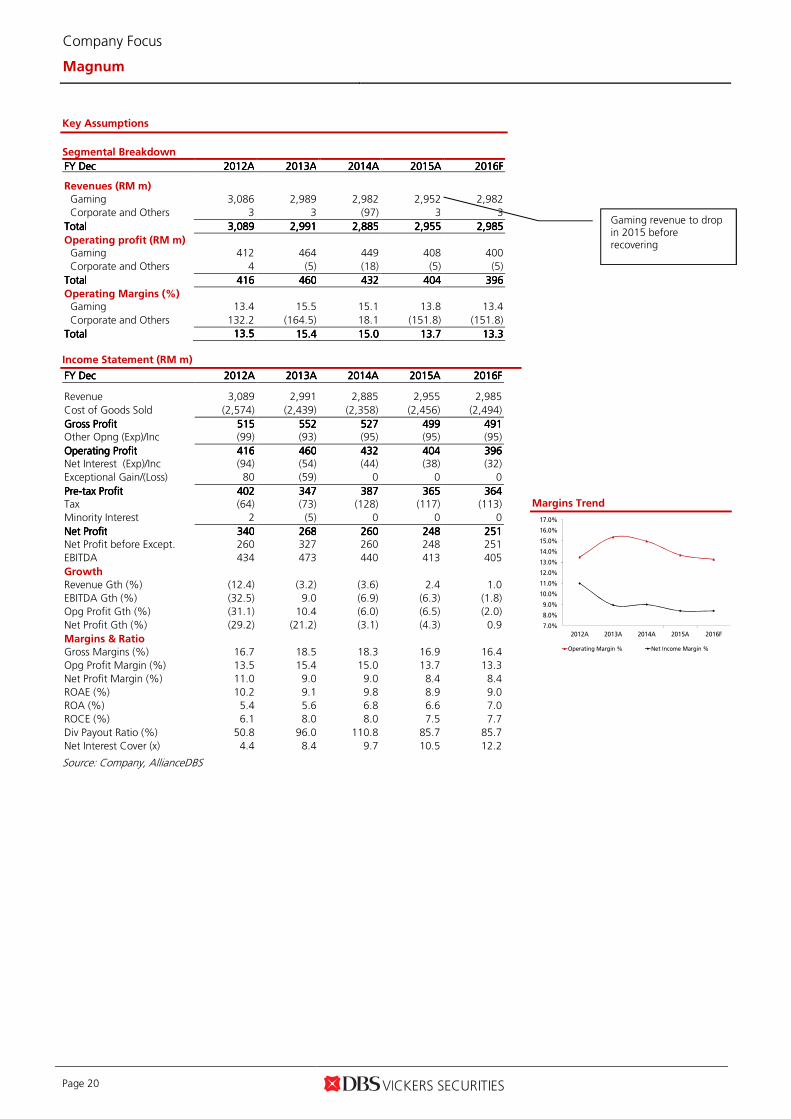
FY FY FY FY DecDecDecDec 2012201220122012AAAA 2013201320132013AAAA 2014201420142014AAAA 2015201520152015AAAA 2016201620162016FFFF Revenues (RM m)
Gaming 3,086 2,989 2,982 2,952 2,982
Corporate and Others 3 3 (97) 3 3
TotalTotalTotalTotal 3,0893,0893,0893,089 2,9912,9912,9912,991 2,8852,8852,8852,885 2,9552,9552,9552,955 2,9852,9852,9852,985
Operating profit (RM m) Gaming 412 464 449 408 400
Corporate and Others 4 (5) (18) (5) (5)
TotalTotalTotalTotal 416416416416 460460460460 432432432432 404404404404 396396396396
Operating Margins (%) Gaming 13.4 15.5 15.1 13.8 13.4
Corporate and Others 132.2 (164.5) 18.1 (151.8) (151.8)
TotalTotalTotalTotal 13.513.513.513.5 15.415.415.415.4 15.015.015.015.0 13.713.713.713.7 13.313.313.313.3
Income Statement (RM m)
FY FY FY FY DecDecDecDec 2012201220122012AAAA 2013201320132013AAAA 2014201420142014AAAA 2015201520152015AAAA 2016201620162016FFFF
Revenue 3,089 2,991 2,885 2,955 2,985
Cost of Goods Sold (2,574) (2,439) (2,358) (2,456) (2,494)
Gross ProfitGross ProfitGross ProfitGross Profit 515515515515 552552552552 527527527527 499499499499 491491491491 Other Opng (Exp)/Inc (99) (93) (95) (95) (95)
Operating ProfitOperating ProfitOperating ProfitOperating Profit 416416416416 460460460460 432432432432 404404404404 396396396396 Net Interest (Exp)/Inc (94) (54) (44) (38) (32)
Exceptional Gain/(Loss) 80 (59) 0 0 0
PrePrePrePre----tax Profittax Profittax Profittax Profit 402402402402 347347347347 387387387387 365365365365 364364364364 Tax (64) (73) (128) (117) (113)
Minority Interest 2 (5) 0 0 0
Net ProfitNet ProfitNet ProfitNet Profit 340340340340 268268268268 260260260260 248248248248 251251251251 Net Profit before Except. 260 327 260 248 251
EBITDA 434 473 440 413 405
Growth
Revenue Gth (%) (12.4) (3.2) (3.6) 2.4 1.0
EBITDA Gth (%) (32.5) 9.0 (6.9) (6.3) (1.8)
Opg Profit Gth (%) (31.1) 10.4 (6.0) (6.5) (2.0)
Net Profit Gth (%) (29.2) (21.2) (3.1) (4.3) 0.9
Margins & Ratio
Gross Margins (%) 16.7 18.5 18.3 16.9 16.4
Opg Profit Margin (%) 13.5 15.4 15.0 13.7 13.3
Net Profit Margin (%) 11.0 9.0 9.0 8.4 8.4
ROAE (%) 10.2 9.1 9.8 8.9 9.0
ROA (%) 5.4 5.6 6.8 6.6 7.0
ROCE (%) 6.1 8.0 8.0 7.5 7.7
Div Payout Ratio (%) 50.8 96.0 110.8 85.7 85.7
Net Interest Cover (x) 4.4 8.4 9.7 10.5 12.2
Source: Company, AllianceDBS
Margins Trend
7.0%
8.0%
9.0%
10.0%
11.0%
12.0%
13.0%
14.0%
15.0%
16.0%
17.0%
2012A 2013A 2014A 2015A 2016F
Operating Margin % Net Income Margin %
Gaming revenue to drop in 2015 before recovering
Page 21
Company Focus
Magnum
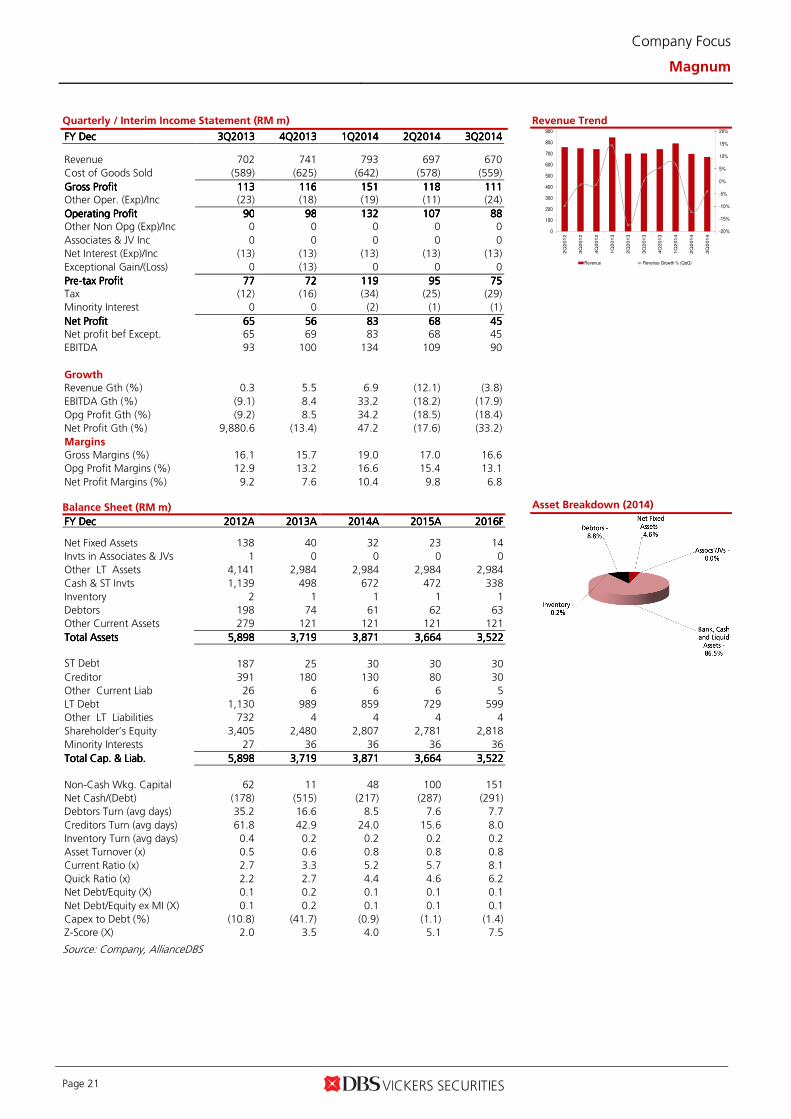
Quarterly / Interim Income Statement (RM m)
FY FY FY FY DecDecDecDec 3Q3Q3Q3Q2013201320132013 4Q4Q4Q4Q2013201320132013 1Q1Q1Q1Q2014201420142014 2Q2Q2Q2Q2014201420142014 3Q3Q3Q3Q2014201420142014
Revenue 702 741 793 697 670
Cost of Goods Sold (589) (625) (642) (578) (559)
Gross ProfitGross ProfitGross ProfitGross Profit 113113113113 116116116116 151151151151 118118118118 111111111111 Other Oper. (Exp)/Inc (23) (18) (19) (11) (24)
Operating ProfitOperating ProfitOperating ProfitOperating Profit 90909090 98989898 132132132132 107107107107 88888888 Other Non Opg (Exp)/Inc 0 0 0 0 0
Associates & JV Inc 0 0 0 0 0
Net Interest (Exp)/Inc (13) (13) (13) (13) (13)
Exceptional Gain/(Loss) 0 (13) 0 0 0
PrePrePrePre----tax Profittax Profittax Profittax Profit 77777777 72727272 119119119119 95959595 75757575 Tax (12) (16) (34) (25) (29)
Minority Interest 0 0 (2) (1) (1)
Net ProfitNet ProfitNet ProfitNet Profit 65656565 56565656 83838383 68686868 45454545 Net profit bef Except. 65 69 83 68 45
EBITDA 93 100 134 109 90
Growth
Revenue Gth (%) 0.3 5.5 6.9 (12.1) (3.8)
EBITDA Gth (%) (9.1) 8.4 33.2 (18.2) (17.9)
Opg Profit Gth (%) (9.2) 8.5 34.2 (18.5) (18.4)
Net Profit Gth (%) 9,880.6 (13.4) 47.2 (17.6) (33.2)
Margins
Gross Margins (%) 16.1 15.7 19.0 17.0 16.6
Opg Profit Margins (%) 12.9 13.2 16.6 15.4 13.1
Net Profit Margins (%) 9.2 7.6 10.4 9.8 6.8 Balance Sheet (RM m)
FY FY FY FY DecDecDecDec 2012201220122012AAAA 2013201320132013AAAA 2014201420142014AAAA 2015201520152015AAAA 2016201620162016FFFF Net Fixed Assets 138 40 32 23 14
Invts in Associates & JVs 1 0 0 0 0
Other LT Assets 4,141 2,984 2,984 2,984 2,984
Cash & ST Invts 1,139 498 672 472 338
Inventory 2 1 1 1 1
Debtors 198 74 61 62 63
Other Current Assets 279 121 121 121 121
Total AssetsTotal AssetsTotal AssetsTotal Assets 5,8985,8985,8985,898 3,7193,7193,7193,719 3,8713,8713,8713,871 3,6643,6643,6643,664 3,5223,5223,5223,522
ST Debt
187 25 30 30 30
Creditor 391 180 130 80 30
Other Current Liab 26 6 6 6 5
LT Debt 1,130 989 859 729 599
Other LT Liabilities 732 4 4 4 4
Shareholder’s Equity 3,405 2,480 2,807 2,781 2,818
Minority Interests 27 36 36 36 36
Total Cap. & Liab.Total Cap. & Liab.Total Cap. & Liab.Total Cap. & Liab. 5,8985,8985,8985,898 3,7193,7193,7193,719 3,8713,8713,8713,871 3,6643,6643,6643,664 3,5223,5223,5223,522
Non-Cash Wkg. Capital 62 11 48 100 151
Net Cash/(Debt) (178) (515) (217) (287) (291)
Debtors Turn (avg days) 35.2 16.6 8.5 7.6 7.7
Creditors Turn (avg days) 61.8 42.9 24.0 15.6 8.0
Inventory Turn (avg days) 0.4 0.2 0.2 0.2 0.2
Asset Turnover (x) 0.5 0.6 0.8 0.8 0.8
Current Ratio (x) 2.7 3.3 5.2 5.7 8.1
Quick Ratio (x) 2.2 2.7 4.4 4.6 6.2
Net Debt/Equity (X) 0.1 0.2 0.1 0.1 0.1
Net Debt/Equity ex MI (X) 0.1 0.2 0.1 0.1 0.1
Capex to Debt (%) (10.8) (41.7) (0.9) (1.1) (1.4)
Z-Score (X) 2.0 3.5 4.0 5.1 7.5
Source: Company, AllianceDBS
Revenue Trend
Asset Breakdown (2014)
-20%
-15%
-10%
-5%
0%
5%
10%
15%
20%
0
100
200
300
400
500
600
700
800
900
2Q
201
2
3Q
201
2
4Q
201
2
1Q
201
3
2Q
201
3
3Q
201
3
4Q
201
3
1Q
201
4
2Q
201
4
3Q
201
4
Revenue Revenue Growth % (QoQ)
Page 22
Company Focus
Magnum
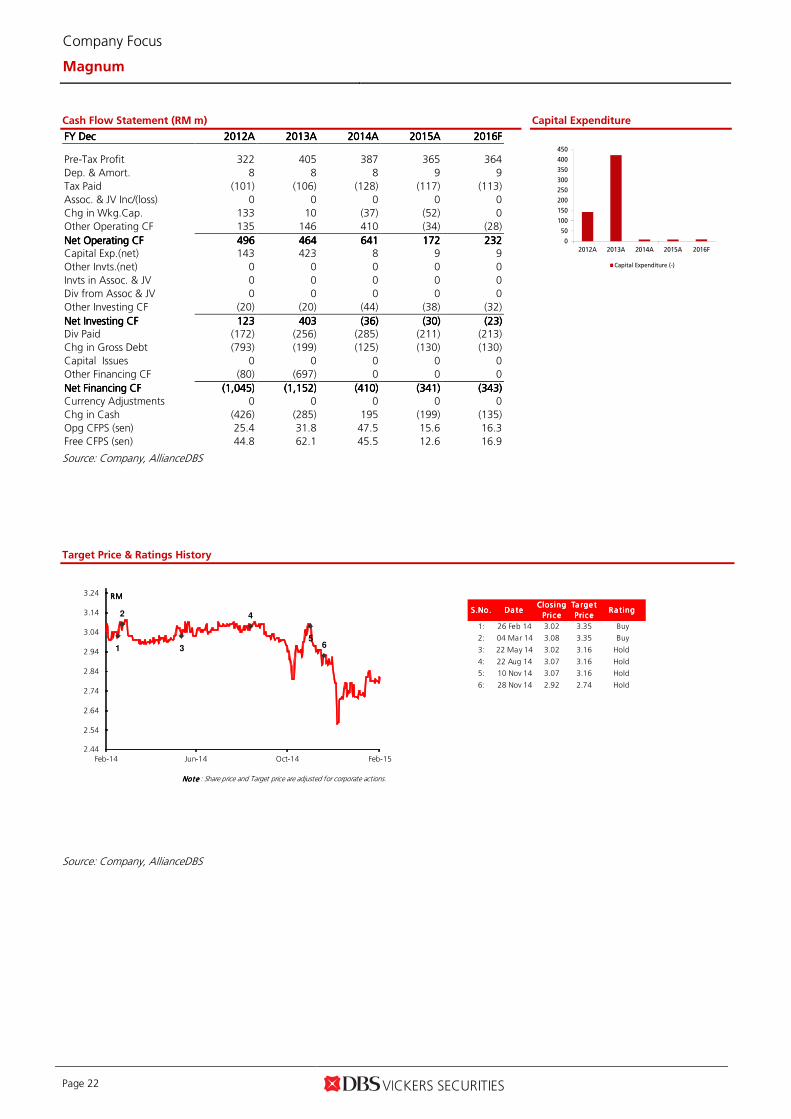
Cash Flow Statement (RM m)
FY FY FY FY DecDecDecDec 2012201220122012AAAA 2013201320132013AAAA 2014201420142014AAAA 2015201520152015AAAA 2016201620162016FFFF
Pre-Tax Profit 322 405 387 365 364
Dep. & Amort. 8 8 8 9 9
Tax Paid (101) (106) (128) (117) (113)
Assoc. & JV Inc/(loss) 0 0 0 0 0
Chg in Wkg.Cap. 133 10 (37) (52) 0
Other Operating CF 135 146 410 (34) (28)
Net Operating CFNet Operating CFNet Operating CFNet Operating CF 496496496496 464464464464 641641641641 172172172172 232232232232 Capital Exp.(net) 143 423 8 9 9
Other Invts.(net) 0 0 0 0 0
Invts in Assoc. & JV 0 0 0 0 0
Div from Assoc & JV 0 0 0 0 0
Other Investing CF (20) (20) (44) (38) (32)
Net Investing CFNet Investing CFNet Investing CFNet Investing CF 123123123123 403403403403 (36)(36)(36)(36) (30)(30)(30)(30) (23)(23)(23)(23) Div Paid (172) (256) (285) (211) (213)
Chg in Gross Debt (793) (199) (125) (130) (130)
Capital Issues 0 0 0 0 0
Other Financing CF (80) (697) 0 0 0
Net Financing CFNet Financing CFNet Financing CFNet Financing CF (1,045)(1,045)(1,045)(1,045) (1,152)(1,152)(1,152)(1,152) (410)(410)(410)(410) (341)(341)(341)(341) (343)(343)(343)(343)
Currency Adjustments 0 0 0 0 0
Chg in Cash (426) (285) 195 (199) (135)
Opg CFPS (sen) 25.4 31.8 47.5 15.6 16.3
Free CFPS (sen) 44.8 62.1 45.5 12.6 16.9
Source: Company, AllianceDBS
Capital Expenditure
Target Price & Ratings History
Source: Company, AllianceDBS
0
50
100
150
200
250
300
350
400
450
2012A 2013A 2014A 2015A 2016F
Capital Expenditure (-)
S.No.S.No.S.No.S.No. Da teDa teDa teDa teClos ing Clos ing Clos ing Clos ing
Pri cePri cePri cePri ce
Ta rge t Ta rge t Ta rge t Ta rge t
Pric ePric ePric ePric eRa ting Ra ting Ra ting Ra ting
1: 26 Feb 14 3.02 3.35 Buy
2: 04 Mar 14 3.08 3.35 Buy
3: 22 May 14 3.02 3.16 Hold
4: 22 Aug 14 3.07 3.16 Hold
5: 10 Nov 14 3.07 3.16 Hold
6: 28 Nov 14 2.92 2.74 Hold
Note Note Note Note : Share price and Target price are adjusted for corporate actions.
1
2
3
4
56
2.44
2.54
2.64
2.74
2.84
2.94
3.04
3.14
3.24
Feb-14 Jun-14 Oct-14 Feb-15
RMRMRMRM
Page 23
Company Focus
Magnum
AllianceDBS Research recommendations are based an Absolute Total Return* Rating system, defined as follows:
STRONG BUYSTRONG BUYSTRONG BUYSTRONG BUY (>20% total return over the next 3 months, with identifiable share price catalysts within this time frame)
BUY BUY BUY BUY (>15% total return over the next 12 months for small caps, >10% for large caps)
HOLDHOLDHOLDHOLD (-10% to +15% total return over the next 12 months for small caps, -10% to +10% for large caps)
FULLY VALUEDFULLY VALUEDFULLY VALUEDFULLY VALUED (negative total return i.e. > -10% over the next 12 months)
SELL SELL SELL SELL (negative total return of > -20% over the next 3 months, with identifiable catalysts within this time frame)
Share price appreciation + dividends GENERAL DISCLOSURE/DISCLAIMER GENERAL DISCLOSURE/DISCLAIMER GENERAL DISCLOSURE/DISCLAIMER GENERAL DISCLOSURE/DISCLAIMER This report is prepared by AllianceDBS Research Sdn Bhd (“ADBSR”) (formerly known as HwangDBS Vickers Research Sdn Bhd), a subsidiary of Alliance Investment Bank Berhad (“AIBB”) and an associate of DBS Vickers Securities Holdings Pte Ltd (“DBSVH”). This report is solely intended for the clients of DBS Bank Ltd and DBS Vickers Securities (Singapore) Pte Ltd, its respective connected and associated corporations and affiliates (collectively, the “DBS Vickers Group”) only and no part of this document may be (i) copied, photocopied or duplicated in any form or by any means or (ii) redistributed without the prior written consent of ADBSR. The research set out in this report is based on information obtained from sources believed to be reliable and ADBSR, its holding company AIBB, their respective connected and associated corporations, affiliates and their respective directors, officers, employees and agents (collectively, the “Alliance Bank Group”) do not make any representation or warranty as to its accuracy, completeness or correctness. Opinions expressed are subject to change without notice. This document is prepared for general circulation. Any recommendation contained in this document does not have regard to the specific investment objectives, financial situation and the particular needs of any specific addressee. This document is for the information of addressees only and is not to be taken in substitution for the exercise of judgement by addressees, who should obtain separate independent legal or financial advice. The Alliance Bank Group accepts no liability whatsoever for any direct, indirect and/or consequential loss (including any claims for loss of profit) arising from any use of and/or reliance upon this document and/or further communication given in relation to this document. This document is not to be construed as an offer or a solicitation of an offer to buy or sell any securities. The Alliance Bank Group, along with its affiliates and/or persons associated with any of them may from time to time have interests in the securities mentioned in this document. The Alliance Bank Group may have positions in, and may effect transactions in securities mentioned herein and may also perform or seek to perform broking, investment banking/corporate advisory and other banking services for these companies. They may also have received compensation and/or seek to obtain compensation for broking, investment banking/corporate advisory and other services from the subject companies. Any valuations, opinions, estimates, forecasts, ratings or risk assessments herein constitutes a judgment as of the date of this report, and there can be no assurance that future results or events will be consistent with any such valuations, opinions, estimates, forecasts, ratings or risk assessments. The information in this document is subject to change without notice, its accuracy is not guaranteed, it may be incomplete or condensed and it may not contain all material information concerning the company (or companies) referred to in this report. The valuations, opinions, estimates, forecasts, ratings or risk assessments described in this report were based upon a number of estimates and assumptions and are inherently subject to significant uncertainties and contingencies. It can be expected that one or more of the estimates on which the valuations, opinions, estimates, forecasts, ratings or risk assessments were based will not materialize or will vary significantly from actual results. Therefore, the inclusion of the valuations, opinions, estimates, forecasts, ratings or risk assessments described herein IS NOT TO BE RELIED UPON as a representation and/or warranty by the Alliance Bank Group (and/or any persons associated with the aforesaid entities), that: (a) such valuations, opinions, estimates, forecasts, ratings or risk assessments or their underlying assumptions will be achieved, and (b) there is any assurance that future results or events will be consistent with any such valuations, opinions, estimates, forecasts, ratings or risk
assessments stated therein.
Any assumptions made in this report that refers to commodities, are for the purposes of making forecasts for the company (or companies) mentioned herein. They are not to be construed as recommendations to trade in the physical commodity or in the futures contract relating to the commodity referred to in this report. DBS Vickers Securities (USA) Inc ("DBSVUSA")"), a U.S.-registered broker-dealer, does not have its own investment banking or research department, nor has it participated in any investment banking transaction as a manager or co-manager in the past twelve months.
ANALYST CERTIFICATIONANALYST CERTIFICATIONANALYST CERTIFICATIONANALYST CERTIFICATION The research analyst primarily responsible for the content of this research report, in part or in whole, certifies that the views about the companies and their securities expressed in this report accurately reflect his/her personal views. The analyst also certifies that no part of his/her compensation was, is, or will be, directly, or indirectly, related to specific recommendations or views expressed in this report. As of the date the report is published, the analyst and his/her spouse and/or relatives who are financially dependent on the analyst, do not hold interests in the securities recommended in this report (“interest” includes direct or indirect ownership of securities).
COMPANYCOMPANYCOMPANYCOMPANY----SPECIFIC / REGULATORY DISCLOSURES SPECIFIC / REGULATORY DISCLOSURES SPECIFIC / REGULATORY DISCLOSURES SPECIFIC / REGULATORY DISCLOSURES
1.1.1.1. DBS Bank Ltd., DBS Vickers Securities (Singapore) Pte Ltd (“DBSVS”), their subsidiaries and/or other affiliates do not have a proprietary position in the securities recommended in this report as of 9 Feb 2015.
2.2.2.2. DBS Bank Ltd., DBSVS, DBSVUSA, their subsidiaries and/or other affiliates may beneficially own a total of 1% of any class of common equity securities of the company mentioned as of 11 Feb 2015.
3.3.3.3.
Compensation for investment banking services:Compensation for investment banking services:Compensation for investment banking services:Compensation for investment banking services:
DBS Bank Ltd., DBSVS, DBSVUSA, their subsidiaries and/or other affiliates may have received compensation, within the past 12 months, and within the next 3 months may receive or intends to seek compensation for investment banking services fromthe
Page 24
Company Focus
Magnum
company mentioned.
DBSVUSA does not have its own investment banking or research department, nor has it participated in any investment banking transaction as a manager or co-manager in the past twelve months. Any US persons wishing to obtain further information, including any clarification on disclosures in this disclaimer, or to effect a transaction in any security discussed in this document should contact DBSVUSA exclusively.
RESTRICTIONS ON DISTRIBUTIONRESTRICTIONS ON DISTRIBUTIONRESTRICTIONS ON DISTRIBUTIONRESTRICTIONS ON DISTRIBUTION
GeneralGeneralGeneralGeneral This report is not directed to, or intended for distribution to or use by, any person or entity who is a citizen or resident of or located in any locality, state, country or other jurisdiction where such distribution, publication, availability or use would be contrary to law or regulation.
AustraliaAustraliaAustraliaAustralia This report is being distributed in Australia by DBS Bank Ltd. (“DBS”) or DBS Vickers Securities (Singapore) Pte Ltd (“DBSVS”), both of which are exempted from the requirement to hold an Australian Financial Services Licence under the Corporation Act 2001 (“CA”) in respect of financial services provided to the recipients. Both DBS and DBSVS are regulated by the Monetary Authority of Singapore under the laws of Singapore, which differ from Australian laws. Distribution of this report is intended only for “wholesale investors” within the meaning of the CA.
Hong KongHong KongHong KongHong Kong This report is being distributed in Hong Kong by DBS Vickers (Hong Kong) Limited which is licensed and regulated by the Hong Kong Securities and Futures Commission.
IndonesiaIndonesiaIndonesiaIndonesia This report is being distributed in Indonesia by PT DBS Vickers Securities Indonesia.
MalaysiaMalaysiaMalaysiaMalaysia This report is distributed in Malaysia by AllianceDBS Research Sdn Bhd ("ADBSR") (formerly known as HwangDBS Vickers Research Sdn Bhd). Recipients of this report, received from ADBSR are to contact the undersigned at 603-2604 3333 in respect of any matters arising from or in connection with this report. In addition to the General Disclosure/Disclaimer found at the preceding page, recipients of this report are advised that ADBSR (the preparer of this report), its holding company Alliance Investment Bank Berhad, their respective connected and associated corporations, affiliates, their directors, officers, employees, agents and parties related or associated with any of them may have positions in, and may effect transactions in the securities mentioned herein and may also perform or seek to perform broking, investment banking/corporate advisory and other services for the subject companies. They may also have received compensation and/or seek to obtain compensation for broking, investment banking/corporate advisory and other services from the subject companies.
Wong Ming Tek, Executive Director, ADBSR
SingaporeSingaporeSingaporeSingapore This report is distributed in Singapore by DBS Bank Ltd (Company Regn. No. 196800306E) or DBSVS (Company Regn No. 198600294G), both of which are Exempt Financial Advisers as defined in the Financial Advisers Act and regulated by the Monetary Authority of Singapore. DBS Bank Ltd and/or DBSVS, may distribute reports produced by its respective foreign entities, affiliates or other foreign research houses pursuant to an arrangement under Regulation 32C of the Financial Advisers Regulations. Where the report is distributed in Singapore to a person who is not an Accredited Investor, Expert Investor or an Institutional Investor, DBS Bank Ltd accepts legal responsibility for the contents of the report to such persons only to the extent required by law. Singapore recipients should contact DBS Bank Ltd at 6327 2288 for matters arising from, or in connection with the report.
ThailandThailandThailandThailand This report is being distributed in Thailand by DBS Vickers Securities (Thailand) Co Ltd. Research reports distributed are only intended for institutional clients only and no other person may act upon it.
United United United United KingdomKingdomKingdomKingdom
This report is being distributed in the UK by DBS Vickers Securities (UK) Ltd, who is an authorised person in the meaning of the Financial Services and Markets Act and is regulated by The Financial Conduct Authority. Research distributed in the UK is intended only for institutional clients.
DubaiDubaiDubaiDubai
This research report is being distributed in The Dubai International Financial Centre (“DIFC”) by DBS Bank Ltd., (DIFC Branch) having its office at PO Box 506538, 3rd Floor, Building 3, East Wing, Gate Precinct, Dubai International Financial Centre (DIFC), Dubai, United Arab Emirates. DBS Bank Ltd., (DIFC Branch) is regulated by The Dubai Financial Services Authority. This research report is intended only for professional clients (as defined in the DFSA rulebook) and no other person may act upon it.
UnitUnitUnitUnited Statesed Statesed Statesed States Neither this report nor any copy hereof may be taken or distributed into the United States or to any U.S. person except in compliance with any applicable U.S. laws and regulations. It is being distributed in the United States by DBSVUSA, which accepts responsibility for its contents. Any U.S. person receiving this report who wishes to effect transactions in any securities referred to herein should contact DBSVUSA directly and not its affiliate.
Other Other Other Other jurisdictionsjurisdictionsjurisdictionsjurisdictions
In any other jurisdictions, except if otherwise restricted by laws or regulations, this report is intended only for qualified, professional, institutional or sophisticated investors as defined in the laws and regulations of such jurisdictions.
AllianceDBS Research Sdn BhdAllianceDBS Research Sdn BhdAllianceDBS Research Sdn BhdAllianceDBS Research Sdn Bhd (128540 U) (formerly known as HwangDBS Vickers Research Sdn Bhd)
19th Floor, Menara Multi-Purpose, Capital Square, 8 Jalan Munshi Abdullah 50100
Kuala Lumpur, Malaysia. Tel.: +603 2604 3333 Fax: +603 2604 3921 email : [email protected]