june 28, 2016 embun pagi - mirae asset sekuritas · embun pagi june 28, 2016 highways and byways...
TRANSCRIPT
Andy Wibowo +62-21-515-1140 [email protected]
To subscribe to our Daily Focus, please contact us at [email protected]
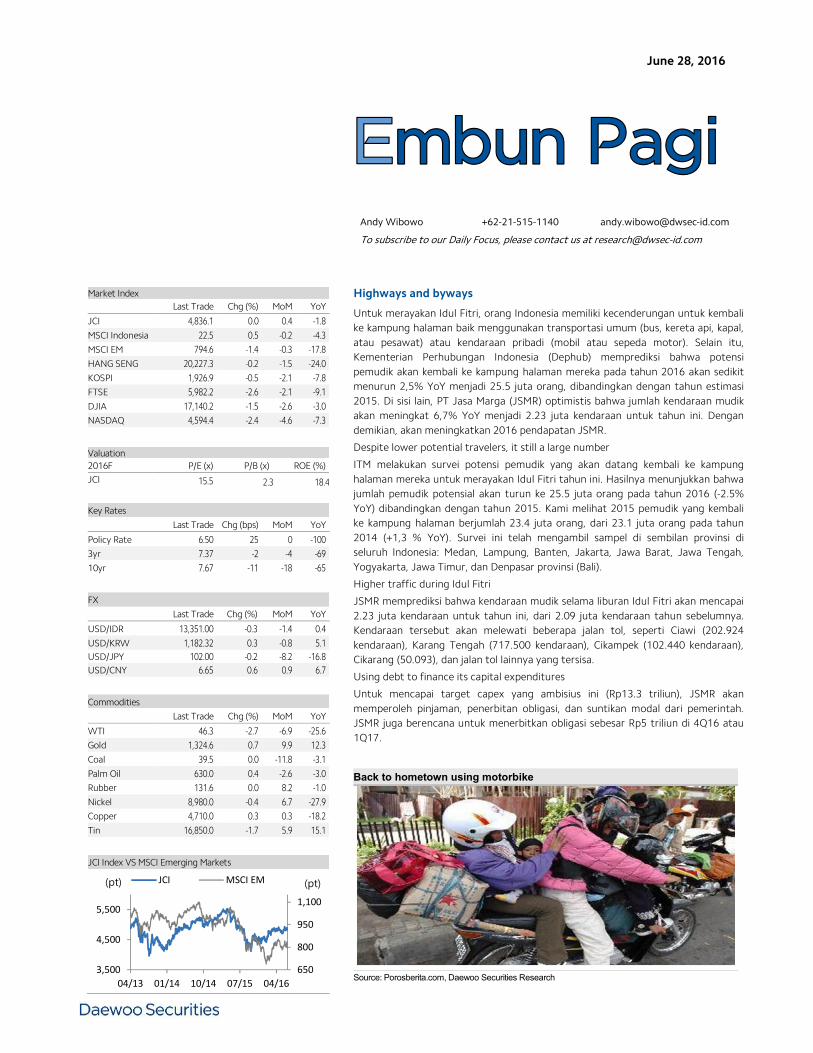
Back to hometown using motorbike
Source: Porosberita.com, Daewoo Securities Research
Embun Pagi
June 28, 2016
Highways and byways
Untuk merayakan Idul Fitri, orang Indonesia memiliki kecenderungan untuk kembalike kampung halaman baik menggunakan transportasi umum (bus, kereta api, kapal,atau pesawat) atau kendaraan pribadi (mobil atau sepeda motor). Selain itu,Kementerian Perhubungan Indonesia (Dephub) memprediksi bahwa potensipemudik akan kembali ke kampung halaman mereka pada tahun 2016 akan sedikitmenurun 2,5% YoY menjadi 25.5 juta orang, dibandingkan dengan tahun estimasi2015. Di sisi lain, PT Jasa Marga (JSMR) optimistis bahwa jumlah kendaraan mudikakan meningkat 6,7% YoY menjadi 2.23 juta kendaraan untuk tahun ini. Dengandemikian, akan meningkatkan 2016 pendapatan JSMR.
Despite lower potential travelers, it still a large number
ITM melakukan survei potensi pemudik yang akan datang kembali ke kampunghalaman mereka untuk merayakan Idul Fitri tahun ini. Hasilnya menunjukkan bahwajumlah pemudik potensial akan turun ke 25.5 juta orang pada tahun 2016 (-2.5%YoY) dibandingkan dengan tahun 2015. Kami melihat 2015 pemudik yang kembalike kampung halaman berjumlah 23.4 juta orang, dari 23.1 juta orang pada tahun2014 (+1,3 % YoY). Survei ini telah mengambil sampel di sembilan provinsi diseluruh Indonesia: Medan, Lampung, Banten, Jakarta, Jawa Barat, Jawa Tengah,Yogyakarta, Jawa Timur, dan Denpasar provinsi (Bali).
Higher traffic during Idul Fitri
JSMR memprediksi bahwa kendaraan mudik selama liburan Idul Fitri akan mencapai2.23 juta kendaraan untuk tahun ini, dari 2.09 juta kendaraan tahun sebelumnya.Kendaraan tersebut akan melewati beberapa jalan tol, seperti Ciawi (202.924kendaraan), Karang Tengah (717.500 kendaraan), Cikampek (102.440 kendaraan),Cikarang (50.093), dan jalan tol lainnya yang tersisa.
Using debt to finance its capital expenditures
Untuk mencapai target capex yang ambisius ini (Rp13.3 triliun), JSMR akanmemperoleh pinjaman, penerbitan obligasi, dan suntikan modal dari pemerintah.JSMR juga berencana untuk menerbitkan obligasi sebesar Rp5 triliun di 4Q16 atau1Q17.
Market IndexLast Trade Chg (%) MoM YoY
JCI 4,836.1 0.0 0.4 -1.8MSCI Indonesia 22.5 0.5 -0.2 -4.3MSCI EM 794.6 -1.4 -0.3 -17.8HANG SENG 20,227.3 -0.2 -1.5 -24.0KOSPI 1,926.9 -0.5 -2.1 -7.8FTSE 5,982.2 -2.6 -2.1 -9.1DJIA 17,140.2 -1.5 -2.6 -3.0NASDAQ 4,594.4 -2.4 -4.6 -7.3
Valuation2016F P/E (x) P/B (x) ROE (%)JCI 15.5 2.3 18.4
Key Rates
Last Trade Chg (bps) MoM YoY
Policy Rate 6.50 25 0 -1003yr 7.37 -2 -4 -6910yr 7.67 -11 -18 -65
FX
Last Trade Chg (%) MoM YoY
USD/IDR 13,351.00 -0.3 -1.4 0.4USD/KRW 1,182.32 0.3 -0.8 5.1USD/JPY 102.00 -0.2 -8.2 -16.8USD/CNY 6.65 0.6 0.9 6.7
Commodities
Last Trade Chg (%) MoM YoY
WTI 46.3 -2.7 -6.9 -25.6Gold 1,324.6 0.7 9.9 12.3Coal 39.5 0.0 -11.8 -3.1Palm Oil 630.0 0.4 -2.6 -3.0Rubber 131.6 0.0 8.2 -1.0Nickel 8,980.0 -0.4 6.7 -27.9Copper 4,710.0 0.3 0.3 -18.2Tin 16,850.0 -1.7 5.9 15.1
JCI Index VS MSCI Emerging Markets
650
800
950
1,100
3,500
4,500
5,500
04/13 01/14 10/14 07/15 04/16
(pt) JCI MSCI EM (pt)
June 28, 2016
2
Embun Pagi
Daewoo Securities Indonesia Research
Local flashes
PWON: Pakuwon incar Rp900 miliar dari proyek baru. PT Pakuwon Jati Tbkmenargetkan pendapatan prapenjualan atau marketing sales sebesar Rp700 miliar--Rp900 miliar dari proyek baru. Ivy Wong, Direktur Business Development Pakuwon,perseroan akan meluncurkan dua proyek perkantoran dan satu apartemen di kuartalIII/2016. Untuk proyek perkantoran, Pakuwon akan merilis menara ketiga di kawasanmultifungsi Kota Kasablanka sedangkan proyek perkantoran lain yang akan diluncurkanberlokasi di Tunjungan City. (Bisnis Indonesia)
DILD: Intiland akan bagikan dividen Rp51,33 miliar. PT Intiland Development Tbkmerencanakan untuk membagikan dividen senilai Rp51,33 miliar atau Rp5 per saham.Nilai dividen yang akan dibagikan kepada para pemegang saham tersebut setara 12,78%dari total perolehan laba bersih yang dibukukan perseroan tahun 2015 sebesarRp401,48 miliar. Para pemegang saham juga menyetujui penggunaan sisa laba bersihperseroan sebesar Rp348,15 miliar sebagai laba ditahan dan Rp2 miliar cadangan wajib.(Bisnis Indonesia)
ADRO: Adaro Energy rancang power plant tenaga surya US$75 juta. Emiten tambangbatu bara PT Adaro Energy Tbk. kembali berekspansi dengan membangun power planttenaga surya dengan investasi hingga US$75 juta. Head of Corporate CommunicationDivision PT Adaro Energy Tbk. Febriati Nadira mengatakan ekspansi pembangkit listriktenaga surya (PLTS) dengan kapasitas 50 Megawatt. Pembangunan PLTS akandilakukan di Kalimantan Selatan, tepatnya di sekitar areal konsesi tambang perseroan.(Bisnis Indonesia)
EMTK: Anak usaha EMTK teken kontrak dengan BlackBerry US$207,5 juta. Anakusaha PT Elang Mahkota Teknologi Tbk., perusahaan milik Keluarga Sariaatmadja,menandatangani perjanjian lisensi konsumen BBM dengan BlackBerry Limited senilaiUS$207,5 juta. Anak usaha yang dimaksud yakni Creative Media Works Pte. Ltd,perseroan terbatas yang terdaftar di Singapura. Creative Media Works merupakan anakusaha yang sepenuhnya dimiliki PT Kreatif Media Karya. PT Elang Mahkota TeknologiTbk. (EMTK) memiliki 99,99% saham dalam Kreatif Media Karya. (Bisnis Indonesia)
BCAP: Bank Capital bantah diakuisisi Bank MNC. PT Bank Capital Indonesia Tbkmembantah kabar akan diakuisisi oleh bank milik pengusaha Hary Tanoe, PT MNC BankInternasional Tbk. Perseroan berencana kembali menerbitkan obligasi subordinasisenilai Rp200 miliar pada semester II 2016 guna meningkatkan rasio permodalan.Wahyu Dwi Aji, Direktur Utama Bank Capital Indonesia mengatakan, tidak ada urgensibagi perusahaannya untuk melepas saham mayoritas Bank Capital ke MNC Group padatahun ini. Ia menegaskan saat ini mayoritas saham Bank Capital masih dikuasasi olehpengusaha asal Solo , Jawa Tengah, Danny Nugroho. (CNN Indonesia)
BMRI: Bank Mandiri catatkan KKB tumbuh 9,9%. PT Bank Mandiri Tbk mencatatkanKredit Kendaraan Bermotor (KKB) tumbuh 9,9% hingga Mei 2016. Direktur Ritel BankMandiri Tardi mengatakan, KKB yang dikucurkan melalui anak usahanya Mandiri TunasFinance (MTF) telah membukukan new disbursement sekitar Rp 1,3 triliun hingga Rp1,5 triliun per bulan. Hal ini dikarenakan fokus MTF dalam menjual kendaraan khususpenumpang. (Kontan)
June 28, 2016
3
Embun Pagi
Daewoo Securities Indonesia Research
Technical analysisTasrul +62-21-515-1140 [email protected]
Jakarta Composite Index (JCI) – Consolidation
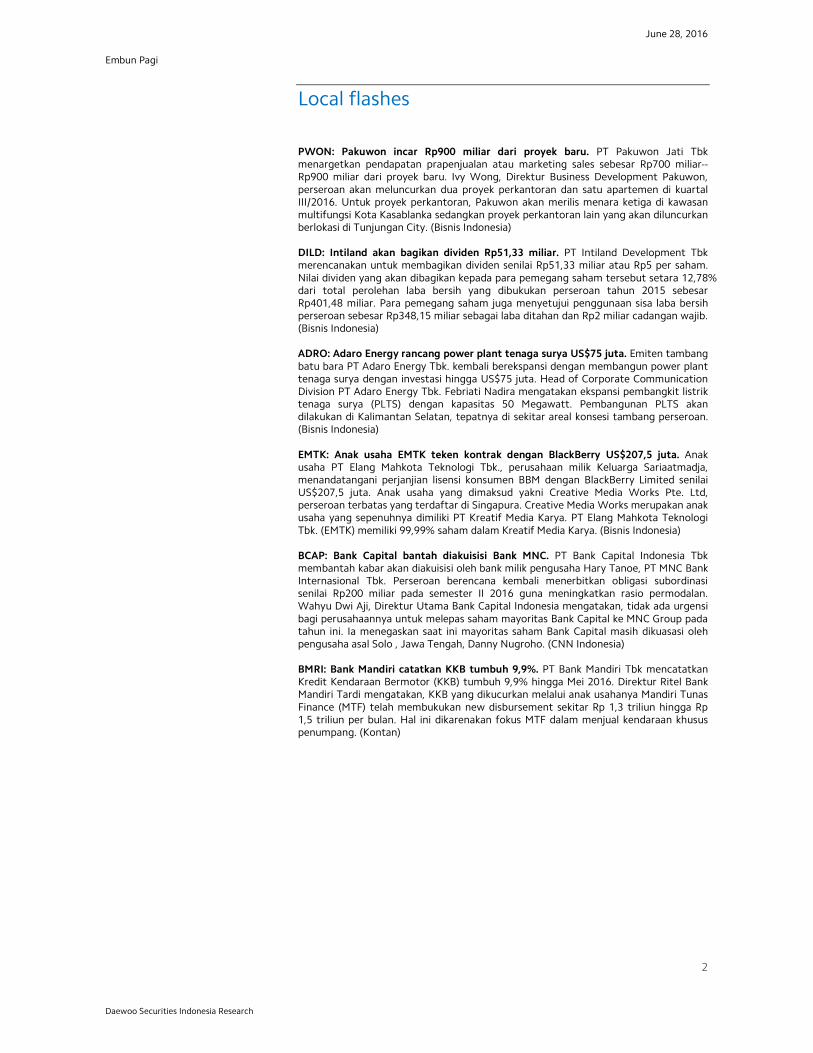
IHSG akan coba bertahan diatas lower band pada uptrend channel.
IHSG saat masih dalam pola uptrend yang relatif valid yang dimulai sejak selama 209hari terakhir dengan r-squared = 0.7631 dan bergerak dalam rentang +/- 1.18 std.deviasidari center line. Peluang IHSG bergerak di luar pergerakan normalnya sekitar 23.69 %atau sekitar 50 bar chart. Volatilitas normal pergerakan IHSG saat ini sebesar +/-0.62%atau sekitar +/-29.95 point. Saat ini IHSG akan coba bertahan diatas lower band padauptrend channel atau sekitar level 4,811 sebagaimana terlihat pada Figure 1.
SummaryItem Data Item Data
Close (June 27, 2016) 4,836(0.0%)Trading range 4,791-4,866Average index performance (%) 4.06TargetPeriod 210 - Daily 4,850r-squared 0.7631 - Weekly 4,901Volatility (+/-, %) 0.62 - Monthly 4,923Volatility (+/-, point) 29.95Stop loss 4,759Source: Daewoo Securities Indonesia Research
Figure 1. Daily trend - Uptrend
Source: Daewoo Securities Indonesia Research
Created with AmiBroker - advanced charting and technical analysis software. http://www.amibroker.com
Optimization Trading System - ©2010 - Powered by AMTA Optimization Trading System - ©2010 - Powered by AMTA Optimization Trading System - ©2010 - Powered by AMTA
4,791
4,866
JKSE-Daily6/27/2016Open4804.05, Hi 4846.42, Lo4795.96, Close 4836.05(0.0%)UpperBand=5,035.56, Channel_prd=4,923.10, Lower Band=4,810.65, UpperBand=5,159.54, Channel_prd
4,836.05 4,833.11 4,810.65
4,686.67
4,923.1 4,923.1
5,035.56
5,159.54
Sep Oct Nov Dec 2016 Feb Mar Apr May Jun Optimization Trading System - ©2010 - Powered by AMTA
JKSE-Volume =3,876,379,392.00, Avg.Volume =5,018,157,056.00
3,876,379,392
5,018,157,056
June 28, 2016
4
Embun Pagi
Daewoo Securities Indonesia Research
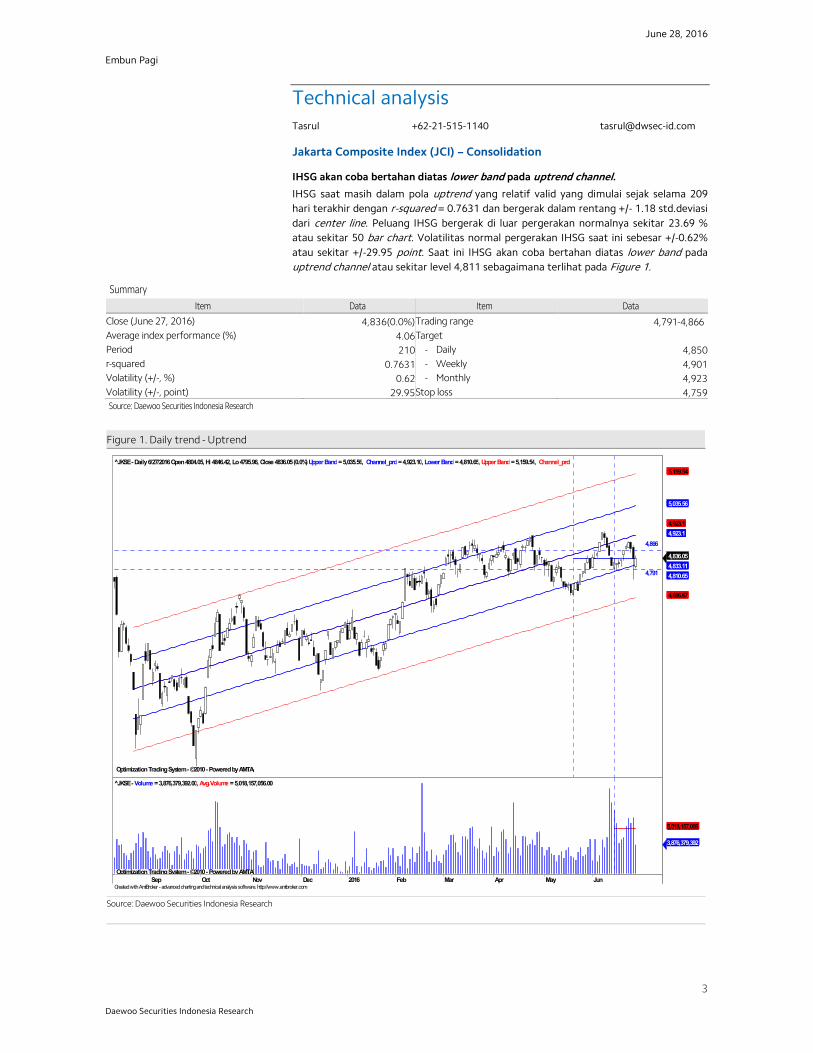
Aliran dana keluar dan trend turun volatilitas indeks masih terlihat.
Pada Figure 2, terlihat dari hasil optimalisasi terakhir, indikator MFI Optimized danindikator W%R Optimized saat ini akan menguji support trendline dengan volumetembus rata-rata. Hal ini mengindikasikan masih terlihatnya potensi koreksi lebih lanjut.Resistance terdekat di 4,866 dan support di 4,811 Stop loss level di 4,791.
Figure 2. Daily MFI optimized & W%R optimized,
Source: Daewoo Securities Indonesia Research
Created with AmiBroker - advanced charting and technical analysis software. http://www.amibroker.com
JKSE-MFI Smoothed=41.36
41.3625
JKSE-Will%RSmoothed=-38.21
-38.2077
Optimization Trading System - ©2010 Optimization Trading System - ©2010
4,866
4,791
JKSE-Daily6/27/2016Open4804.05, Hi 4846.42, Lo4795.96, Close 4836.05(0.0%)VWAP=4,843.13, VWAP=4,759.07
4,836.05
4,759.07
4,843.13
Nov Dec 2016 Feb Mar Apr May Jun Optimization Trading System - ©2010
JKSE-Volume =3,876,379,392.00, Avg.Volume =4,882,282,496.00
3,876,379,392
4,882,282,496
June 28, 2016
5
Embun Pagi
Daewoo Securities Indonesia Research
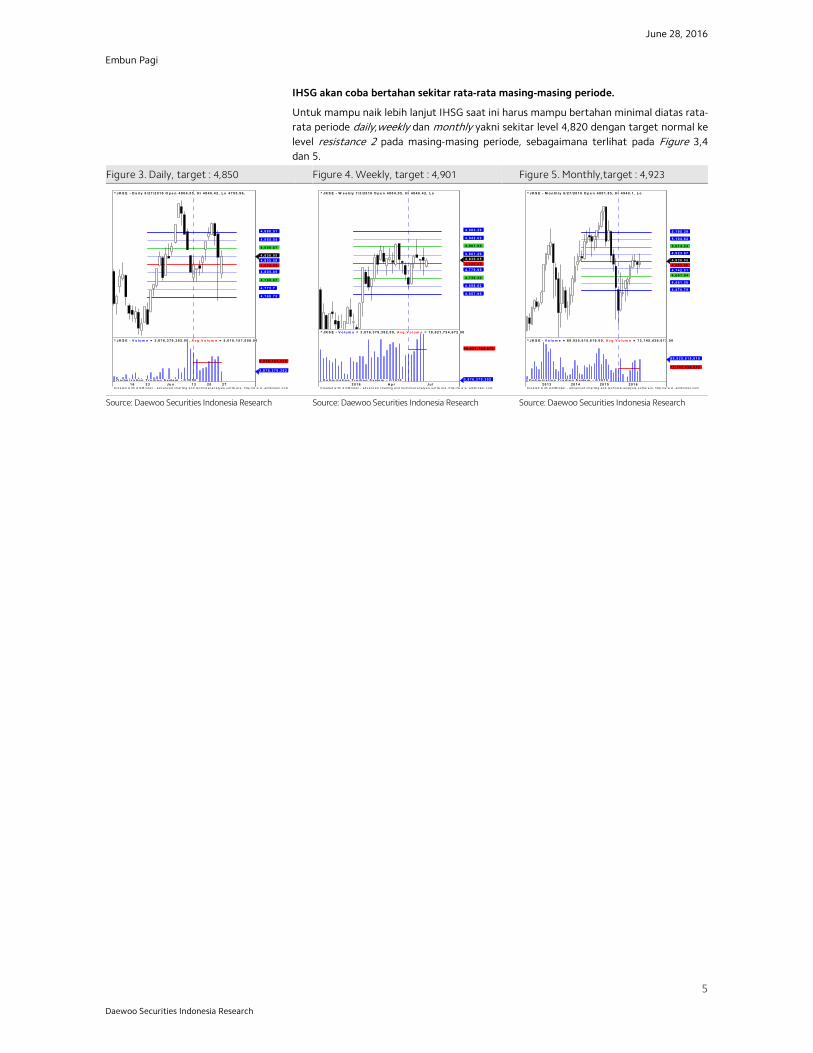
IHSG akan coba bertahan sekitar rata-rata masing-masing periode.
Untuk mampu naik lebih lanjut IHSG saat ini harus mampu bertahan minimal diatas rata-rata periode daily,weekly dan monthly yakni sekitar level 4,820 dengan target normal kelevel resistance 2 pada masing-masing periode, sebagaimana terlihat pada Figure 3,4dan 5.
Figure 3. Daily, target : 4,850 Figure 4. Weekly, target : 4,901 Figure 5. Monthly,target : 4,923
x
Source: Daewoo Securities Indonesia Research Source: Daewoo Securities Indonesia Research Source: Daewoo Securities Indonesia Research
C r e a te d w ith A m iB r o ke r - a d v a n c e d c h a r t in g a n d te c h n ic a l a n a ly s is s o f tw a r e . h ttp :/ /w w w .a m ib r o ke r .c o m
^ J K S E - D a i l y 6 / 2 7 / 2 0 1 6 O p e n 4 8 0 4 . 0 5 , H i 4 8 4 6 . 4 2 , L o 4 7 9 5 . 9 6 ,
4 , 8 3 6 . 0 5 4 , 8 3 5 . 5 9 4 , 8 2 0 . 6 2
4 , 8 0 5 . 6 5
4 , 7 9 0 . 6 7
4 , 7 7 5 . 7
4 , 7 6 0 . 7 3
4 , 8 5 0 . 5 7
4 , 8 6 5 . 5 4
4 , 8 8 0 . 5 1
1 6 2 3 3 0 J u n 1 3 2 0 2 7 O p ti m i z a ti o n T ra d i n g S y ste m - © 2 0 1 0
^ J K S E - V o l u m e = 3 , 8 7 6 , 3 7 9 , 3 9 2 . 0 0 , A v g . V o l u m e = 5 , 0 1 8 , 1 5 7 , 0 5 6 . 0 0
3 , 8 7 6 , 3 7 9 , 3 9 2
5 , 0 1 8 , 1 5 7 , 0 5 6
Cr e a te d w ith A m iB r o ke r - a d v a n c e d c h a r t in g a n d te c h n ic a l a n a ly s is s o f tw a r e . h ttp ://w w w .a m ib r o ke r .c o m
^ J K S E - W e e k ly 7 /3 /2 0 1 6 O p e n 4 8 0 4 .0 5 , H i 4 8 4 6 .4 2 , L o
4 ,8 3 6 .0 5 4 ,8 2 0 .6 2
4 ,7 7 9 .9 5
4 ,7 3 9 .2 9
4 ,6 9 8 .6 2
4 ,6 5 7 .9 5
4 ,8 6 1 .2 9
4 ,9 0 1 .9 5
4 ,9 4 2 .6 2
4 ,9 8 3 .2 9
2 0 1 6 A p r J u l O p tim iz a tio n T ra d in g S y ste m - © 2 0 1 0
^ J K S E - V o lu m e = 3 ,8 7 6 ,3 7 9 ,3 9 2 .0 0 , A v g .V o lu m e = 1 8 ,6 2 1 ,7 2 4 ,6 7 2 .0 0
3 ,8 7 6 ,3 7 9 ,3 9 2
1 8 ,6 2 1 ,7 2 4 ,6 7 2
Cr e a te d w ith A m iB r o ke r - a d v a n c e d c h a r t in g a n d te c h n ic a l a n a ly s is s o f tw a r e . h ttp ://w w w .a m ib r o ke r .c o m
^ J K S E - M o n th ly 6 /2 7 /2 0 1 6 O p e n 4 8 0 1 .8 5 , H i 4 9 4 0 .1 , L o
4 ,8 3 6 .0 5 4 ,8 3 3 .0 9 4 ,7 4 2 .5 1 4 ,6 5 1 .9 4
4 ,5 6 1 .3 6
4 ,4 7 0 .7 9
4 ,9 2 3 .6 7
5 ,0 1 4 .2 4
5 ,1 0 4 .8 2
5 ,1 9 5 .3 9
2 0 1 3 2 0 1 4 2 0 1 5 2 0 1 6 O p tim iz a tio n T ra d in g S y ste m - © 2 0 1 0
^ J K S E - V o lu m e = 8 9 ,9 2 5 ,6 1 5 ,6 1 6 .0 0 , A v g .V o lu m e = 7 2 ,1 4 5 ,4 3 6 ,6 7 2 .0 0
8 9 ,9 2 5 ,6 1 5 ,6 1 6
7 2 ,1 4 5 ,4 3 6 ,6 7 2
June 28, 2016
6
Embun Pagi
Daewoo Securities Indonesia Research
Stocks on our focus listSummarecon Agung (SMRA) – Trading Buy
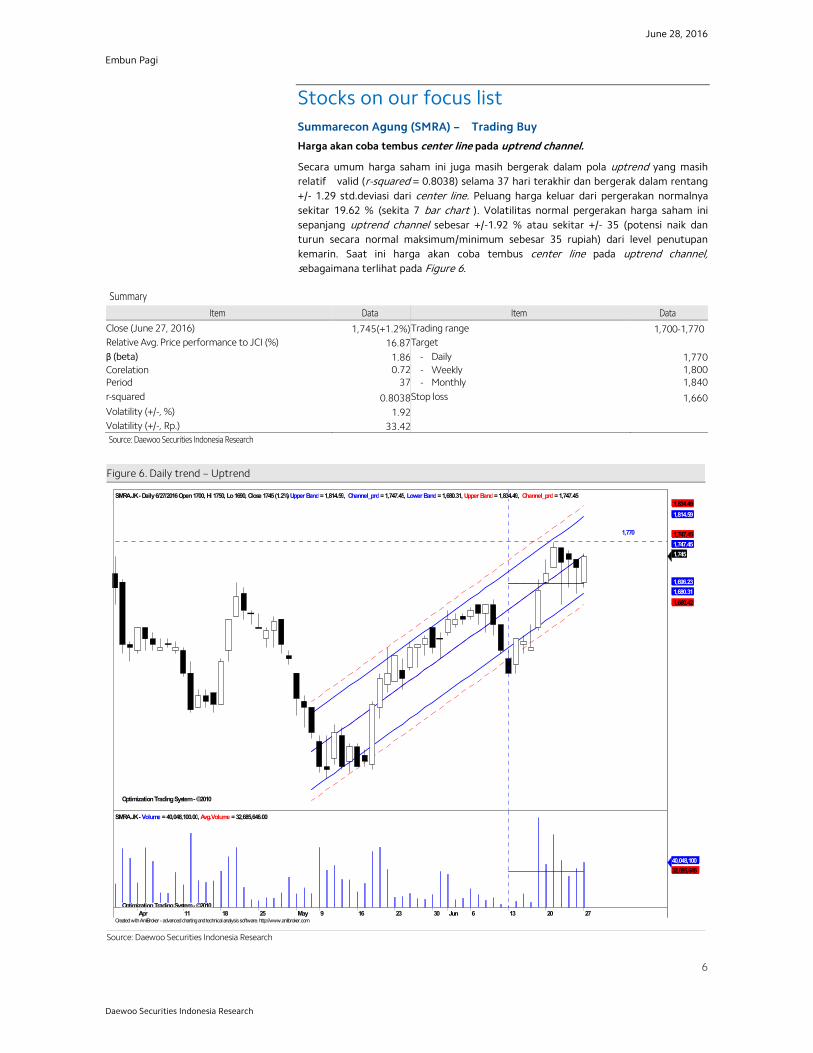
Harga akan coba tembus center line pada uptrend channel.
Secara umum harga saham ini juga masih bergerak dalam pola uptrend yang masihrelatif valid (r-squared = 0.8038) selama 37 hari terakhir dan bergerak dalam rentang+/- 1.29 std.deviasi dari center line. Peluang harga keluar dari pergerakan normalnyasekitar 19.62 % (sekita 7 bar chart ). Volatilitas normal pergerakan harga saham inisepanjang uptrend channel sebesar +/-1.92 % atau sekitar +/- 35 (potensi naik danturun secara normal maksimum/minimum sebesar 35 rupiah) dari level penutupankemarin. Saat ini harga akan coba tembus center line pada uptrend channel,sebagaimana terlihat pada Figure 6.
SummaryItem Data Item Data
Close (June 27, 2016) 1,745(+1.2%)Trading range 1,700-1,770Relative Avg. Price performance to JCI (%) 16.87Targetβ (beta) 1.86 - Daily 1,770Corelation 0.72 - Weekly 1,800Period 37 - Monthly 1,840r-squared 0.8038Stop loss 1,660Volatility (+/-, %) 1.92Volatility (+/-, Rp.) 33.42Source: Daewoo Securities Indonesia Research
Figure 6. Daily trend – Uptrend
Source: Daewoo Securities Indonesia Research
Created with AmiBroker - advanced charting and technical analysis software. http://www.amibroker.com
Optimization Trading System - ©2010 Optimization Trading System - ©2010 Optimization Trading System - ©2010
1,770
SMRA.JK-Daily6/27/2016Open1700, Hi 1750, Lo1690, Close 1745(1.2%)Upper Band=1,814.59, Channel_prd=1,747.45, Lower Band=1,680.31, Upper Band=1,834.49, Channel_prd=1,747.45
1,745
1,696.23 1,680.31 1,660.42
1,747.45 1,747.45
1,814.59 1,834.49
Apr 11 18 25 May 9 16 23 30 Jun 6 13 20 27 Optimization Trading System - ©2010
SMRA.JK-Volume =40,048,100.00, Avg.Volume =32,685,646.00
40,048,10032,685,646
June 28, 2016
7
Embun Pagi
Daewoo Securities Indonesia Research
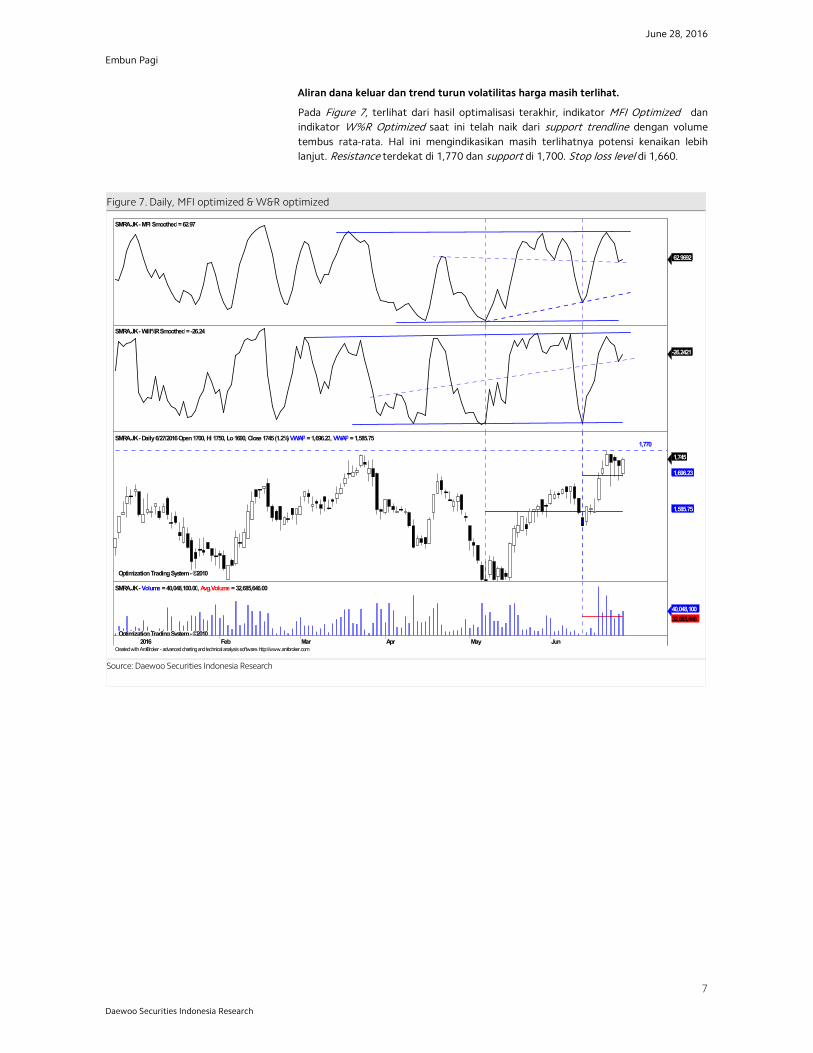
Aliran dana keluar dan trend turun volatilitas harga masih terlihat.
Pada Figure 7, terlihat dari hasil optimalisasi terakhir, indikator MFI Optimized danindikator W%R Optimized saat ini telah naik dari support trendline dengan volumetembus rata-rata. Hal ini mengindikasikan masih terlihatnya potensi kenaikan lebihlanjut. Resistance terdekat di 1,770 dan support di 1,700. Stop loss level di 1,660.
Figure 7. Daily, MFI optimized & W&R optimized
Source: Daewoo Securities Indonesia Research
Created with AmiBroker - advanced charting and technical analysis software. http://www.amibroker.com
SMRA.JK- MFI Smoothed=62.97
62.9692
SMRA.JK- Will%RSmoothed=-26.24
-26.2421
Optimization Trading System - ©2010 Optimization Trading System - ©2010
1,770SMRA.JK- Daily6/27/2016Open1700, Hi 1750, Lo1690, Close 1745(1.2%)VWAP=1,696.23, VWAP=1,585.75
1,745
1,696.23
1,585.75
2016 Feb Mar Apr May Jun Optimization Trading System - ©2010
SMRA.JK- Volume =40,048,100.00, Avg.Volume =32,685,646.00
40,048,10032,685,646
June 28, 2016
8
Embun Pagi
Daewoo Securities Indonesia Research
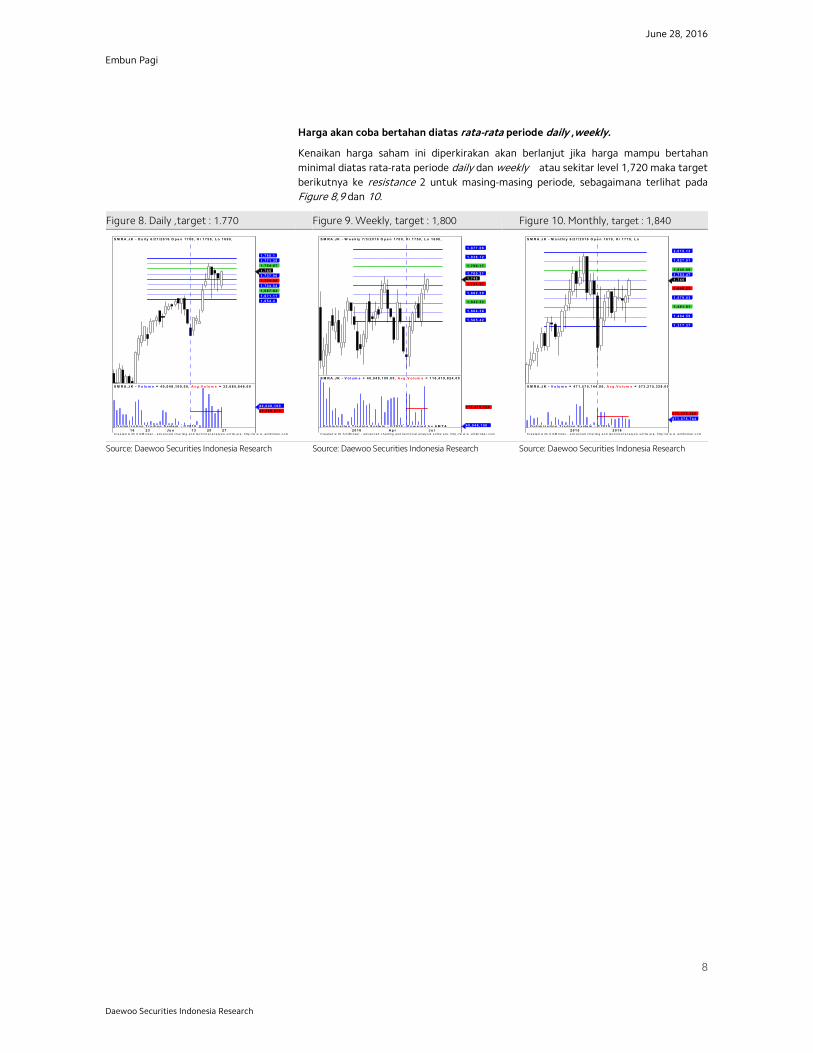
Harga akan coba bertahan diatas rata-rata periode daily ,weekly.
Kenaikan harga saham ini diperkirakan akan berlanjut jika harga mampu bertahanminimal diatas rata-rata periode daily dan weekly atau sekitar level 1,720 maka targetberikutnya ke resistance 2 untuk masing-masing periode, sebagaimana terlihat padaFigure 8,9 dan 10.
Figure 8. Daily ,target : 1.770 Figure 9. Weekly, target : 1,800 Figure 10. Monthly, target : 1,840
Source: Daewoo Securities Indonesia Research Source: Daewoo Securities Indonesia Research Source: Daewoo Securities Indonesia Research
C r e a te d w ith A m iB r o ke r - a d v a n c e d c h a r t in g a n d te c h n ic a l a n a ly s is s o f tw a r e . h ttp :/ /w w w .a m ib r o ke r .c o m
S M R A . J K - D a i l y 6 / 2 7 / 2 0 1 6 O p e n 1 7 0 0 , H i 1 7 5 0 , L o 1 6 9 0 ,
1 , 7 4 5 1 , 7 3 7 . 9 6 1 , 7 2 1 . 2 5 1 , 7 0 4 . 5 4 1 , 6 8 7 . 8 3 1 , 6 7 1 . 1 1 1 , 6 5 4 . 4
1 , 7 5 4 . 6 7 1 , 7 7 1 . 3 9 1 , 7 8 8 . 1
1 6 2 3 3 0 J u n 1 3 2 0 2 7 O p ti m i z a ti o n T ra d i n g S y ste m - © 2 0 1 0
S M R A . J K - V o l u m e = 4 0 , 0 4 8 , 1 0 0 . 0 0 , A v g . V o l u m e = 3 2 , 6 8 5 , 6 4 6 . 0 0
4 0 , 0 4 8 , 1 0 03 2 , 6 8 5 , 6 4 6
C r e a te d w ith A m iB r o ke r - a d v a n c e d c h a r t in g a n d te c h n ic a l a n a ly s is s o f tw a r e . h ttp :/ /w w w .a m ib r o ke r .c o m
S M R A . J K - W e e k l y 7 / 3 / 2 0 1 6 O p e n 1 7 0 0 , H i 1 7 5 0 , L o 1 6 9 0 ,
1 , 7 4 5 1 , 7 2 1 . 2 5
1 , 6 8 2 . 2 9
1 , 6 4 3 . 3 3
1 , 6 0 4 . 3 8
1 , 5 6 5 . 4 2
1 , 7 6 0 . 2 1
1 , 7 9 9 . 1 7
1 , 8 3 8 . 1 2
1 , 8 7 7 . 0 8
2 0 1 6 A p r J u l O p ti m i z a ti o n T ra d i n g S y ste m - © 2 0 1 0 - P o w e re d b y A M T A
S M R A . J K - V o l u m e = 4 0 , 0 4 8 , 1 0 0 . 0 0 , A v g . V o l u m e = 1 1 6 , 4 1 9 , 8 2 4 . 0 0
4 0 , 0 4 8 , 1 0 0
1 1 6 , 4 1 9 , 8 2 4
C r e a te d w ith A m iB r o ke r - a d v a n c e d c h a r t in g a n d te c h n ic a l a n a ly s is s o f tw a r e . h ttp :/ /w w w .a m ib r o ke r .c o m
S M R A . J K - M o n th l y 6 / 2 7 / 2 0 1 6 O p e n 1 6 1 0 , H i 1 7 7 0 , L o
1 , 7 4 5
1 , 6 6 6 . 2 5
1 , 5 7 9 . 0 3
1 , 4 9 1 . 8 1
1 , 4 0 4 . 5 9
1 , 3 1 7 . 3 7
1 , 7 5 3 . 4 7 1 , 8 4 0 . 6 9
1 , 9 2 7 . 9 1
2 , 0 1 5 . 1 3
2 0 1 5 2 0 1 6 O p ti m i z a ti o n T ra d i n g S y ste m - © 2 0 1 0
S M R A . J K - V o l u m e = 4 7 1 , 5 7 5 , 7 4 4 . 0 0 , A v g . V o l u m e = 5 7 3 , 2 7 5 , 3 2 8 . 0 0
4 7 1 , 5 7 5 , 7 4 45 7 3 , 2 7 5 , 3 2 8
June 28, 2016
9
Embun Pagi
Daewoo Securities Indonesia Research
Pembangunan Perumahan (PTPP)-Buy on Weakness
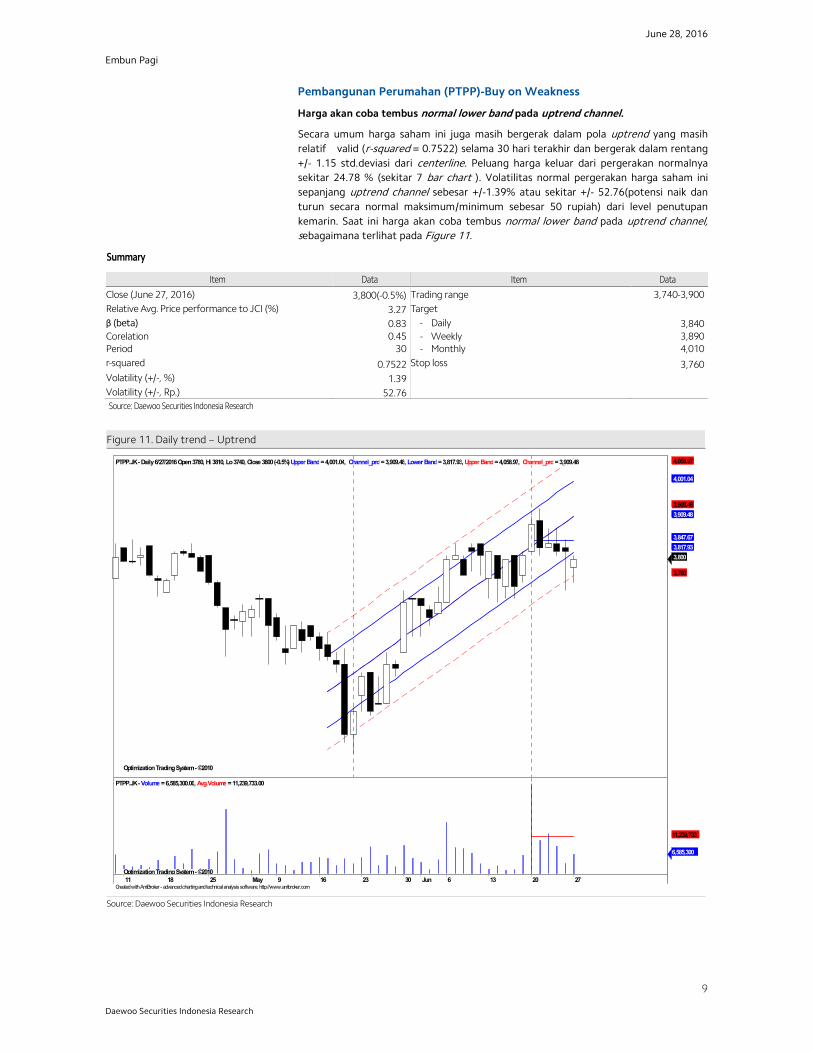
Harga akan coba tembus normal lower band pada uptrend channel.
Secara umum harga saham ini juga masih bergerak dalam pola uptrend yang masihrelatif valid (r-squared = 0.7522) selama 30 hari terakhir dan bergerak dalam rentang+/- 1.15 std.deviasi dari centerline. Peluang harga keluar dari pergerakan normalnyasekitar 24.78 % (sekitar 7 bar chart ). Volatilitas normal pergerakan harga saham inisepanjang uptrend channel sebesar +/-1.39% atau sekitar +/- 52.76(potensi naik danturun secara normal maksimum/minimum sebesar 50 rupiah) dari level penutupankemarin. Saat ini harga akan coba tembus normal lower band pada uptrend channel,sebagaimana terlihat pada Figure 11.
Summary
Item Data Item Data
Close (June 27, 2016) 3,800(-0.5%) Trading range 3,740-3,900Relative Avg. Price performance to JCI (%) 3.27 Targetβ (beta) 0.83 - Daily 3,840Corelation 0.45 - Weekly 3,890Period 30 - Monthly 4,010r-squared 0.7522 Stop loss 3,760Volatility (+/-, %) 1.39Volatility (+/-, Rp.) 52.76Source: Daewoo Securities Indonesia Research
Figure 11. Daily trend – Uptrend
Source: Daewoo Securities Indonesia Research
Created with AmiBroker - advanced charting and technical analysis software. http://www.amibroker.com
Optimization Trading System - ©2010 Optimization Trading System - ©2010 Optimization Trading System - ©2010
PTPP.JK-Daily6/27/2016Open3780, Hi 3810, Lo3740, Close 3800(-0.5%)Upper Band=4,001.04, Channel_prd=3,909.48, Lower Band=3,817.93, Upper Band=4,058.97, Channel_prd=3,909.48
3,800
3,760
3,817.93 3,847.67
3,909.48 3,909.48
4,001.04
4,058.97
11 18 25 May 9 16 23 30 Jun 6 13 20 27 Optimization Trading System - ©2010
PTPP.JK-Volume =6,585,300.00, Avg.Volume =11,239,733.00
6,585,300
11,239,733
June 28, 2016
10
Embun Pagi
Daewoo Securities Indonesia Research
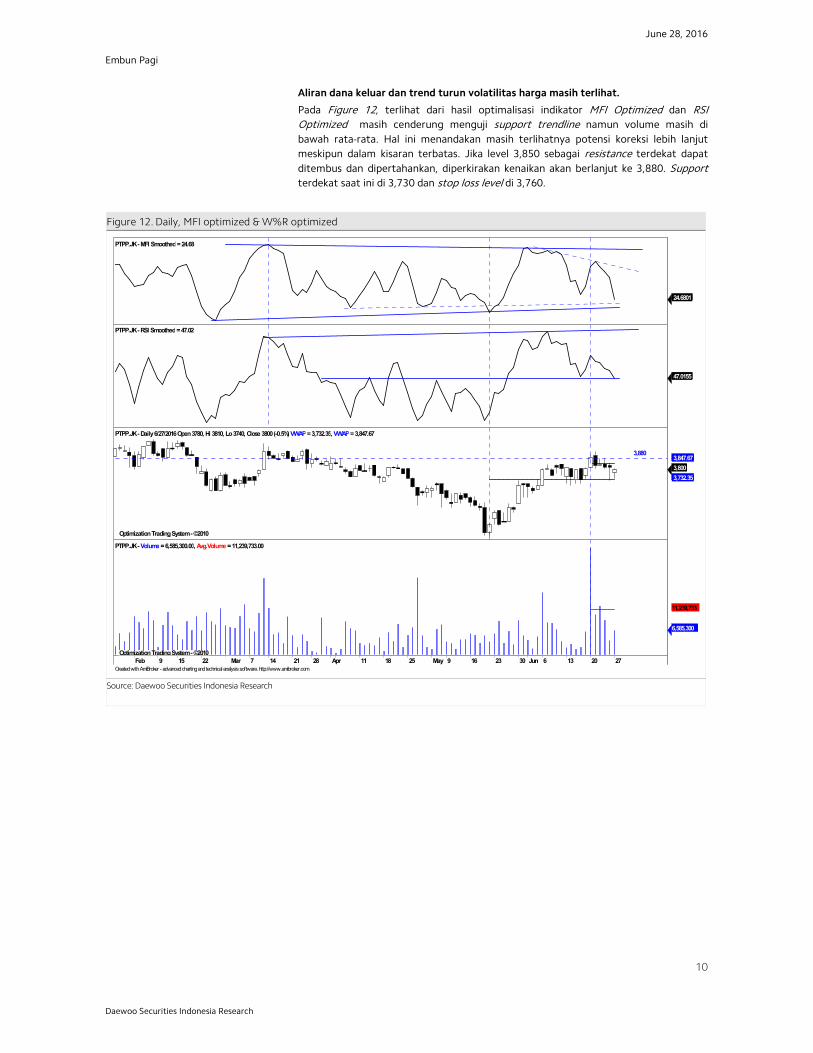
Aliran dana keluar dan trend turun volatilitas harga masih terlihat.
Pada Figure 12, terlihat dari hasil optimalisasi indikator MFI Optimized dan RSIOptimized masih cenderung menguji support trendline namun volume masih dibawah rata-rata. Hal ini menandakan masih terlihatnya potensi koreksi lebih lanjutmeskipun dalam kisaran terbatas. Jika level 3,850 sebagai resistance terdekat dapatditembus dan dipertahankan, diperkirakan kenaikan akan berlanjut ke 3,880. Supportterdekat saat ini di 3,730 dan stop loss level di 3,760.
Figure 12. Daily, MFI optimized & W%R optimized
Source: Daewoo Securities Indonesia Research
Created with AmiBroker - advanced charting and technical analysis software. http://www.amibroker.com
PTPP.JK- MFI Smoothed=24.68
24.6801
PTPP.JK- RSI Smoothed=47.02
47.0155
Optimization Trading System - ©2010 Optimization Trading System - ©2010
3,880
PTPP.JK- Daily6/27/2016Open3780, Hi 3810, Lo3740, Close 3800(-0.5%)VWAP=3,732.35, VWAP=3,847.67
3,800 3,732.35
3,847.67
Feb 9 15 22 29Mar 7 14 21 28 Apr 11 18 25 May 9 16 23 30 Jun 6 13 20 27 Optimization Trading System - ©2010
PTPP.JK- Volume =6,585,300.00, Avg.Volume =11,239,733.00
6,585,300
11,239,733
June 28, 2016
11
Embun Pagi
Daewoo Securities Indonesia Research
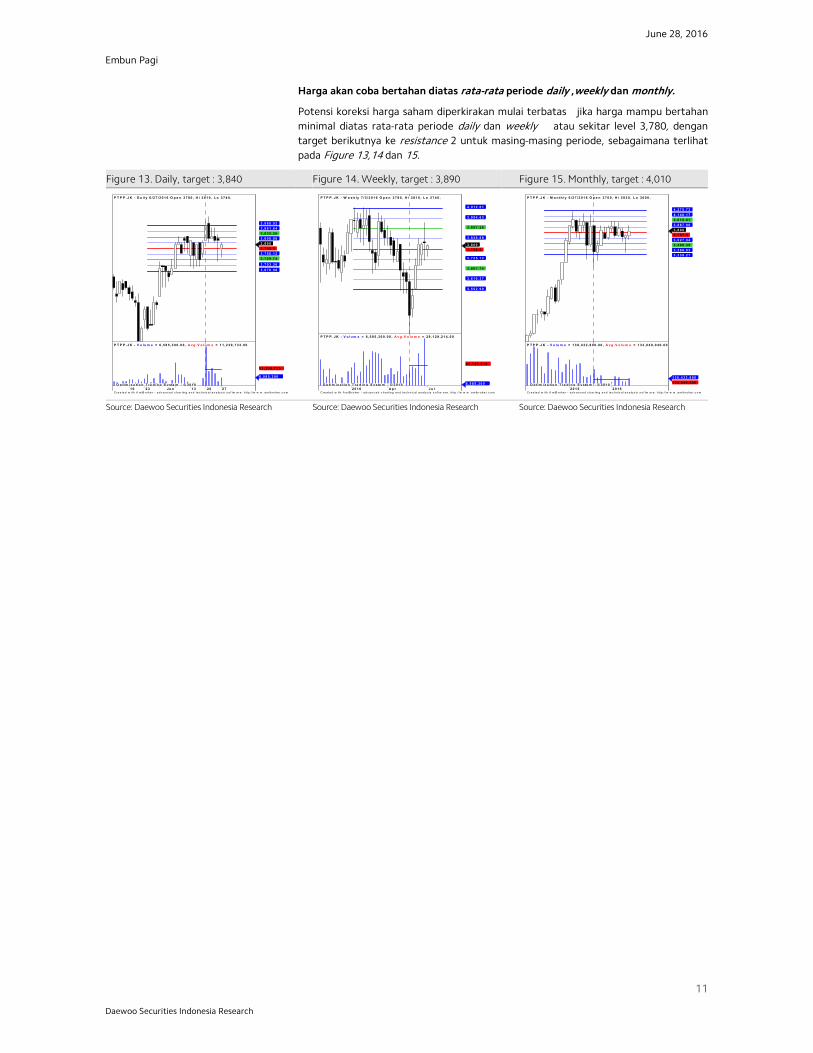
Harga akan coba bertahan diatas rata-rata periode daily ,weekly dan monthly.
Potensi koreksi harga saham diperkirakan mulai terbatas jika harga mampu bertahanminimal diatas rata-rata periode daily dan weekly atau sekitar level 3,780, dengantarget berikutnya ke resistance 2 untuk masing-masing periode, sebagaimana terlihatpada Figure 13,14 dan 15.
Figure 13. Daily, target : 3,840 Figure 14. Weekly, target : 3,890 Figure 15. Monthly, target : 4,010
Source: Daewoo Securities Indonesia Research Source: Daewoo Securities Indonesia Research Source: Daewoo Securities Indonesia Research
C r e a te d w ith A m iB r o ke r - a d v a n c e d c h a r t in g a n d te c h n ic a l a n a ly s is s o f tw a r e . h ttp :/ /w w w .a m ib r o ke r .c o m
P T P P . J K - D a i l y 6 / 2 7 / 2 0 1 6 O p e n 3 7 8 0 , H i 3 8 1 0 , L o 3 7 4 0 ,
3 , 8 0 0 3 , 7 8 2 . 5 3 , 7 5 6 . 1 2 3 , 7 2 9 . 7 4
3 , 7 0 3 . 3 6 3 , 6 7 6 . 9 8
3 , 8 0 8 . 8 8 3 , 8 3 5 . 2 6 3 , 8 6 1 . 6 4 3 , 8 8 8 . 0 2
1 6 2 3 3 0 J u n 1 3 2 0 2 7 O p ti m i z a ti o n T ra d i n g S y ste m - © 2 0 1 0
P T P P . J K - V o l u m e = 6 , 5 8 5 , 3 0 0 . 0 0 , A v g . V o l u m e = 1 1 , 2 3 9 , 7 3 3 . 0 0
6 , 5 8 5 , 3 0 0
1 1 , 2 3 9 , 7 3 3
C r e a te d w ith A m iB r o ke r - a d v a n c e d c h a r t in g a n d te c h n ic a l a n a ly s is s o f tw a r e . h ttp :/ /w w w .a m ib r o ke r .c o m
P T P P . J K - W e e k l y 7 / 3 / 2 0 1 6 O p e n 3 7 8 0 , H i 3 8 1 0 , L o 3 7 4 0 ,
3 , 8 0 0 3 , 7 8 2 . 5
3 , 7 2 5 . 1 2
3 , 6 6 7 . 7 4
3 , 6 1 0 . 3 7
3 , 5 5 2 . 9 9
3 , 8 3 9 . 8 8
3 , 8 9 7 . 2 6
3 , 9 5 4 . 6 3
4 , 0 1 2 . 0 1
2 0 1 6 A p r J u l O p ti m i z a ti o n T ra d i n g S y ste m - © 2 0 1 0
P T P P . J K - V o l u m e = 6 , 5 8 5 , 3 0 0 . 0 0 , A v g . V o l u m e = 2 9 , 1 2 9 , 2 1 4 . 0 0
6 , 5 8 5 , 3 0 0
2 9 , 1 2 9 , 2 1 4
C r e a te d w ith A m iB r o ke r - a d v a n c e d c h a r t in g a n d te c h n ic a l a n a ly s is s o f tw a r e . h ttp :/ /w w w .a m ib r o ke r .c o m
P T P P . J K - M o n th l y 6 / 2 7 / 2 0 1 6 O p e n 3 7 0 0 , H i 3 9 3 0 , L o 3 6 0 0 ,
3 , 8 0 0 3 , 7 5 7 . 5 3 , 6 2 7 . 9 4 3 , 4 9 8 . 3 9 3 , 3 6 8 . 8 3 3 , 2 3 9 . 2 7
3 , 8 8 7 . 0 6 4 , 0 1 6 . 6 1 4 , 1 4 6 . 1 7 4 , 2 7 5 . 7 3
2 0 1 5 2 0 1 6 O p ti m i z a ti o n T ra d i n g S y ste m - © 2 0 1 0
P T P P . J K - V o l u m e = 1 3 8 , 4 3 2 , 8 0 0 . 0 0 , A v g . V o l u m e = 1 3 3 , 0 4 9 , 0 4 0 . 0 0
1 3 8 , 4 3 2 , 8 0 01 3 3 , 0 4 9 , 0 4 0
June 28, 2016
12
Embun Pagi
Daewoo Securities Indonesia Research
Tambang Batubara Bukit Asam (PTBA)–Buy on Weakness
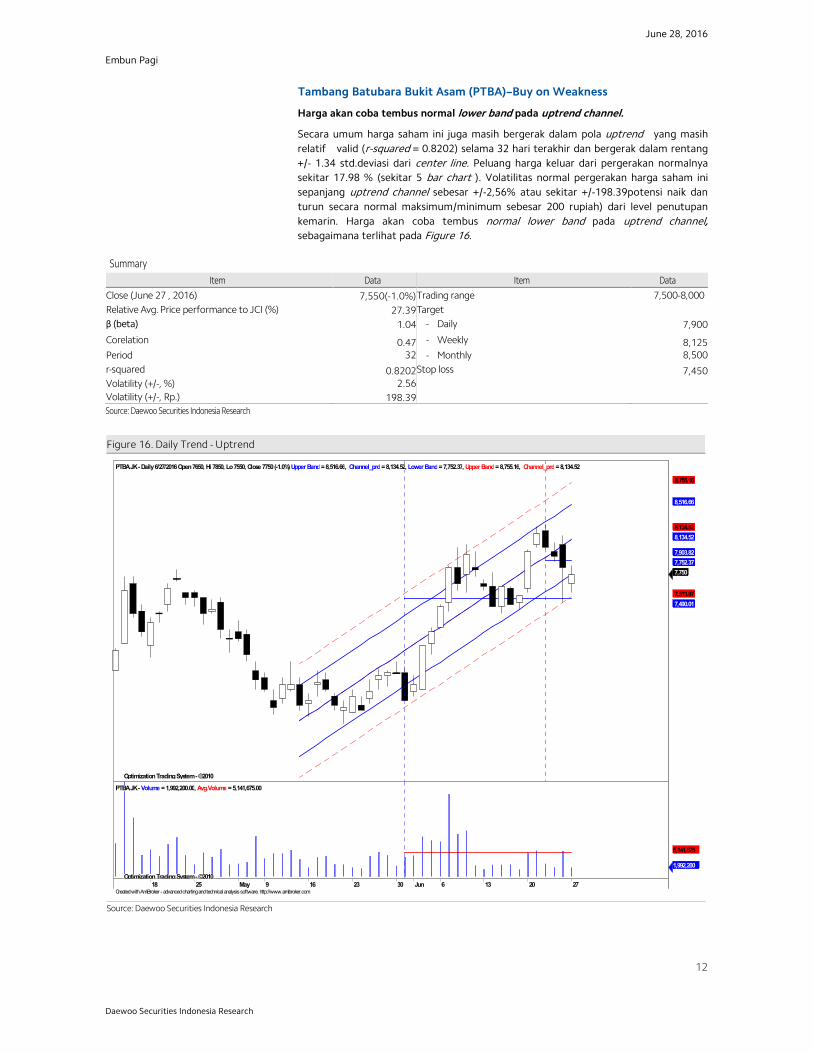
Harga akan coba tembus normal lower band pada uptrend channel.
Secara umum harga saham ini juga masih bergerak dalam pola uptrend yang masihrelatif valid (r-squared = 0.8202) selama 32 hari terakhir dan bergerak dalam rentang+/- 1.34 std.deviasi dari center line. Peluang harga keluar dari pergerakan normalnyasekitar 17.98 % (sekitar 5 bar chart ). Volatilitas normal pergerakan harga saham inisepanjang uptrend channel sebesar +/-2,56% atau sekitar +/-198.39potensi naik danturun secara normal maksimum/minimum sebesar 200 rupiah) dari level penutupankemarin. Harga akan coba tembus normal lower band pada uptrend channel,sebagaimana terlihat pada Figure 16.
SummaryItem Data Item Data
Close (June 27 , 2016) 7,550(-1.0%)Trading range 7,500-8,000Relative Avg. Price performance to JCI (%) 27.39Targetβ (beta) 1.04 - Daily 7,900
Corelation 0.47 - Weekly 8,125Period 32 - Monthly 8,500r-squared 0.8202Stop loss 7,450Volatility (+/-, %) 2.56Volatility (+/-, Rp.) 198.39Source: Daewoo Securities Indonesia Research
Figure 16. Daily Trend - Uptrend
Source: Daewoo Securities Indonesia Research
Created with AmiBroker - advanced charting and technical analysis software. http://www.amibroker.com
Optimization Trading System - ©2010 Optimization Trading System - ©2010 Optimization Trading System - ©2010 Optimization Trading System - ©2010
PTBA.JK- Daily6/27/2016Open7650, Hi 7850, Lo7550, Close 7750(-1.0%)Upper Band=8,516.66, Channel_prd=8,134.52, Lower Band=7,752.37, Upper Band=8,755.16, Channel_prd=8,134.52
7,750
7,513.87 7,490.01
7,752.37 7,903.82
8,134.52 8,134.52
8,516.66
8,755.16
18 25 May 9 16 23 30 Jun 6 13 20 27 Optimization Trading System - ©2010
PTBA.JK- Volume =1,992,200.00, Avg.Volume =5,141,675.00
1,992,200
5,141,675
June 28, 2016
13
Embun Pagi
Daewoo Securities Indonesia Research
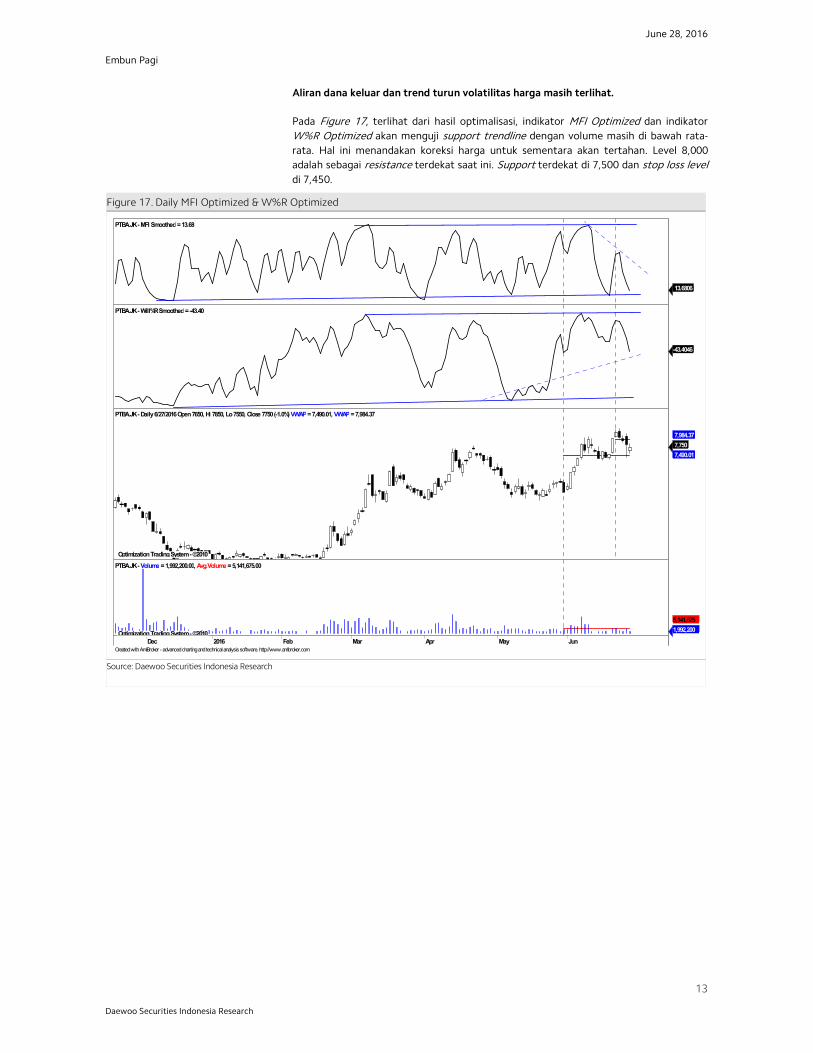
Aliran dana keluar dan trend turun volatilitas harga masih terlihat.
Pada Figure 17, terlihat dari hasil optimalisasi, indikator MFI Optimized dan indikatorW%R Optimized akan menguji support trendline dengan volume masih di bawah rata-rata. Hal ini menandakan koreksi harga untuk sementara akan tertahan. Level 8,000adalah sebagai resistance terdekat saat ini. Support terdekat di 7,500 dan stop loss leveldi 7,450.
Figure 17. Daily MFI Optimized & W%R Optimized
Source: Daewoo Securities Indonesia Research
Created with AmiBroker - advanced charting and technical analysis software. http://www.amibroker.com
PTBA.JK- MFI Smoothed=13.68
13.6806
PTBA.JK- Will%RSmoothed=-43.40
-43.4046
Optimization Trading System - ©2010 Optimization Trading System - ©2010
PTBA.JK- Daily6/27/2016Open7650, Hi 7850, Lo7550, Close 7750(-1.0%)VWAP=7,490.01, VWAP=7,984.37
7,750 7,490.01
7,984.37
Dec 2016 Feb Mar Apr May Jun Optimization Trading System - ©2010
PTBA.JK- Volume =1,992,200.00, Avg.Volume =5,141,675.00
1,992,2005,141,675
June 28, 2016
14
Embun Pagi
Daewoo Securities Indonesia Research
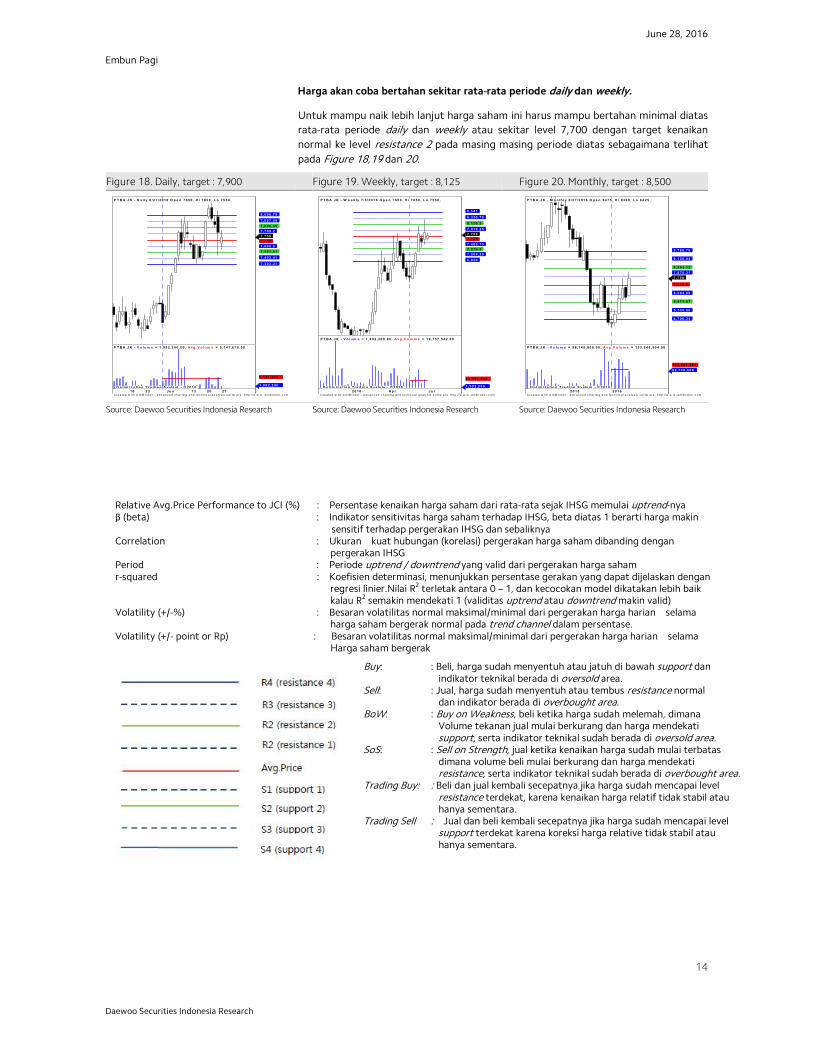
Harga akan coba bertahan sekitar rata-rata periode daily dan weekly.
Untuk mampu naik lebih lanjut harga saham ini harus mampu bertahan minimal diatasrata-rata periode daily dan weekly atau sekitar level 7,700 dengan target kenaikannormal ke level resistance 2 pada masing masing periode diatas sebagaimana terlihatpada Figure 18,19 dan 20.
Figure 18. Daily, target : 7,900 Figure 19. Weekly, target : 8,125 Figure 20. Monthly, target : 8,500
Source: Daewoo Securities Indonesia Research Source: Daewoo Securities Indonesia Research Source: Daewoo Securities Indonesia Research
analyzed by : Tasrul, [email protected], +62-21- 5151140
Relative Avg.Price Performance to JCI (%) : Persentase kenaikan harga saham dari rata-rata sejak IHSG memulai uptrend-nyaβ (beta) : Indikator sensitivitas harga saham terhadap IHSG, beta diatas 1 berarti harga makin
sensitif terhadap pergerakan IHSG dan sebaliknyaCorrelation : Ukuran kuat hubungan (korelasi) pergerakan harga saham dibanding dengan
pergerakan IHSGPeriod : Periode uptrend / downtrend yang valid dari pergerakan harga sahamr-squared : Koefisien determinasi, menunjukkan persentase gerakan yang dapat dijelaskan dengan
regresi linier.Nilai R2 terletak antara 0 – 1, dan kecocokan model dikatakan lebih baikkalau R2 semakin mendekati 1 (validitas uptrend atau downtrend makin valid)
Volatility (+/-%) : Besaran volatilitas normal maksimal/minimal dari pergerakan harga harian selamaharga saham bergerak normal pada trend channel dalam persentase.
Volatility (+/- point or Rp) : Besaran volatilitas normal maksimal/minimal dari pergerakan harga harian selamaHarga saham bergerak
Buy: : Beli, harga sudah menyentuh atau jatuh di bawah support danindikator teknikal berada di oversold area.
Sell: : Jual, harga sudah menyentuh atau tembus resistance normaldan indikator berada di overbought area.
BoW: : Buy on Weakness, beli ketika harga sudah melemah, dimanaVolume tekanan jual mulai berkurang dan harga mendekatisupport, serta indikator teknikal sudah berada di oversold area.
SoS: : Sell on Strength, jual ketika kenaikan harga sudah mulai terbatasdimana volume beli mulai berkurang dan harga mendekatiresistance, serta indikator teknikal sudah berada di overbought area.
Trading Buy: : Beli dan jual kembali secepatnya jika harga sudah mencapai levelresistance terdekat, karena kenaikan harga relatif tidak stabil atauhanya sementara.
Trading Sell : Jual dan beli kembali secepatnya jika harga sudah mencapai levelsupport terdekat karena koreksi harga relative tidak stabil atauhanya sementara.
C r e a te d w ith A m iB r o ke r - a d v a n c e d c h a r t in g a n d te c h n ic a l a n a ly s is s o f tw a r e . h ttp :/ /w w w .a m ib r o ke r .c o m
P T B A . J K - D a i l y 6 / 2 7 / 2 0 1 6 O p e n 7 6 5 0 , H i 7 8 5 0 , L o 7 5 5 0 ,
7 , 7 5 0 7 , 7 0 0 7 , 6 0 0 . 8 7 , 5 0 1 . 6 1
7 , 4 0 2 . 4 1
7 , 3 0 3 . 2 1
7 , 7 9 9 . 2 7 , 8 9 8 . 3 9 7 , 9 9 7 . 5 9
8 , 0 9 6 . 7 9
1 6 2 3 3 0 J u n 1 3 2 0 2 7 O p ti m i z a ti o n T ra d i n g S y ste m - © 2 0 1 0
P T B A . J K - V o l u m e = 1 , 9 9 2 , 2 0 0 . 0 0 , A v g . V o l u m e = 5 , 1 4 1 , 6 7 5 . 0 0
1 , 9 9 2 , 2 0 0
5 , 1 4 1 , 6 7 5
C r e a te d w ith A m iB r o ke r - a d v a n c e d c h a r t in g a n d te c h n ic a l a n a ly s is s o f tw a r e . h ttp :/ /w w w .a m ib r o ke r .c o m
P T B A . J K - W e e k l y 7 / 3 / 2 0 1 6 O p e n 7 6 5 0 , H i 7 8 5 0 , L o 7 5 5 0 ,
7 , 7 5 0 7 , 7 0 0 7 , 4 8 9 . 7 5 7 , 2 7 9 . 5 7 , 0 6 9 . 2 5
6 , 8 5 9
7 , 9 1 0 . 2 5
8 , 1 2 0 . 5
8 , 3 3 0 . 7 5
8 , 5 4 1
2 0 1 6 A p r J u l O p ti m i z a ti o n T ra d i n g S y ste m - © 2 0 1 0
P T B A . J K - V o l u m e = 1 , 9 9 2 , 2 0 0 . 0 0 , A v g . V o l u m e = 1 9 , 7 5 7 , 5 4 2 . 0 0
1 , 9 9 2 , 2 0 0
1 9 , 7 5 7 , 5 4 2
C r e a te d w ith A m iB r o ke r - a d v a n c e d c h a r t in g a n d te c h n ic a l a n a ly s is s o f tw a r e . h ttp :/ /w w w .a m ib r o ke r .c o m
P T B A . J K - M o n th l y 6 / 2 7 / 2 0 1 6 O p e n 6 4 7 5 , H i 8 3 0 0 , L o 6 4 2 5 ,
7 , 7 5 0
7 , 2 3 7 . 5
6 , 6 0 4 . 6 9
5 , 9 7 1 . 8 7
5 , 3 3 9 . 0 6
4 , 7 0 6 . 2 4
7 , 8 7 0 . 3 1 8 , 5 0 3 . 1 3
9 , 1 3 5 . 9 4
9 , 7 6 8 . 7 6
2 0 1 5 2 0 1 6 O p ti m i z a ti o n T ra d i n g S y ste m - © 2 0 1 0
P T B A . J K - V o l u m e = 9 8 , 7 4 5 , 6 0 8 . 0 0 , A v g . V o l u m e = 1 0 3 , 8 4 6 , 5 0 4 . 0 0
9 8 , 7 4 5 , 6 0 81 0 3 , 8 4 6 , 5 0 4
June 28, 2016
15
Embun Pagi
Daewoo Securities Indonesia Research
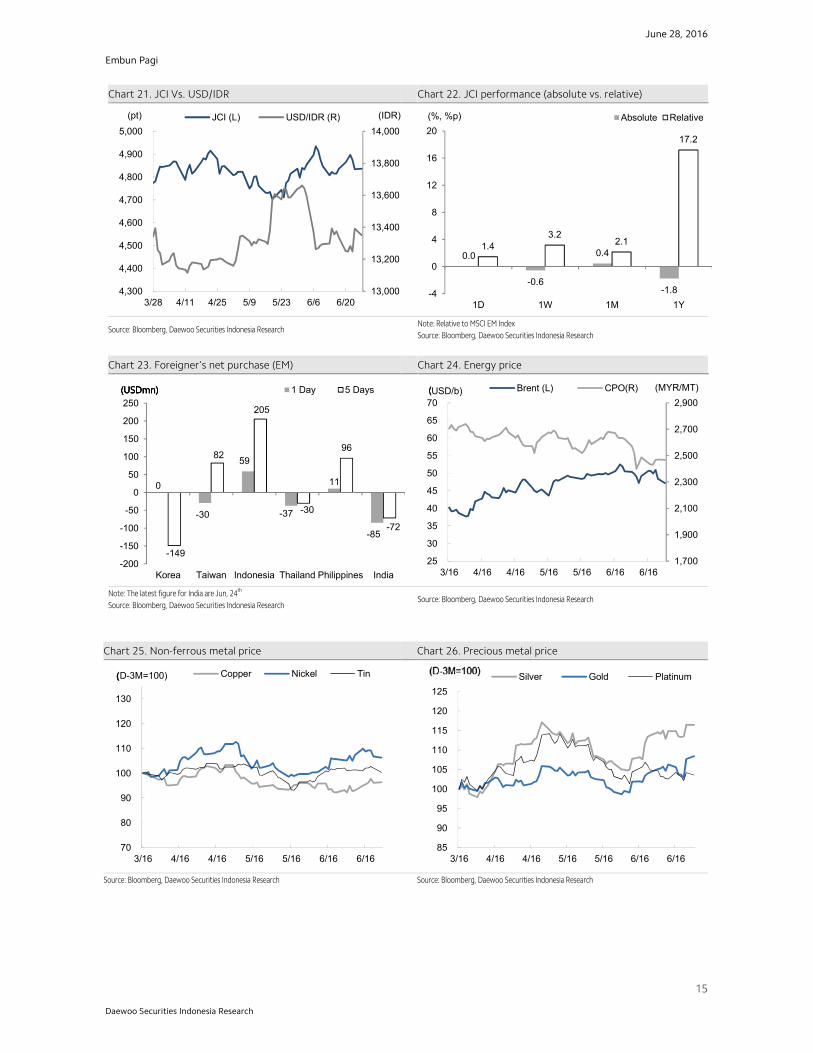
Chart 21. JCI Vs. USD/IDR Chart 22. JCI performance (absolute vs. relative)
Source: Bloomberg, Daewoo Securities Indonesia ResearchNote: Relative to MSCI EM IndexSource: Bloomberg, Daewoo Securities Indonesia Research
Chart 23. Foreigner’s net purchase (EM) Chart 24. Energy price
Note: The latest figure for India are Jun, 24th
Source: Bloomberg, Daewoo Securities Indonesia ResearchSource: Bloomberg, Daewoo Securities Indonesia Research
Chart 25. Non-ferrous metal price Chart 26. Precious metal price
Source: Bloomberg, Daewoo Securities Indonesia Research Source: Bloomberg, Daewoo Securities Indonesia Research
13,000
13,200
13,400
13,600
13,800
14,000
4,300
4,400
4,500
4,600
4,700
4,800
4,900
5,000
3/28 4/11 4/25 5/9 5/23 6/6 6/20
(IDR)(pt) JCI (L) USD/IDR (R)
0.0
-0.6
0.4
-1.8
1.43.2
2.1
17.2
-4
0
4
8
12
16
20
1D 1W 1M 1Y
Absolute Relative(%, %p)
0
-30
59
-37
11
-85
-149
82
205
-30
96
-72
-200
-150
-100
-50
0
50
100
150
200
250
Korea Taiwan Indonesia Thailand Philippines India
1 Day 5 Days(USDmn)(USDmn)(USDmn)(USDmn)
1,700
1,900
2,100
2,300
2,500
2,700
2,900
25
30
35
40
45
50
55
60
65
70
3/16 4/16 4/16 5/16 5/16 6/16 6/16
Brent (L) CPO(R) (MYR/MT)(((USD/b)
70
80
90
100
110
120
130
3/16 4/16 4/16 5/16 5/16 6/16 6/16
(D-3M=100) Copper Nickel Tin((
85
90
95
100
105
110
115
120
125
3/16 4/16 4/16 5/16 5/16 6/16 6/16
Silver Gold Platinum
June 28, 2016
16
Embun Pagi
Daewoo Securities Indonesia Research
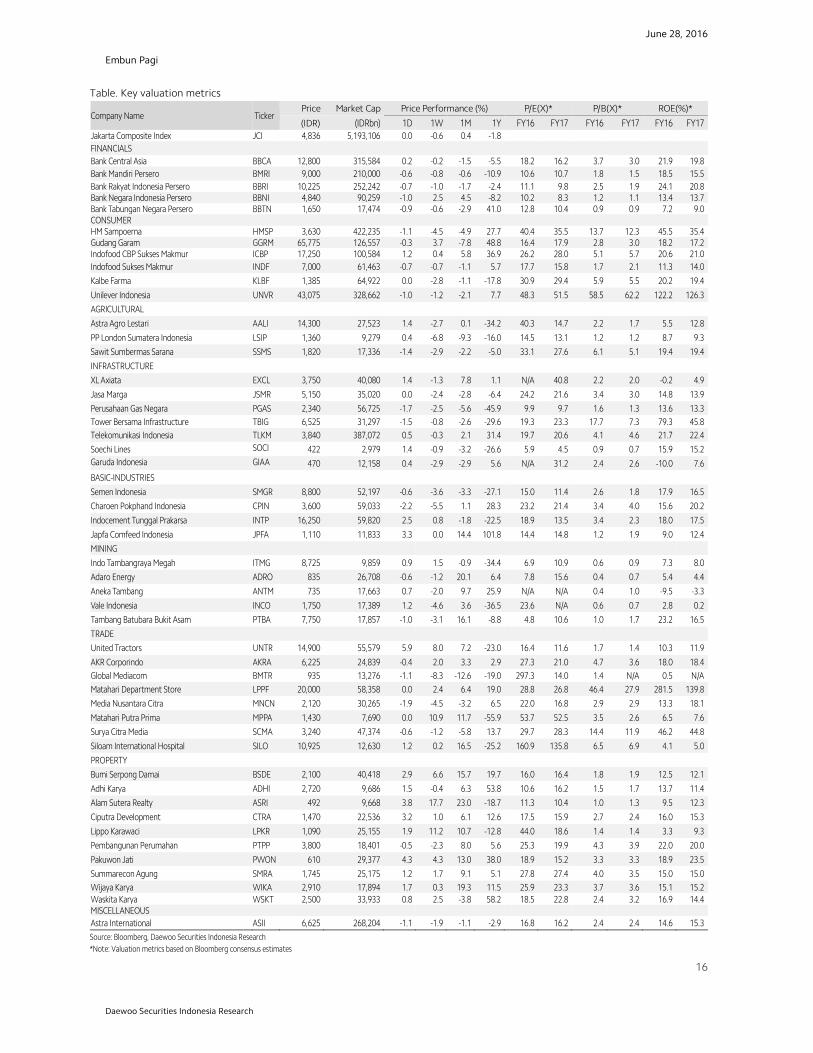
Table. Key valuation metrics
Company Name TickerPrice Market Cap Price Performance (%) P/E(X)* P/B(X)* ROE(%)*
(IDR) (IDRbn) 1D 1W 1M 1Y FY16 FY17 FY16 FY17 FY16 FY17Jakarta Composite Index JCI 4,836 5,193,106 0.0 -0.6 0.4 -1.8FINANCIALSBank Central Asia BBCA 12,800 315,584 0.2 -0.2 -1.5 -5.5 18.2 16.2 3.7 3.0 21.9 19.8Bank Mandiri Persero BMRI 9,000 210,000 -0.6 -0.8 -0.6 -10.9 10.6 10.7 1.8 1.5 18.5 15.5Bank Rakyat Indonesia Persero BBRI 10,225 252,242 -0.7 -1.0 -1.7 -2.4 11.1 9.8 2.5 1.9 24.1 20.8Bank Negara Indonesia Persero BBNI 4,840 90,259 -1.0 2.5 4.5 -8.2 10.2 8.3 1.2 1.1 13.4 13.7Bank Tabungan Negara Persero BBTN 1,650 17,474 -0.9 -0.6 -2.9 41.0 12.8 10.4 0.9 0.9 7.2 9.0CONSUMERHM Sampoerna HMSP 3,630 422,235 -1.1 -4.5 -4.9 27.7 40.4 35.5 13.7 12.3 45.5 35.4Gudang Garam GGRM 65,775 126,557 -0.3 3.7 -7.8 48.8 16.4 17.9 2.8 3.0 18.2 17.2Indofood CBP Sukses Makmur ICBP 17,250 100,584 1.2 0.4 5.8 36.9 26.2 28.0 5.1 5.7 20.6 21.0Indofood Sukses Makmur INDF 7,000 61,463 -0.7 -0.7 -1.1 5.7 17.7 15.8 1.7 2.1 11.3 14.0
Kalbe Farma KLBF 1,385 64,922 0.0 -2.8 -1.1 -17.8 30.9 29.4 5.9 5.5 20.2 19.4
Unilever Indonesia UNVR 43,075 328,662 -1.0 -1.2 -2.1 7.7 48.3 51.5 58.5 62.2 122.2 126.3
AGRICULTURAL
Astra Agro Lestari AALI 14,300 27,523 1.4 -2.7 0.1 -34.2 40.3 14.7 2.2 1.7 5.5 12.8
PP London Sumatera Indonesia LSIP 1,360 9,279 0.4 -6.8 -9.3 -16.0 14.5 13.1 1.2 1.2 8.7 9.3
Sawit Sumbermas Sarana SSMS 1,820 17,336 -1.4 -2.9 -2.2 -5.0 33.1 27.6 6.1 5.1 19.4 19.4
INFRASTRUCTURE
XL Axiata EXCL 3,750 40,080 1.4 -1.3 7.8 1.1 N/A 40.8 2.2 2.0 -0.2 4.9
Jasa Marga JSMR 5,150 35,020 0.0 -2.4 -2.8 -6.4 24.2 21.6 3.4 3.0 14.8 13.9
Perusahaan Gas Negara PGAS 2,340 56,725 -1.7 -2.5 -5.6 -45.9 9.9 9.7 1.6 1.3 13.6 13.3Tower Bersama Infrastructure TBIG 6,525 31,297 -1.5 -0.8 -2.6 -29.6 19.3 23.3 17.7 7.3 79.3 45.8Telekomunikasi Indonesia TLKM 3,840 387,072 0.5 -0.3 2.1 31.4 19.7 20.6 4.1 4.6 21.7 22.4
Soechi Lines SOCI 422 2,979 1.4 -0.9 -3.2 -26.6 5.9 4.5 0.9 0.7 15.9 15.2Garuda Indonesia GIAA 470 12,158 0.4 -2.9 -2.9 5.6 N/A 31.2 2.4 2.6 -10.0 7.6
BASIC-INDUSTRIES
Semen Indonesia SMGR 8,800 52,197 -0.6 -3.6 -3.3 -27.1 15.0 11.4 2.6 1.8 17.9 16.5
Charoen Pokphand Indonesia CPIN 3,600 59,033 -2.2 -5.5 1.1 28.3 23.2 21.4 3.4 4.0 15.6 20.2
Indocement Tunggal Prakarsa INTP 16,250 59,820 2.5 0.8 -1.8 -22.5 18.9 13.5 3.4 2.3 18.0 17.5
Japfa Comfeed Indonesia JPFA 1,110 11,833 3.3 0.0 14.4 101.8 14.4 14.8 1.2 1.9 9.0 12.4
MINING
Indo Tambangraya Megah ITMG 8,725 9,859 0.9 1.5 -0.9 -34.4 6.9 10.9 0.6 0.9 7.3 8.0
Adaro Energy ADRO 835 26,708 -0.6 -1.2 20.1 6.4 7.8 15.6 0.4 0.7 5.4 4.4
Aneka Tambang ANTM 735 17,663 0.7 -2.0 9.7 25.9 N/A N/A 0.4 1.0 -9.5 -3.3
Vale Indonesia INCO 1,750 17,389 1.2 -4.6 3.6 -36.5 23.6 N/A 0.6 0.7 2.8 0.2
Tambang Batubara Bukit Asam PTBA 7,750 17,857 -1.0 -3.1 16.1 -8.8 4.8 10.6 1.0 1.7 23.2 16.5
TRADE
United Tractors UNTR 14,900 55,579 5.9 8.0 7.2 -23.0 16.4 11.6 1.7 1.4 10.3 11.9
AKR Corporindo AKRA 6,225 24,839 -0.4 2.0 3.3 2.9 27.3 21.0 4.7 3.6 18.0 18.4Global Mediacom BMTR 935 13,276 -1.1 -8.3 -12.6 -19.0 297.3 14.0 1.4 N/A 0.5 N/AMatahari Department Store LPPF 20,000 58,358 0.0 2.4 6.4 19.0 28.8 26.8 46.4 27.9 281.5 139.8
Media Nusantara Citra MNCN 2,120 30,265 -1.9 -4.5 -3.2 6.5 22.0 16.8 2.9 2.9 13.3 18.1
Matahari Putra Prima MPPA 1,430 7,690 0.0 10.9 11.7 -55.9 53.7 52.5 3.5 2.6 6.5 7.6
Surya Citra Media SCMA 3,240 47,374 -0.6 -1.2 -5.8 13.7 29.7 28.3 14.4 11.9 46.2 44.8
Siloam International Hospital SILO 10,925 12,630 1.2 0.2 16.5 -25.2 160.9 135.8 6.5 6.9 4.1 5.0
PROPERTY
Bumi Serpong Damai BSDE 2,100 40,418 2.9 6.6 15.7 19.7 16.0 16.4 1.8 1.9 12.5 12.1
Adhi Karya ADHI 2,720 9,686 1.5 -0.4 6.3 53.8 10.6 16.2 1.5 1.7 13.7 11.4
Alam Sutera Realty ASRI 492 9,668 3.8 17.7 23.0 -18.7 11.3 10.4 1.0 1.3 9.5 12.3
Ciputra Development CTRA 1,470 22,536 3.2 1.0 6.1 12.6 17.5 15.9 2.7 2.4 16.0 15.3
Lippo Karawaci LPKR 1,090 25,155 1.9 11.2 10.7 -12.8 44.0 18.6 1.4 1.4 3.3 9.3
Pembangunan Perumahan PTPP 3,800 18,401 -0.5 -2.3 8.0 5.6 25.3 19.9 4.3 3.9 22.0 20.0
Pakuwon Jati PWON 610 29,377 4.3 4.3 13.0 38.0 18.9 15.2 3.3 3.3 18.9 23.5
Summarecon Agung SMRA 1,745 25,175 1.2 1.7 9.1 5.1 27.8 27.4 4.0 3.5 15.0 15.0Wijaya Karya WIKA 2,910 17,894 1.7 0.3 19.3 11.5 25.9 23.3 3.7 3.6 15.1 15.2Waskita Karya WSKT 2,500 33,933 0.8 2.5 -3.8 58.2 18.5 22.8 2.4 3.2 16.9 14.4MISCELLANEOUSAstra International ASII 6,625 268,204 -1.1 -1.9 -1.1 -2.9 16.8 16.2 2.4 2.4 14.6 15.3Source: Bloomberg, Daewoo Securities Indonesia Research*Note: Valuation metrics based on Bloomberg consensus estimates
June 28, 2016
17
Embun Pagi
Daewoo Securities Indonesia Research
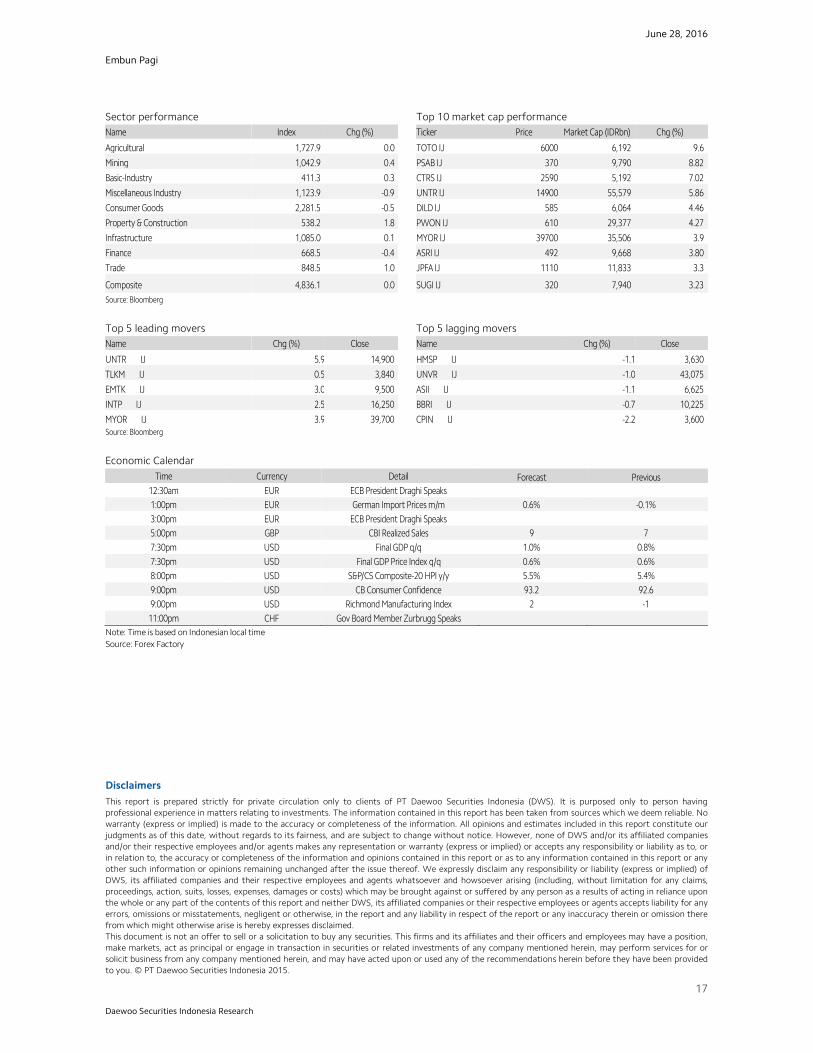
Sector performance Top 10 market cap performanceName Index Chg (%) Ticker Price Market Cap (IDRbn) Chg (%)
Agricultural 1,727.9 0.0 TOTO IJ 6000 6,192 9.6
Mining 1,042.9 0.4 PSAB IJ 370 9,790 8.82
Basic-Industry 411.3 0.3 CTRS IJ 2590 5,192 7.02
Miscellaneous Industry 1,123.9 -0.9 UNTR IJ 14900 55,579 5.86
Consumer Goods 2,281.5 -0.5 DILD IJ 585 6,064 4.46
Property & Construction 538.2 1.8 PWON IJ 610 29,377 4.27
Infrastructure 1,085.0 0.1 MYOR IJ 39700 35,506 3.9
Finance 668.5 -0.4 ASRI IJ 492 9,668 3.80
Trade 848.5 1.0 JPFA IJ 1110 11,833 3.3
Composite 4,836.1 0.0 SUGI IJ 320 7,940 3.23Source: Bloomberg
Top 5 leading movers Top 5 lagging moversName Chg (%) Close Name Chg (%) Close
UNTR IJ 5.9 14,900 HMSP IJ -1.1 3,630
TLKM IJ 0.5 3,840 UNVR IJ -1.0 43,075
EMTK IJ 3.0 9,500 ASII IJ -1.1 6,625
INTP IJ 2.5 16,250 BBRI IJ -0.7 10,225
MYOR IJ 3.9 39,700 CPIN IJ -2.2 3,600Source: Bloomberg
Economic CalendarTime Currency Detail Forecast Previous
12:30am EUR ECB President Draghi Speaks1:00pm EUR German Import Prices m/m 0.6% -0.1%3:00pm EUR ECB President Draghi Speaks5:00pm GBP CBI Realized Sales 9 77:30pm USD Final GDP q/q 1.0% 0.8%7:30pm USD Final GDP Price Index q/q 0.6% 0.6%8:00pm USD S&P/CS Composite-20 HPI y/y 5.5% 5.4%9:00pm USD CB Consumer Confidence 93.2 92.69:00pm USD Richmond Manufacturing Index 2 -1
11:00pm CHF Gov Board Member Zurbrugg SpeaksNote: Time is based on Indonesian local timeSource: Forex Factory
DisclaimersThis report is prepared strictly for private circulation only to clients of PT Daewoo Securities Indonesia (DWS). It is purposed only to person havingprofessional experience in matters relating to investments. The information contained in this report has been taken from sources which we deem reliable. Nowarranty (express or implied) is made to the accuracy or completeness of the information. All opinions and estimates included in this report constitute ourjudgments as of this date, without regards to its fairness, and are subject to change without notice. However, none of DWS and/or its affiliated companiesand/or their respective employees and/or agents makes any representation or warranty (express or implied) or accepts any responsibility or liability as to, orin relation to, the accuracy or completeness of the information and opinions contained in this report or as to any information contained in this report or anyother such information or opinions remaining unchanged after the issue thereof. We expressly disclaim any responsibility or liability (express or implied) ofDWS, its affiliated companies and their respective employees and agents whatsoever and howsoever arising (including, without limitation for any claims,proceedings, action, suits, losses, expenses, damages or costs) which may be brought against or suffered by any person as a results of acting in reliance uponthe whole or any part of the contents of this report and neither DWS, its affiliated companies or their respective employees or agents accepts liability for anyerrors, omissions or misstatements, negligent or otherwise, in the report and any liability in respect of the report or any inaccuracy therein or omission therefrom which might otherwise arise is hereby expresses disclaimed.This document is not an offer to sell or a solicitation to buy any securities. This firms and its affiliates and their officers and employees may have a position,make markets, act as principal or engage in transaction in securities or related investments of any company mentioned herein, may perform services for orsolicit business from any company mentioned herein, and may have acted upon or used any of the recommendations herein before they have been providedto you. © PT Daewoo Securities Indonesia 2015.