institut maklumat dan analisis pasaran buruh (ilmia) · institut maklumat dan analisis pasaran...
TRANSCRIPT

Institut Maklumat dan Analisis Pasaran Buruh (ILMIA)
3
Contents
Executive Summary iii
1 Introduction 11.1 Background 11.2 ObjectivesoftheNER2016Survey 11.3 ScopeandCoverage 11.4 SurveyMethodology 21.5 ConceptsandInterpretationofResults 21.6 ReportContent 3
2 Profile of Employers 52.1 SpatialandSectoralDistribution 52.2 OwnershipandEquity 72.3 EstablishmentSize 9
3 Profile of Employees 113.1 EmploymentSize 113.2 SpatialandSectoralDistribution 113.3 OccupationalStructure 123.4 Gender 14
4 Salary and Compensations 174.1 Introduction 174.2 MinimumandMaximumBasicSalaryof MalaysianEmployees 17
4.2.1 JobCategoryMASCO2Digit 184.2.2 Sector 23
4.3 CurrentBasicSalaryTrendsandPatterns 244.3.1 TrendsandPatterns 244.3.2 Sector 264.3.3 Nationality 274.3.4 Gender 284.3.5 JobCategoryMASCO2Digit 28
National Employment Returns Report 2016
4
4.4 OtherCashCompensation 304.4.1 CashAllowance 304.4.2 Bonus 324.4.3 Incentives 344.4.4 OvertimePayments 35
5 Components of Compensation and Productivity-linked Wage System 37
5.1 Introduction 375.2 ComponentsofCompensation 37
5.2.1 Allowance 375.2.2 Benefits 375.2.3 Productivity-linkedWageSystem 38
6 Education and Skills 416.1 Introduction 416.2 EducationLevel 416.3 RequiredSkills 416.4 Training 42
7 Recruitment and Vacancies 477.1 Turnoverrate 477.2 Vacancies 48
7.2.1 VacancyRate 497.2.2 Hard-to-fillVacancies 49
8 Minimum Wage 538.1 Introduction 538.2 ImplementationofMinimumWagePolicy 538.3 ImpactsofMinimumWagePolicy 53
Appendix – Technical Notes 55
Survey Methodology 55
Institut Maklumat dan Analisis Pasaran Buruh (ILMIA)
5
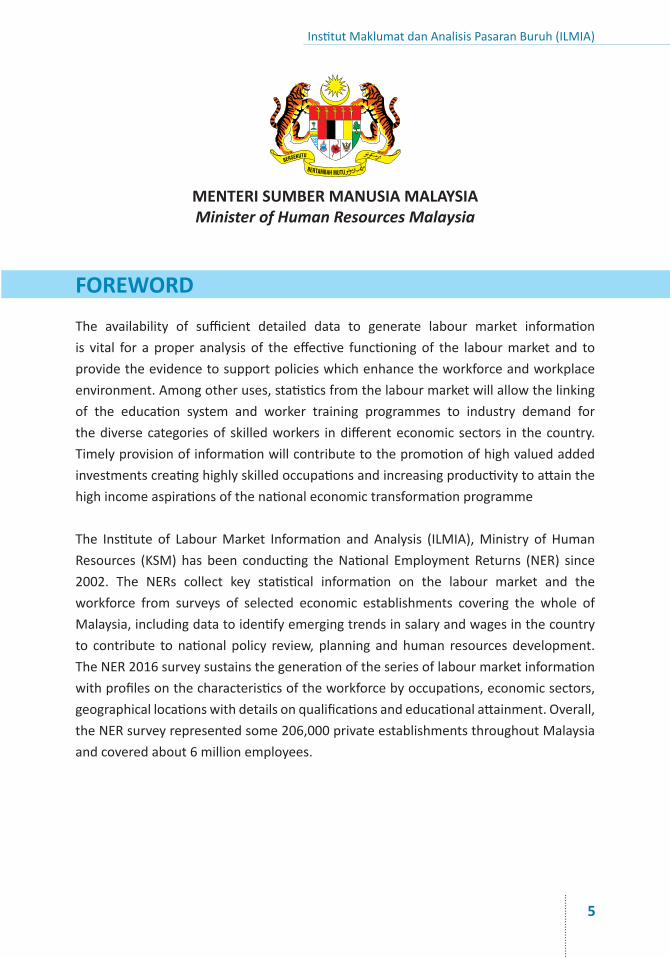
The availability of sufficient detailed data to generate labour market informationis vital for a proper analysis of theeffective functioningof the labourmarket and toprovidetheevidencetosupportpolicieswhichenhancetheworkforceandworkplaceenvironment.Amongotheruses,statisticsfromthelabourmarketwillallowthelinkingof the education system and worker training programmes to industry demand forthediversecategoriesof skilledworkers indifferenteconomicsectors in thecountry.Timelyprovisionofinformationwillcontributetothepromotionofhighvaluedaddedinvestmentscreatinghighlyskilledoccupationsandincreasingproductivitytoattainthehighincomeaspirationsofthenationaleconomictransformationprogramme
The Institute of LabourMarket Information and Analysis (ILMIA),Ministry of HumanResources (KSM) has been conducting theNational Employment Returns (NER) since2002. The NERs collect key statistical information on the labour market and theworkforce from surveys of selected economic establishments covering the whole ofMalaysia,includingdatatoidentifyemergingtrendsinsalaryandwagesinthecountryto contribute tonational policy review,planning andhuman resourcesdevelopment.TheNER2016surveysustainsthegenerationoftheseriesoflabourmarketinformationwithprofilesonthecharacteristicsoftheworkforcebyoccupations,economicsectors,geographicallocationswithdetailsonqualificationsandeducationalattainment.Overall,theNERsurveyrepresentedsome206,000privateestablishmentsthroughoutMalaysiaandcoveredabout6millionemployees.
MENTERI SUMBER MANUSIA MALAYSIAMinister of Human Resources Malaysia
FOREWORD
National Employment Returns Report 2016
6
Iwouldliketoexpressmyappreciationfor thecooperationofalltheprivateenterprisesthatrespondedtotheNER2016surveyandto ILMIAandallagenciesunderKSMwhichhaveworkedtogethertomakeNER2016a success.ThesupportofthemanagementandstaffofHRDFdeservesspecialmention. IhopethefindingsfromtheNERwillcontinue to beamajorreferencefor labourmarketanalysisandtheformulationofpoliciesfor humanresourcesdevelopmentinlinewithKSM’svisionastheleaderinhumanresourcesmanagement.
Dato’SriRichardRiotAnakJaemMinister of Human Resources Malaysia
Institut Maklumat dan Analisis Pasaran Buruh (ILMIA)
7
EXECUTIVE SUMMARY
TheMinistryofHumanResources(MOHR)hascarriedoutaseriesofemployersurveystoprofileemployers,employees,andtheirwageandsalarylevelssince2002.The2016SurveyofNationalEmploymentReturns(NER),thelatestintheseries,isthefifthoftheNERsurveys.Previoussurveyswereconductedin2007,2009,2011and2013.
TheNERscollectinformationonthelabourmarketandtheworkforceinMalaysia.Italsoidentifiesemergingtrends insalaryandwagesinthecountrytoaid innationalpolicyreview, planning and human resources development. TheMOHR intends to use theinformationfromtheNERstobuildacompleteandcurrentlabourmarketdatabasethatcanbeusedbyallsegmentsofthesociety,particularlybythegovernment,industry,theprivatesector,peoplelookingforwork,researchers,andothers.
The main objectives of the NER 2016 survey are: (a) to collect information on theworkforcewiththeaimtoupdatethelabourmarketinformationdatabase;(b)toprofiletheworkforcestructure,i.e.localandforeign,professional,semi-professionalandothercategoryofemployees;(c)toanalysethecharacteristicsofemployees,especiallywages,education levels, TVET, and skills by industry, economic corridors/states; (d) providedataforanalysisofthe2016workforceaswellastrendsovertime;and(e)tocarryoutprojectionsofthelabourmarketforpolicypurposes.
TheNER2016SurveyusedtheEstablishmentandEnterprise(EE)frametogenerateasampleofestablishmentsforthesurvey.TheEEframewasestablishedandismaintainedbytheDepartmentofStatistics(DOSM)andithasanationalcoverageofestablishments.TheEEframehasbeenusedforallnationalestablishmentsurveystogeneratelabourforcestatisticsthathasservedasinputstosocialandeconomicplanning.Inusingthisframe,theNER2016surveydatacanbeprojectedtothenationaleconomy.Thus,theNER2016surveycanalsobecomparedwithnationalsurveys,suchasthe2016EconomicCensus,andthuscreatesaricherplatformforfurtheranalysisandresearch.
With respect to the NER 2016 results, 77% of the establishments surveyed are inPeninsularMalaysia,9.9%inSabahandW.P.Labuan,and13.1%inSarawak.Theshareof SMEs (Small andMedium Enterprises) is 93.9% of all establishments inMalaysia.The largestsector isServices,at77.3%ofallestablishments inthesurvey;thissectorcompriseofWholesaleandRetailTrade(WRT),Accommodation,Foodserviceactivitiesandotherserviceindustries.Bystatus,about46.4%oftheestablishmentsareprivatelimited companies, while 31.5% of the establishments are sole proprietors. In terms
National Employment Returns Report 2016
8
ofownership,almosttwo-thirdsoftheestablishmentsregisteredareNon-Bumiputeraowned(62.6%),whichistwicetheproportionofBumiputera-ownedcompanieswhichonlycomprise30%.
TheworkforceintheNER2016Surveyconsistof82.9%Malaysianemployees,and17.1%foreignemployees.MalaysianemployeesareemployedintheServicesandManufacturingsectorsandbothcomprisethelargestsectoralshareat73.9%and17.2%respectively.ForeignemployeesalsoareconcentratedinthetwosamesectorswithManufacturingandServicesaccountingfor40.1%and30.5%respectivelyofallforeignworkers.
The ratio of foreign to local employees is most significant in the Agriculture sectorwherethereare197foreignemployeesforevery100localemployees.MostMalaysiansemployeesareintheserviceandsalesoccupationalcategory,whereasforeignemployeesaremainlyfoundintheelementaryoccupations.
In terms of gender distribution, theoccupationswith thehighestmale-female ratiosare in the skilled agricultural, forestry, livestock and fishery category: 470males forevery100females.Thisisfollowedbycraftandrelatedtradeworkers,with457malesforevery100females.Ontheotherhand,theoccupationswithproportionatelymorefemalesthanmalesareinclericalsupport,59malesper100females,andprofessionalworkers, 92males for every100 females.Generally,maleemployeesarepaidhighermediansalariesthanfemaleemployees:inthecraft&relatedtradesandalsotheplantandmachineoperatorswheremaleemployeesarepaid45%and40%higherthantheirfemalecounterpartsrespectively.
Inthisreport, For median monthly salaries at the major occupation level, thestartingsalaryof managers isRM4,000,while theirmaximumsalary isRM5,210, i.e. showingaprogressionbetween their startingand theirmaximumpay.Forprofessionals, theirmediansalariesstartatRM2,800andtheirmaximumisRM5,000.Fortechniciansandassociated professionals, themedian starting salary is RM2,000 and themaximum isRM3,600.Fortheelementaryoccupations,thestartingpayisRM900andthemaximumisRM1,350.
Foroccupationsat MASCO 2 Digit level, the median monthly salariesofmanagersintheInformation&CommunicationsTechnology(ICT)industryreceiveRM7,000,whichisthehighestmedianmaximummonthlybasic salaryamongallmanagers.Formanagers intheservicessector,theirmaximumsalaryofRM4,000permonthisthelowestmaximummediansalaryofthesixmanagersthatwererecordedatthe2digitlevel.
Institut Maklumat dan Analisis Pasaran Buruh (ILMIA)
9
As for other job categories,professionals in thehealth sectorwerepaid thehigheststartingsalaryofRM4,331withamaximumofRM7,000.TheteachingprofessionalswerethelowestpaidwithastartingsalaryofRM1,993andreachamaximumofRM3,000.
Among the technicians and associate professionals’ category, health associateprofessionalsreceivethelowestsalary:RM1,397startingsalaryandRM2,629maximumsalary. The regulatory government associate professionals enjoy the highest startingsalaryofRM2,600andRM4,532maximumsalary.
Inthecraft and related trade workers’category,thefoodprocessingandrelatedworkersarepaidthelowestbasicsalaryofRM1,650andalsoloweststartingsalary(RM1,005).ThebuildingandrelatedtradesworkersarepaidaroundRM1,500,withthemaximummonthly basic salary at RM2,750. Among the plant and machine operators and assemblers,thestartingsalariesofstationaryplantandmachineoperatorsisrecordedatRM1000,whereastheirmaximumsalaryisRM2,300permonth.
Thestartingsalariesoftheclerical supportcategoryrangefromRM1,250toRM1,500,andtheirmaximumsalariesrangefromRM2,000toRM2,500.Fortheservice and sales category, salesworkers, their starting salaries range from 938 to RM1,100 and theirmaximumsalaryfrom1,500toRM2,000.Amongthisgroup,the education and social services workers receive the lowest salaries:startingsalaryofRM1,000andamaximumofRM1,500.
Forthethreecategoryofworkers in the Agricultural sector,theirstartingsalariesrangefromRM1,000toRM1,300,andthemaximumsalariesarefromRM1,900toRM2,460.
ItcanbeseenthattheMinimumWagepolicyhastakeneffect,asthemedianstartingmonthlybasicsalaryforelementary occupationsrangefromRM900toRM1,000,higherthan in NER 2011 survey where the starting salary ranged from RM600 to RM904.Approximately 60% of the companies reported that the salaries of their lowest paidworkers have increased to theminimumwage level. Concomitantly, their profits haddecreasedsincetheminimumwagepolicywasimplemented.
In terms of starting salary by occupation forNER2016,theaverageforallmanagersisRM4,000butthemanagersintheICTandFinancesectorstoppedthelist,similartotheNER2011survey,atRM5,500.Amongtheprofessionals,theaveragestartingsalary isRM2,800andthehumanhealthsectorpaidthehighestfortheirprofessionalsatRM5,000
National Employment Returns Report 2016
10
(secondismining).TheaveragestartingsalaryfortechniciansandassociateprofessionalsisRM2,000andthesectorthatpaidthehighestforthisoccupationalcategoryismining(RM2,550) followedbyfinance (RM2,473). For clerical supportworker, theaverage isRM1,300andtheICTindustrypaythehighestatRM1,800.Forsalesandserviceworkers,theaverageisRM1,000andthesectorthatpaidthehighestisagainMiningatRM1,900.Amongtheelementaryworkers,theaveragestartingsalaryisRM900andthemaximumpayisbythefinancialsectoratRM1,057.
Whatisclearandconsistentovertheyearsisthatlarge variation of pay is seen among the higher occupational categories.Therangeofpayofthemanagersareverymuchgreaterthanfortheloweroccupationalcategories(elementaryworkers).Itlikelyreflectstherangeofthequalityofemployees:thegreatertherange,thegreaterthequalityoftheworkersintheoccupationalcategory.
In NER 2016, foreign-local salary ratio are tabulated. Expatriate managers are paidRM10,000asthemedianbasicmonthlysalary,50%morethanlocalmanagers.Atthetopthreeoccupational levels,themedianmonthlybasicsalaryforforeignexpatriatesarehigherthanforMalaysiansforthesameoccupationalcategory.Fortherestoftheoccupational categories,Malaysians arepaidmore than foreigners. Furthermore, thesecondbiggestmediansalarygapbetweenlocalandforeignemployeesarefoundamongtheplant&machineoperatorsandassemblers’category.Malaysianplantandmachineryoperatorsarepaid34.3%morethantheforeignemployeesinthesamecategoryofwork.
The education attainment of workers in the NER 2016 indicates that 91% of theMalaysianworkershaveatleastasecondaryeducation,with9%haveprimaryeducationor below. Approximately 3.2% of Malaysian employees have vocational diploma /advanceddiploma,whichareconsideredaspartofTVETprogrammes.Around22.5%oftheestablishmentsprovidein-housetraining,and20.4%providepublictraining.Thetop2skillareasrequiredbymostofthesectorsareaccountingorfinanceandadministrationorclericalskills.
In termsof responses to the Productivity-LinkedWage System (PLWS) sectionof thesurvey, only 19.7% of the companies reported themselves as being aware of PLWS.However, all employers reward their employees based on individual employee’sperformance/productivity throughbonusesand salary increments, regardlessof theirawarenesstoPLWS.
Institut Maklumat dan Analisis Pasaran Buruh (ILMIA)
11
Theturnover rateinNER2016surveyshowthatmorethanhalf(51%)oftheestablishmentshadnoemployeeturnoverin2015.Additionally,thehighestvacancyrateforNER2016is in thesalesandservice industrycategory,at9.7%.Therewereseveralservicesub-sectorsthatreportedhard-to-fillvacancies(i.e.remainedunfilledafter3months):76.2%ofthevacanciesin2016werehardtofill.
Inconclusion,anupdatedpictureoftheworkforceandtheirsalaries/wageswasobtainedin2015(thereferenceyearoftheNER2016survey).Afterweightingthedata,thesurveyis representative of about 206,000 establishments inMalaysia, and they account forabove6millionemployees. Themedian startingandmaximummonthly salaries thatwere reported show slightly low levelswhich is likely reflectiveof the characteristicsof the firms (mainly SMEs), and the occupations that they use for undertaking theirbusinesses.

Institut Maklumat dan Analisis Pasaran Buruh (ILMIA)
13
1 INTRODUCTION
1.1 Background
The first National Employment Returns (NER) survey1 was carried out in 2007.SubsequentNERsurveyswereconductedin2009,2011and2013.Thecurrentoneisthe2016NationalEmploymentReturnsSurvey(NER2016)whichwasconductedundertheprovisionsofSection3oftheEmploymentInformationAct1953,similartotheprevioussurveyscarriedoutinthisseries.
1.2 ObjectivesoftheNER2016Survey
TheobjectivesoftheNER2016surveyareasfollows:• Tocollectinformationontheworkforcewiththeaimtoupdatethedatabase;• Toobtaininformationpertainingtoprofessionalandforeignemployees,TVET,critical
skills;• TocollectthedataassourcetobeusedintheLMIDWforfurtheranalysis;• Tocollectinformationsuchasemployers’particulars,employees’wages,education
levels,andskillsbyindustry,economiccorridors/states;and• ToanalyseandcarryoutprojectionsonthelabourmarketforfutureILMIAstudies.
1.3 ScopeandCoverage
TheobjectiveofusingasamplingapproachforNER2016surveywastoconductasurveythatisrepresentativeofthenationallabourmarketsituationinsofarasthesamplingframewasrepresentativeofthenation’seconomy.ItisimportanttonotethatthesurveyelementsoftheNERsurveysaretheestablishments(orfirms)whosetotalcompositioncoversallsectorsoftheeconomy.ThemethodologyofthesamplesurveyisdescribedintheAppendix–TechnicalNotes.
TheNER2016SurveywasconductednationwidecoveringPeninsularMalaysia,SabahandSarawak,acrossall21industrialsectorsandjobcategoriesaccordingtotheMalaysianStandardIndustrialClassification(MSIC),2008.TheoccupationswerecodedusingtheMalaysianStandardClassificationofOccupation(MASCO),2013.
1 The2002SurveywascalledtheAnnualEmploymentReturnswhichwasthestartofthisseriesofsurveys.
National Employment Returns Report 2016
14
ThesamplingframefromtheDepartmentofStatisticsMalaysia(DOSM)isdeemedtocontainacomprehensivelistofestablishmentsandenterprises(EEframe)coveringallsectorsoftheeconomy.ThedecisiontousetheEEframeisalsotoensuretheestimatesobtainedfromthissurveyareinlinewithandcomparabletootherestablishmentsurveysconductedbyDOSMsuchastheEconomicCensus2015.
TheNER 2016 survey collects data on awide range of topics covering the profile ofemployersandemployeesaswellastheirsalariesandwages.Dataonthetypeofjobs,educationlevels,minimumwageandproductivity-linkedwagesystemarealsocollected.
1.4 SurveyMethodology
TheNER2016surveyresultshavebeenweightedaccordingtoweightsprovidedbytheDOSM.TheTechnicalNotesintheAppendixprovidethedetails.
1.5 ConceptsandInterpretationofResults
Priorto2016,thevariousNERsurveysuseddifferentdefinitionsofwagesandsalaries.
In the 2002 Annual Employment Returns (AER), the compensation data comprisedmonthlybasicwage,monthlytotalwages(basicwagepluscashallowances)andovertimepaymentseparately.TheNER2007surveyalsousedthetermwages,tospecifymonthlywage,andbrokendownintomonthlybasicwage,totalcashallowancesandovertimewages.
Then, fortheNER2009survey, thetermsalarywasusedbut itaddedtobasicsalaryseveral other fixed and variable components. These components – namely, cashallowances,incentivesandbenefits–werereportedinoneconsolidatedamountwithnobreakdowns.Therewasdataonlyontheprevalencebutnotthequantumofthesecomponents.
The NER 2011 survey used a standard definition of wages and separated the basicwage/salaryfromperformance-basedpayaswellascashallowancesthatweregiveninadditiontobasicsalary.
InthisNER2016,thefollowingconceptsareused:
a) Basic Salary/ Basic Wage
Institut Maklumat dan Analisis Pasaran Buruh (ILMIA)
15
• MonthlyBasicSalary• Entrylevelmonthlysalary/wage
b) Incentive/ Variable Pay and Overtime• IncentivePay• Bonus• OvertimePay•
c) Allowances• ShiftAllowance• AttendanceAllowance• FoodAllowance• TransportationAllowance• HousingAllowance• LaundryAllowance• CostOfLivingAllowance• CriticalAllowance• ServicesAllowance• OutstationAllowance• EntertainmentAllowance• TelephoneAllowance
1.6 ReportContent
Thisreportisdividedinto8chapters.Thischapterprovidesthebackgroundofthesurvey,scopeandcoverage,methodologyandapproachtakenandtheconceptsusedaswellasinterpretationofthesurveyresults.Chapter2focusesontheprofileoftheemployers,highlightingthespatialandsectoraldistributionoftheestablishments,ownershipandequityandtheirsize(accordingtoemployment).
Chapter 3 describes the profile of the employees, including its spatial and sectoraldistribution,genderandnationalityaswellastheoccupationalcategoriestheyfall in.Following this, the salary and compensation administration practices, including thedifferenttypesofcompensationpaidtoemployeesarediscussedinChapter4.Chapter5focusesoncomponentsofcompensationaswellasdiscussionpertainingtoProductivity-linkedWageSystem(PLWS).AsforChapter6,detailsincludingtheeducationlevelandskillsoftheemployeesareprovided.Chapter7outlinestherecruitmentaswellasthe
National Employment Returns Report 2016
16
vacancies. Lastly,Chapter8highlightsabrief survey regardingminimumwagepolicy.Chapter8providesadiscussionofminimumwagesasanalysedfromthesurvey.
Inaddition,thereisatechnicalappendixwhichprovidesinformationaboutthesurveythatwouldbeusefulforanin-depthunderstandingoftheconceptsandproceduresused.
Institut Maklumat dan Analisis Pasaran Buruh (ILMIA)
17
2 PROFILE OF EMPLOYERS
This chapterdescribes the characteristicsof employers and their establishments thatparticipatedintheNER2016Survey.Whiletheterm‘Employer’iscommonlyused,thetermestablishment ismoreappropriate in the contextof this survey. Establishmentsdenotebusinessentities thatemployworkers;employers couldoperateoneormorebusinesses/establishmentsandfromoneorseverallocations.Theestablishmentisaunitofanalysis:itreferstoaproductiveactivityoperatinginonelocation.Itisselectedfromasampleframeinaccordancewithstandardisedsamplingprocedures.
According to the System of National Accounts, an establishment is defined as anenterprise,orpartof anenterprise, that is situated ina single locationand inwhichonlyasingle(non-ancillary)productiveactivity iscarriedoutor inwhichtheprincipalproductive activity accounts formost of the value added. An establishmentmay beeitheranoperationsoffice,abranchoreventhebusinessentity’sheadquarters.
TheunitofanalysisinthisNERsurveyistheestablishment.Itsrespondentsaredrawnfromtheestablishmentsandenterprises(EE)frame,maintainedbytheDepartmentofStatisticsMalaysia.TheEE framewasalsoused inNER2011andNER2013,whereasearlierNERsusedtheLabourMarketDatabase(LMD),alistofcompaniesmaintainedbytheMinistryofHumanResources.Whereverpossible,comparisonswithdatafromthepreviousNERsurveysaremade.
2.1 SpatialandSectoralDistribution
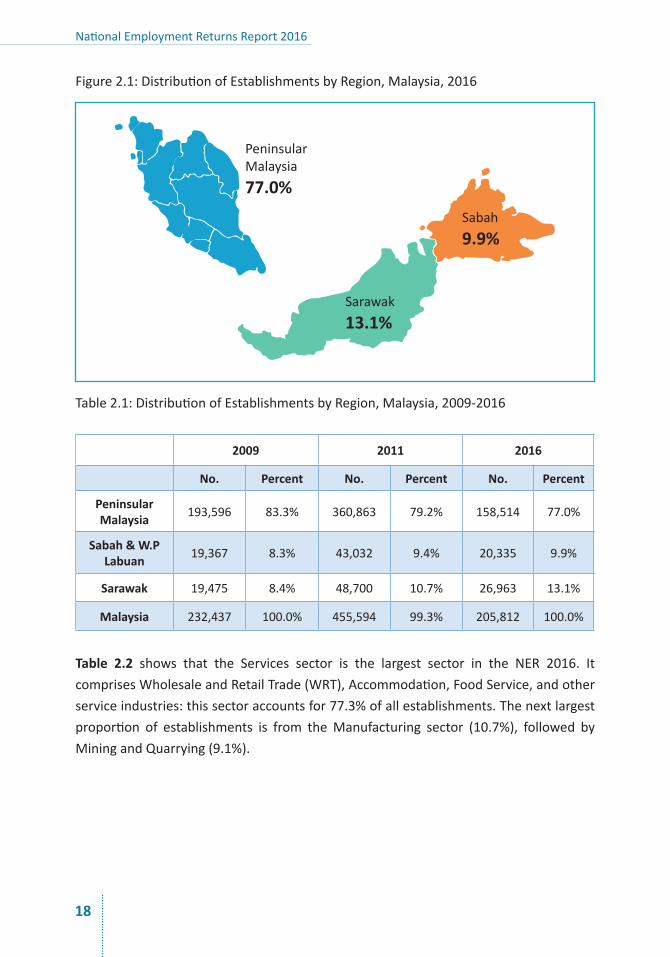
TheNER2016showsthat77%oftheestablishmentssurveyedareinPeninsularMalaysia,9.9% inSabahandW.P. Labuanand13.1% inSarawak.Table 2.1 shows the samplingdistributionoftheresponsesbyregions.ThesametablealsocomparesNER2016withthepreviousLMD-basedNERsurveyin2009andtheDOSM-basedsurveyconductedin20112. Figure 2.1showsthedistributionofestablishmentsbyregionin2016.
2 NER2013wasexcludedfromthecomparisonduetotheunweighteddata.
National Employment Returns Report 2016
18
Figure2.1:DistributionofEstablishmentsbyRegion,Malaysia,2016
PeninsularMalaysia77.0%
Sarawak13.1%
Sabah9.9%
Table2.1:DistributionofEstablishmentsbyRegion,Malaysia,2009-2016
2009 2011 2016
No. Percent No. Percent No. Percent
Peninsular Malaysia 193,596 83.3% 360,863 79.2% 158,514 77.0%
Sabah & W.P Labuan 19,367 8.3% 43,032 9.4% 20,335 9.9%
Sarawak 19,475 8.4% 48,700 10.7% 26,963 13.1%
Malaysia 232,437 100.0% 455,594 99.3% 205,812 100.0%
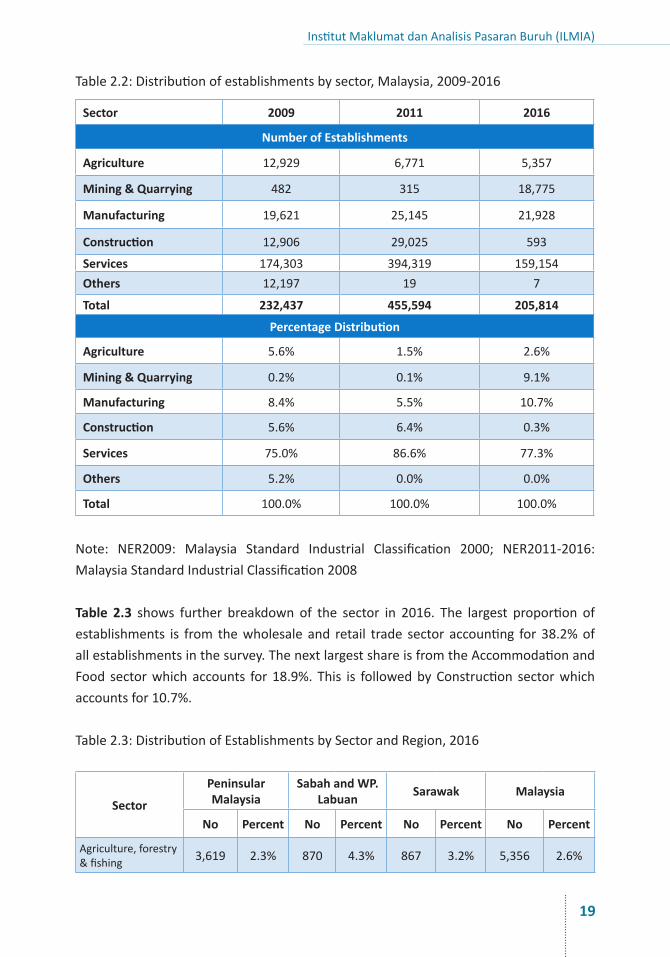
Table 2.2 shows that the Services sector is the largest sector in the NER 2016. ItcomprisesWholesaleandRetailTrade(WRT),Accommodation,FoodService,andotherserviceindustries:thissectoraccountsfor77.3%ofallestablishments.Thenextlargestproportion of establishments is from theManufacturing sector (10.7%), followed byMiningandQuarrying(9.1%).
Institut Maklumat dan Analisis Pasaran Buruh (ILMIA)
19
Table2.2:Distributionofestablishmentsbysector,Malaysia,2009-2016
Sector 2009 2011 2016
Number of Establishments
Agriculture 12,929 6,771 5,357
Mining & Quarrying 482 315 18,775
Manufacturing 19,621 25,145 21,928
Construction 12,906 29,025 593
Services 174,303 394,319 159,154Others 12,197 19 7
Total 232,437 455,594 205,814
Percentage Distribution
Agriculture 5.6% 1.5% 2.6%
Mining & Quarrying 0.2% 0.1% 9.1%
Manufacturing 8.4% 5.5% 10.7%
Construction 5.6% 6.4% 0.3%
Services 75.0% 86.6% 77.3%
Others 5.2% 0.0% 0.0%
Total 100.0% 100.0% 100.0%
Note: NER2009: Malaysia Standard Industrial Classification 2000; NER2011-2016:MalaysiaStandardIndustrialClassification2008
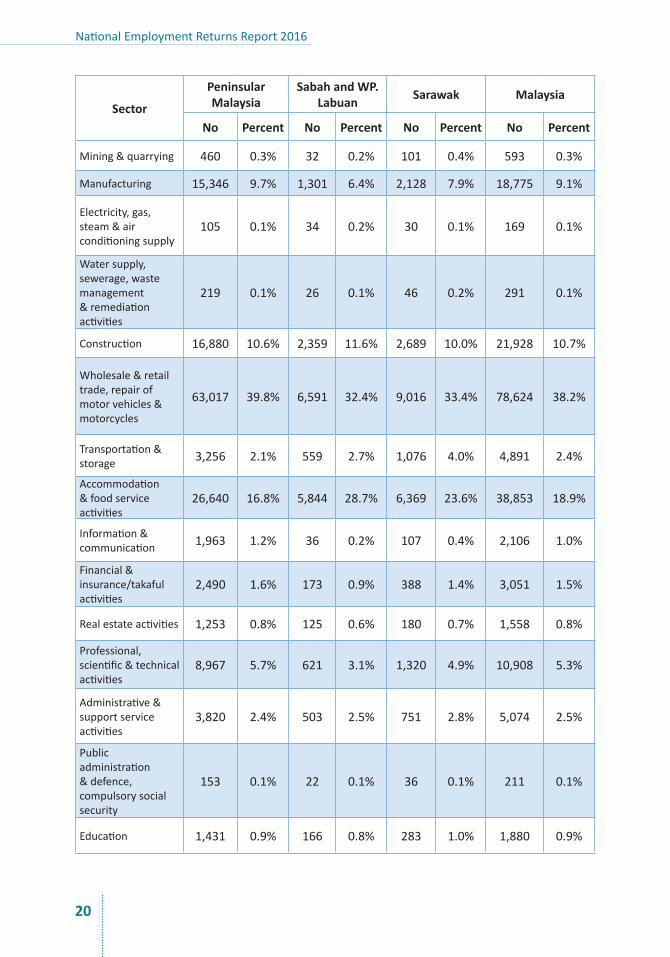
Table 2.3 shows further breakdown of the sector in 2016. The largest proportion ofestablishments is from thewholesaleand retail trade sector accounting for38.2%ofallestablishmentsinthesurvey.ThenextlargestshareisfromtheAccommodationandFood sectorwhichaccounts for18.9%.This is followedbyConstruction sectorwhichaccountsfor10.7%.
Table2.3:DistributionofEstablishmentsbySectorandRegion,2016
Sector
Peninsular Malaysia
Sabah and WP. Labuan Sarawak Malaysia
No Percent No Percent No Percent No Percent
Agriculture,forestry&fishing 3,619 2.3% 870 4.3% 867 3.2% 5,356 2.6%
National Employment Returns Report 2016
20
Sector
Peninsular Malaysia
Sabah and WP. Labuan Sarawak Malaysia
No Percent No Percent No Percent No Percent
Mining&quarrying 460 0.3% 32 0.2% 101 0.4% 593 0.3%
Manufacturing 15,346 9.7% 1,301 6.4% 2,128 7.9% 18,775 9.1%
Electricity,gas,steam&airconditioningsupply
105 0.1% 34 0.2% 30 0.1% 169 0.1%
Watersupply,sewerage,wastemanagement&remediationactivities
219 0.1% 26 0.1% 46 0.2% 291 0.1%
Construction 16,880 10.6% 2,359 11.6% 2,689 10.0% 21,928 10.7%
Wholesale&retailtrade,repairofmotorvehicles&motorcycles
63,017 39.8% 6,591 32.4% 9,016 33.4% 78,624 38.2%
Transportation&storage 3,256 2.1% 559 2.7% 1,076 4.0% 4,891 2.4%
Accommodation&foodserviceactivities
26,640 16.8% 5,844 28.7% 6,369 23.6% 38,853 18.9%
Information&communication 1,963 1.2% 36 0.2% 107 0.4% 2,106 1.0%
Financial&insurance/takafulactivities
2,490 1.6% 173 0.9% 388 1.4% 3,051 1.5%
Realestateactivities 1,253 0.8% 125 0.6% 180 0.7% 1,558 0.8%
Professional,scientific&technicalactivities
8,967 5.7% 621 3.1% 1,320 4.9% 10,908 5.3%
Administrative&supportserviceactivities
3,820 2.4% 503 2.5% 751 2.8% 5,074 2.5%
Publicadministration&defence,compulsorysocialsecurity
153 0.1% 22 0.1% 36 0.1% 211 0.1%
Education 1,431 0.9% 166 0.8% 283 1.0% 1,880 0.9%
Institut Maklumat dan Analisis Pasaran Buruh (ILMIA)
21
Sector
Peninsular Malaysia
Sabah and WP. Labuan Sarawak Malaysia
No Percent No Percent No Percent No Percent
Humanhealth&socialworkactivities 3,975 2.5% 354 1.7% 466 1.7% 4,795 2.3%
Arts,entertainment&recreation 1,169 0.7% 153 0.8% 222 0.8% 1,544 0.8%
Otherserviceactivities 3,745 2.4% 565 2.8% 889 3.3% 5,199 2.5%
Activitiesofhouseholdsasemployers;undifferentiatedgoods-&services-producingactivitiesofhouseholdsforownuse
7 0.0% - - - - 7 0.0%
Total 158,515 100.0% 20,334 100.0% 26,964 100.0% 205,813 100.0%
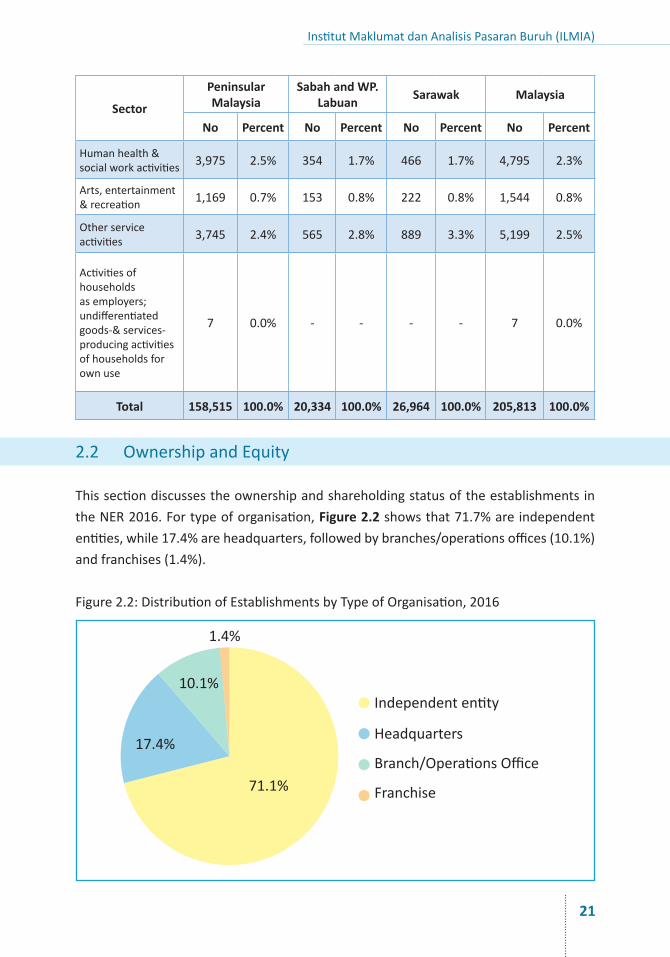
2.2 OwnershipandEquity
ThissectiondiscussestheownershipandshareholdingstatusoftheestablishmentsintheNER2016.Fortypeoforganisation,Figure 2.2showsthat71.7%areindependententities,while17.4%areheadquarters,followedbybranches/operationsoffices(10.1%)andfranchises(1.4%).
Figure2.2:DistributionofEstablishmentsbyTypeofOrganisation,2016
71.1%
Independententity
Headquarters
Branch/OperationsOffice
Franchise
17.4%
10.1%
1.4%
National Employment Returns Report 2016
22
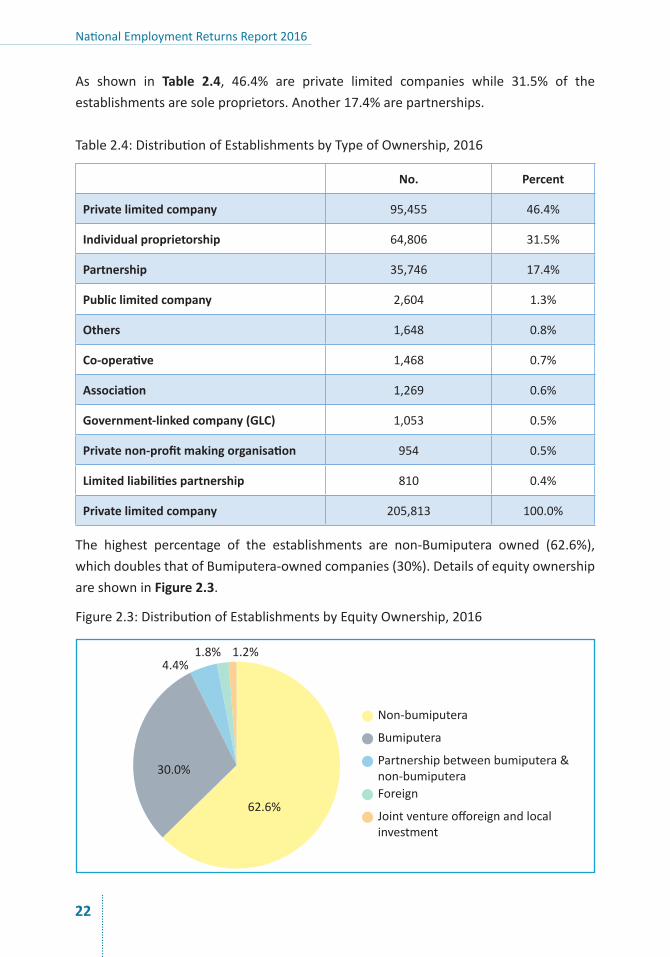
As shown in Table 2.4, 46.4% are private limited companies while 31.5% of theestablishmentsaresoleproprietors.Another17.4%arepartnerships.
Table2.4:DistributionofEstablishmentsbyTypeofOwnership,2016
No. Percent
Private limited company 95,455 46.4%
Individual proprietorship 64,806 31.5%
Partnership 35,746 17.4%
Public limited company 2,604 1.3%
Others 1,648 0.8%
Co-operative 1,468 0.7%
Association 1,269 0.6%
Government-linked company (GLC) 1,053 0.5%
Private non-profit making organisation 954 0.5%
Limited liabilities partnership 810 0.4%
Private limited company 205,813 100.0%
The highest percentage of the establishments are non-Bumiputera owned (62.6%),whichdoublesthatofBumiputera-ownedcompanies(30%).DetailsofequityownershipareshowninFigure 2.3.
Figure2.3:DistributionofEstablishmentsbyEquityOwnership,2016
62.6%
30.0%
4.4%1.8% 1.2%
Non-bumiputera
Bumiputera
Partnershipbetweenbumiputera&non-bumiputeraForeign
Jointventureofforeignandlocalinvestment
Institut Maklumat dan Analisis Pasaran Buruh (ILMIA)
23
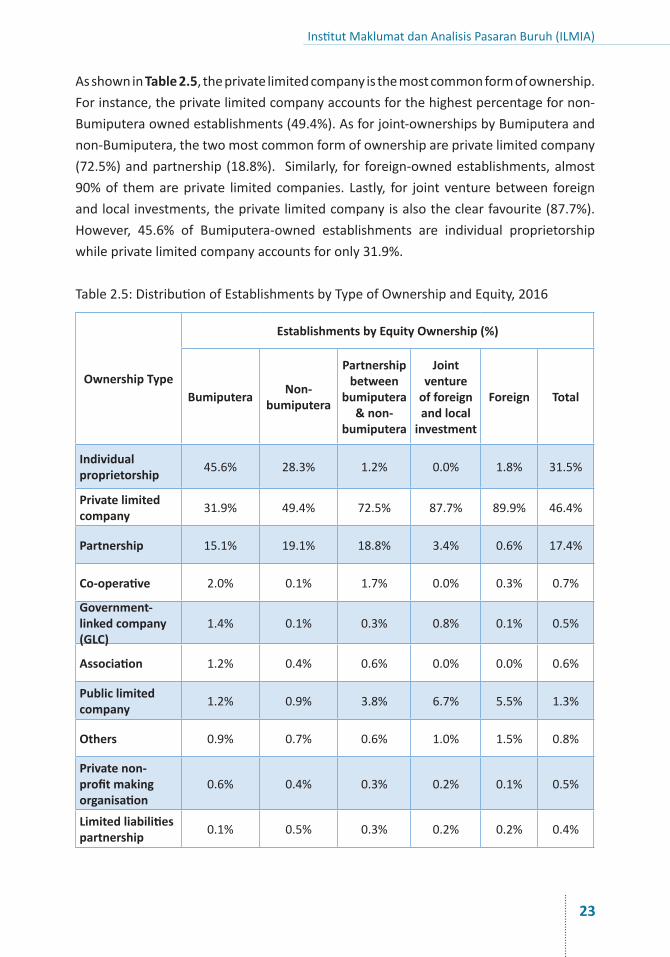
AsshowninTable 2.5,theprivatelimitedcompanyisthemostcommonformofownership.Forinstance,theprivatelimitedcompanyaccountsforthehighestpercentagefornon-Bumiputeraownedestablishments(49.4%).Asforjoint-ownershipsbyBumiputeraandnon-Bumiputera,thetwomostcommonformofownershipareprivatelimitedcompany(72.5%)andpartnership (18.8%). Similarly, for foreign-ownedestablishments,almost90%of themareprivate limitedcompanies. Lastly, for joint venturebetween foreignandlocalinvestments,theprivatelimitedcompanyisalsotheclearfavourite(87.7%).However, 45.6% of Bumiputera-owned establishments are individual proprietorshipwhileprivatelimitedcompanyaccountsforonly31.9%.
Table2.5:DistributionofEstablishmentsbyTypeofOwnershipandEquity,2016
Ownership Type
Establishments by Equity Ownership (%)
Bumiputera Non-bumiputera
Partnership between
bumiputera & non-
bumiputera
Joint venture
of foreign and local
investment
Foreign Total
Individual proprietorship 45.6% 28.3% 1.2% 0.0% 1.8% 31.5%
Private limited company 31.9% 49.4% 72.5% 87.7% 89.9% 46.4%
Partnership 15.1% 19.1% 18.8% 3.4% 0.6% 17.4%
Co-operative 2.0% 0.1% 1.7% 0.0% 0.3% 0.7%
Government-linked company (GLC)
1.4% 0.1% 0.3% 0.8% 0.1% 0.5%
Association 1.2% 0.4% 0.6% 0.0% 0.0% 0.6%
Public limited company 1.2% 0.9% 3.8% 6.7% 5.5% 1.3%
Others 0.9% 0.7% 0.6% 1.0% 1.5% 0.8%
Private non-profit making organisation
0.6% 0.4% 0.3% 0.2% 0.1% 0.5%
Limited liabilities partnership 0.1% 0.5% 0.3% 0.2% 0.2% 0.4%
National Employment Returns Report 2016
24
Ownership Type
Establishments by Equity Ownership (%)
Bumiputera Non-bumiputera
Partnership between
bumiputera & non-
bumiputera
Joint venture
of foreign and local
investment
Foreign Total
No. of Establishments (n)
61,670 128,877 9,117 2,417 3,736 205,817
EstablishmentSize
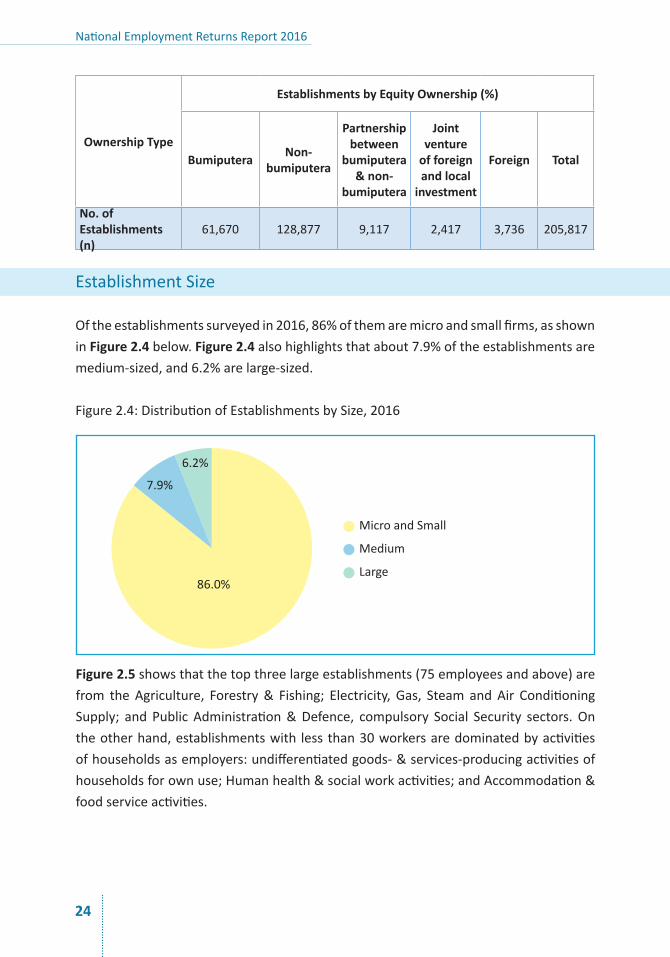
Oftheestablishmentssurveyedin2016,86%ofthemaremicroandsmallfirms,asshowninFigure 2.4below.Figure 2.4alsohighlightsthatabout7.9%oftheestablishmentsaremedium-sized,and6.2%arelarge-sized.
Figure2.4:DistributionofEstablishmentsbySize,2016
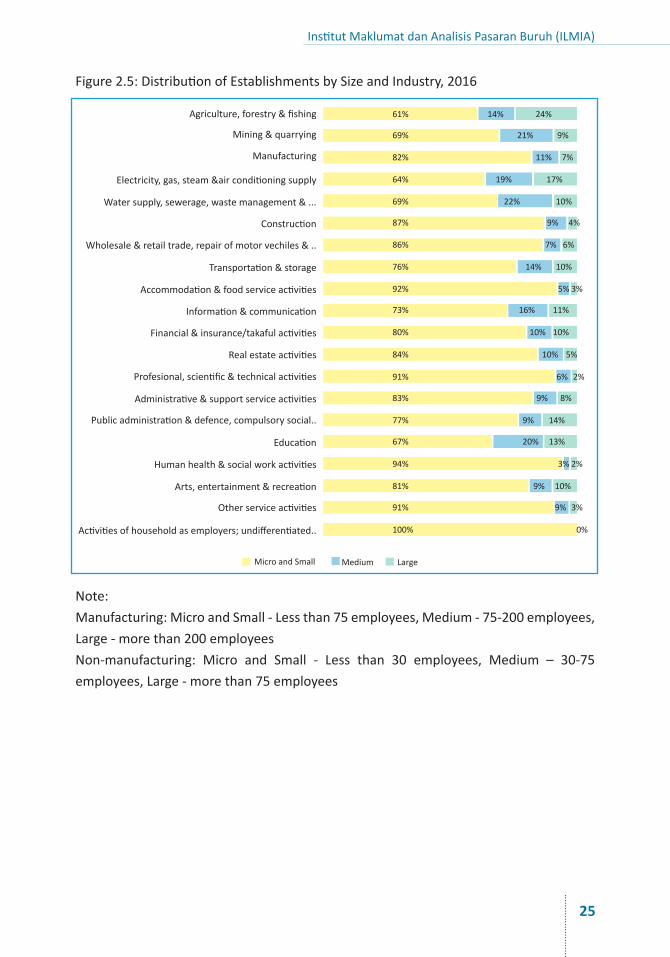
Figure 2.5showsthatthetopthreelargeestablishments(75employeesandabove)arefrom theAgriculture, Forestry& Fishing; Electricity, Gas, Steam andAir ConditioningSupply; and Public Administration&Defence, compulsory Social Security sectors.Ontheotherhand,establishmentswith lessthan30workersaredominatedbyactivitiesofhouseholdsasemployers:undifferentiatedgoods-&services-producingactivitiesofhouseholdsforownuse;Humanhealth&socialworkactivities;andAccommodation&foodserviceactivities.
86.0%
7.9%
6.2%
MicroandSmall
Medium
Large
Institut Maklumat dan Analisis Pasaran Buruh (ILMIA)
25
61%
69%
82%
64%
69%
87%
86%
76%
92%
73%
80%
84%
91%
83%
77%
67%
94%
81%
91%
MicroandSmall Medium Large
100%
14%
21%
11%
19%
22%
9%
7%
14%
5%
16%
10%
10%
6%
9%
9%
20%
3%
9%
9%
24%
9%
7%
17%
10%
4%
6%
10%
3%
11%
10%
5%
2%
8%
14%
13%
2%
10%
3%
0%
Figure2.5:DistributionofEstablishmentsbySizeandIndustry,2016
Note:Manufacturing:MicroandSmall-Lessthan75employees,Medium-75-200employees,Large-morethan200employeesNon-manufacturing: Micro and Small - Less than 30 employees, Medium – 30-75employees,Large-morethan75employees
Agriculture,forestry&fishing
Mining&quarrying
Manufacturing
Electricity,gas,steam&airconditioningsupply
Watersupply,sewerage,wastemanagement&...
Construction
Wholesale&retailtrade,repairofmotorvechiles&..
Transportation&storage
Accommodation&foodserviceactivities
Information&communication
Financial&insurance/takafulactivities
Realestateactivities
Profesional,scientific&technicalactivities
Administrative&supportserviceactivities
Publicadministration&defence,compulsorysocial..
Education
Humanhealth&socialworkactivities
Arts,entertainment&recreation
Otherserviceactivities
Activitiesofhouseholdasemployers;undifferentiated..

Institut Maklumat dan Analisis Pasaran Buruh (ILMIA)
27
3 Profile of Employees
ThischapteranalysestheprofileoftheemployeesintheNER2016survey.Someofthekeydemographiccharacteristicssuchasgender,nationalityandoccupationalcategoryarediscussedinthischapter.
3.1 EmploymentSize
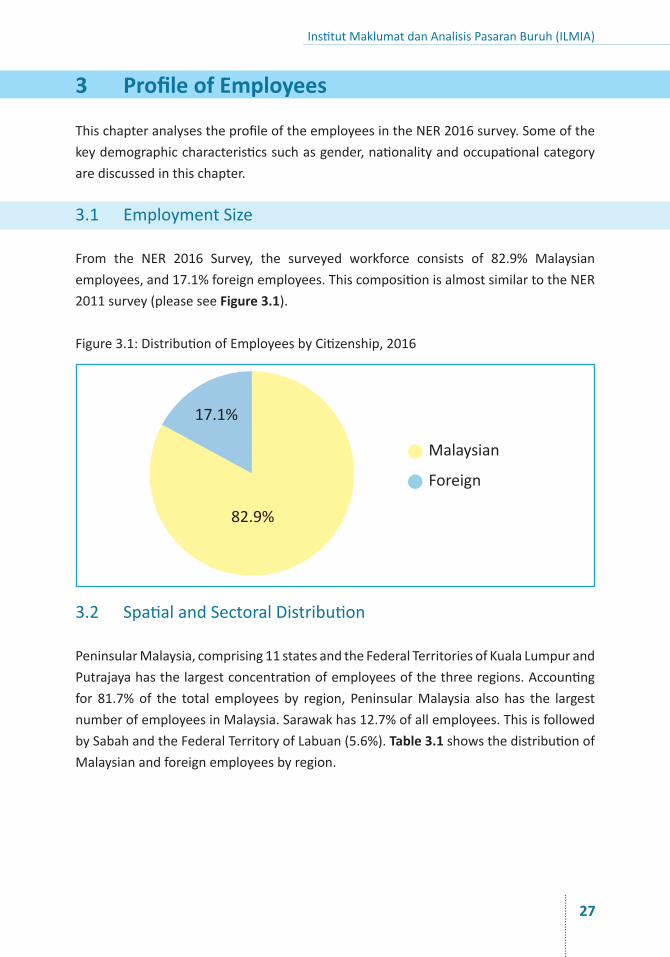
From the NER 2016 Survey, the surveyed workforce consists of 82.9% Malaysianemployees,and17.1%foreignemployees.ThiscompositionisalmostsimilartotheNER2011survey(pleaseseeFigure 3.1).
Figure3.1:DistributionofEmployeesbyCitizenship,2016
17.1%
82.9%
Malaysian
Foreign
3.2 SpatialandSectoralDistribution
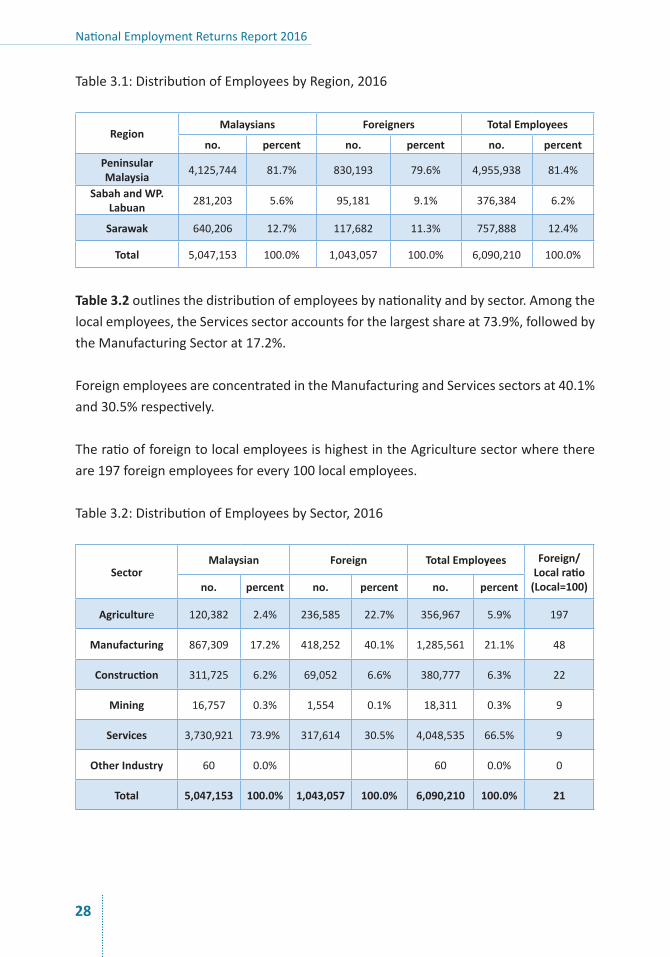
PeninsularMalaysia,comprising11statesandtheFederalTerritoriesofKualaLumpurandPutrajayahasthelargestconcentrationofemployeesofthethreeregions.Accountingfor 81.7%of the total employees by region, PeninsularMalaysia also has the largestnumberofemployeesinMalaysia.Sarawakhas12.7%ofallemployees.ThisisfollowedbySabahandtheFederalTerritoryofLabuan(5.6%).Table 3.1showsthedistributionofMalaysianandforeignemployeesbyregion.
National Employment Returns Report 2016
28
Table3.1:DistributionofEmployeesbyRegion,2016
RegionMalaysians Foreigners Total Employees
no. percent no. percent no. percentPeninsular Malaysia 4,125,744 81.7% 830,193 79.6% 4,955,938 81.4%
Sabah and WP. Labuan 281,203 5.6% 95,181 9.1% 376,384 6.2%
Sarawak 640,206 12.7% 117,682 11.3% 757,888 12.4%
Total 5,047,153 100.0% 1,043,057 100.0% 6,090,210 100.0%
Table 3.2outlinesthedistributionofemployeesbynationalityandbysector.Amongthelocalemployees,theServicessectoraccountsforthelargestshareat73.9%,followedbytheManufacturingSectorat17.2%.
ForeignemployeesareconcentratedintheManufacturingandServicessectorsat40.1%and30.5%respectively.
TheratioofforeigntolocalemployeesishighestintheAgriculturesectorwherethereare197foreignemployeesforevery100localemployees.
Table3.2:DistributionofEmployeesbySector,2016
SectorMalaysian Foreign Total Employees Foreign/
Local ratio (Local=100)no. percent no. percent no. percent
Agriculture 120,382 2.4% 236,585 22.7% 356,967 5.9% 197
Manufacturing 867,309 17.2% 418,252 40.1% 1,285,561 21.1% 48
Construction 311,725 6.2% 69,052 6.6% 380,777 6.3% 22
Mining 16,757 0.3% 1,554 0.1% 18,311 0.3% 9
Services 3,730,921 73.9% 317,614 30.5% 4,048,535 66.5% 9
Other Industry 60 0.0% 60 0.0% 0
Total 5,047,153 100.0% 1,043,057 100.0% 6,090,210 100.0% 21
Institut Maklumat dan Analisis Pasaran Buruh (ILMIA)
29
11.5%
2.0% 10
.4%
2.3% 7.2
%
0.7%
18.4%
0.9%
23.1%
8.0%
0.5% 4.9
%5.3% 7.3
% 10.1%
26.3%
13.6%
47.7%
Malaysian
Managers Professionals Technicials&AssociateProfessional
ClericalSupportWorkers
ServiceandSalesworkers
SkilledAgricultural,Forestry,Livestock&FisherWorkers
Craft&RelatedTradesWorkers
Plant&Machine
Operations,&Assemblers
ElementaryOccupations
Foreign
3.3 OccupationalStructure
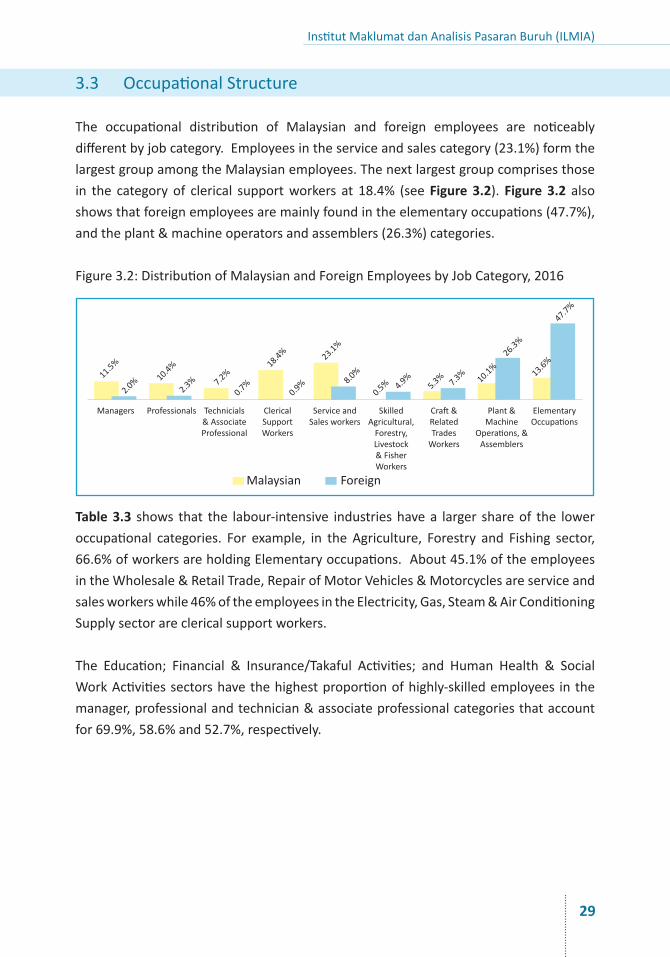
The occupational distribution of Malaysian and foreign employees are noticeablydifferentbyjobcategory.Employeesintheserviceandsalescategory(23.1%)formthelargestgroupamongtheMalaysianemployees.Thenextlargestgroupcomprisesthosein the categoryof clerical supportworkers at 18.4% (seeFigure 3.2).Figure 3.2 alsoshowsthatforeignemployeesaremainlyfoundintheelementaryoccupations(47.7%),andtheplant&machineoperatorsandassemblers(26.3%)categories.
Figure3.2:DistributionofMalaysianandForeignEmployeesbyJobCategory,2016
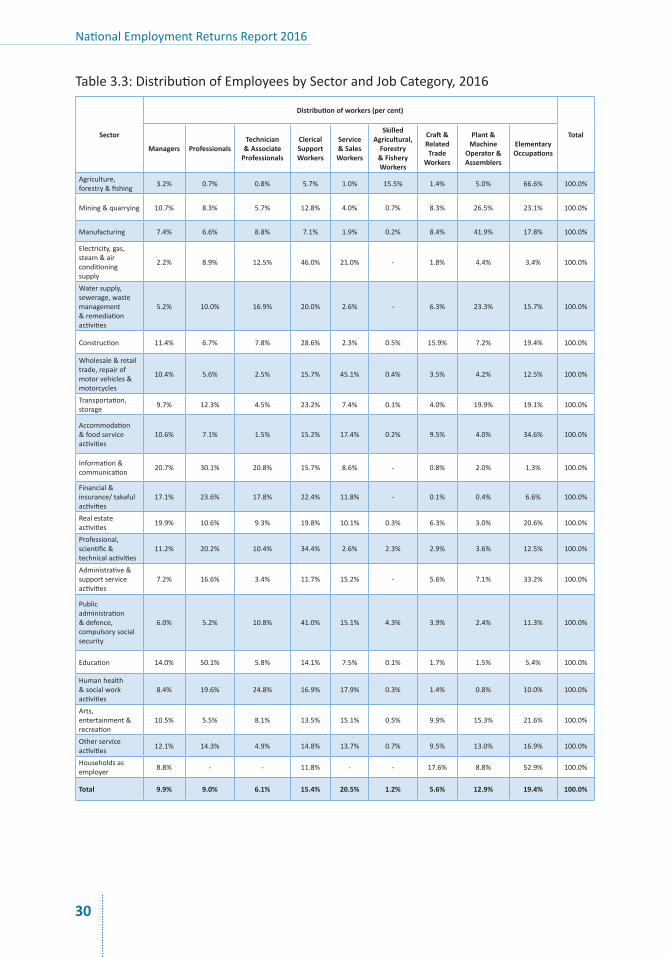
Table 3.3 shows that the labour-intensive industrieshavea larger shareof the loweroccupational categories. For example, in the Agriculture, Forestry and Fishing sector,66.6%ofworkersareholdingElementaryoccupations.About45.1%oftheemployeesintheWholesale&RetailTrade,RepairofMotorVehicles&Motorcyclesareserviceandsalesworkerswhile46%oftheemployeesintheElectricity,Gas,Steam&AirConditioningSupplysectorareclericalsupportworkers.
The Education; Financial & Insurance/Takaful Activities; and Human Health & SocialWorkActivitiessectorshavethehighestproportionofhighly-skilledemployees inthemanager,professionalandtechnician&associateprofessionalcategoriesthataccountfor69.9%,58.6%and52.7%,respectively.
National Employment Returns Report 2016
30
Table3.3:DistributionofEmployeesbySectorandJobCategory,2016
Sector
Distribution of workers (per cent)
Total
Managers ProfessionalsTechnician
& Associate Professionals
Clerical Support Workers
Service & Sales Workers
Skilled Agricultural,
Forestry & Fishery Workers
Craft & Related Trade
Workers
Plant & Machine
Operator & Assemblers
Elementary Occupations
Agriculture,forestry&fishing 3.2% 0.7% 0.8% 5.7% 1.0% 15.5% 1.4% 5.0% 66.6% 100.0%
Mining&quarrying 10.7% 8.3% 5.7% 12.8% 4.0% 0.7% 8.3% 26.5% 23.1% 100.0%
Manufacturing 7.4% 6.6% 8.8% 7.1% 1.9% 0.2% 8.4% 41.9% 17.8% 100.0%
Electricity,gas,steam&airconditioningsupply
2.2% 8.9% 12.5% 46.0% 21.0% - 1.8% 4.4% 3.4% 100.0%
Watersupply,sewerage,wastemanagement&remediationactivities
5.2% 10.0% 16.9% 20.0% 2.6% - 6.3% 23.3% 15.7% 100.0%
Construction 11.4% 6.7% 7.8% 28.6% 2.3% 0.5% 15.9% 7.2% 19.4% 100.0%
Wholesale&retailtrade,repairofmotorvehicles&motorcycles
10.4% 5.6% 2.5% 15.7% 45.1% 0.4% 3.5% 4.2% 12.5% 100.0%
Transportation,storage 9.7% 12.3% 4.5% 23.2% 7.4% 0.1% 4.0% 19.9% 19.1% 100.0%
Accommodation&foodserviceactivities
10.6% 7.1% 1.5% 15.2% 17.4% 0.2% 9.5% 4.0% 34.6% 100.0%
Information&communication 20.7% 30.1% 20.8% 15.7% 8.6% - 0.8% 2.0% 1.3% 100.0%
Financial&insurance/takafulactivities
17.1% 23.6% 17.8% 22.4% 11.8% - 0.1% 0.4% 6.6% 100.0%
Realestateactivities 19.9% 10.6% 9.3% 19.8% 10.1% 0.3% 6.3% 3.0% 20.6% 100.0%
Professional,scientific&technicalactivities
11.2% 20.2% 10.4% 34.4% 2.6% 2.3% 2.9% 3.6% 12.5% 100.0%
Administrative&supportserviceactivities
7.2% 16.6% 3.4% 11.7% 15.2% - 5.6% 7.1% 33.2% 100.0%
Publicadministration&defence,compulsorysocialsecurity
6.0% 5.2% 10.8% 41.0% 15.1% 4.3% 3.9% 2.4% 11.3% 100.0%
Education 14.0% 50.1% 5.8% 14.1% 7.5% 0.1% 1.7% 1.5% 5.4% 100.0%
Humanhealth&socialworkactivities
8.4% 19.6% 24.8% 16.9% 17.9% 0.3% 1.4% 0.8% 10.0% 100.0%
Arts,entertainment&recreation
10.5% 5.5% 8.1% 13.5% 15.1% 0.5% 9.9% 15.3% 21.6% 100.0%
Otherserviceactivities 12.1% 14.3% 4.9% 14.8% 13.7% 0.7% 9.5% 13.0% 16.9% 100.0%
Householdsasemployer 8.8% - - 11.8% - - 17.6% 8.8% 52.9% 100.0%
Total 9.9% 9.0% 6.1% 15.4% 20.5% 1.2% 5.6% 12.9% 19.4% 100.0%
Institut Maklumat dan Analisis Pasaran Buruh (ILMIA)
31
3.4 Gender
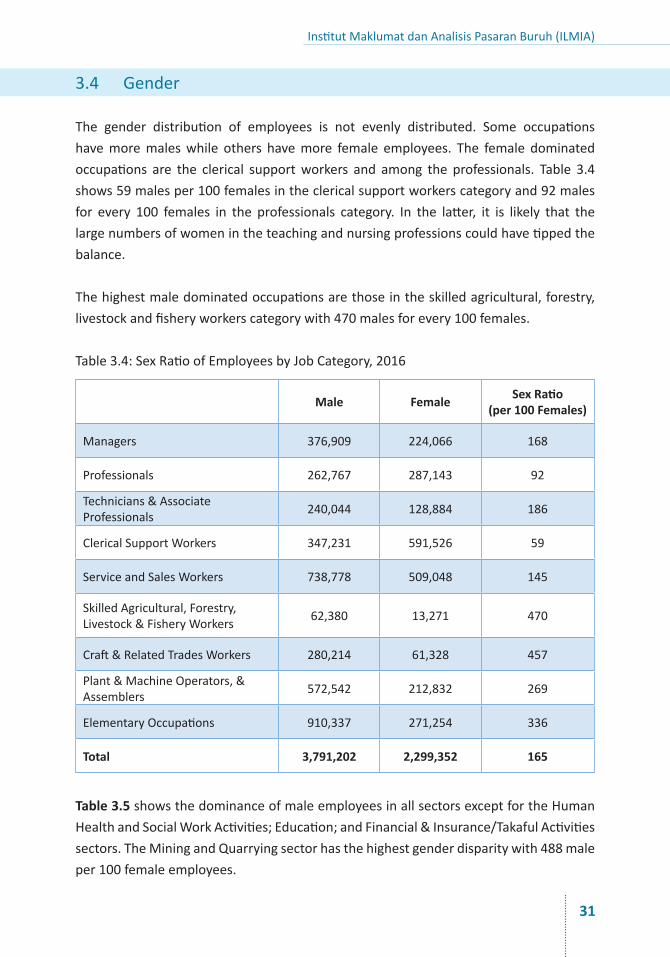
The gender distribution of employees is not evenly distributed. Some occupationshavemoremaleswhile others havemore female employees. The female dominatedoccupations are the clerical supportworkers and among the professionals. Table 3.4shows59malesper100femalesintheclericalsupportworkerscategoryand92malesfor every 100 females in the professionals category. In the latter, it is likely that thelargenumbersofwomenintheteachingandnursingprofessionscouldhavetippedthebalance.
Thehighestmaledominatedoccupationsarethoseintheskilledagricultural,forestry,livestockandfisheryworkerscategorywith470malesforevery100females.
Table3.4:SexRatioofEmployeesbyJobCategory,2016
Male Female Sex Ratio(per 100 Females)
Managers 376,909 224,066 168
Professionals 262,767 287,143 92
Technicians&AssociateProfessionals 240,044 128,884 186
ClericalSupportWorkers 347,231 591,526 59
ServiceandSalesWorkers 738,778 509,048 145
SkilledAgricultural,Forestry,Livestock&FisheryWorkers 62,380 13,271 470
Craft&RelatedTradesWorkers 280,214 61,328 457
Plant&MachineOperators,&Assemblers 572,542 212,832 269
ElementaryOccupations 910,337 271,254 336
Total 3,791,202 2,299,352 165
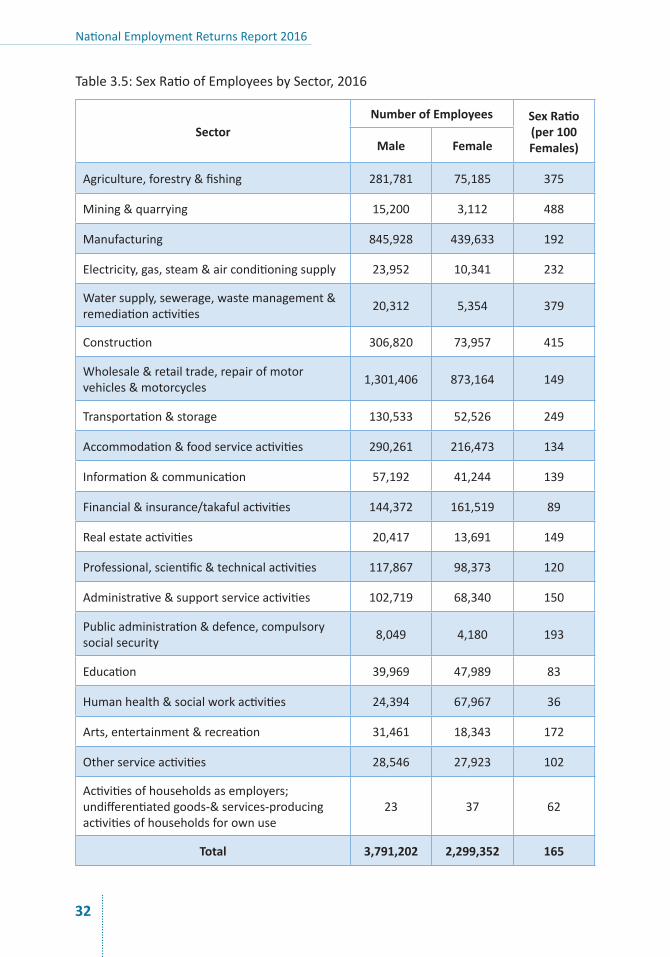
Table 3.5showsthedominanceofmaleemployeesinallsectorsexceptfortheHumanHealthandSocialWorkActivities;Education;andFinancial&Insurance/TakafulActivitiessectors.TheMiningandQuarryingsectorhasthehighestgenderdisparitywith488maleper100femaleemployees.
National Employment Returns Report 2016
32
Table3.5:SexRatioofEmployeesbySector,2016
SectorNumber of Employees Sex Ratio
(per 100 Females)Male Female
Agriculture,forestry&fishing 281,781 75,185 375
Mining&quarrying 15,200 3,112 488
Manufacturing 845,928 439,633 192
Electricity,gas,steam&airconditioningsupply 23,952 10,341 232
Watersupply,sewerage,wastemanagement&remediationactivities 20,312 5,354 379
Construction 306,820 73,957 415
Wholesale&retailtrade,repairofmotorvehicles&motorcycles 1,301,406 873,164 149
Transportation&storage 130,533 52,526 249
Accommodation&foodserviceactivities 290,261 216,473 134
Information&communication 57,192 41,244 139
Financial&insurance/takafulactivities 144,372 161,519 89
Realestateactivities 20,417 13,691 149
Professional,scientific&technicalactivities 117,867 98,373 120
Administrative&supportserviceactivities 102,719 68,340 150
Publicadministration&defence,compulsorysocialsecurity 8,049 4,180 193
Education 39,969 47,989 83
Humanhealth&socialworkactivities 24,394 67,967 36
Arts,entertainment&recreation 31,461 18,343 172
Otherserviceactivities 28,546 27,923 102
Activitiesofhouseholdsasemployers;undifferentiatedgoods-&services-producingactivitiesofhouseholdsforownuse
23 37 62
Total 3,791,202 2,299,352 165
Institut Maklumat dan Analisis Pasaran Buruh (ILMIA)
33
4 Salary and Compensations
4.1 Introduction
Companiespaytheiremployeesindifferentways.Abasicsalaryorwageistheagreedpricethatanemployerwouldpayhisemployeetoworkunderspecificconditionsandresponsibilities.
Apart from basic salary, there are other forms of payment, such as performancebonuseswhichareincentivestoincreaseproductivityorallowancestosupplementtheemployees’salaryduetojobrequirement.(Notethattherearealsonon-cashpaymentsuchasleave,insurance,training,etc.)
Thischapterreportsontheminimumandmaximumbasicsalary,currentbasicsalaryandvariouscomponentsofpaypracticesbytheestablishments.Amongthecomponentsdescribedarebasicsalarydifferentialbyregion,jobcategoryandgender.
Theanalysis also includes current salariesby job category,which reflects the currentsituationofthelabourmarket.
WiththelatestreviewoftheminimumwagepolicythatcameintoeffectJuly2016,theminimumwageisRM1,000inPeninsularMalaysia,andRM920inSabahandSarawak.
4.2 MinimumandMaximumBasicSalaryofMalaysianEmployees
InMalaysia,thesalarystructurehasshiftedupwards,possiblyduetotheimpactfrombothMinimumWagepolicyaswellastheEconomicTransformationProgramme(ETP).Inthissection,weshallreportthemediansalary,andalsobasicsalaryandtotalsalary(whichincludesperformancepayaswellasbenefitsandfixedallowances).Themedianis the salarywhere 50%of thefirms that respondpay less than this salary and50%paymorethanit.Ifthereareextremevaluesinthesalariesreported,thenthemedianprovidesthehalf-waypointandisNOTinfluencedbytheextremes.Anillustrationmaybehelpful.Letussaythereare3managersandtheirsalariesare:RM2,000,RM3,000andRM10,000.ThemeansalarywouldbeRM5,000(whichisthesumofallthreesalariesdivided by 3). Themedian salary is the 50%point,which is RM3,000.Note that themediansalaryisnotaffectedbythelow(RM2,000)andhighvalue(RM10,000),unlikethemean.Theimportantpointhereisthatthemediansalaryisthemid-pointofsalariespaidbyfirms,butitisnotthemeanofsalariesforaparticularoccupation.
National Employment Returns Report 2016
34
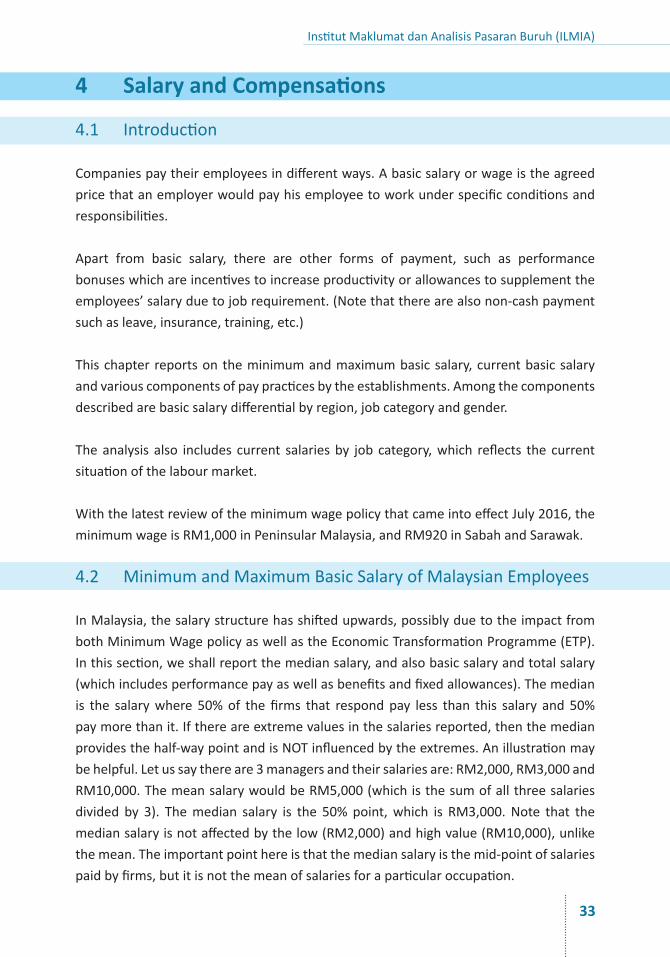
Figure 4.1showsthebasicsalaryrangepaidbyfirmsfordifferentjobsoroccupationalcategories. Salaryrangeistherangeofwagespaidbyemployers,fromthelowesttothehighestforaparticularjoboroccupation,oralternatively,astarting(i.e.minimum)andamaximumbasicsalary.
ThemedianstartingsalaryformanagersisRM4,000(i.e.50%offirmspaidtheirmanagersa startingsalary less thanRM4,000and50%offirmspaid theirmanagersmore thanRM4,000)whilethemedianmaximumsalaryisRM5,210.Forprofessionals,thestartingandmaximummedianbasicsalaryrangesfromRM2,800toRM5,000.
Forloweroccupationalgroups,themaximumbasicsalaryforserviceandsalesworkers,skilledagricultural,forestry,livestockandfisheryworkersandplant&machineoperators,andassemblersissimilar,whichisRM2,000.
Forthosewhoareundertheelementaryoccupationscategory,theirmaximummedianbasicsalaryatRM1,350,whichisthelowestamongalloccupationalcategories.
Figure4.1:StartingandMaximumMedianBasicSalaryofFirmsforMalaysianEmployeesbyJobCategory
5,210
0
1,000
2,000
3,000
4,000
5,000
6,000
5,210
4,000
4,000
2,000
2,000
2,000
2,000
2,000
2,000
2,000
2,000
1,350
1,350
900
900
2,800
2,800
3,600
3,600
2,100
2,100
2,410
2,410
1,300
1,300
1,000
1,000
1,100
1,100
1,200
1,200
1,200
1,200
5,000
5,000
Managers
MaximumSalary
Startin
gan
dMaxim
umM
onthlyBasic
Salary(R
M)
StartingSalary
ProfessionalsTechnicials&AssociateProfessional
ClericalSupportWorkers
ServiceandSalesworkers
SkilledAgricultural,Forestry,Livestock&FisherWorkers
Craft&RelatedTradesWorkers
Plant&Machine
Operations,&
Assemblers
ElementaryOccupations
Institut Maklumat dan Analisis Pasaran Buruh (ILMIA)
35
4.2.1 JobCategoryMASCO2Digit
4.2.1.1Managers
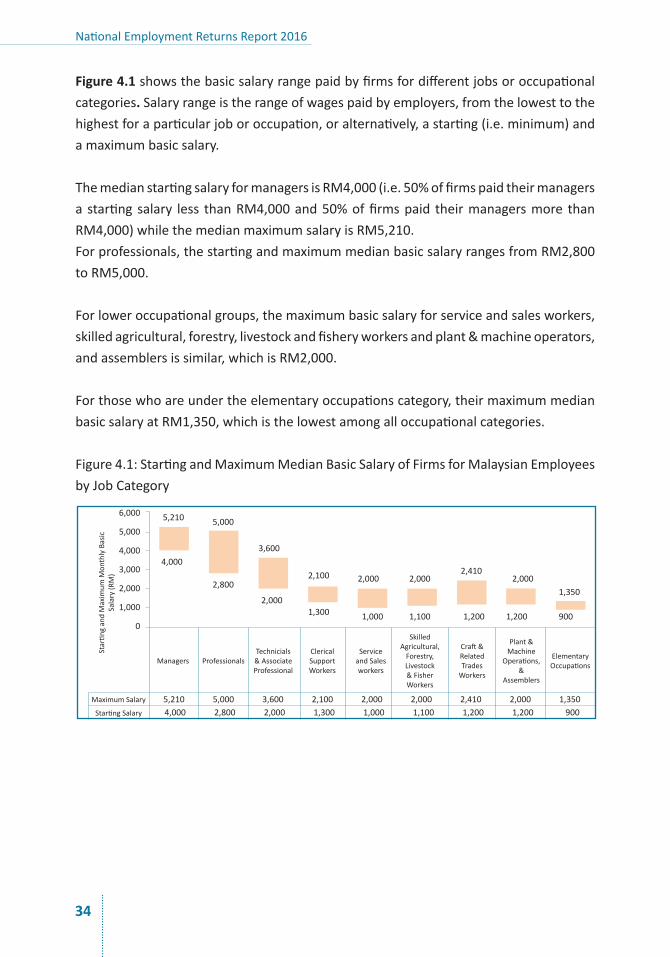
TheNER2016collectedoccupationaldataattheMASCO2Digitlevel.Figure 4.2showsthemedianstartingmonthlybasicsalaryforvarioustypesofmanagers.
Information& Communications TechnologyManagers receive RM7,000,which is thehighest medianmaximummonthly basic salary. However, the starting salary for ICTManagers at RM4,680, which is lower than the starting salary for Chief Executives,SeniorOfficials&Legislators,(RM5,000).ThemaximumsalaryforservicesmanagersatRM4,000permonthanditisthelowestmaximummediansalaryforallmanagersintheNER2016.
Figure4.2:MedianStartingandMaximumMonthlyBasicSalaryofFirmsforManagersbyMASCO2D
4.2.1.2Professionals
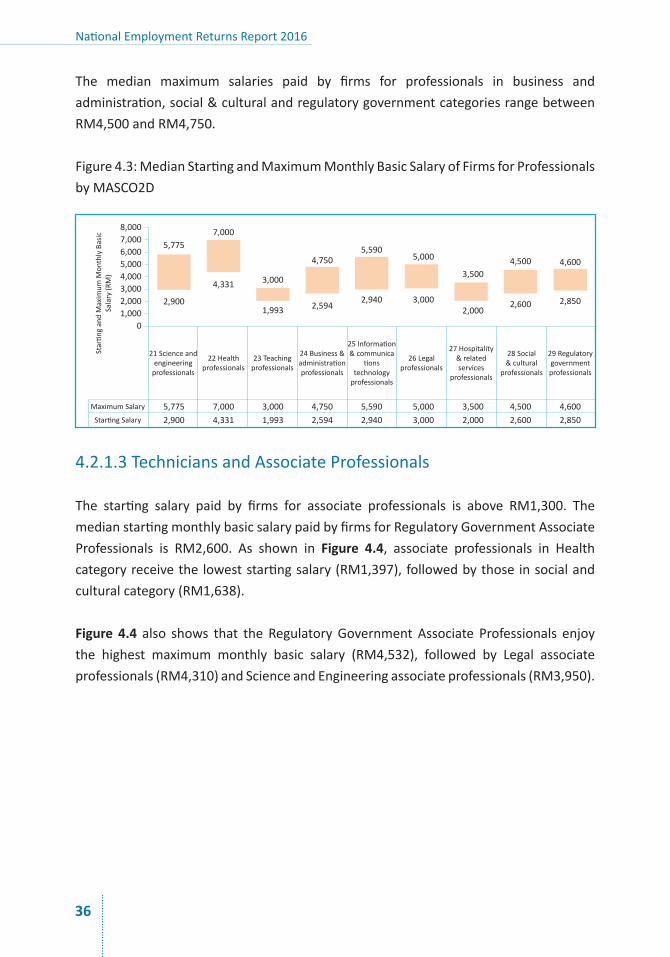
Themedian startingmonthly basic salary paidbyfirms for professionals is notmorethanRM3,000,exceptforhealthprofessionals,whoreceiveRM4,331(seeFigure 4.3).Thehealthprofessionalsalsoenjoythehighestmaximummonthlybasicsalary,whichisRM7,000.
TeachingprofessionalsreceiveonlyRM3,000astheirmedianmaximummonthlybasicsalary,whichisthelowestamongallprofessionals,enumeratedintheNER2016.
5,000
5,000
6,000
6,000
7,000
7,000
5,250
5,250
5,500
5,500
4,200
4,200
3,000
3,000
3,000
3,000
4,000
4,000
4,000
4,000
4,680
4,680
3,600
3,600MaximumSalary
Startin
gan
dMaxim
umM
onthlyBasic
Salary(R
M)
StartingSalary
11Chiefexecutives,seniorofficials&
legislators
12Administrative&commercialmanagers
13Production&manufacturing
mangers
14Hospitality,retail&otherservices
manager
15Information&communications
technologymanagers
16Servicesmanagers
0
1,000
2,000
3,000
4,000
5,000
6,000
7,000
8,000
National Employment Returns Report 2016
36
The median maximum salaries paid by firms for professionals in business andadministration,social&culturalandregulatorygovernmentcategoriesrangebetweenRM4,500andRM4,750.
Figure4.3:MedianStartingandMaximumMonthlyBasicSalaryofFirmsforProfessionalsbyMASCO2D
4.2.1.3TechniciansandAssociateProfessionals
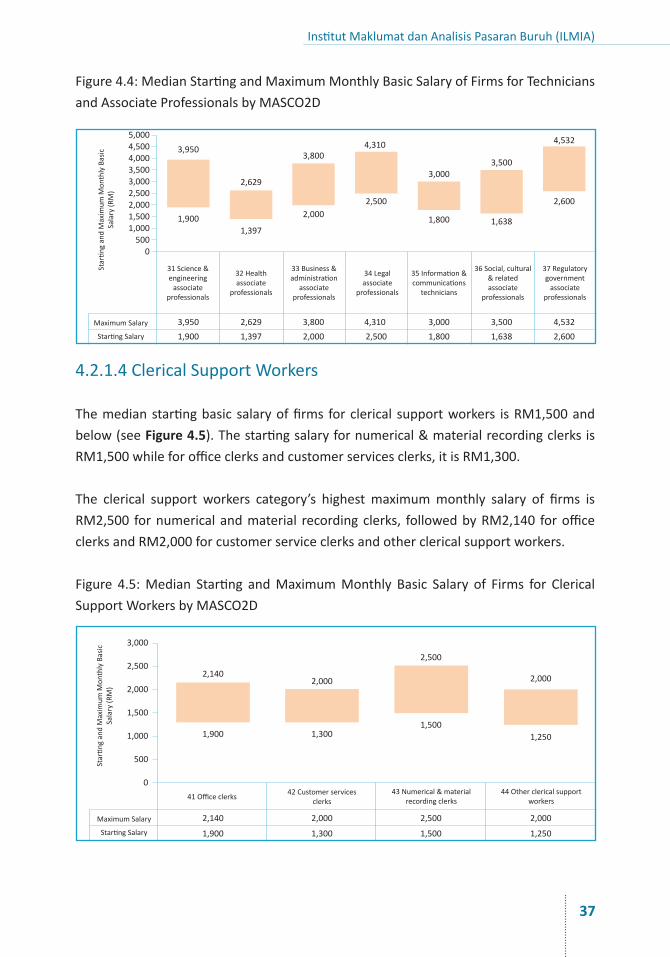
The starting salary paid by firms for associate professionals is above RM1,300. ThemedianstartingmonthlybasicsalarypaidbyfirmsforRegulatoryGovernmentAssociateProfessionals is RM2,600. As shown in Figure 4.4, associate professionals in Healthcategoryreceivetheloweststartingsalary(RM1,397),followedbythoseinsocialandculturalcategory(RM1,638).
Figure 4.4 also shows that the RegulatoryGovernmentAssociate Professionals enjoythe highest maximum monthly basic salary (RM4,532), followed by Legal associateprofessionals(RM4,310)andScienceandEngineeringassociateprofessionals(RM3,950).
5,775
5,775
7,000
7,000
4,331
4,331
3,000
3,000
3,000
3,000
5,000
5,000
3,500
3,500
4,500
4,500
2,600
2,600
4,600
4,600
2,850
2,850
2,000
2,000
1,993
1,993
4,750
4,750
2,594
2,594
5,590
5,590
2,940
2,940
2,900
2,900MaximumSalary
Startin
gan
dMaxim
umM
onthlyBasic
Salary(R
M)
StartingSalary
01,0002,0003,0004,0005,0006,0007,0008,000
21Scienceandengineeringprofessionals
22Healthprofessionals
23Teachingprofessionals
24Business&administrationprofessionals
26Legalprofessionals
27Hospitality&relatedservices
professionals
28Social&cultural
professionals
29Regulatorygovernmentprofessionals
25Information&communica
tionstechnologyprofessionals
Institut Maklumat dan Analisis Pasaran Buruh (ILMIA)
37
Figure4.4:MedianStartingandMaximumMonthlyBasicSalaryofFirmsforTechniciansandAssociateProfessionalsbyMASCO2D
4.2.1.4ClericalSupportWorkers
Themedianstartingbasic salaryoffirms forclerical supportworkers isRM1,500andbelow(seeFigure 4.5).Thestartingsalaryfornumerical&materialrecordingclerksisRM1,500whileforofficeclerksandcustomerservicesclerks,itisRM1,300.
The clerical support workers category’s highest maximummonthly salary of firms isRM2,500 fornumericalandmaterial recordingclerks, followedbyRM2,140 forofficeclerksandRM2,000forcustomerserviceclerksandotherclericalsupportworkers.
Figure 4.5:Median Starting andMaximumMonthly Basic Salary of Firms for ClericalSupportWorkersbyMASCO2D
3,950
3,950
2,629
2,629
1,397
1,397
3,800
3,800
2,000
2,000
4,310
4,310
2,500
2,500
3,000
3,000
1,800
1,800
3,500
3,500
1,638
1,638
4,532
4,532
2,600
2,600
1,900
2,140
2,140
2,000
2,000
2,000
2,000
2,500
2,500
1,900
1,900
1,300
1,300
1,500
1,500
1,250
1,250
1,900MaximumSalary
MaximumSalary
Startin
gan
dMaxim
umM
onthlyBasic
Salary(R
M)
Startin
gan
dMaxim
umM
onthlyBasic
Salary(R
M)
StartingSalary
StartingSalary
0
0
500
500
1,000
1,000
1,500
1,500
2,000
2,000
2,500
2,500
3,000
3,000
3,5004,0004,5005,000
31Science&engineeringassociate
professionals
41Officeclerks 42Customerservicesclerks
43Numerical&materialrecordingclerks
44Otherclericalsupportworkers
32Healthassociate
professionals
33Business&administration
associateprofessionals
34Legalassociate
professionals
35Information&communications
technicians
36Social,cultural&relatedassociate
professionals
37Regulatorygovernmentassociate
professionals
National Employment Returns Report 2016
38
4.2.1.5ServiceandSalesWorkers
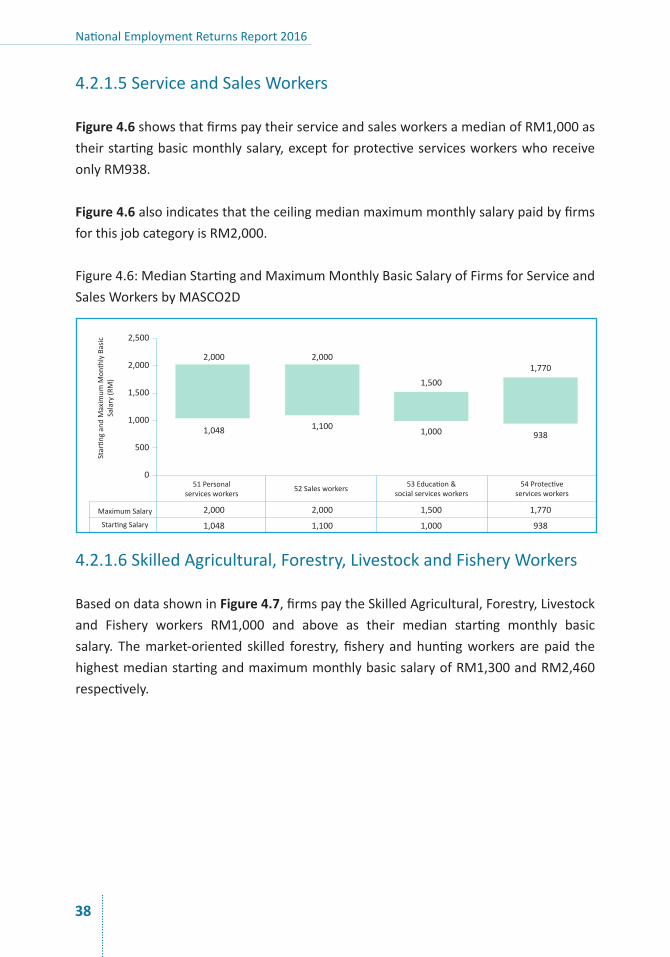
Figure 4.6showsthatfirmspaytheirserviceandsalesworkersamedianofRM1,000astheirstartingbasicmonthlysalary,exceptforprotectiveservicesworkerswhoreceiveonlyRM938.
Figure 4.6alsoindicatesthattheceilingmedianmaximummonthlysalarypaidbyfirmsforthisjobcategoryisRM2,000.
Figure4.6:MedianStartingandMaximumMonthlyBasicSalaryofFirmsforServiceandSalesWorkersbyMASCO2D
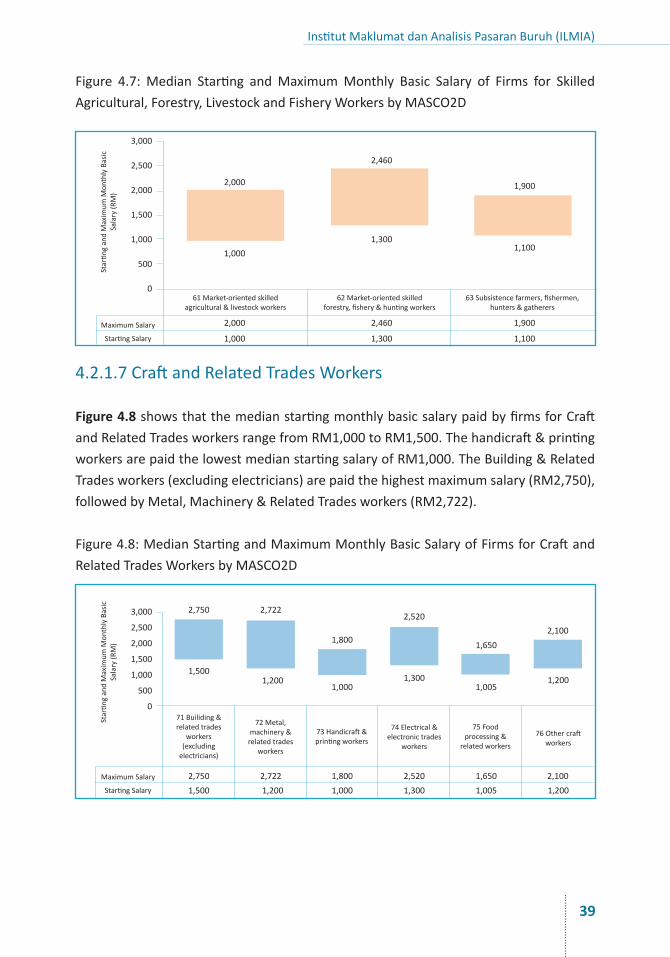
4.2.1.6SkilledAgricultural,Forestry,LivestockandFisheryWorkers
BasedondatashowninFigure 4.7,firmspaytheSkilledAgricultural,Forestry,Livestockand Fishery workers RM1,000 and above as their median starting monthly basicsalary. Themarket-oriented skilled forestry, fishery andhuntingworkers arepaid thehighestmedianstartingandmaximummonthlybasicsalaryofRM1,300andRM2,460respectively.
2,000
2,000
2,000
2,000
1,500
1,500
1,770
1,770
938
938
1,000
1,000
1,048
1,048
1,100
1,100
MaximumSalary
Startin
gan
dMaxim
umM
onthlyBasic
Salary(R
M)
StartingSalary
0
500
1,000
1,500
2,000
2,500
51Personalservicesworkers
52Salesworkers 53Education&socialservicesworkers
54Protectiveservicesworkers
Institut Maklumat dan Analisis Pasaran Buruh (ILMIA)
39
Figure 4.7:Median Starting andMaximumMonthly Basic Salary of Firms for SkilledAgricultural,Forestry,LivestockandFisheryWorkersbyMASCO2D
4.2.1.7CraftandRelatedTradesWorkers
Figure 4.8showsthatthemedianstartingmonthlybasicsalarypaidbyfirmsforCraftandRelatedTradesworkersrangefromRM1,000toRM1,500.Thehandicraft&printingworkersarepaidthelowestmedianstartingsalaryofRM1,000.TheBuilding&RelatedTradesworkers(excludingelectricians)arepaidthehighestmaximumsalary(RM2,750),followedbyMetal,Machinery&RelatedTradesworkers(RM2,722).
Figure4.8:MedianStartingandMaximumMonthlyBasicSalaryofFirmsforCraftandRelatedTradesWorkersbyMASCO2D
2,000
2,000
2,460
2,460
1,300
1,300
1,900
1,900
1,100
1,100
1,000
2,750
2,750
2,722
2,722
2,520
2,520
2,100
2,100
1,500
1,500
1,200
1,200
1,800
1,800
1,650
1,650
1,005
1,005
1,200
1,200
1,000
1,000
1,300
1,300
1,000MaximumSalary
MaximumSalary
Startin
gan
dMaxim
umM
onthlyBasic
Salary(R
M)
Startin
gan
dMaxim
umM
onthlyBasic
Salary(R
M)
StartingSalary
StartingSalary
0
0
500
500
1,000
1,000
1,500
1,500
2,000
2,000
2,500
2,500
3,000
3,000
61Market-orientedskilledagricultural&livestockworkers
71Builiding&relatedtrades
workers(excludingelectricians)
72Metal,machinery&relatedtrades
workers
73Handicraft&printingworkers
74Electrical&electronictrades
workers
75Foodprocessing&
relatedworkers
76Othercraftworkers
62Market-orientedskilledforestry,fishery&huntingworkers
63Subsistencefarmers,fishermen,hunters&gatherers
National Employment Returns Report 2016
40
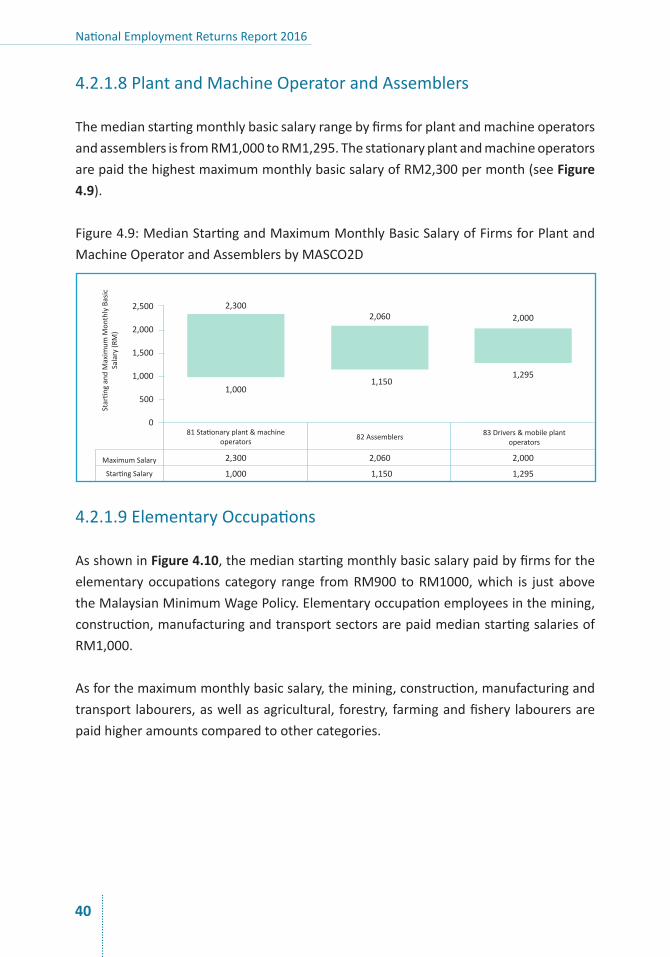
4.2.1.8PlantandMachineOperatorandAssemblers
ThemedianstartingmonthlybasicsalaryrangebyfirmsforplantandmachineoperatorsandassemblersisfromRM1,000toRM1,295.ThestationaryplantandmachineoperatorsarepaidthehighestmaximummonthlybasicsalaryofRM2,300permonth(seeFigure 4.9).
Figure4.9:MedianStartingandMaximumMonthlyBasicSalaryofFirmsforPlantandMachineOperatorandAssemblersbyMASCO2D
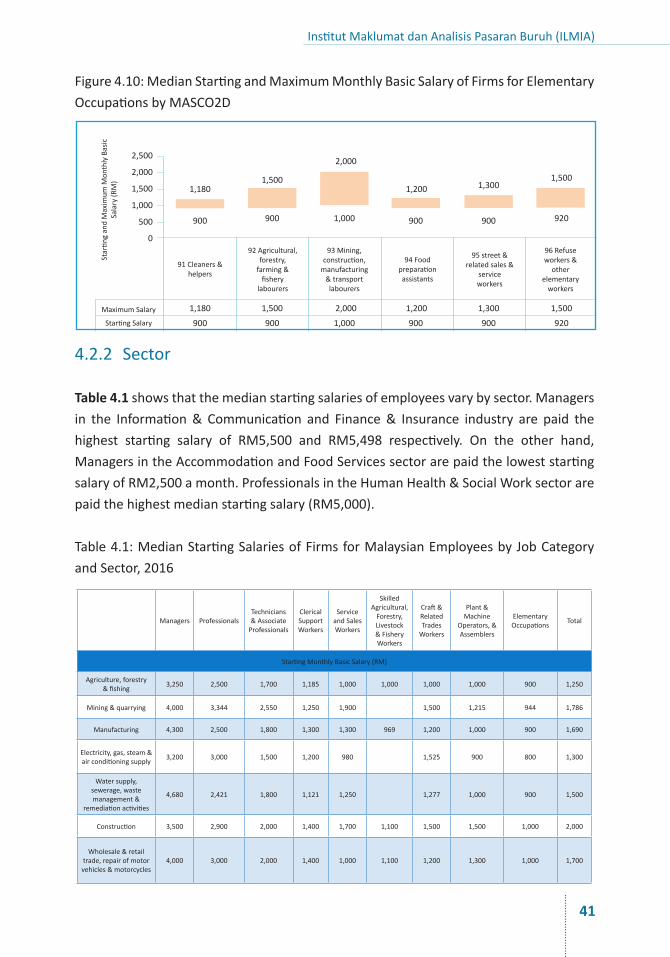
4.2.1.9ElementaryOccupations
AsshowninFigure 4.10,themedianstartingmonthlybasicsalarypaidbyfirmsfortheelementaryoccupations category range fromRM900 toRM1000,which is just abovetheMalaysianMinimumWagePolicy.Elementaryoccupationemployeesinthemining,construction,manufacturingandtransportsectorsarepaidmedianstartingsalariesofRM1,000.
Asforthemaximummonthlybasicsalary,themining,construction,manufacturingandtransport labourers,aswellasagricultural, forestry, farmingandfishery labourersarepaidhigheramountscomparedtoothercategories.
2,300
2,300
2,060
2,060
2,000
2,000
1,000
1,000
1,150
1,150
1,295
1,295MaximumSalary
Startin
gan
dMaxim
umM
onthlyBasic
Salary(R
M)
StartingSalary
0
500
1,000
1,500
2,000
2,500
81Stationaryplant&machineoperators 82Assemblers 83Drivers&mobileplant
operators
Institut Maklumat dan Analisis Pasaran Buruh (ILMIA)
41
Managers ProfessionalsTechnicians&AssociateProfessionals
ClericalSupportWorkers
ServiceandSalesWorkers
SkilledAgricultural,Forestry,Livestock&FisheryWorkers
Craft&RelatedTradesWorkers
Plant&Machine
Operators,&Assemblers
ElementaryOccupations Total
StartingMonthlyBasicSalary(RM)
Agriculture,forestry&fishing 3,250 2,500 1,700 1,185 1,000 1,000 1,000 1,000 900 1,250
Mining&quarrying 4,000 3,344 2,550 1,250 1,900 1,500 1,215 944 1,786
Manufacturing 4,300 2,500 1,800 1,300 1,300 969 1,200 1,000 900 1,690
Electricity,gas,steam&airconditioningsupply 3,200 3,000 1,500 1,200 980 1,525 900 800 1,300
Watersupply,sewerage,wastemanagement&
remediationactivities
4,680 2,421 1,800 1,121 1,250 1,277 1,000 900 1,500
Construction 3,500 2,900 2,000 1,400 1,700 1,100 1,500 1,500 1,000 2,000
Wholesale&retailtrade,repairofmotorvehicles&motorcycles
4,000 3,000 2,000 1,400 1,000 1,100 1,200 1,300 1,000 1,700
Figure4.10:MedianStartingandMaximumMonthlyBasicSalaryofFirmsforElementaryOccupationsbyMASCO2D
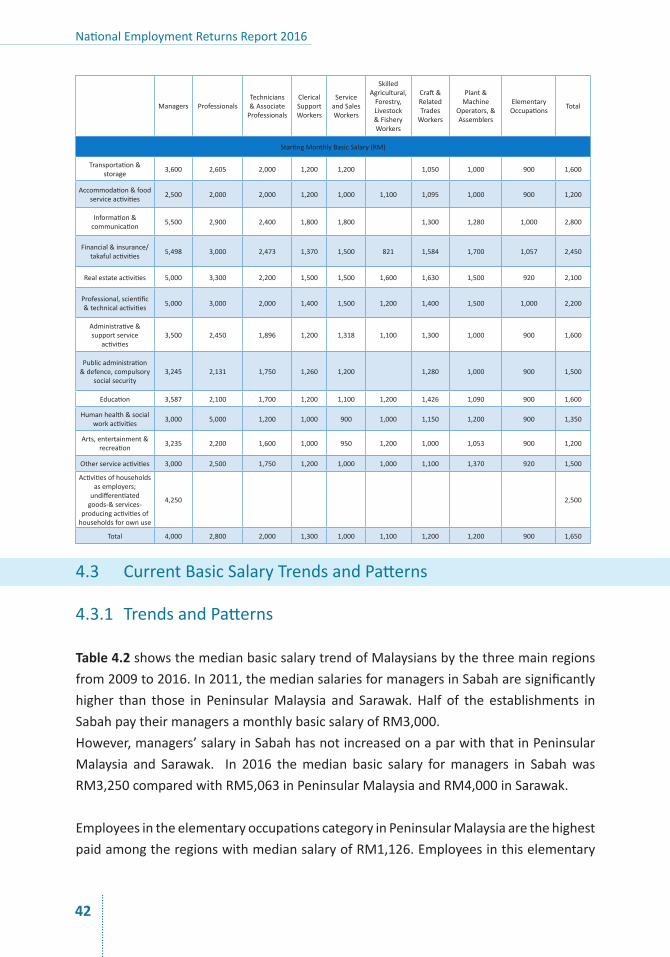
4.2.2 Sector
Table 4.1showsthatthemedianstartingsalariesofemployeesvarybysector.Managersin the Information& Communication and Finance& Insurance industry are paid thehighest starting salary of RM5,500 and RM5,498 respectively. On the other hand,ManagersintheAccommodationandFoodServicessectorarepaidtheloweststartingsalaryofRM2,500amonth.ProfessionalsintheHumanHealth&SocialWorksectorarepaidthehighestmedianstartingsalary(RM5,000).
Table4.1:MedianStartingSalariesofFirmsforMalaysianEmployeesbyJobCategoryandSector,2016
1,180
1,180
1,500
1,500
1,000
1,000
1,200
1,200
1,300
1,300
1,500
1,500
2,000
2,000
900
900
900
900
900
900
900
900
920
920MaximumSalary
Startin
gan
dMaxim
umM
onthlyBasic
Salary(R
M)
StartingSalary
0
500
1,000
1,500
2,000
2,500
91Cleaners&helpers
92Agricultural,forestry,farming&fishery
labourers
93Mining,construction,manufacturing&transportlabourers
94Foodpreparationassistants
95street&relatedsales&
serviceworkers
96Refuseworkers&other
elementaryworkers
National Employment Returns Report 2016
42
4.3 CurrentBasicSalaryTrendsandPatterns
4.3.1 TrendsandPatterns
Table 4.2showsthemedianbasicsalarytrendofMalaysiansbythethreemainregionsfrom2009to2016.In2011,themediansalariesformanagersinSabaharesignificantlyhigher than those in PeninsularMalaysia and Sarawak.Half of the establishments inSabahpaytheirmanagersamonthlybasicsalaryofRM3,000.However,managers’salaryinSabahhasnotincreasedonaparwiththatinPeninsularMalaysia and Sarawak. In 2016 themedian basic salary formanagers in SabahwasRM3,250comparedwithRM5,063inPeninsularMalaysiaandRM4,000inSarawak.
EmployeesintheelementaryoccupationscategoryinPeninsularMalaysiaarethehighestpaidamongtheregionswithmediansalaryofRM1,126.Employeesinthiselementary
Managers ProfessionalsTechnicians&AssociateProfessionals
ClericalSupportWorkers
ServiceandSalesWorkers
SkilledAgricultural,Forestry,Livestock&FisheryWorkers
Craft&RelatedTradesWorkers
Plant&Machine
Operators,&Assemblers
ElementaryOccupations Total
StartingMonthlyBasicSalary(RM)
Transportation&storage 3,600 2,605 2,000 1,200 1,200 1,050 1,000 900 1,600
Accommodation&foodserviceactivities 2,500 2,000 2,000 1,200 1,000 1,100 1,095 1,000 900 1,200
Information&communication 5,500 2,900 2,400 1,800 1,800 1,300 1,280 1,000 2,800
Financial&insurance/takafulactivities 5,498 3,000 2,473 1,370 1,500 821 1,584 1,700 1,057 2,450
Realestateactivities 5,000 3,300 2,200 1,500 1,500 1,600 1,630 1,500 920 2,100
Professional,scientific&technicalactivities 5,000 3,000 2,000 1,400 1,500 1,200 1,400 1,500 1,000 2,200
Administrative&supportservice
activities3,500 2,450 1,896 1,200 1,318 1,100 1,300 1,000 900 1,600
Publicadministration&defence,compulsory
socialsecurity3,245 2,131 1,750 1,260 1,200 1,280 1,000 900 1,500
Education 3,587 2,100 1,700 1,200 1,100 1,200 1,426 1,090 900 1,600
Humanhealth&socialworkactivities 3,000 5,000 1,200 1,000 900 1,000 1,150 1,200 900 1,350
Arts,entertainment&recreation 3,235 2,200 1,600 1,000 950 1,200 1,000 1,053 900 1,200
Otherserviceactivities 3,000 2,500 1,750 1,200 1,000 1,000 1,100 1,370 920 1,500
Activitiesofhouseholdsasemployers;
undifferentiatedgoods-&services-
producingactivitiesofhouseholdsforownuse
4,250 2,500
Total 4,000 2,800 2,000 1,300 1,000 1,100 1,200 1,200 900 1,650
Institut Maklumat dan Analisis Pasaran Buruh (ILMIA)
43
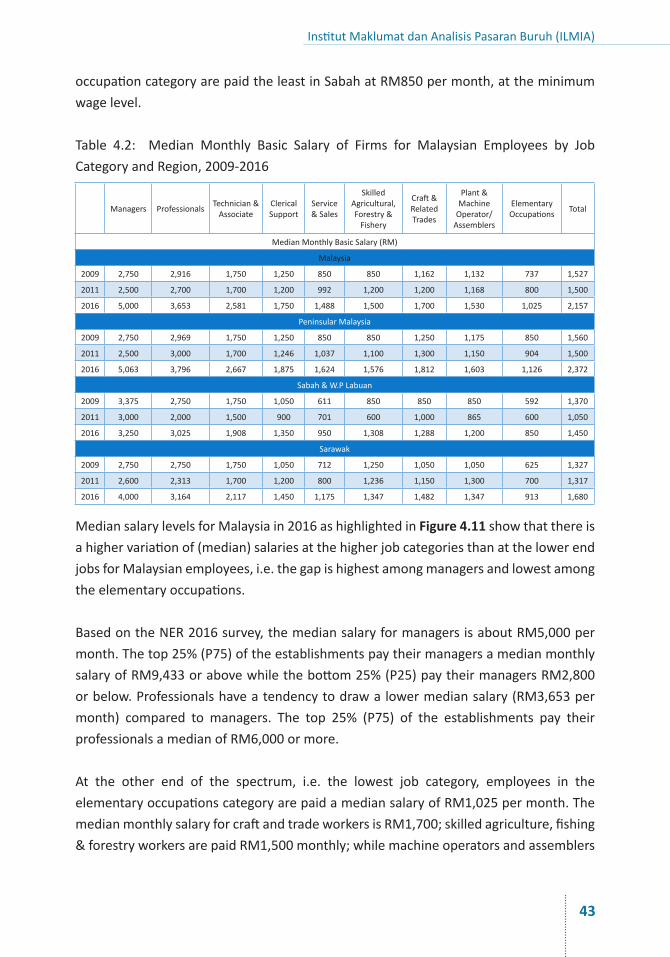
occupationcategoryarepaidtheleastinSabahatRM850permonth,attheminimumwagelevel.
Table 4.2: Median Monthly Basic Salary of Firms for Malaysian Employees by JobCategoryandRegion,2009-2016
Managers Professionals Technician&Associate
ClericalSupport
Service&Sales
SkilledAgricultural,Forestry&Fishery
Craft&RelatedTrades
Plant&MachineOperator/Assemblers
ElementaryOccupations Total
MedianMonthlyBasicSalary(RM)
Malaysia
2009 2,750 2,916 1,750 1,250 850 850 1,162 1,132 737 1,527
2011 2,500 2,700 1,700 1,200 992 1,200 1,200 1,168 800 1,500
2016 5,000 3,653 2,581 1,750 1,488 1,500 1,700 1,530 1,025 2,157
PeninsularMalaysia
2009 2,750 2,969 1,750 1,250 850 850 1,250 1,175 850 1,560
2011 2,500 3,000 1,700 1,246 1,037 1,100 1,300 1,150 904 1,500
2016 5,063 3,796 2,667 1,875 1,624 1,576 1,812 1,603 1,126 2,372
Sabah&W.PLabuan
2009 3,375 2,750 1,750 1,050 611 850 850 850 592 1,370
2011 3,000 2,000 1,500 900 701 600 1,000 865 600 1,050
2016 3,250 3,025 1,908 1,350 950 1,308 1,288 1,200 850 1,450
Sarawak
2009 2,750 2,750 1,750 1,050 712 1,250 1,050 1,050 625 1,327
2011 2,600 2,313 1,700 1,200 800 1,236 1,150 1,300 700 1,317
2016 4,000 3,164 2,117 1,450 1,175 1,347 1,482 1,347 913 1,680
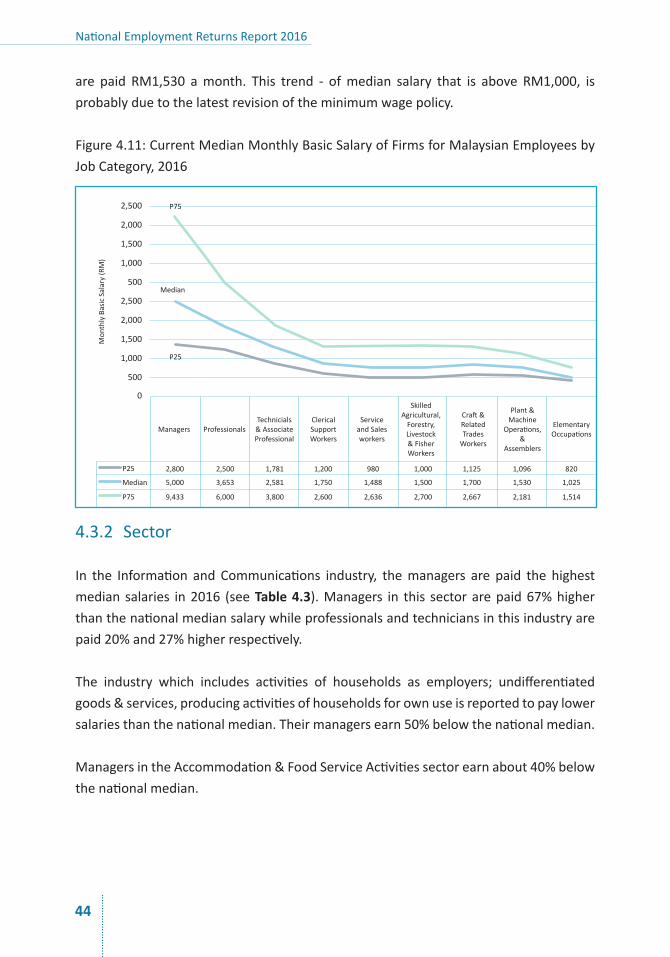
MediansalarylevelsforMalaysiain2016ashighlightedinFigure 4.11 showthatthereisahighervariationof(median)salariesatthehigherjobcategoriesthanatthelowerendjobsforMalaysianemployees,i.e.thegapishighestamongmanagersandlowestamongtheelementaryoccupations.
BasedontheNER2016survey,themediansalaryformanagersisaboutRM5,000permonth.Thetop25%(P75)oftheestablishmentspaytheirmanagersamedianmonthlysalaryofRM9,433orabovewhilethebottom25%(P25)paytheirmanagersRM2,800orbelow.Professionalshaveatendencytodrawalowermediansalary(RM3,653permonth) compared to managers. The top 25% (P75) of the establishments pay theirprofessionalsamedianofRM6,000ormore.
At the other end of the spectrum, i.e. the lowest job category, employees in theelementaryoccupationscategoryarepaidamediansalaryofRM1,025permonth.ThemedianmonthlysalaryforcraftandtradeworkersisRM1,700;skilledagriculture,fishing&forestryworkersarepaidRM1,500monthly;whilemachineoperatorsandassemblers
National Employment Returns Report 2016
44
are paid RM1,530 amonth. This trend - ofmedian salary that is above RM1,000, isprobablyduetothelatestrevisionoftheminimumwagepolicy.
Figure4.11:CurrentMedianMonthlyBasicSalaryofFirmsforMalaysianEmployeesbyJobCategory,2016
4.3.2 Sector
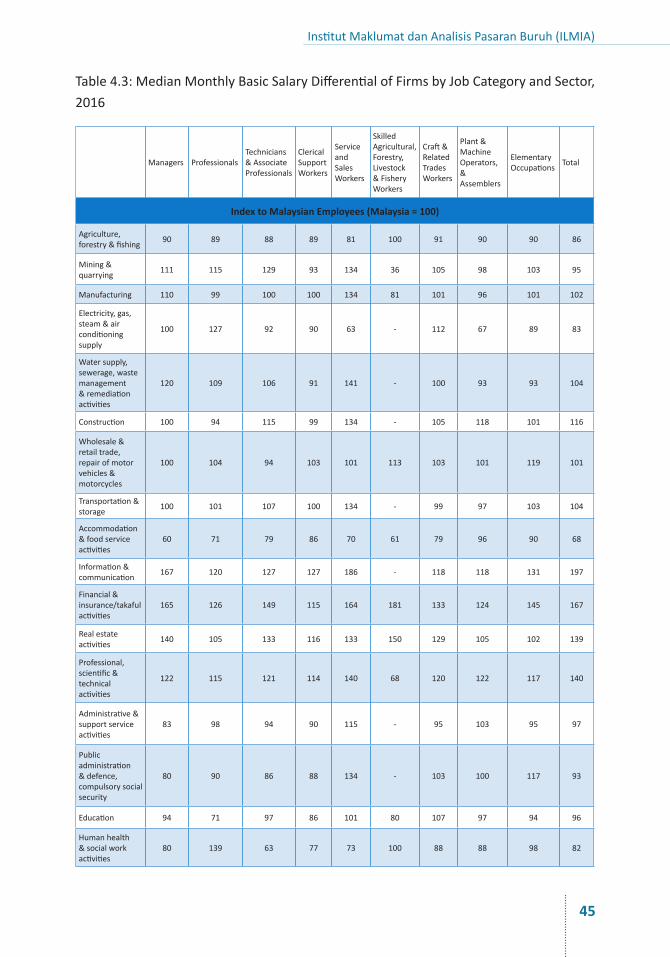
In the Information and Communications industry, themanagers are paid the highestmedian salaries in2016 (seeTable 4.3).Managers in this sectorarepaid67%higherthanthenationalmediansalarywhileprofessionalsandtechniciansinthisindustryarepaid20%and27%higherrespectively.
The industry which includes activities of households as employers; undifferentiatedgoods&services,producingactivitiesofhouseholdsforownuseisreportedtopaylowersalariesthanthenationalmedian.Theirmanagersearn50%belowthenationalmedian.
ManagersintheAccommodation&FoodServiceActivitiessectorearnabout40%belowthenationalmedian.
Managers ProfessionalsTechnicials&AssociateProfessional
ClericalSupportWorkers
ServiceandSalesworkers
SkilledAgricultural,Forestry,Livestock&FisherWorkers
Craft&RelatedTradesWorkers
Plant&Machine
Operations,&
Assemblers
ElementaryOccupations
P25
P25
Median
2,800 2,500 1,781 1,200 980 1,000 1,125 1,096 820
5,000 3,653 2,581 1,750 1,488 1,500 1,700 1,530 1,025
9,433 6,000 3,800 2,600 2,636 2,700 2,667 2,181 1,514
Median
P75
P75
Mon
thlyBasicSalary(RM)
0
500
500
1,000
1,000
1,500
1,500
2,000
2,000
2,500
2,500
Institut Maklumat dan Analisis Pasaran Buruh (ILMIA)
45
Table4.3:MedianMonthlyBasicSalaryDifferentialofFirmsbyJobCategoryandSector,2016
Managers ProfessionalsTechnicians&AssociateProfessionals
ClericalSupportWorkers
Serviceand SalesWorkers
SkilledAgricultural,Forestry,Livestock&FisheryWorkers
Craft&RelatedTradesWorkers
Plant&MachineOperators,&Assemblers
ElementaryOccupations Total
Index to Malaysian Employees (Malaysia = 100)
Agriculture,forestry&fishing 90 89 88 89 81 100 91 90 90 86
Mining&quarrying 111 115 129 93 134 36 105 98 103 95
Manufacturing 110 99 100 100 134 81 101 96 101 102
Electricity,gas,steam&airconditioningsupply
100 127 92 90 63 - 112 67 89 83
Watersupply,sewerage,wastemanagement&remediationactivities
120 109 106 91 141 - 100 93 93 104
Construction 100 94 115 99 134 - 105 118 101 116
Wholesale&retailtrade,repairofmotorvehicles&motorcycles
100 104 94 103 101 113 103 101 119 101
Transportation&storage 100 101 107 100 134 - 99 97 103 104
Accommodation&foodserviceactivities
60 71 79 86 70 61 79 96 90 68
Information&communication 167 120 127 127 186 - 118 118 131 197
Financial&insurance/takafulactivities
165 126 149 115 164 181 133 124 145 167
Realestateactivities 140 105 133 116 133 150 129 105 102 139
Professional,scientific&technicalactivities
122 115 121 114 140 68 120 122 117 140
Administrative&supportserviceactivities
83 98 94 90 115 - 95 103 95 97
Publicadministration&defence,compulsorysocialsecurity
80 90 86 88 134 - 103 100 117 93
Education 94 71 97 86 101 80 107 97 94 96
Humanhealth&socialworkactivities
80 139 63 77 73 100 88 88 98 82
National Employment Returns Report 2016
46
Managers ProfessionalsTechnicians&AssociateProfessionals
ClericalSupportWorkers
Serviceand SalesWorkers
SkilledAgricultural,Forestry,Livestock&FisheryWorkers
Craft&RelatedTradesWorkers
Plant&MachineOperators,&Assemblers
ElementaryOccupations Total
Index to Malaysian Employees (Malaysia = 100)
Arts,entertainment&recreation
88 94 85 85 80 102 93 91 99 82
Otherserviceactivities 80 87 81 97 90 133 84 100 106 93
Activitiesofhouseholdsasemployers;undifferentiatedgoods-&services-producingactivitiesofhouseholdsforownuse
50 - - - - - - 111 88 79
Malaysia-MedianSalary(RM)
5,000 3,653 2,581 1,750 1,488 1,500 1,700 1,530 1,025 2,157
4.3.3 Nationality
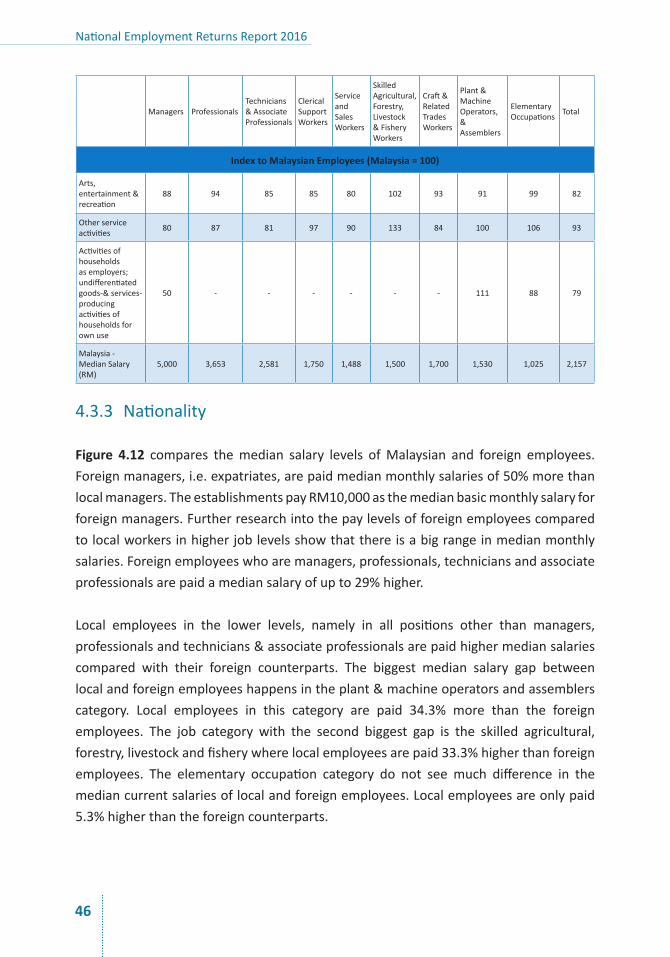
Figure 4.12 compares themedian salary levels ofMalaysian and foreign employees.Foreignmanagers,i.e.expatriates,arepaidmedianmonthlysalariesof50%morethanlocalmanagers.TheestablishmentspayRM10,000asthemedianbasicmonthlysalaryforforeignmanagers.Furtherresearchintothepaylevelsofforeignemployeescomparedtolocalworkersinhigherjoblevelsshowthatthereisabigrangeinmedianmonthlysalaries.Foreignemployeeswhoaremanagers,professionals,techniciansandassociateprofessionalsarepaidamediansalaryofupto29%higher.
Local employees in the lower levels, namely in all positions other than managers,professionalsandtechnicians&associateprofessionalsarepaidhighermediansalariescompared with their foreign counterparts. The biggest median salary gap betweenlocalandforeignemployeeshappensintheplant&machineoperatorsandassemblerscategory. Local employees in this category are paid 34.3% more than the foreignemployees. The job category with the second biggest gap is the skilled agricultural,forestry,livestockandfisherywherelocalemployeesarepaid33.3%higherthanforeignemployees. The elementary occupation category do not see much difference in themediancurrentsalariesoflocalandforeignemployees.Localemployeesareonlypaid5.3%higherthantheforeigncounterparts.
Institut Maklumat dan Analisis Pasaran Buruh (ILMIA)
47
Figure4.12:MedianMonthlyBasicSalaryofFirmsbyJobCategoryandNationality
5,000
5,167
4,713
3,850
3,500
2,600
2,550
1,742
1,767
1,600
1,300 1,4
501,472 1,7
57
1,215 1,5
60
1,114
1,112
938
3,653
5,056
2,581 3,6
50
1,750
1,440
1,488
1,000
1,000
1,006
1,025
9701,7
00
1,165 1,5
301,500
10,000
Malaysian
Male
Foreign
Female
4.3.4 Gender
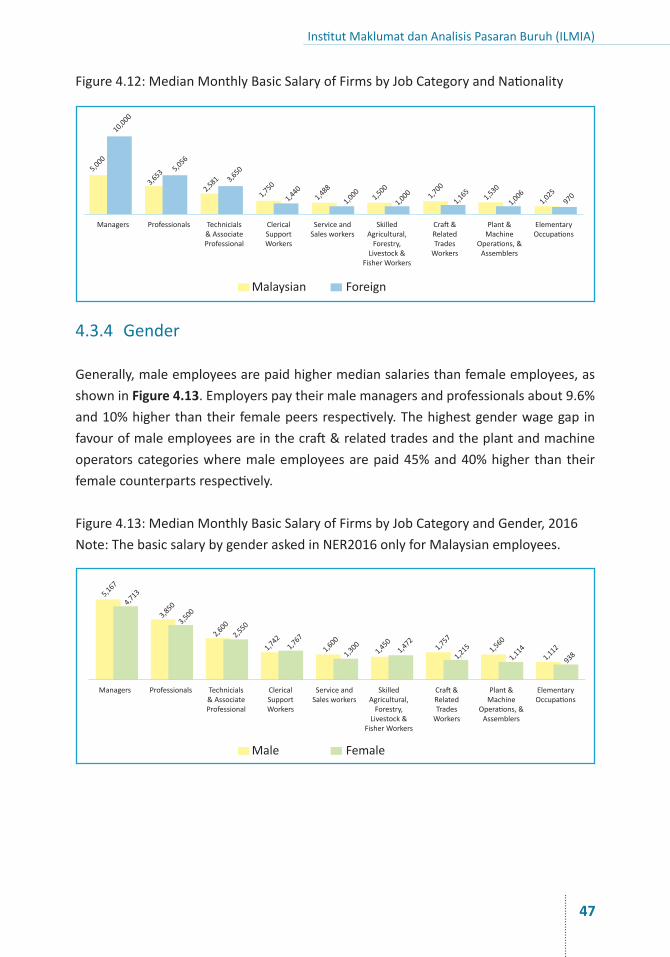
Generally,maleemployeesarepaidhighermediansalariesthanfemaleemployees,asshowninFigure 4.13.Employerspaytheirmalemanagersandprofessionalsabout9.6%and10%higherthantheir femalepeersrespectively.Thehighestgenderwagegap infavourofmaleemployeesareinthecraft&relatedtradesandtheplantandmachineoperatorscategorieswheremaleemployeesarepaid45%and40%higher than theirfemalecounterpartsrespectively.
Figure4.13:MedianMonthlyBasicSalaryofFirmsbyJobCategoryandGender,2016Note:ThebasicsalarybygenderaskedinNER2016onlyforMalaysianemployees.
Managers
Managers
Professionals
Professionals
Technicials&AssociateProfessional
Technicials&AssociateProfessional
ClericalSupportWorkers
ClericalSupportWorkers
ServiceandSalesworkers
ServiceandSalesworkers
SkilledAgricultural,Forestry,
Livestock&FisherWorkers
SkilledAgricultural,Forestry,
Livestock&FisherWorkers
Craft&RelatedTradesWorkers
Craft&RelatedTradesWorkers
Plant&Machine
Operations,&Assemblers
Plant&Machine
Operations,&Assemblers
ElementaryOccupations
ElementaryOccupations
National Employment Returns Report 2016
48
4.3.5 JobCategoryMASCO2Digit
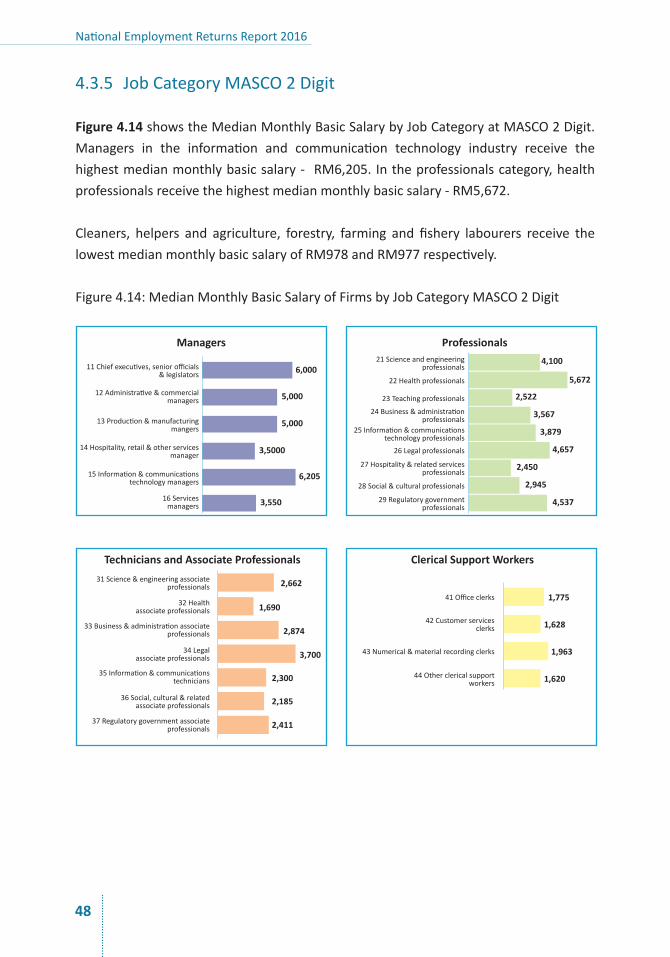
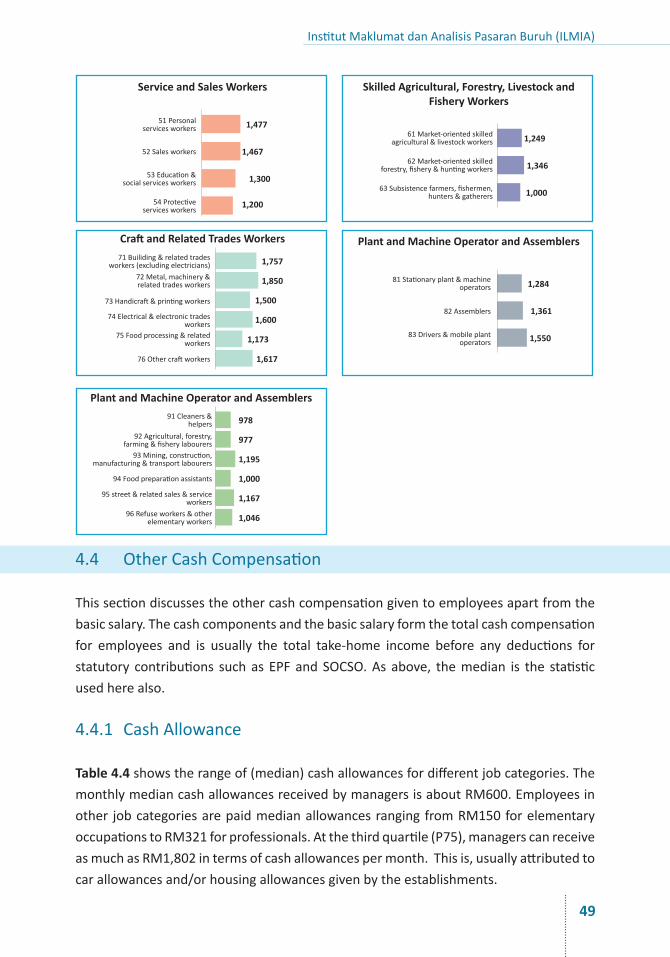
Figure 4.14showstheMedianMonthlyBasicSalarybyJobCategoryatMASCO2Digit.Managers in the information and communication technology industry receive thehighestmedianmonthlybasicsalary- RM6,205.Intheprofessionalscategory,healthprofessionalsreceivethehighestmedianmonthlybasicsalary-RM5,672.
Cleaners, helpers and agriculture, forestry, farming and fishery labourers receive thelowestmedianmonthlybasicsalaryofRM978andRM977respectively.
Figure4.14:MedianMonthlyBasicSalaryofFirmsbyJobCategoryMASCO2Digit
6,0004,100
5,672
2,522
3,567
3,879
4,657
2,450
2,945
4,537
Managers
Technicians and Associate Professionals Clerical Support Workers
Professionals
5,000
5,000
3,5000
6,205
3,550
2,662
1,690
2,874
1,775
1,628
1,620
1,9633,700
2,300
2,185
2,411
11Chiefexecutives,seniorofficials&legislators
12Administrative&commercialmanagers
13Production&manufacturingmangers
14Hospitality,retail&otherservicesmanager
15Information&communicationstechnologymanagers
16Servicesmanagers
21Scienceandengineeringprofessionals
22Healthprofessionals
23Teachingprofessionals
24Business&administrationprofessionals
26Legalprofessionals
27Hospitality&relatedservicesprofessionals
28Social&culturalprofessionals
29Regulatorygovernmentprofessionals
25Information&communicationstechnologyprofessionals
31Science&engineeringassociateprofessionals
32Healthassociateprofessionals
33Business&administrationassociateprofessionals
34Legalassociateprofessionals
35Information&communicationstechnicians
36Social,cultural&relatedassociateprofessionals
37Regulatorygovernmentassociateprofessionals
41Officeclerks
42Customerservicesclerks
43Numerical&materialrecordingclerks
44Otherclericalsupportworkers
Institut Maklumat dan Analisis Pasaran Buruh (ILMIA)
49
4.4 OtherCashCompensation
Thissectiondiscussestheothercashcompensationgiventoemployeesapartfromthebasicsalary.Thecashcomponentsandthebasicsalaryformthetotalcashcompensationfor employees and is usually the total take-home income before any deductions forstatutory contributions suchasEPFandSOCSO.Asabove, themedian is the statisticusedherealso.
4.4.1 CashAllowance
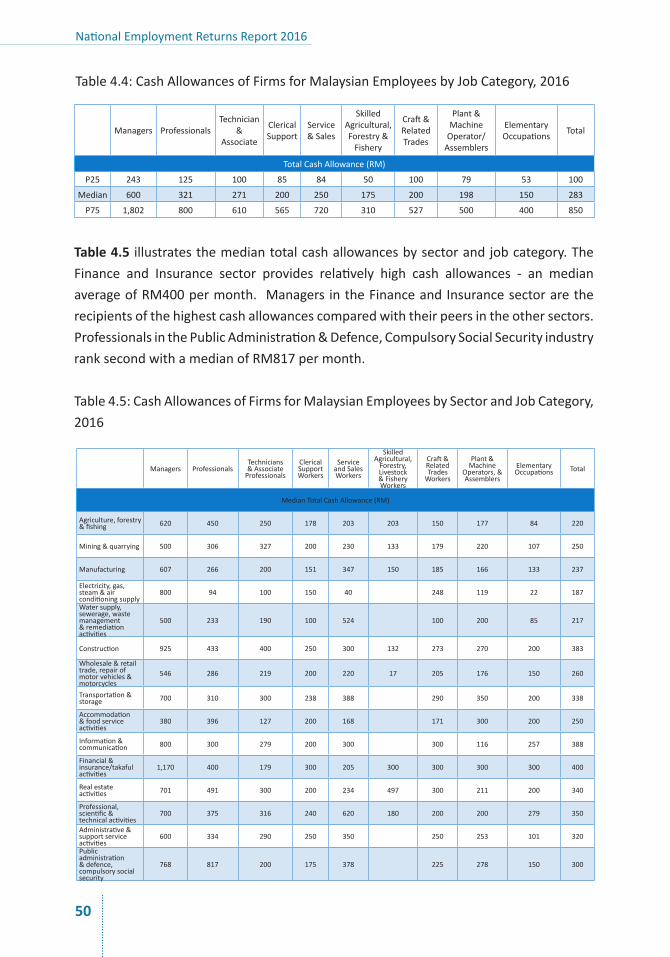
Table 4.4showstherangeof(median)cashallowancesfordifferentjobcategories.ThemonthlymediancashallowancesreceivedbymanagersisaboutRM600.Employeesinother jobcategoriesarepaidmedianallowancesrangingfromRM150forelementaryoccupationstoRM321forprofessionals.Atthethirdquartile(P75),managerscanreceiveasmuchasRM1,802intermsofcashallowancespermonth.Thisis,usuallyattributedtocarallowancesand/orhousingallowancesgivenbytheestablishments.
1,757
978
1,850
977
1,500
1,195
1,600
1,000
1,173
1,167
1,617
1,046
Service and Sales Workers
Craft and Related Trades Workers
Skilled Agricultural, Forestry, Livestock and Fishery Workers
Plant and Machine Operator and Assemblers
Plant and Machine Operator and Assemblers
1,4771,249
1,284
1,4671,346
1,361
1,200
1,3001,000
1,550
51Personalservicesworkers
52Salesworkers
53Education&socialservicesworkers
54Protectiveservicesworkers
61Market-orientedskilledagricultural&livestockworkers
62Market-orientedskilledforestry,fishery&huntingworkers
63Subsistencefarmers,fishermen,hunters&gatherers
71Builiding&relatedtradesworkers(excludingelectricians)
72Metal,machinery&relatedtradesworkers
73Handicraft&printingworkers
74Electrical&electronictradesworkers
75Foodprocessing&relatedworkers
76Othercraftworkers
81Stationaryplant&machineoperators
82Assemblers
83Drivers&mobileplantoperators
91Cleaners&helpers
92Agricultural,forestry,farming&fisherylabourers
93Mining,construction,manufacturing&transportlabourers
94Foodpreparationassistants
95street&relatedsales&serviceworkers
96Refuseworkers&otherelementaryworkers
National Employment Returns Report 2016
50
Table4.4:CashAllowancesofFirmsforMalaysianEmployeesbyJobCategory,2016
Managers ProfessionalsTechnician
&Associate
ClericalSupport
Service&Sales
SkilledAgricultural,Forestry&Fishery
Craft&RelatedTrades
Plant&MachineOperator/Assemblers
ElementaryOccupations Total
TotalCashAllowance(RM)
P25 243 125 100 85 84 50 100 79 53 100
Median 600 321 271 200 250 175 200 198 150 283
P75 1,802 800 610 565 720 310 527 500 400 850
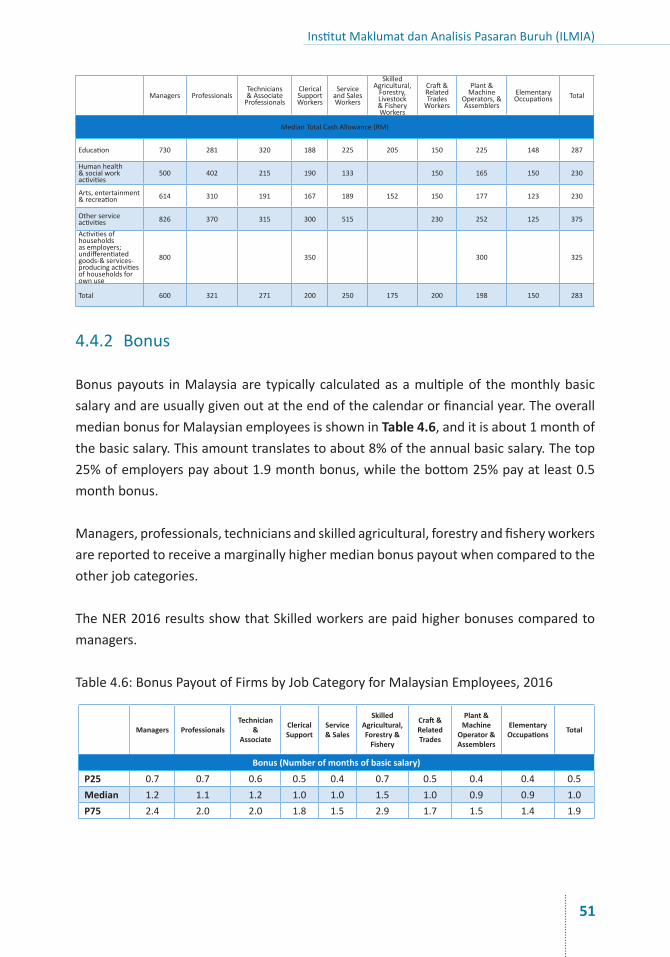
Table 4.5 illustratesthemediantotalcashallowancesbysectorandjobcategory.TheFinance and Insurance sector provides relatively high cash allowances - an medianaverageofRM400permonth. Managers intheFinanceandInsurancesectoraretherecipientsofthehighestcashallowancescomparedwiththeirpeersintheothersectors.ProfessionalsinthePublicAdministration&Defence,CompulsorySocialSecurityindustryranksecondwithamedianofRM817permonth.
Table4.5:CashAllowancesofFirmsforMalaysianEmployeesbySectorandJobCategory,2016
Managers ProfessionalsTechnicians&AssociateProfessionals
ClericalSupportWorkers
ServiceandSalesWorkers
SkilledAgricultural,Forestry,Livestock&FisheryWorkers
Craft&RelatedTradesWorkers
Plant&Machine
Operators,&Assemblers
ElementaryOccupations Total
MedianTotalCashAllowance(RM)
Agriculture,forestry&fishing 620 450 250 178 203 203 150 177 84 220
Mining&quarrying 500 306 327 200 230 133 179 220 107 250
Manufacturing 607 266 200 151 347 150 185 166 133 237
Electricity,gas,steam&airconditioningsupply
800 94 100 150 40 248 119 22 187
Watersupply,sewerage,wastemanagement&remediationactivities
500 233 190 100 524 100 200 85 217
Construction 925 433 400 250 300 132 273 270 200 383
Wholesale&retailtrade,repairofmotorvehicles&motorcycles
546 286 219 200 220 17 205 176 150 260
Transportation&storage 700 310 300 238 388 290 350 200 338
Accommodation&foodserviceactivities
380 396 127 200 168 171 300 200 250
Information&communication 800 300 279 200 300 300 116 257 388
Financial&insurance/takafulactivities
1,170 400 179 300 205 300 300 300 300 400
Realestateactivities 701 491 300 200 234 497 300 211 200 340
Professional,scientific&technicalactivities
700 375 316 240 620 180 200 200 279 350
Administrative&supportserviceactivities
600 334 290 250 350 250 253 101 320
Publicadministration&defence,compulsorysocialsecurity
768 817 200 175 378 225 278 150 300
Institut Maklumat dan Analisis Pasaran Buruh (ILMIA)
51
Managers ProfessionalsTechnicians&AssociateProfessionals
ClericalSupportWorkers
ServiceandSalesWorkers
SkilledAgricultural,Forestry,Livestock&FisheryWorkers
Craft&RelatedTradesWorkers
Plant&Machine
Operators,&Assemblers
ElementaryOccupations Total
MedianTotalCashAllowance(RM)
Education 730 281 320 188 225 205 150 225 148 287
Humanhealth&socialworkactivities
500 402 215 190 133 150 165 150 230
Arts,entertainment&recreation 614 310 191 167 189 152 150 177 123 230
Otherserviceactivities 826 370 315 300 515 230 252 125 375
Activitiesofhouseholdsasemployers;undifferentiatedgoods-&services-producingactivitiesofhouseholdsforownuse
800 350 300 325
Total 600 321 271 200 250 175 200 198 150 283
4.4.2 Bonus
Bonuspayouts inMalaysiaare typically calculatedasamultipleof themonthlybasicsalaryandareusuallygivenoutattheendofthecalendarorfinancialyear.TheoverallmedianbonusforMalaysianemployeesisshowninTable 4.6,anditisabout1monthofthebasicsalary.Thisamounttranslatestoabout8%oftheannualbasicsalary.Thetop25%ofemployerspayabout1.9monthbonus,whilethebottom25%payatleast0.5monthbonus.
Managers,professionals,techniciansandskilledagricultural,forestryandfisheryworkersarereportedtoreceiveamarginallyhighermedianbonuspayoutwhencomparedtotheotherjobcategories.
TheNER2016resultsshowthatSkilledworkersarepaidhigherbonusescomparedtomanagers.
Table4.6:BonusPayoutofFirmsbyJobCategoryforMalaysianEmployees,2016
Managers ProfessionalsTechnician
& Associate
Clerical Support
Service & Sales
Skilled Agricultural, Forestry &
Fishery
Craft & Related Trades
Plant & Machine
Operator & Assemblers
Elementary Occupations Total
Bonus (Number of months of basic salary)
P25 0.7 0.7 0.6 0.5 0.4 0.7 0.5 0.4 0.4 0.5Median 1.2 1.1 1.2 1.0 1.0 1.5 1.0 0.9 0.9 1.0P75 2.4 2.0 2.0 1.8 1.5 2.9 1.7 1.5 1.4 1.9
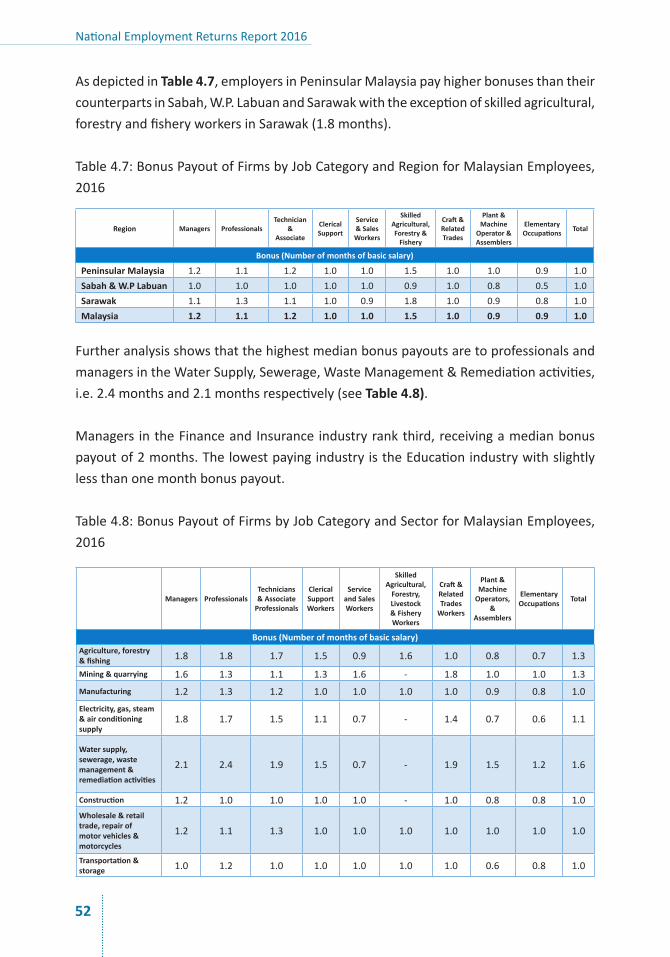
National Employment Returns Report 2016
52
AsdepictedinTable 4.7,employersinPeninsularMalaysiapayhigherbonusesthantheircounterpartsinSabah,W.P.LabuanandSarawakwiththeexceptionofskilledagricultural,forestryandfisheryworkersinSarawak(1.8months).
Table4.7:BonusPayoutofFirmsbyJobCategoryandRegionforMalaysianEmployees,2016
Region Managers ProfessionalsTechnician
& Associate
Clerical Support
Service & Sales Workers
Skilled Agricultural, Forestry &
Fishery
Craft & Related Trades
Plant & Machine
Operator & Assemblers
Elementary Occupations Total
Bonus (Number of months of basic salary)
Peninsular Malaysia 1.2 1.1 1.2 1.0 1.0 1.5 1.0 1.0 0.9 1.0Sabah & W.P Labuan 1.0 1.0 1.0 1.0 1.0 0.9 1.0 0.8 0.5 1.0Sarawak 1.1 1.3 1.1 1.0 0.9 1.8 1.0 0.9 0.8 1.0Malaysia 1.2 1.1 1.2 1.0 1.0 1.5 1.0 0.9 0.9 1.0
FurtheranalysisshowsthatthehighestmedianbonuspayoutsaretoprofessionalsandmanagersintheWaterSupply,Sewerage,WasteManagement&Remediationactivities,i.e.2.4monthsand2.1monthsrespectively(seeTable 4.8).
Managers intheFinanceandInsurance industryrankthird,receivingamedianbonuspayoutof2months.ThelowestpayingindustryistheEducationindustrywithslightlylessthanonemonthbonuspayout.
Table4.8:BonusPayoutofFirmsbyJobCategoryandSectorforMalaysianEmployees,2016
Managers ProfessionalsTechnicians & Associate
Professionals
Clerical Support Workers
Service and Sales Workers
Skilled Agricultural,
Forestry, Livestock & Fishery Workers
Craft & Related Trades
Workers
Plant & Machine
Operators, &
Assemblers
Elementary Occupations Total
Bonus (Number of months of basic salary)Agriculture, forestry & fishing 1.8 1.8 1.7 1.5 0.9 1.6 1.0 0.8 0.7 1.3
Mining & quarrying 1.6 1.3 1.1 1.3 1.6 - 1.8 1.0 1.0 1.3Manufacturing 1.2 1.3 1.2 1.0 1.0 1.0 1.0 0.9 0.8 1.0Electricity, gas, steam & air conditioning supply
1.8 1.7 1.5 1.1 0.7 - 1.4 0.7 0.6 1.1
Water supply, sewerage, waste management & remediation activities
2.1 2.4 1.9 1.5 0.7 - 1.9 1.5 1.2 1.6
Construction 1.2 1.0 1.0 1.0 1.0 - 1.0 0.8 0.8 1.0Wholesale & retail trade, repair of motor vehicles & motorcycles
1.2 1.1 1.3 1.0 1.0 1.0 1.0 1.0 1.0 1.0
Transportation & storage 1.0 1.2 1.0 1.0 1.0 1.0 1.0 0.6 0.8 1.0
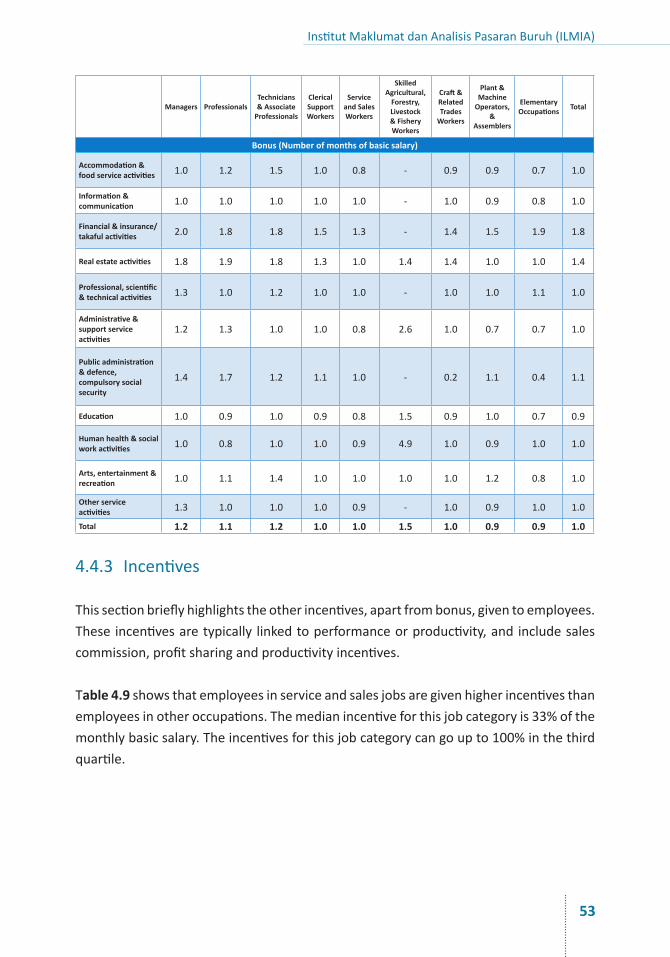
Institut Maklumat dan Analisis Pasaran Buruh (ILMIA)
53
Managers ProfessionalsTechnicians & Associate
Professionals
Clerical Support Workers
Service and Sales Workers
Skilled Agricultural,
Forestry, Livestock & Fishery Workers
Craft & Related Trades
Workers
Plant & Machine
Operators, &
Assemblers
Elementary Occupations Total
Bonus (Number of months of basic salary)
Accommodation & food service activities 1.0 1.2 1.5 1.0 0.8 - 0.9 0.9 0.7 1.0
Information & communication 1.0 1.0 1.0 1.0 1.0 - 1.0 0.9 0.8 1.0
Financial & insurance/takaful activities 2.0 1.8 1.8 1.5 1.3 - 1.4 1.5 1.9 1.8
Real estate activities 1.8 1.9 1.8 1.3 1.0 1.4 1.4 1.0 1.0 1.4
Professional, scientific & technical activities 1.3 1.0 1.2 1.0 1.0 - 1.0 1.0 1.1 1.0
Administrative & support service activities
1.2 1.3 1.0 1.0 0.8 2.6 1.0 0.7 0.7 1.0
Public administration & defence, compulsory social security
1.4 1.7 1.2 1.1 1.0 - 0.2 1.1 0.4 1.1
Education 1.0 0.9 1.0 0.9 0.8 1.5 0.9 1.0 0.7 0.9
Human health & social work activities 1.0 0.8 1.0 1.0 0.9 4.9 1.0 0.9 1.0 1.0
Arts, entertainment & recreation 1.0 1.1 1.4 1.0 1.0 1.0 1.0 1.2 0.8 1.0
Other service activities 1.3 1.0 1.0 1.0 0.9 - 1.0 0.9 1.0 1.0
Total 1.2 1.1 1.2 1.0 1.0 1.5 1.0 0.9 0.9 1.0
4.4.3 Incentives
Thissectionbrieflyhighlightstheotherincentives,apartfrombonus,giventoemployees.Theseincentivesaretypically linkedtoperformanceorproductivity,andincludesalescommission,profitsharingandproductivityincentives.
Table 4.9showsthatemployeesinserviceandsalesjobsaregivenhigherincentivesthanemployeesinotheroccupations.Themedianincentiveforthisjobcategoryis33%ofthemonthlybasicsalary.Theincentivesforthisjobcategorycangoupto100%inthethirdquartile.
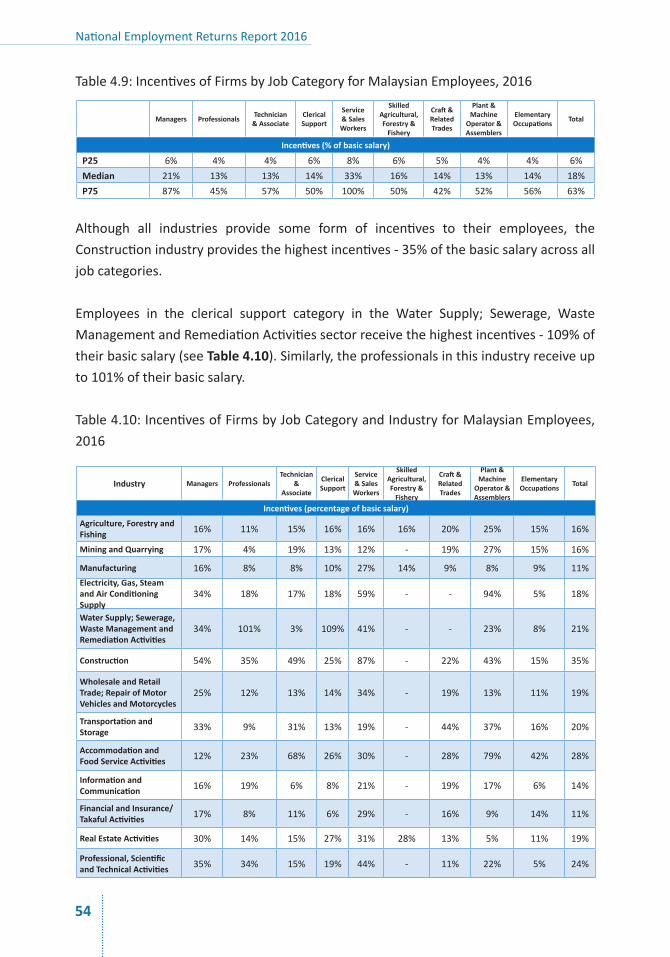
National Employment Returns Report 2016
54
Table4.9:IncentivesofFirmsbyJobCategoryforMalaysianEmployees,2016
Managers Professionals Technician & Associate
Clerical Support
Service & Sales Workers
Skilled Agricultural, Forestry &
Fishery
Craft & Related Trades
Plant & Machine
Operator & Assemblers
Elementary Occupations Total
Incentives (% of basic salary)
P25 6% 4% 4% 6% 8% 6% 5% 4% 4% 6%Median 21% 13% 13% 14% 33% 16% 14% 13% 14% 18%P75 87% 45% 57% 50% 100% 50% 42% 52% 56% 63%
Although all industries provide some form of incentives to their employees, theConstructionindustryprovidesthehighestincentives-35%ofthebasicsalaryacrossalljobcategories.
Employees in the clerical support category in the Water Supply; Sewerage, WasteManagementandRemediationActivitiessectorreceivethehighestincentives-109%oftheirbasicsalary(seeTable 4.10).Similarly,theprofessionalsinthisindustryreceiveupto101%oftheirbasicsalary.
Table4.10:IncentivesofFirmsbyJobCategoryandIndustryforMalaysianEmployees,2016
Industry Managers ProfessionalsTechnician
& Associate
Clerical Support
Service & Sales Workers
Skilled Agricultural, Forestry &
Fishery
Craft & Related Trades
Plant & Machine
Operator & Assemblers
Elementary Occupations Total
Incentives (percentage of basic salary)
Agriculture, Forestry and Fishing 16% 11% 15% 16% 16% 16% 20% 25% 15% 16%
Mining and Quarrying 17% 4% 19% 13% 12% - 19% 27% 15% 16%
Manufacturing 16% 8% 8% 10% 27% 14% 9% 8% 9% 11%Electricity, Gas, Steam and Air Conditioning Supply
34% 18% 17% 18% 59% - - 94% 5% 18%
Water Supply; Sewerage, Waste Management and Remediation Activities
34% 101% 3% 109% 41% - - 23% 8% 21%
Construction 54% 35% 49% 25% 87% - 22% 43% 15% 35%
Wholesale and Retail Trade; Repair of Motor Vehicles and Motorcycles
25% 12% 13% 14% 34% - 19% 13% 11% 19%
Transportation and Storage 33% 9% 31% 13% 19% - 44% 37% 16% 20%
Accommodation and Food Service Activities 12% 23% 68% 26% 30% - 28% 79% 42% 28%
Information and Communication 16% 19% 6% 8% 21% - 19% 17% 6% 14%
Financial and Insurance/Takaful Activities 17% 8% 11% 6% 29% - 16% 9% 14% 11%
Real Estate Activities 30% 14% 15% 27% 31% 28% 13% 5% 11% 19%
Professional, Scientific and Technical Activities 35% 34% 15% 19% 44% - 11% 22% 5% 24%
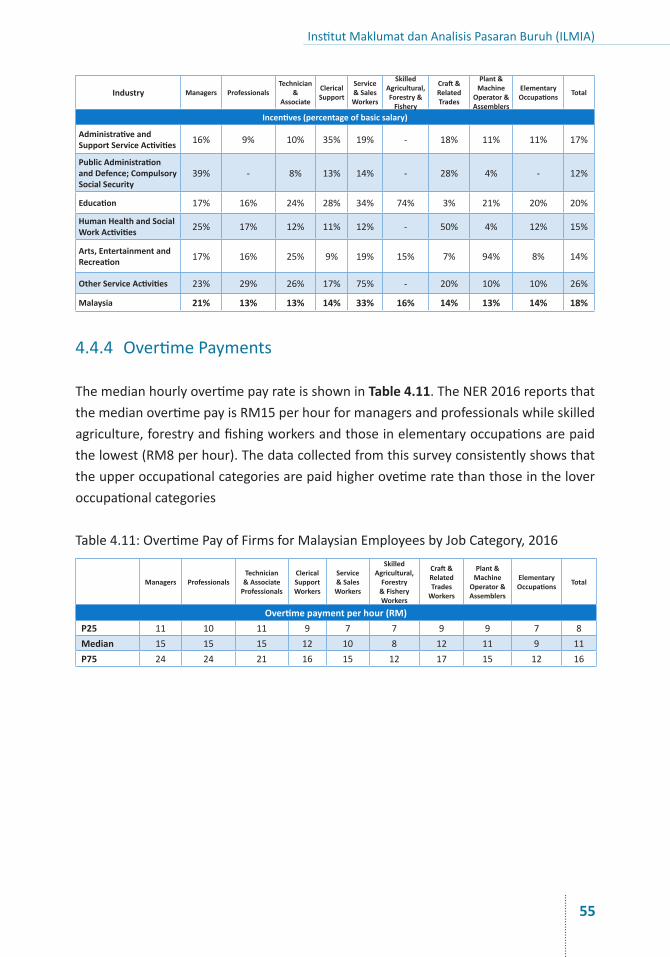
Institut Maklumat dan Analisis Pasaran Buruh (ILMIA)
55
Industry Managers ProfessionalsTechnician
& Associate
Clerical Support
Service & Sales Workers
Skilled Agricultural, Forestry &
Fishery
Craft & Related Trades
Plant & Machine
Operator & Assemblers
Elementary Occupations Total
Incentives (percentage of basic salary)
Administrative and Support Service Activities 16% 9% 10% 35% 19% - 18% 11% 11% 17%
Public Administration and Defence; Compulsory Social Security
39% - 8% 13% 14% - 28% 4% - 12%
Education 17% 16% 24% 28% 34% 74% 3% 21% 20% 20%
Human Health and Social Work Activities 25% 17% 12% 11% 12% - 50% 4% 12% 15%
Arts, Entertainment and Recreation 17% 16% 25% 9% 19% 15% 7% 94% 8% 14%
Other Service Activities 23% 29% 26% 17% 75% - 20% 10% 10% 26%
Malaysia 21% 13% 13% 14% 33% 16% 14% 13% 14% 18%
4.4.4 OvertimePayments
ThemedianhourlyovertimepayrateisshowninTable 4.11.TheNER2016reportsthatthemedianovertimepayisRM15perhourformanagersandprofessionalswhileskilledagriculture,forestryandfishingworkersandthoseinelementaryoccupationsarepaidthelowest(RM8perhour).Thedatacollectedfromthissurveyconsistentlyshowsthattheupperoccupationalcategoriesarepaidhigherovetimeratethanthoseintheloveroccupationalcategories
Table4.11:OvertimePayofFirmsforMalaysianEmployeesbyJobCategory,2016
Managers ProfessionalsTechnician
& Associate Professionals
Clerical Support Workers
Service & Sales Workers
Skilled Agricultural,
Forestry & Fishery Workers
Craft & Related Trades
Workers
Plant & Machine
Operator & Assemblers
Elementary Occupations Total
Overtime payment per hour (RM)P25 11 10 11 9 7 7 9 9 7 8Median 15 15 15 12 10 8 12 11 9 11P75 24 24 21 16 15 12 17 15 12 16

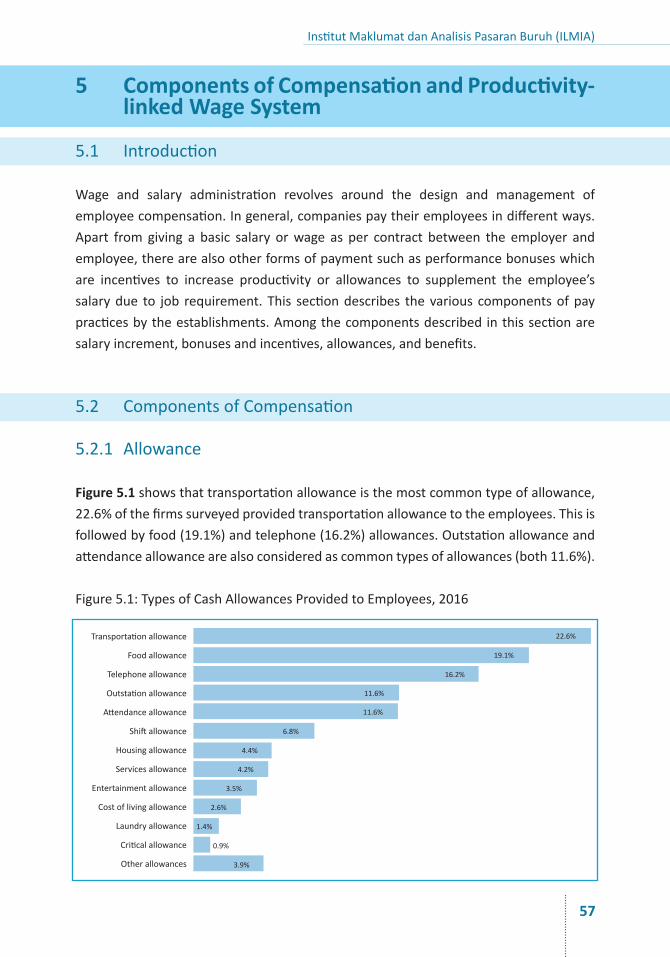
Institut Maklumat dan Analisis Pasaran Buruh (ILMIA)
57
5 Components of Compensation and Productivity-linked Wage System
5.1 Introduction
Wage and salary administration revolves around the design and management ofemployeecompensation.Ingeneral,companiespaytheiremployeesindifferentways.Apart from giving a basic salary orwage as per contract between the employer andemployee,therearealsootherformsofpaymentsuchasperformancebonuseswhichare incentives to increase productivity or allowances to supplement the employee’ssalarydue to job requirement.This sectiondescribes thevarious componentsofpaypracticesbytheestablishments.Amongthecomponentsdescribedinthissectionaresalaryincrement,bonusesandincentives,allowances,andbenefits.
5.2 ComponentsofCompensation
5.2.1 Allowance
Figure 5.1 showsthattransportationallowanceisthemostcommontypeofallowance,22.6%ofthefirmssurveyedprovidedtransportationallowancetotheemployees.Thisisfollowedbyfood(19.1%)andtelephone(16.2%)allowances.Outstationallowanceandattendanceallowancearealsoconsideredascommontypesofallowances(both11.6%).
Figure5.1:TypesofCashAllowancesProvidedtoEmployees,2016
22.6%
19.1%
16.2%
11.6%
11.6%
6.8%
4.4%
4.2%
3.5%
2.6%
1.4%
0.9%
3.9%
Transportationallowance
Foodallowance
Telephoneallowance
Outstationallowance
Attendanceallowance
Shiftallowance
Housingallowance
Servicesallowance
Entertainmentallowance
Costoflivingallowance
Laundryallowance
Criticalallowance
Otherallowances
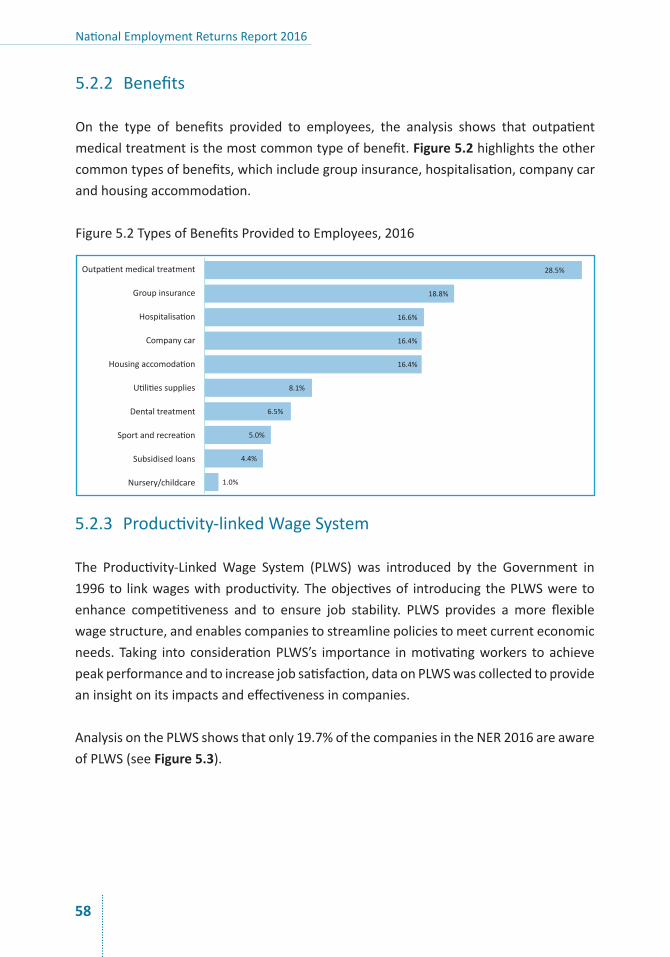
National Employment Returns Report 2016
58
5.2.3 Productivity-linkedWageSystem
The Productivity-LinkedWage System (PLWS) was introduced by the Government in1996to linkwageswithproductivity.Theobjectivesof introducingthePLWSweretoenhance competitiveness and to ensure job stability. PLWS provides a more flexiblewagestructure,andenablescompaniestostreamlinepoliciestomeetcurrenteconomicneeds.Taking into considerationPLWS’s importance inmotivatingworkers toachievepeakperformanceandtoincreasejobsatisfaction,dataonPLWSwascollectedtoprovideaninsightonitsimpactsandeffectivenessincompanies.
AnalysisonthePLWSshowsthatonly19.7%ofthecompaniesintheNER2016areawareofPLWS(seeFigure 5.3).
5.2.2 Benefits
On the type of benefits provided to employees, the analysis shows that outpatientmedicaltreatmentisthemostcommontypeofbenefit.Figure 5.2highlightstheothercommontypesofbenefits,whichincludegroupinsurance,hospitalisation,companycarandhousingaccommodation.
Figure5.2TypesofBenefitsProvidedtoEmployees,2016
28.5%
18.8%
16.6%
16.4%
16.4%
8.1%
6.5%
5.0%
4.4%
1.0%
Outpatientmedicaltreatment
Groupinsurance
Hospitalisation
Companycar
Housingaccomodation
Utilitiessupplies
Dentaltreatment
Sportandrecreation
Subsidisedloans
Nursery/childcare
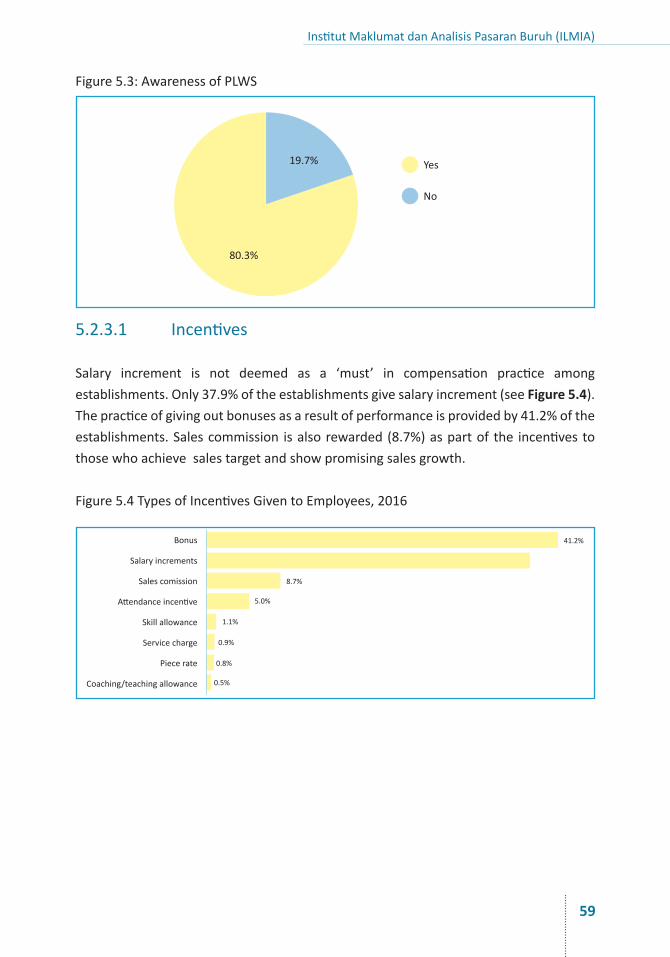
Institut Maklumat dan Analisis Pasaran Buruh (ILMIA)
59
80.3%
19.7% Yes
No
Figure5.3:AwarenessofPLWS
5.2.3.1 Incentives
Salary increment is not deemed as a ‘must’ in compensation practice amongestablishments.Only37.9%oftheestablishmentsgivesalaryincrement(seeFigure 5.4).Thepracticeofgivingoutbonusesasaresultofperformanceisprovidedby41.2%oftheestablishments.Salescommission isalsorewarded(8.7%)aspartof the incentivestothosewhoachievesalestargetandshowpromisingsalesgrowth.
Figure5.4TypesofIncentivesGiventoEmployees,2016
41.2%
8.7%
5.0%
1.1%
0.9%
0.8%
0.5%
Bonus
Salaryincrements
Salescomission
Attendanceincentive
Skillallowance
Servicecharge
Piecerate
Coaching/teachingallowance
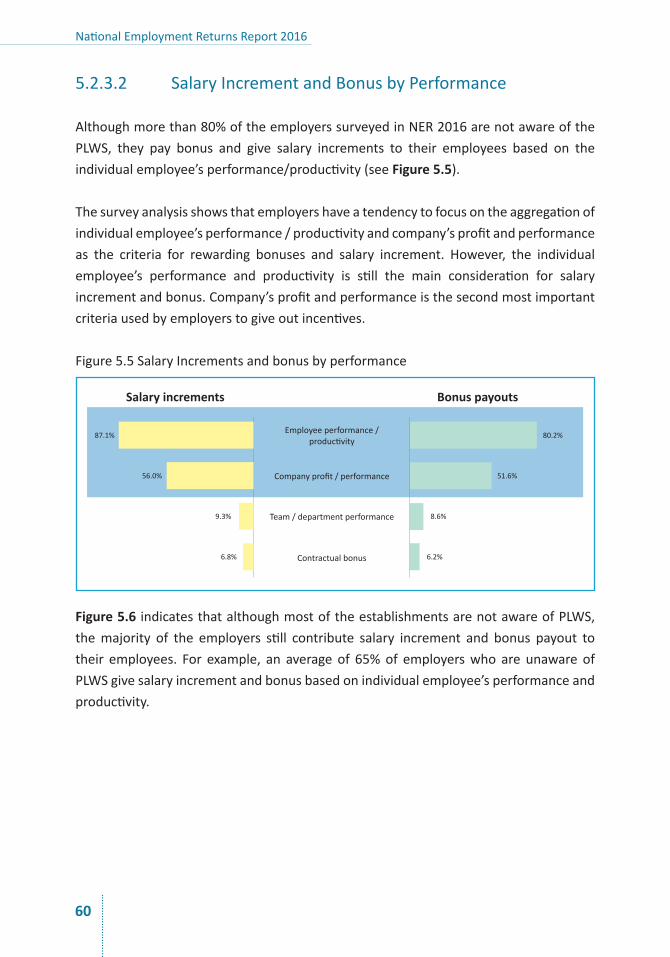
National Employment Returns Report 2016
60
5.2.3.2 SalaryIncrementandBonusbyPerformance
Althoughmorethan80%oftheemployerssurveyedinNER2016arenotawareofthePLWS, they pay bonus and give salary increments to their employees based on theindividualemployee’sperformance/productivity(seeFigure 5.5).
Thesurveyanalysisshowsthatemployershaveatendencytofocusontheaggregationofindividualemployee’sperformance/productivityandcompany’sprofitandperformanceas the criteria for rewarding bonuses and salary increment. However, the individualemployee’s performance and productivity is still the main consideration for salaryincrementandbonus.Company’sprofitandperformanceisthesecondmostimportantcriteriausedbyemployerstogiveoutincentives.
Figure5.5SalaryIncrementsandbonusbyperformance
Figure 5.6 indicatesthatalthoughmostoftheestablishmentsarenotawareofPLWS,themajority of the employers still contribute salary increment and bonus payout totheir employees. For example, an average of 65%of employerswho are unaware ofPLWSgivesalaryincrementandbonusbasedonindividualemployee’sperformanceandproductivity.
87.1% 80.2%
56.0% 51.6%
9.3% 8.6%
6.8% 6.2%
Employeeperformance/productivity
Companyprofit/performance
Team/departmentperformance
Contractualbonus
Salary increments Bonus payouts
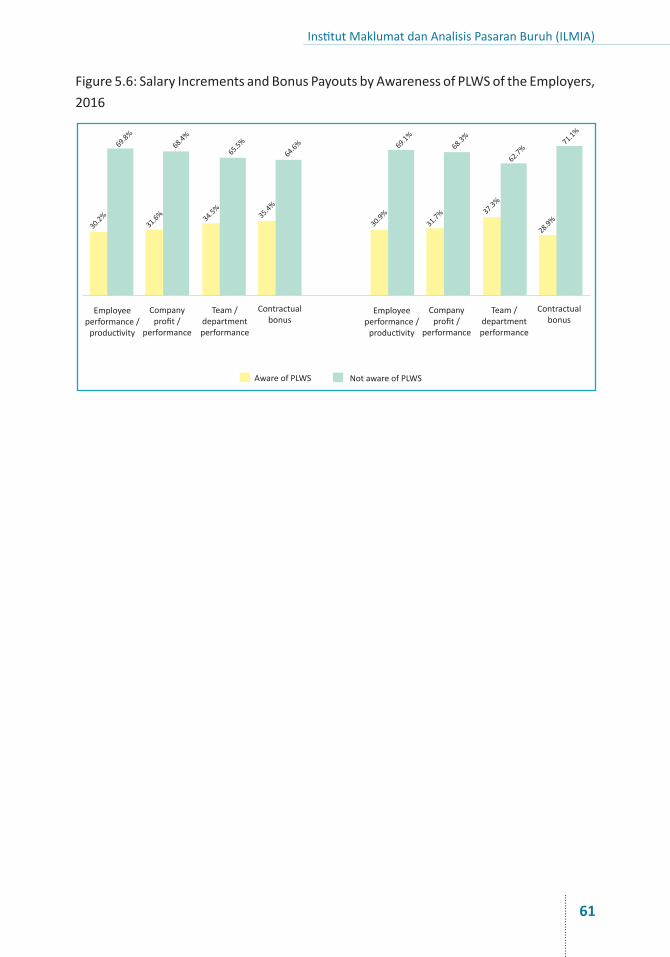
Institut Maklumat dan Analisis Pasaran Buruh (ILMIA)
61
Figure5.6:SalaryIncrementsandBonusPayoutsbyAwarenessofPLWSoftheEmployers,2016
30.2% 31
.6% 34.5% 35
.4%
30.9%
31.7%
37.3%
28.9%
69.8%
68.4%
65.5%
64.6% 69
.1%68.3%
62.7%
71.1%
Employeeperformance/productivity
AwareofPLWS NotawareofPLWS
Employeeperformance/productivity
Companyprofit/
performance
Companyprofit/
performance
Team/departmentperformance
Team/departmentperformance
Contractualbonus
Contractualbonus

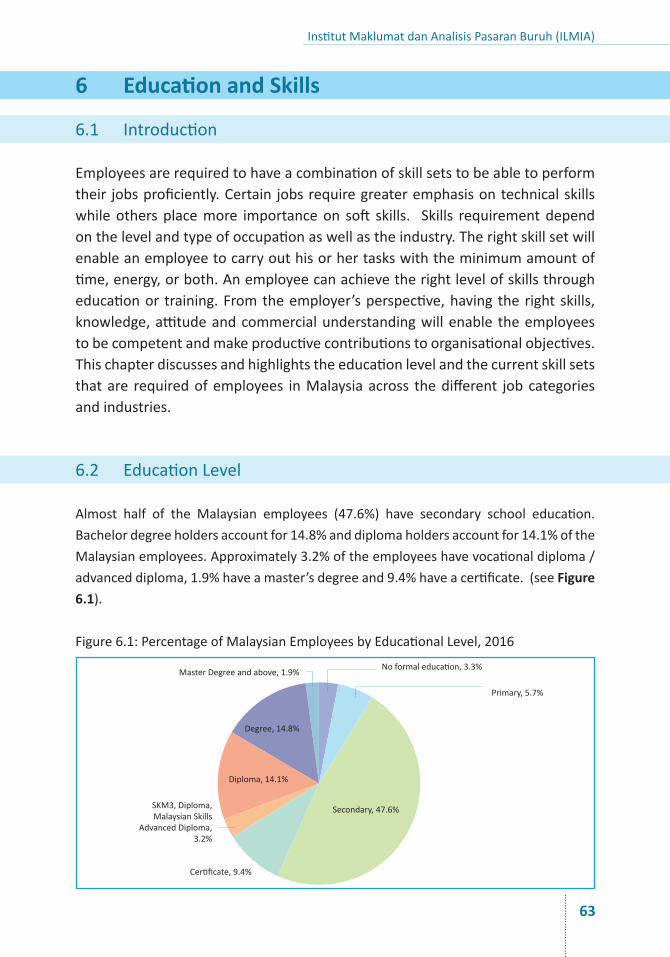
Institut Maklumat dan Analisis Pasaran Buruh (ILMIA)
63
6 Education and Skills
6.1 Introduction
Employeesarerequiredtohaveacombinationofskillsetstobeabletoperformtheir jobsproficiently.Certain jobsrequiregreateremphasisontechnicalskillswhileothersplacemore importanceon soft skills. Skills requirementdependonthelevelandtypeofoccupationaswellastheindustry.Therightskillsetwillenableanemployeetocarryouthisorhertaskswiththeminimumamountoftime,energy,orboth.Anemployeecanachievetherightlevelofskillsthrougheducationor training.Fromtheemployer’sperspective,havingtherightskills,knowledge,attitudeandcommercialunderstandingwillenable theemployeestobecompetentandmakeproductivecontributionstoorganisationalobjectives.Thischapterdiscussesandhighlightstheeducationlevelandthecurrentskillsetsthatare requiredofemployees inMalaysiaacross thedifferent jobcategoriesandindustries.
6.2 EducationLevel
Almost half of the Malaysian employees (47.6%) have secondary school education.Bachelordegreeholdersaccountfor14.8%anddiplomaholdersaccountfor14.1%oftheMalaysianemployees.Approximately3.2%oftheemployeeshavevocationaldiploma/advanceddiploma,1.9%haveamaster’sdegreeand9.4%haveacertificate.(seeFigure 6.1).
Figure6.1:PercentageofMalaysianEmployeesbyEducationalLevel,2016
Primary,5.7%
Noformaleducation,3.3%MasterDegreeandabove,1.9%
Degree,14.8%
Certificate,9.4%
Diploma,14.1%
Secondary,47.6%SKM3,Diploma,MalaysianSkills
AdvancedDiploma,3.2%
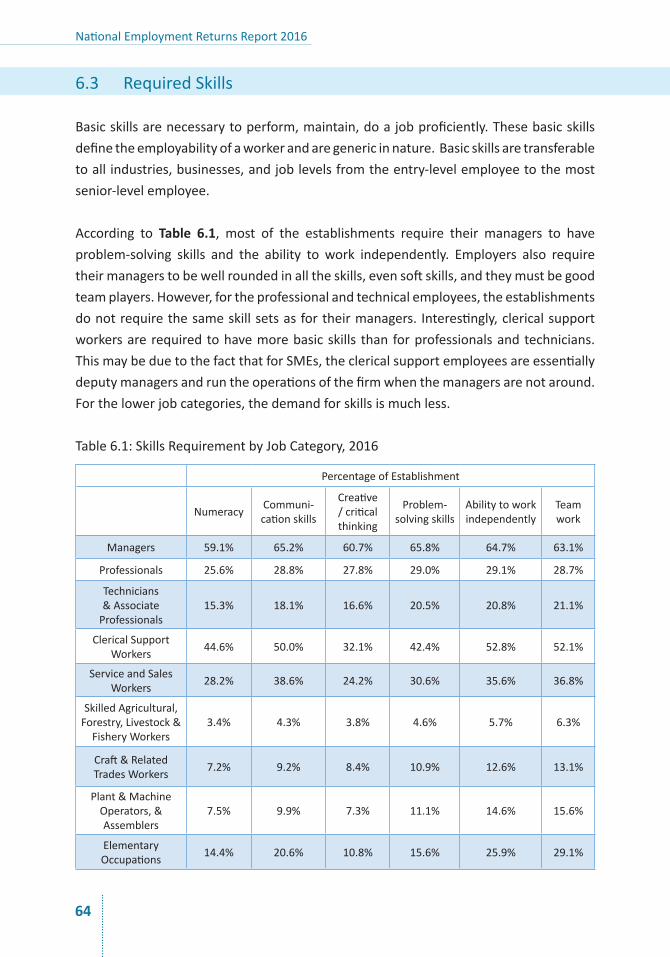
National Employment Returns Report 2016
64
6.3 RequiredSkills
Basicskillsarenecessarytoperform,maintain,doajobproficiently.Thesebasicskillsdefinetheemployabilityofaworkerandaregenericinnature.Basicskillsaretransferabletoallindustries,businesses,andjoblevelsfromtheentry-levelemployeetothemostsenior-levelemployee.
According to Table 6.1, most of the establishments require their managers to haveproblem-solving skills and the ability to work independently. Employers also requiretheirmanagerstobewellroundedinalltheskills,evensoftskills,andtheymustbegoodteamplayers.However,fortheprofessionalandtechnicalemployees,theestablishmentsdonotrequirethesameskillsetsasfortheirmanagers. Interestingly,clericalsupportworkersarerequiredtohavemorebasicskills thanforprofessionalsandtechnicians.ThismaybeduetothefactthatforSMEs,theclericalsupportemployeesareessentiallydeputymanagersandruntheoperationsofthefirmwhenthemanagersarenotaround.Forthelowerjobcategories,thedemandforskillsismuchless.
Table6.1:SkillsRequirementbyJobCategory,2016
PercentageofEstablishment
Numeracy Communi-cationskills
Creative/criticalthinking
Problem-solvingskills
Abilitytoworkindependently
Teamwork
Managers 59.1% 65.2% 60.7% 65.8% 64.7% 63.1%
Professionals 25.6% 28.8% 27.8% 29.0% 29.1% 28.7%
Technicians&AssociateProfessionals
15.3% 18.1% 16.6% 20.5% 20.8% 21.1%
ClericalSupportWorkers 44.6% 50.0% 32.1% 42.4% 52.8% 52.1%
ServiceandSalesWorkers 28.2% 38.6% 24.2% 30.6% 35.6% 36.8%
SkilledAgricultural,Forestry,Livestock&FisheryWorkers
3.4% 4.3% 3.8% 4.6% 5.7% 6.3%
Craft&RelatedTradesWorkers 7.2% 9.2% 8.4% 10.9% 12.6% 13.1%
Plant&MachineOperators,&Assemblers
7.5% 9.9% 7.3% 11.1% 14.6% 15.6%
ElementaryOccupations 14.4% 20.6% 10.8% 15.6% 25.9% 29.1%
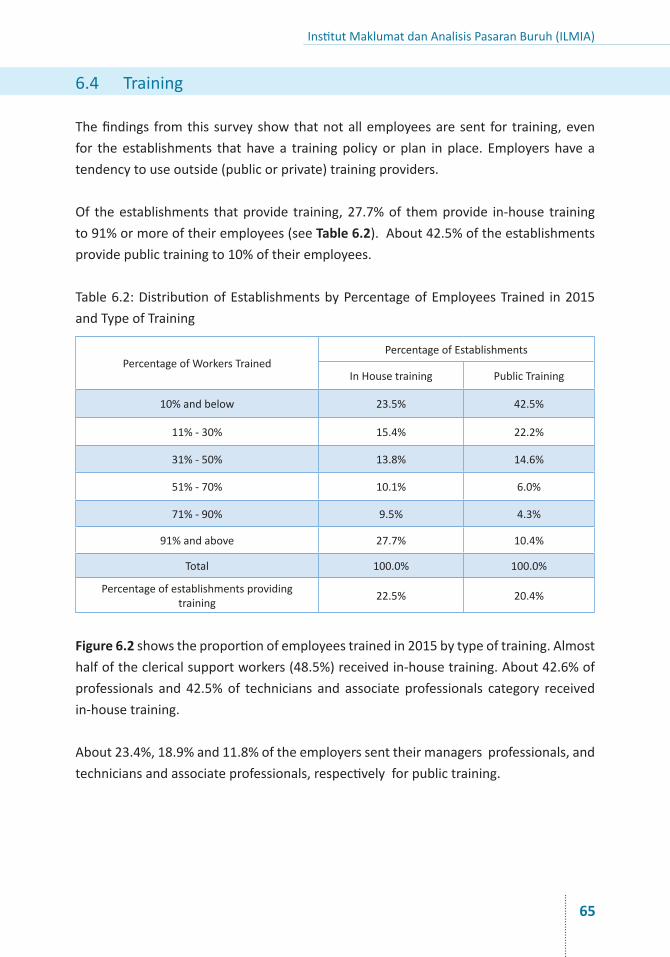
Institut Maklumat dan Analisis Pasaran Buruh (ILMIA)
65
6.4 Training
Thefindings fromthis surveyshowthatnotallemployeesaresent for training,evenfor theestablishments thathavea trainingpolicyorplan inplace. Employershaveatendencytouseoutside(publicorprivate)trainingproviders.
Of theestablishments thatprovide training,27.7%of themprovide in-house trainingto91%ormoreoftheiremployees(seeTable 6.2).About42.5%oftheestablishmentsprovidepublictrainingto10%oftheiremployees.
Table6.2:DistributionofEstablishmentsbyPercentageofEmployeesTrained in2015andTypeofTraining
PercentageofWorkersTrainedPercentageofEstablishments
InHousetraining PublicTraining
10%andbelow 23.5% 42.5%
11%-30% 15.4% 22.2%
31%-50% 13.8% 14.6%
51%-70% 10.1% 6.0%
71%-90% 9.5% 4.3%
91%andabove 27.7% 10.4%
Total 100.0% 100.0%
Percentageofestablishmentsprovidingtraining 22.5% 20.4%
Figure 6.2showstheproportionofemployeestrainedin2015bytypeoftraining.Almosthalfoftheclericalsupportworkers(48.5%)receivedin-housetraining.About42.6%ofprofessionals and 42.5%of technicians and associate professionals category receivedin-housetraining.
About23.4%,18.9%and11.8%oftheemployerssenttheirmanagersprofessionals,andtechniciansandassociateprofessionals,respectivelyforpublictraining.
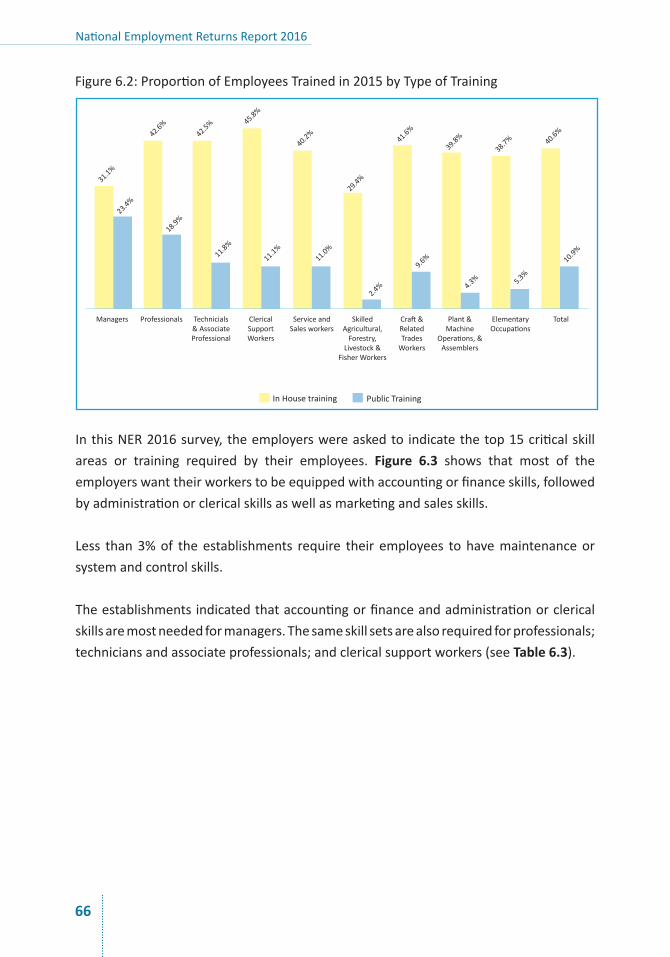
National Employment Returns Report 2016
66
Figure6.2:ProportionofEmployeesTrainedin2015byTypeofTraining
InthisNER2016survey,theemployerswereaskedto indicatethetop15criticalskillareas or training required by their employees. Figure 6.3 shows that most of theemployerswanttheirworkerstobeequippedwithaccountingorfinanceskills,followedbyadministrationorclericalskillsaswellasmarketingandsalesskills.
Less than3%of theestablishments require their employees tohavemaintenanceorsystemandcontrolskills.
Theestablishmentsindicatedthataccountingorfinanceandadministrationorclericalskillsaremostneededformanagers.Thesameskillsetsarealsorequiredforprofessionals;techniciansandassociateprofessionals;andclericalsupportworkers(seeTable 6.3).
31.1%
42.6%
18.9%
42.5%
11.8%
45.8%
11.1%
40.2%
11.0%
29.4%
41.6%
39.8%
4.3%
38.7%
5.3%
40.6%
10.9%
2.4%
9.6%
23.4%
Managers Professionals Technicials&AssociateProfessional
ClericalSupportWorkers
ServiceandSalesworkers
SkilledAgricultural,Forestry,
Livestock&FisherWorkers
Craft&RelatedTradesWorkers
Plant&Machine
Operations,&Assemblers
ElementaryOccupations
Total
InHousetraining PublicTraining
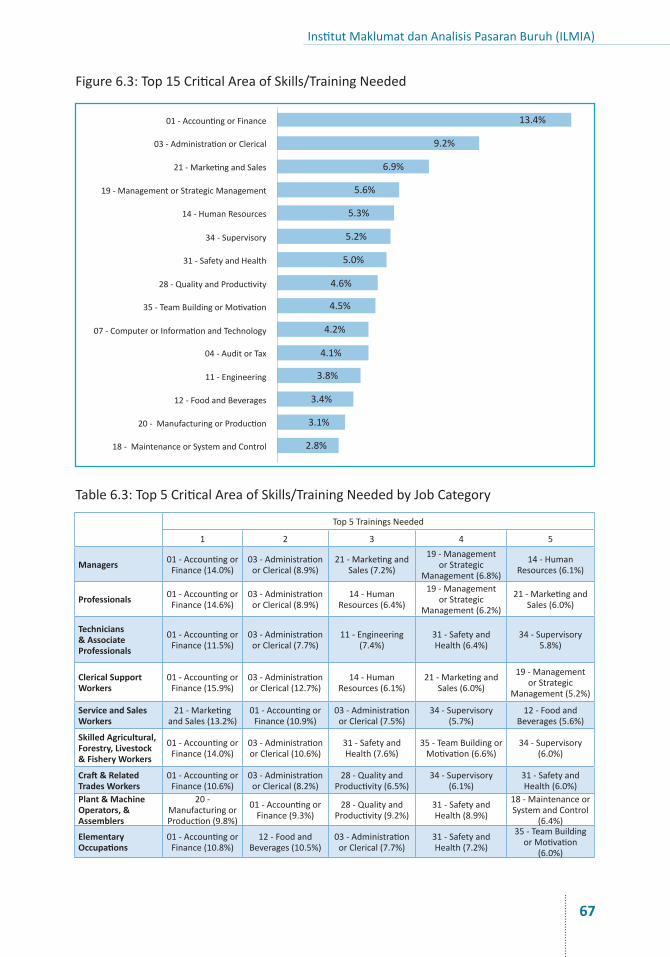
Institut Maklumat dan Analisis Pasaran Buruh (ILMIA)
67
Figure6.3:Top15CriticalAreaofSkills/TrainingNeeded
13.4%
9.2%
6.9%
5.6%
5.3%
5.2%
5.0%
4.6%
4.5%
4.2%
4.1%
3.8%
3.4%
3.1%
2.8%
Table6.3:Top5CriticalAreaofSkills/TrainingNeededbyJobCategory
Top5TrainingsNeeded
1 2 3 4 5
Managers 01-AccountingorFinance(14.0%)
03-AdministrationorClerical(8.9%)
21-MarketingandSales(7.2%)
19-ManagementorStrategic
Management(6.8%)
14-HumanResources(6.1%)
Professionals 01-AccountingorFinance(14.6%)
03-AdministrationorClerical(8.9%)
14-HumanResources(6.4%)
19-ManagementorStrategic
Management(6.2%)
21-MarketingandSales(6.0%)
Technicians & Associate Professionals
01-AccountingorFinance(11.5%)
03-AdministrationorClerical(7.7%)
11-Engineering(7.4%)
31-SafetyandHealth(6.4%)
34-Supervisory5.8%)
Clerical Support Workers
01-AccountingorFinance(15.9%)
03-AdministrationorClerical(12.7%)
14-HumanResources(6.1%)
21-MarketingandSales(6.0%)
19-ManagementorStrategic
Management(5.2%)
Service and Sales Workers
21-MarketingandSales(13.2%)
01-AccountingorFinance(10.9%)
03-AdministrationorClerical(7.5%)
34-Supervisory(5.7%)
12-FoodandBeverages(5.6%)
Skilled Agricultural, Forestry, Livestock & Fishery Workers
01-AccountingorFinance(14.0%)
03-AdministrationorClerical(10.6%)
31-SafetyandHealth(7.6%)
35-TeamBuildingorMotivation(6.6%)
34-Supervisory(6.0%)
Craft & Related Trades Workers
01-AccountingorFinance(10.6%)
03-AdministrationorClerical(8.2%)
28-QualityandProductivity(6.5%)
34-Supervisory(6.1%)
31-SafetyandHealth(6.0%)
Plant & Machine Operators, & Assemblers
20-ManufacturingorProduction(9.8%)
01-AccountingorFinance(9.3%)
28-QualityandProductivity(9.2%)
31-SafetyandHealth(8.9%)
18-MaintenanceorSystemandControl
(6.4%)
Elementary Occupations
01-AccountingorFinance(10.8%)
12-FoodandBeverages(10.5%)
03-AdministrationorClerical(7.7%)
31-SafetyandHealth(7.2%)
35-TeamBuildingorMotivation
(6.0%)
01-AccountingorFinance
03-AdministrationorClerical
21-MarketingandSales
19-ManagementorStrategicManagement
14-HumanResources
34-Supervisory
31-SafetyandHealth
28-QualityandProductivity
35-TeamBuildingorMotivation
07-ComputerorInformationandTechnology
04-AuditorTax
11-Engineering
12-FoodandBeverages
20-ManufacturingorProduction
18-MaintenanceorSystemandControl
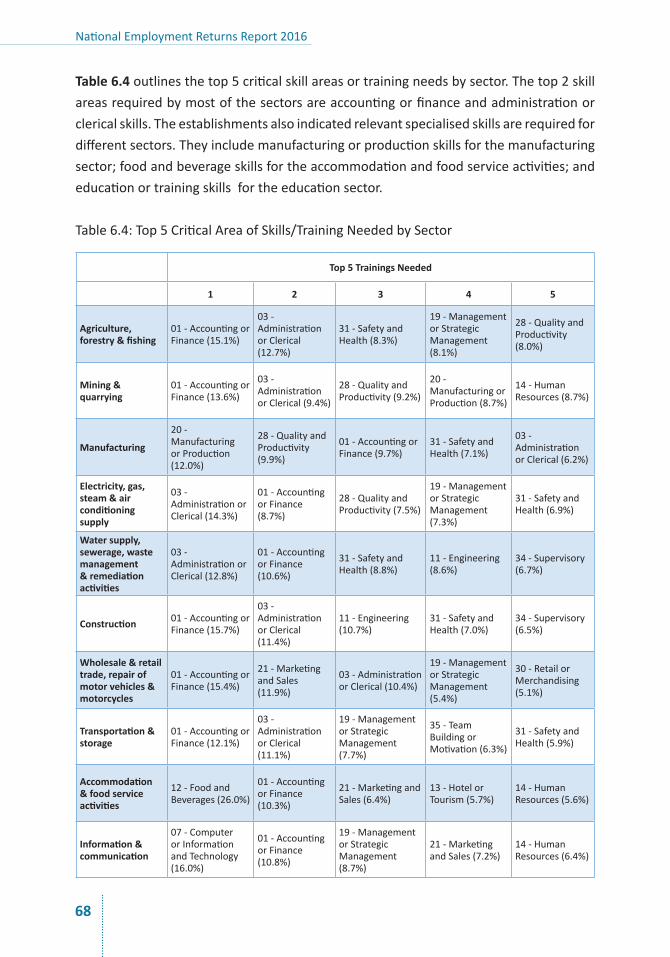
National Employment Returns Report 2016
68
Table 6.4outlinesthetop5criticalskillareasortrainingneedsbysector.Thetop2skillareasrequiredbymostofthesectorsareaccountingorfinanceandadministrationorclericalskills.Theestablishmentsalsoindicatedrelevantspecialisedskillsarerequiredfordifferentsectors.Theyincludemanufacturingorproductionskillsforthemanufacturingsector;foodandbeverageskillsfortheaccommodationandfoodserviceactivities;andeducationortrainingskillsfortheeducationsector.
Table6.4:Top5CriticalAreaofSkills/TrainingNeededbySector
Top 5 Trainings Needed
1 2 3 4 5
Agriculture, forestry & fishing
01-AccountingorFinance(15.1%)
03-AdministrationorClerical(12.7%)
31-SafetyandHealth(8.3%)
19-ManagementorStrategicManagement(8.1%)
28-QualityandProductivity(8.0%)
Mining & quarrying
01-AccountingorFinance(13.6%)
03-AdministrationorClerical(9.4%)
28-QualityandProductivity(9.2%)
20-ManufacturingorProduction(8.7%)
14-HumanResources(8.7%)
Manufacturing
20-ManufacturingorProduction(12.0%)
28-QualityandProductivity(9.9%)
01-AccountingorFinance(9.7%)
31-SafetyandHealth(7.1%)
03-AdministrationorClerical(6.2%)
Electricity, gas, steam & air conditioning supply
03-AdministrationorClerical(14.3%)
01-AccountingorFinance(8.7%)
28-QualityandProductivity(7.5%)
19-ManagementorStrategicManagement(7.3%)
31-SafetyandHealth(6.9%)
Water supply, sewerage, waste management & remediation activities
03-AdministrationorClerical(12.8%)
01-AccountingorFinance(10.6%)
31-SafetyandHealth(8.8%)
11-Engineering(8.6%)
34-Supervisory(6.7%)
Construction 01-AccountingorFinance(15.7%)
03-AdministrationorClerical(11.4%)
11-Engineering(10.7%)
31-SafetyandHealth(7.0%)
34-Supervisory(6.5%)
Wholesale & retail trade, repair of motor vehicles & motorcycles
01-AccountingorFinance(15.4%)
21-MarketingandSales(11.9%)
03-AdministrationorClerical(10.4%)
19-ManagementorStrategicManagement(5.4%)
30-RetailorMerchandising(5.1%)
Transportation & storage
01-AccountingorFinance(12.1%)
03-AdministrationorClerical(11.1%)
19-ManagementorStrategicManagement(7.7%)
35-TeamBuildingorMotivation(6.3%)
31-SafetyandHealth(5.9%)
Accommodation & food service activities
12-FoodandBeverages(26.0%)
01-AccountingorFinance(10.3%)
21-MarketingandSales(6.4%)
13-HotelorTourism(5.7%)
14-HumanResources(5.6%)
Information & communication
07-ComputerorInformationandTechnology(16.0%)
01-AccountingorFinance(10.8%)
19-ManagementorStrategicManagement(8.7%)
21-MarketingandSales(7.2%)
14-HumanResources(6.4%)
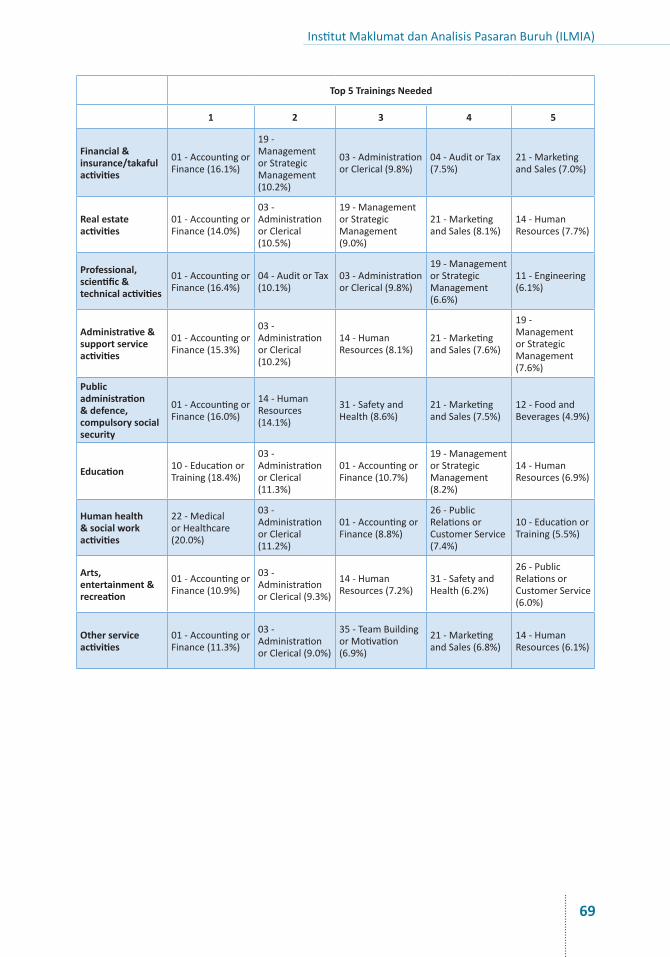
Institut Maklumat dan Analisis Pasaran Buruh (ILMIA)
69
Top 5 Trainings Needed
1 2 3 4 5
Financial & insurance/takaful activities
01-AccountingorFinance(16.1%)
19-ManagementorStrategicManagement(10.2%)
03-AdministrationorClerical(9.8%)
04-AuditorTax(7.5%)
21-MarketingandSales(7.0%)
Real estate activities
01-AccountingorFinance(14.0%)
03-AdministrationorClerical(10.5%)
19-ManagementorStrategicManagement(9.0%)
21-MarketingandSales(8.1%)
14-HumanResources(7.7%)
Professional, scientific & technical activities
01-AccountingorFinance(16.4%)
04-AuditorTax(10.1%)
03-AdministrationorClerical(9.8%)
19-ManagementorStrategicManagement(6.6%)
11-Engineering(6.1%)
Administrative & support service activities
01-AccountingorFinance(15.3%)
03-AdministrationorClerical(10.2%)
14-HumanResources(8.1%)
21-MarketingandSales(7.6%)
19-ManagementorStrategicManagement(7.6%)
Public administration & defence, compulsory social security
01-AccountingorFinance(16.0%)
14-HumanResources(14.1%)
31-SafetyandHealth(8.6%)
21-MarketingandSales(7.5%)
12-FoodandBeverages(4.9%)
Education 10-EducationorTraining(18.4%)
03-AdministrationorClerical(11.3%)
01-AccountingorFinance(10.7%)
19-ManagementorStrategicManagement(8.2%)
14-HumanResources(6.9%)
Human health & social work activities
22-MedicalorHealthcare(20.0%)
03-AdministrationorClerical(11.2%)
01-AccountingorFinance(8.8%)
26-PublicRelationsorCustomerService(7.4%)
10-EducationorTraining(5.5%)
Arts, entertainment & recreation
01-AccountingorFinance(10.9%)
03-AdministrationorClerical(9.3%)
14-HumanResources(7.2%)
31-SafetyandHealth(6.2%)
26-PublicRelationsorCustomerService(6.0%)
Other service activities
01-AccountingorFinance(11.3%)
03-AdministrationorClerical(9.0%)
35-TeamBuildingorMotivation(6.9%)
21-MarketingandSales(6.8%)
14-HumanResources(6.1%)

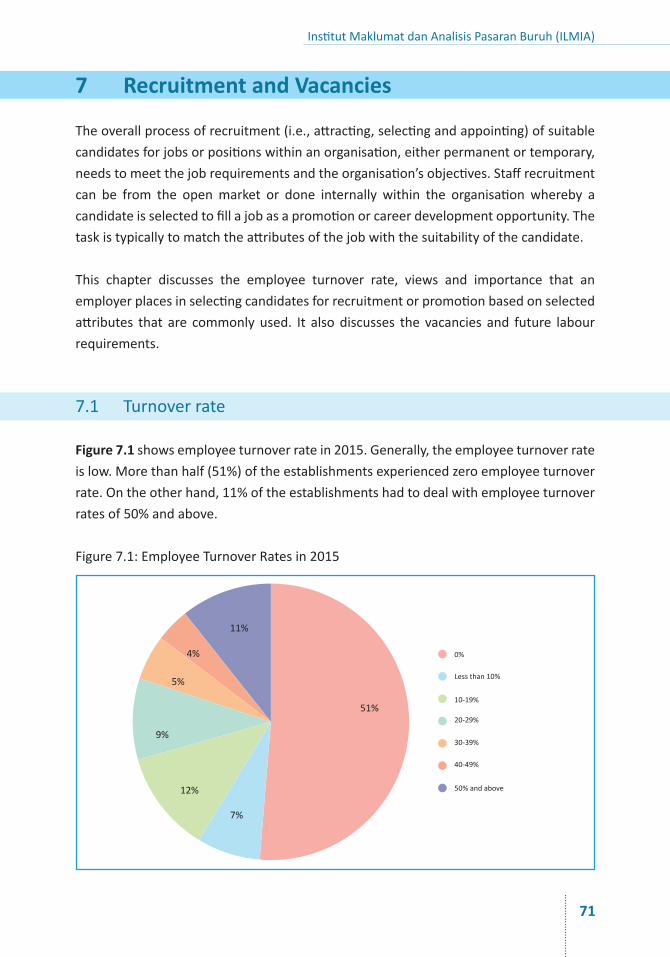
Institut Maklumat dan Analisis Pasaran Buruh (ILMIA)
71
7 Recruitment and Vacancies
Theoverallprocessofrecruitment(i.e.,attracting,selectingandappointing)ofsuitablecandidatesforjobsorpositionswithinanorganisation,eitherpermanentortemporary,needstomeetthejobrequirementsandtheorganisation’sobjectives.Staffrecruitmentcan be from the openmarket or done internally within the organisation whereby acandidateisselectedtofillajobasapromotionorcareerdevelopmentopportunity.Thetaskistypicallytomatchtheattributesofthejobwiththesuitabilityofthecandidate.
This chapter discusses the employee turnover rate, views and importance that anemployerplacesinselectingcandidatesforrecruitmentorpromotionbasedonselectedattributes that are commonlyused. It alsodiscusses the vacancies and future labourrequirements.
7.1 Turnoverrate
Figure 7.1showsemployeeturnoverratein2015.Generally,theemployeeturnoverrateislow.Morethanhalf(51%)oftheestablishmentsexperiencedzeroemployeeturnoverrate.Ontheotherhand,11%oftheestablishmentshadtodealwithemployeeturnoverratesof50%andabove.
Figure7.1:EmployeeTurnoverRatesin2015
51%
7%
12%
9%
5%
4%
11%
0%
Lessthan10%
10-19%
20-29%
30-39%
40-49%
50%andabove
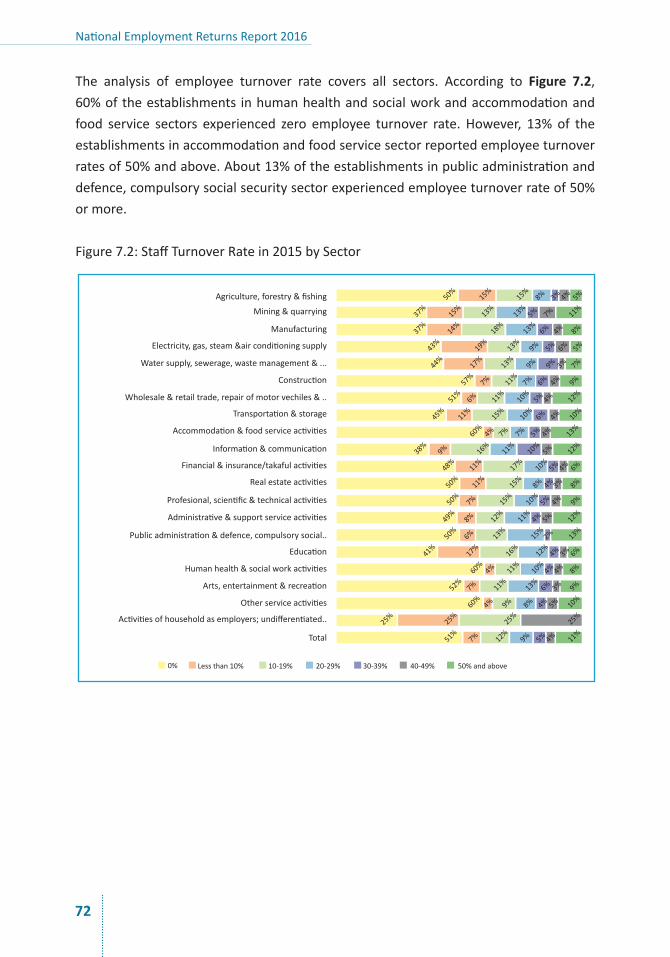
National Employment Returns Report 2016
72
The analysis of employee turnover rate covers all sectors. According to Figure 7.2,60%oftheestablishments inhumanhealthandsocialworkandaccommodationandfood service sectors experienced zero employee turnover rate. However, 13% of theestablishmentsinaccommodationandfoodservicesectorreportedemployeeturnoverratesof50%andabove.About13%oftheestablishmentsinpublicadministrationanddefence,compulsorysocialsecuritysectorexperiencedemployeeturnoverrateof50%ormore.
Figure7.2:StaffTurnoverRatein2015bySector
50%
37%
37%
43%
44%
57%
51%
45%
60%
38%
48%
50%
50%
49%
50%
41%
60%
52%
60%
25%
0% Lessthan10% 10-19% 20-29% 30-39% 40-49% 50%andabove
51%
7% 12%
9% 5% 4% 11%
25%
25%
25%
4% 9% 8% 4% 5% 10%
7% 11%
13%
6% 3% 9%
4% 11%
10%4% 4% 8%
17%
16%
12%
4% 3% 6%
6% 13%
15%2% 13
%8% 12
%11%
4% 5% 12%
7% 15%
10%
5% 4% 9%
11%
15%
8% 4% 3% 8%
11%
17%
10%
5% 4% 6%
9% 16%
11%
10%
5% 12%
4% 7% 7% 5% 4% 13%
11%
15%
10%
6% 4% 10%
7% 11%
11%
12%
10%7% 6%
6%
4%
4%
9%
17%
13%
9% 9% 3% 7%
19%
13%
9% 5% 5%
5%
6%
14%
18%
13%
6% 4% 8%
15%
13%
13%
5% 7% 11%
15%
15%
5%8% 3% 4%Agriculture,forestry&fishing
Mining&quarrying
Manufacturing
Electricity,gas,steam&airconditioningsupply
Watersupply,sewerage,wastemanagement&...
Construction
Wholesale&retailtrade,repairofmotorvechiles&..
Transportation&storage
Accommodation&foodserviceactivities
Information&communication
Financial&insurance/takafulactivities
Realestateactivities
Profesional,scientific&technicalactivities
Administrative&supportserviceactivities
Publicadministration&defence,compulsorysocial..
Education
Humanhealth&socialworkactivities
Arts,entertainment&recreation
Otherserviceactivities
Activitiesofhouseholdasemployers;undifferentiated..
Total
Institut Maklumat dan Analisis Pasaran Buruh (ILMIA)
73
7.2 Vacancies
The labourmarket isdynamic,flexibleandeverchanging. Vacancies inorganisationsoccur because of resignations, retirement, dismissals and promotions. It can also bedue to the formationofaneworganisation,anewdepartmentoranewunitwhereadditionalemployeesarerequired.Itcanalsobeduetochangesinworkproceduresorequipmentwhichmaycreatenewopeningsforindividualswithspecificskills.
When there is a tight labourmarket, it takes longer and is more difficult to fill thevacancies.Thereisinevitablysomedegreeofamismatchbetweensupplyanddemand.Skillsshortagesmakeitharderforcompaniestohireandthemajorityofthemwouldfind itdifficult tohirehighly-skilledand technicalworkers.On theotherhand,at thelowerendofthejobstructure,manyshyawayfromjobsthatareconsideredasdirty,dangerousanddemeaningordifficult.
This section of the report looks into the job vacancy rate and reasons behind whyvacanciesaredifficulttofillbasedoninformationcollectedfromtheNER2016survey.
7.2.1 VacancyRate
TheNER2016 results show that sales and serviceworkers categoryhas thehighestvacancyrateof9.7%(seeFigure 7.3).This is followedbyskilledagricultural, forestry,livestock&fisheryworkersandplantandmachineoperatorsandassemblerscategoriesat8.9%and8.4%respectively.Intermsofdistributionofcurrentvacancies,thehighestshareisfoundintheplant&machineoperatorsandassemblersjobcategory(24,636),followed by elementary workers (18,657) category. It appears that there are labourshortagesinspecificjobsandperhapsincertainlocations.
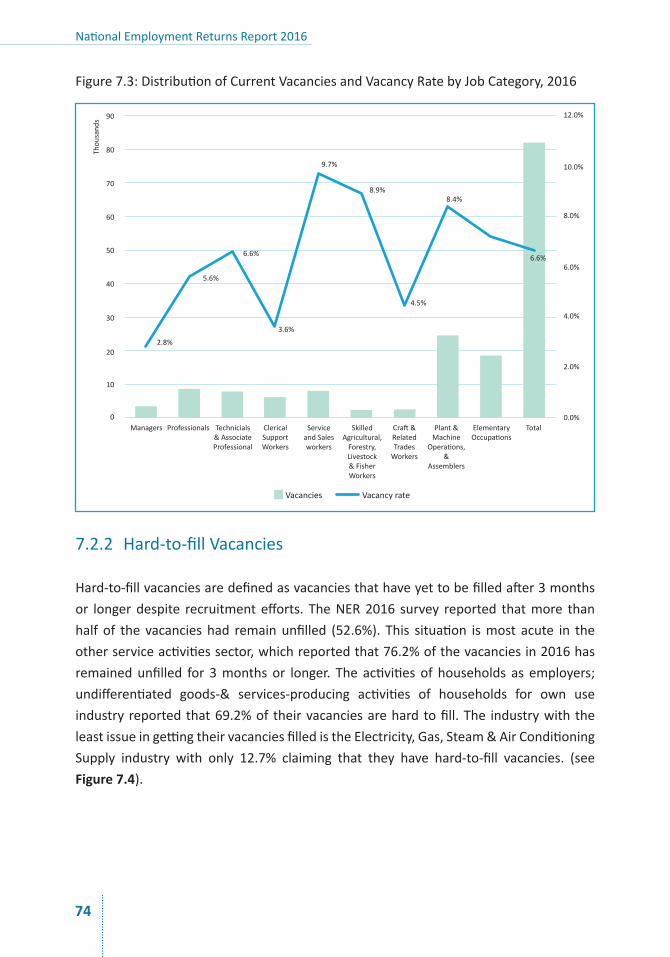
National Employment Returns Report 2016
74
Figure7.3:DistributionofCurrentVacanciesandVacancyRatebyJobCategory,2016
7.2.2 Hard-to-fillVacancies
Hard-to-fillvacanciesaredefinedasvacanciesthathaveyettobefilledafter3monthsor longerdespite recruitmentefforts. TheNER2016 survey reported thatmore thanhalf of the vacancieshad remainunfilled (52.6%). This situation ismost acute in theotherserviceactivitiessector,whichreportedthat76.2%ofthevacanciesin2016hasremainedunfilled for 3monthsor longer. The activitiesof households as employers;undifferentiated goods-& services-producing activities of households for own useindustryreportedthat69.2%of theirvacanciesarehardtofill.The industrywiththeleastissueingettingtheirvacanciesfilledistheElectricity,Gas,Steam&AirConditioningSupply industry with only 12.7% claiming that they have hard-to-fill vacancies. (seeFigure 7.4).
Managers Professionals Technicials&AssociateProfessional
ClericalSupportWorkers
ServiceandSalesworkers
SkilledAgricultural,Forestry,Livestock&FisherWorkers
Craft&RelatedTradesWorkers
Plant&Machine
Operations,&
Assemblers
ElementaryOccupations
Total
Vacancies Vacancyrate
2.8%
0
10
20
30
40
50
60
70
80Thou
sand
s 90
5.6%
6.6%
3.6%
0.0%
2.0%
4.0%
6.0%
8.0%
10.0%
12.0%
9.7%
8.9%
4.5%
8.4%
6.6%
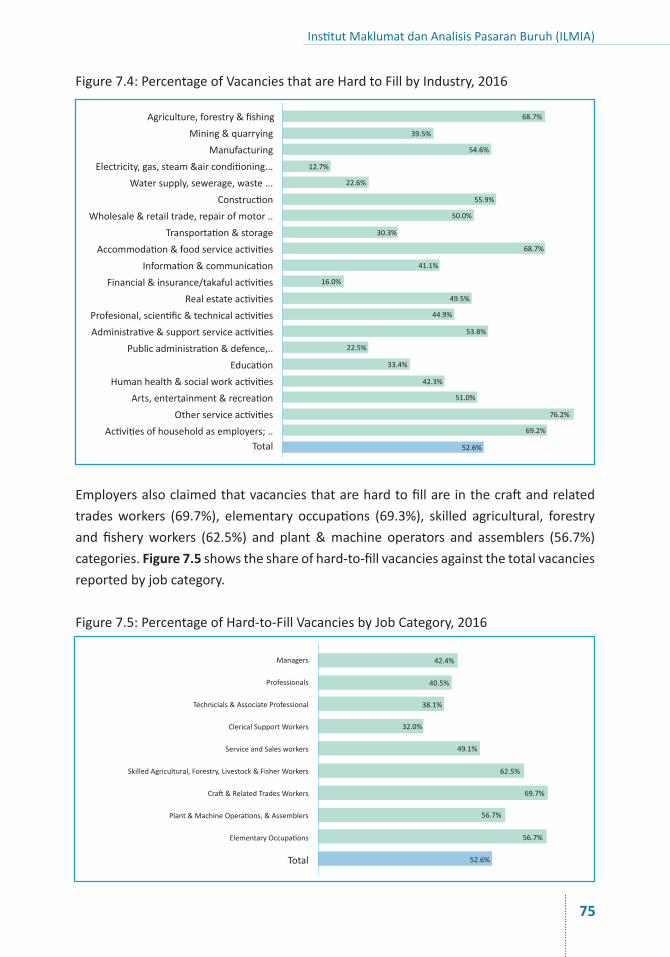
Institut Maklumat dan Analisis Pasaran Buruh (ILMIA)
75
Figure7.4:PercentageofVacanciesthatareHardtoFillbyIndustry,2016
Employersalsoclaimedthatvacanciesthatarehardtofillareinthecraftandrelatedtradesworkers (69.7%), elementary occupations (69.3%), skilled agricultural, forestryand fisheryworkers (62.5%) and plant&machine operators and assemblers (56.7%)categories.Figure 7.5showstheshareofhard-to-fillvacanciesagainstthetotalvacanciesreportedbyjobcategory.
Figure7.5:PercentageofHard-to-FillVacanciesbyJobCategory,2016
Managers
Professionals
Technicials&AssociateProfessional
ClericalSupportWorkers
ServiceandSalesworkers
SkilledAgricultural,Forestry,Livestock&FisherWorkers
Craft&RelatedTradesWorkers
Plant&MachineOperations,&Assemblers
ElementaryOccupations
68.7%
39.5%
54.6%
12.7%
22.6%
55.9%
50.0%
30.3%
68.7%
41.1%
16.0%
49.5%
44.9%
53.8%
22.5%
33.4%
42.3%
51.0%
76.2%
69.2%
52.6%
42.4%
40.5%
38.1%
32.0%
49.1%
62.5%
69.7%
56.7%
56.7%
52.6%
Agriculture,forestry&fishingMining&quarrying
ManufacturingElectricity,gas,steam&airconditioning...
Watersupply,sewerage,waste...Construction
Wholesale&retailtrade,repairofmotor..Transportation&storage
Accommodation&foodserviceactivitiesInformation&communication
Financial&insurance/takafulactivitiesRealestateactivities
Profesional,scientific&technicalactivitiesAdministrative&supportserviceactivities
Publicadministration&defence,..Education
Humanhealth&socialworkactivitiesArts,entertainment&recreation
OtherserviceactivitiesActivitiesofhouseholdasemployers;..
Total
Total
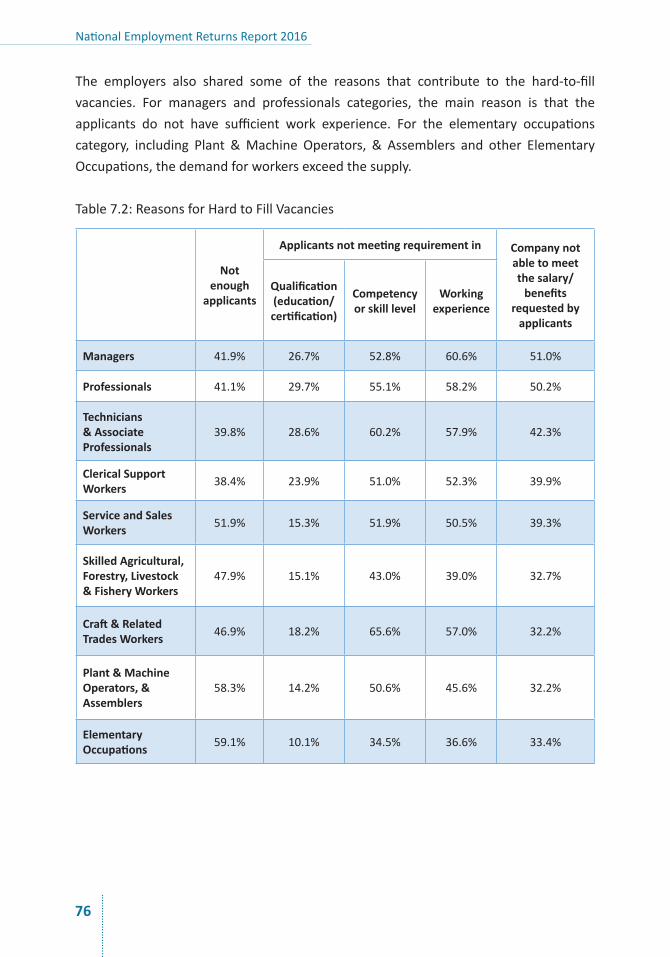
National Employment Returns Report 2016
76
The employers also shared some of the reasons that contribute to the hard-to-fillvacancies. For managers and professionals categories, the main reason is that theapplicants do not have sufficient work experience. For the elementary occupationscategory, including Plant &Machine Operators, & Assemblers and other ElementaryOccupations,thedemandforworkersexceedthesupply.
Table7.2:ReasonsforHardtoFillVacancies
Not enough
applicants
Applicants not meeting requirement in Company not able to meet the salary/
benefits requested by
applicants
Qualification (education/ certification)
Competency or skill level
Working experience
Managers 41.9% 26.7% 52.8% 60.6% 51.0%
Professionals 41.1% 29.7% 55.1% 58.2% 50.2%
Technicians & Associate Professionals
39.8% 28.6% 60.2% 57.9% 42.3%
Clerical Support Workers 38.4% 23.9% 51.0% 52.3% 39.9%
Service and Sales Workers 51.9% 15.3% 51.9% 50.5% 39.3%
Skilled Agricultural, Forestry, Livestock & Fishery Workers
47.9% 15.1% 43.0% 39.0% 32.7%
Craft & Related Trades Workers 46.9% 18.2% 65.6% 57.0% 32.2%
Plant & Machine Operators, & Assemblers
58.3% 14.2% 50.6% 45.6% 32.2%
Elementary Occupations 59.1% 10.1% 34.5% 36.6% 33.4%
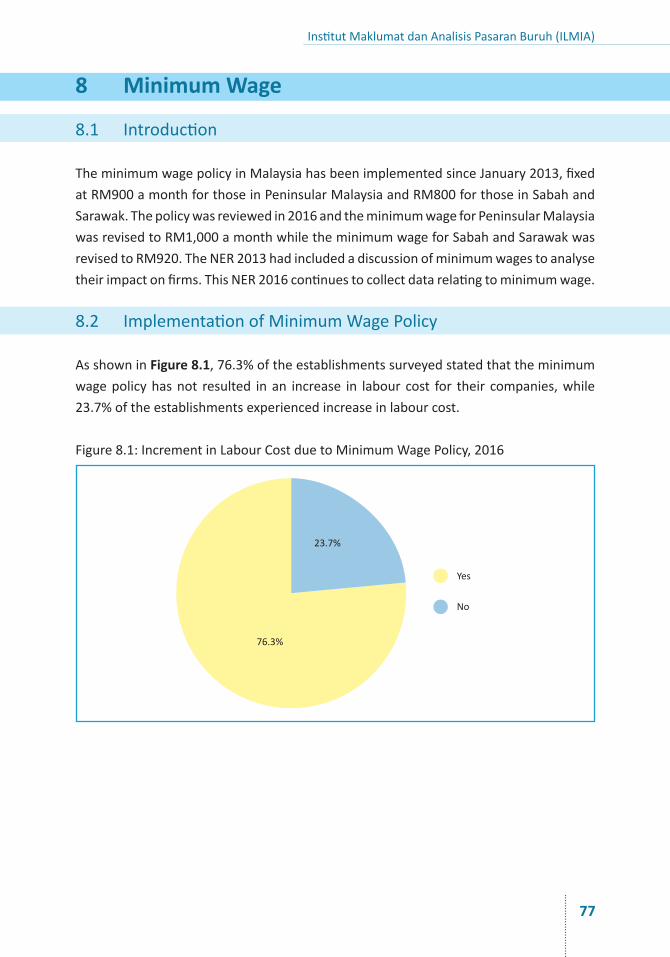
Institut Maklumat dan Analisis Pasaran Buruh (ILMIA)
77
8 Minimum Wage
8.1 Introduction
TheminimumwagepolicyinMalaysiahasbeenimplementedsinceJanuary2013,fixedatRM900amonthforthoseinPeninsularMalaysiaandRM800forthoseinSabahandSarawak.Thepolicywasreviewedin2016andtheminimumwageforPeninsularMalaysiawasrevisedtoRM1,000amonthwhiletheminimumwageforSabahandSarawakwasrevisedtoRM920.TheNER2013hadincludedadiscussionofminimumwagestoanalysetheirimpactonfirms.ThisNER2016continuestocollectdatarelatingtominimumwage.
8.2 ImplementationofMinimumWagePolicy
AsshowninFigure 8.1,76.3%oftheestablishmentssurveyedstatedthattheminimumwagepolicyhasnot resulted inan increase in labour cost for their companies,while23.7%oftheestablishmentsexperiencedincreaseinlabourcost.
Figure8.1:IncrementinLabourCostduetoMinimumWagePolicy,2016
76.3%
Yes
No
23.7%
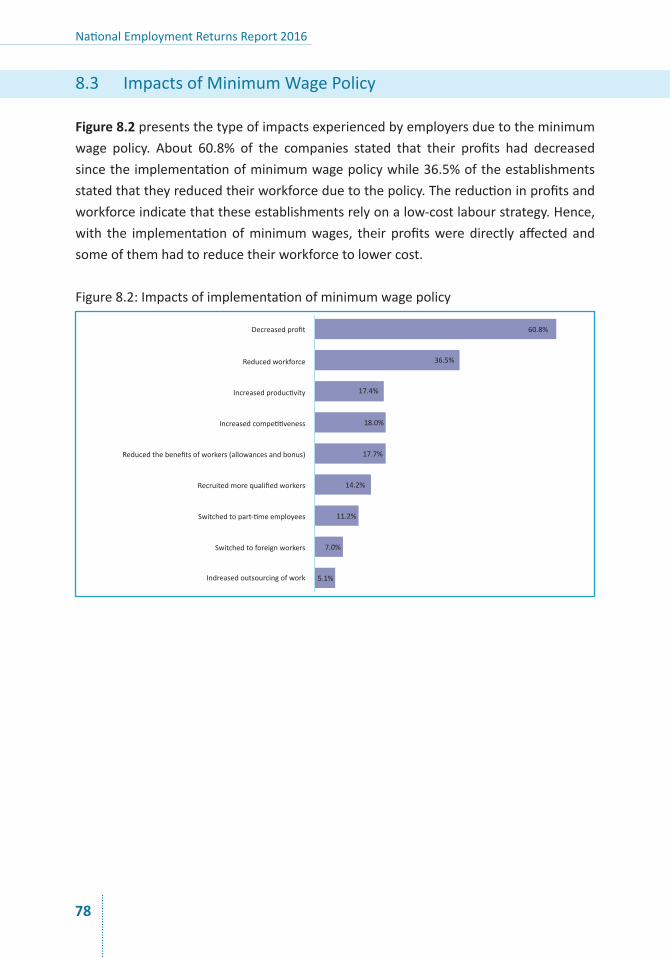
National Employment Returns Report 2016
78
8.3 ImpactsofMinimumWagePolicy
Figure 8.2 presentsthetypeofimpactsexperiencedbyemployersduetotheminimumwage policy. About 60.8% of the companies stated that their profits had decreasedsincetheimplementationofminimumwagepolicywhile36.5%oftheestablishmentsstatedthattheyreducedtheirworkforceduetothepolicy.Thereductioninprofitsandworkforceindicatethattheseestablishmentsrelyonalow-costlabourstrategy.Hence,with the implementationofminimumwages, their profitsweredirectly affectedandsomeofthemhadtoreducetheirworkforcetolowercost.
Figure8.2:Impactsofimplementationofminimumwagepolicy
60.8%Decreasedprofit
Reducedworkforce
Increasedproductivity
Increasedcompetitiveness
Reducedthebenefitsofworkers(allowancesandbonus)
Recruitedmorequalifiedworkers
Switchedtopart-timeemployees
Switchedtoforeignworkers
Indreasedoutsourcingofwork
36.5%
17.4%
18.0%
17.7%
14.2%
11.2%
7.0%
5.1%
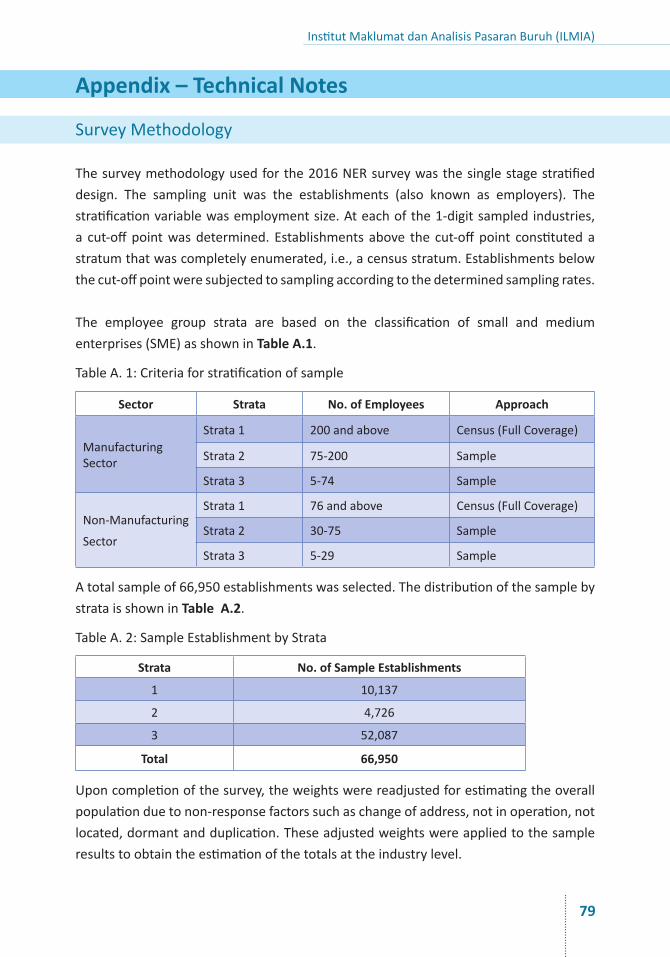
Institut Maklumat dan Analisis Pasaran Buruh (ILMIA)
79
Appendix – Technical Notes
SurveyMethodology
Thesurveymethodologyusedforthe2016NERsurveywasthesinglestagestratifieddesign. The sampling unit was the establishments (also known as employers). Thestratificationvariablewasemploymentsize.Ateachofthe1-digitsampledindustries,a cut-offpointwasdetermined. Establishments above the cut-offpoint constitutedastratumthatwascompletelyenumerated,i.e.,acensusstratum.Establishmentsbelowthecut-offpointweresubjectedtosamplingaccordingtothedeterminedsamplingrates.
The employee group strata are based on the classification of small and mediumenterprises(SME)asshowninTable A.1.
TableA.1:Criteriaforstratificationofsample
Sector Strata No. of Employees Approach
ManufacturingSector
Strata1 200andabove Census(FullCoverage)
Strata2 75-200 Sample
Strata3 5-74 Sample
Non-Manufacturing
Sector
Strata1 76andabove Census(FullCoverage)
Strata2 30-75 Sample
Strata3 5-29 Sample
Atotalsampleof66,950establishmentswasselected.ThedistributionofthesamplebystrataisshowninTable A.2.
TableA.2:SampleEstablishmentbyStrata
Strata No. of Sample Establishments
1 10,137
2 4,726
3 52,087
Total 66,950
Uponcompletionofthesurvey,theweightswerereadjustedforestimatingtheoverallpopulationduetonon-responsefactorssuchaschangeofaddress,notinoperation,notlocated,dormantandduplication.Theseadjustedweightswereappliedtothesampleresultstoobtaintheestimationofthetotalsattheindustrylevel.
National Employment Returns Report 2016
80
ACKNOWLEDGEMENTS
ILMIAexpressesdeepappreciationforthecontributionsoftheNER2016SurveyTeam.Thehardwork,supportandcollaborationofmembersoftheteamwereindispensablein ensuring that the survey was effected successfully. In particular the tireless anddeterminedeffortsof the team in thedistributionof thequestionnaires, interactionswithrespondentsandthetimelyretrievalofthecompletedsurveyformsensuredthattheprimaryphaseofNER2016waspositivelysurpassed.TheNER2016SurveyTeamcommitteemembersincludedrepresentativesfromthe:
1. HumanResourcesDevelopmentFund
2. DepartmentofLabour,PeninsularMalaysia
3. DepartmentofLabour,Sarawak
4. DepartmentofLabour,Sabah
5. DepartmentofOccupationalSafetyandHealth
6. SocialSecurityOrganization
7. DepartmentofIndustrialRelations
ILMIAisgratefulforthecollegialcooperationandtheconstructivefeedbackreceivedfromthemembersoftheteamthroughouttheNER2016developmentprocess,aswellasinthepreparationofthereportonthefindingsofthesurvey.Welookforwardtocontinuepartnershipwiththedepartmentsandagenciesinfutureendeavours,particularlyinthenextNERsurvey.
ILMIA also extends special gratitude to the management and staff of the HumanResourcesDevelopmentFundforthefinancialsupportprovidedtoenableNER2016tobeundertaken.