effect of inoculum concentration on …umpir.ump.edu.my/4230/1/baiyinah_talip_cd5945.pdf · rahsia...
TRANSCRIPT
EFFECT OF INOCULUM CONCENTRATION ON BUTANOL AND ETHANOL
PRODUCTION BY CLOSTRIDIUM ACETOBUTYLICUM
BAIYINAH BTE HAJI A. TALIP
UNIVERSITI MALAYSIA PAHANG
UNIVERSITI MALAYSIA PAHANG
CATATAN: * Potong yang tidak berkenaan.
** Jika tesis ini SULIT atau TERHAD, sila lampirkan surat daripada pihak
berkuasa/organisasi berkenaan dengan menyatakan sekali sebab dan
tempoh tesis ini perlu dikelaskan sebagai SULIT atau TERHAD.
♦ Tesis dimaksudkan sebagai tesis bagi Ijazah Doktor Falsafah dan
Sarjana secara penyelidikan, atau disertai bagi pengajian secara kerja
kursus dan penyelidikan, atau Laporan Projek Sarjana Muda (PSM).
BORANG PENGESAHAN STATUS TESIS♦
JUDUL: EFFECT OF INOCULUM CONCENTRATION ON BUTANOL AND
ETHANOL PRODUCTION BY CLOSTRIDIUM ACETOBUTYLICUM
SESI PENGAJIAN: 2009/2010
Saya BAIYINAH BTE HAJI A. TALIP
(HURUF BESAR)
mengaku membenarkan tesis Projek Sarjana Muda (PSM) ini disimpan di Perpustakaan Universiti
Malaysia Pahang dengan syarat-syarat kegunaan seperti berikut:
1. Hakmilik kertas projek adalah di bawah nama penulis melainkan penulisan sebagai projek
bersama dan dibiayai oleh UMP, hakmiliknya adalah kepunyaan UMP.
2. Naskah salinan di dalam bentuk kertas atau mikro hanya boleh dibuat dengan kebenaran
bertulis daripada penulis.
3. Perpustakaan Universiti Malaysia Pahang dibenarkan membuat salinan untuk tujuan pengajian
mereka.
4. Kertas projek hanya boleh diterbitkan dengan kebenaran penulis. Bayaran royalti adalah
mengikut kadar yang dipersetujui kelak.
5. *Saya membenarkan/tidak membenarkan Perpustakaan membuat salinan kertas projek ini
sebagai bahan pertukaran di antara institusi pengajian tinggi.
6. **Sila tandakan (√)
SULIT (Mengandungi maklumat yang berdarjah keselamatan atau
kepentingan Malaysia seperti yang termaktub di dalam AKTA
RAHSIA RASMI 1972)
TERHAD (Mengandungi maklumat TERHAD yang telah ditentukan oleh
organisasi/badan di mana penyelidikan dijalankan)
TIDAK TERHAD
Disahkan oleh
_____________________ __________________________
(TANDATANGAN PENULIS) TANDATANGAN PENYELIA)
Alamat Tetap: Pos 31, Jalan Tanjung CIK SHARIZA JAMEK
Gading, 84000, Muar Nama Penyelia
Johor. Tarikh: 30 April 2010 Tarikh: 30 April 2010
“I hereby declare that I have read this thesis and in
my opinion this thesis is sufficient in terms of scope and
quality for the award of the degree of
Bachelor of Chemical Engineering (Biotechnology)”
Signature : ......................................
Supervisor : Shariza bte Jamek
Date : ......................................
i
EFFECT OF INOCULUM CONCENTRATION ON BUTANOL AND ETHANOL
PRODUCTION BY CLOSTRIDIUM ACETOBUTYLICUM
BAIYINAH BTE HAJ A. TALIP
A thesis submitted in fulfillment of the
requirements for the award of the degree of
Bachelor of Chemical Engineering (Biotechnology)
Faculty of Chemical & Natural Resources Engineering
Universiti Malaysia Pahang
APRIL 2010
ii
I declare that this thesis entitled “Effect Of Inoculum Concentration On Butanol And
Ethanol Production by Clostridium acetobutylicum” is the result of my own research
except as cited in the references. The thesis has not been accepted for any degree and
is not concurrently submitted in candidature of any other degree.
Signature : ....................................................
Name : Baiyinah Bte Hj.A.Talip
Date : ...................................................
iii
Special Dedication to:
My mom, Hjh Zaharah bte Yaamat,
My dad, Hj.A. Talip bin Md.Noh,
My family members,
My beloved,
My fellow lecturers,
My friends and
My fellow colleague
For all your care, support and believe in me.

iv
ACKNOWLEDGEMENT
This research project would not have been possible without the support of
many people. It is a pleasure to thank those who made this thesis possible. I wish to
express my appreciation to my supervisor, Miss Shariza Jamek for her guidance,
critics and helps through my research period. I also would like to thank all the
Vocational Training Officers especially Mr. Mohamad Zaki Sahad for his guidance
and motivations during my sessions in laboratory. Without their continuous support,
this thesis could not be completed.
I am also indebted to my Academic Advisor, Mr. Rozaimi Abu Samah for his
help in my research. This appreciation also goes to all lecturers, academicians and
non-academicians in Faculty of Chemical and Natural Resources Engineering
(FKKSA). Librarians at Universiti Malaysia Pahang (UMP) also deserve special
thanks for their assistance in supplying the relevant literatures for my references.
My fellow undergraduate students should also be recognized for their support. My
sincere appreciation also extends to all my colleagues and others who have provided
assistance at various occasions. Their views and tips are useful indeed.
I am also very thankful to my family members who do not stop give their
best in ensuring my convenience through duration of my study. Lastly, I offer my
regards and blessings to all of those who supported me in any respect during the
completion of this project. Last but not least, special gratitude to my beloved Tengku
Anuaruddin bin Tengku Abdul Rasid because always be my side.
v
ABSTRACT
In Malaysia, the government has implement policy instruments aimed at
promoting the production of butanol and ethanol as an alternative to renewable
energy. The objective was to study the effect of inoculum concentration on butanol
and ethanol production and besides that, the study also focused on growth profile of
Clostridium acetobutylicum and glucose consumption in POME and RCM. The
methods begin with palm oil mill effluent (POME) analysis using High Performance
Liquid Chromatography (HPLC). The process continued with the microbial
fermentation and each inoculums concentration at 5% v/v, 10 % v/v and 15 % v/v
were prepared in Reinforced Clostridia Media (RCM). POME as an alternative
medium was sedimented for 24 hours, and has been prepared at pH 5.8, diluted with
90 % substrate, deoxygenated the POME using nitrogen gas. Both medium POME
and RCM were seeded with different inoculums concentration and after 3 days
fermentation, the fermentation broth were undergo liquid-liquid extraction and
prepared for Gas Chromatography (GC) analysis. The result obtained from POME
analysis showed that galactose was the main component in POME. Moreover, the
maximum butanol production for both POME and RCM medium were 0.18533% at
15% v/v (POME) and 0.00801% at 5% v/v (RCM). Result showed that increasing
the inoculum concentration would reduce the fermentation time, increased the total
glucose consumption and increased the butanol production. While the maximum
production of ethanol were, 1.87593% at 15% v/v during 40 hours (POME) and
2.36754% at 5% v/v during 60 hours (RCM) of fermentation time. The result
showed that there were significant correlation between inoculum concentration and
butanol and ethanol production. Thus, it could be concluded that inoculum
concentration does affect the butanol and ethanol production, besides, POME could
be an alternative medium for butanol and ethanol fermentation.
vi
ABSTRAK
Kerajaan Malaysia telah mengaplikasikan polisi untuk menghasilkan butanol
dan etanol sebagai sumber bahan bakar alternatif. Objektif kajian ini adalah untuk
mengkaji kesan kepekatan inokulum terhadap penghasilan butanol dan etanol, dan di
samping itu, kajian turut memfokuskan kepada pertumbuhan Clostridium
acetobutylicum dan penggunaan glukosa dalam proses fermentasi menggunakan
media” palm oil mill effluent (POME)”dan “Reinforced Clostridia Media (RCM)”.
Penghasilan butanol dan etanol bermula dengan analisis “POME” dengan
menggunakan “High Performance Liquid Chromatography (HPLC)”. Proses
fermentasi diteruskan dengan menyediakan kepekatan inokulum yang berbeza iaitu 5
% v/v, 10 % v/v dan 15 % v/v di dalam pati RCM. POME telah dienapkan selama 1
hari, pH POME turut diubah kepada 5.8, POME juga dilarutkan kepada 90 %
substrat dan proses pengnyahkan oksigen dengan menggunakan gas nitrogen.
Kedua-dua medium RCM dan POME telah dimasukkan dengan kepekatan inokulum
yang berbeza dan proses fermentasi adalah selama 3 hari. Selepas 3 hari, butanol
dan etanol telah diekstrak daripada POME and RCM media dan digunakan untuk
analisis “Gas Chromatography (GC)”. Keputusan yang diperolehi daripada analisis
POME menunjukkan galaktosa merupakan komponen utama di dalam POME.
Sementara itu, penghasilan butanol yang maksimum adalah pada 15 % v/v dengan
peratusan 0.18533 % (POME) dan pada 5 % v/v dengan peratusan 000801 %
(RCM). Manakala, maksimum penghasilan etanol adalah ketika 15 % dengan
peratusan 1.87593 % (POME) dan pada 5 % v/v dengan peratusan 2.36754 %
(RCM) . Hasil kajian menunjukkan wujudnya korelasi anatara kepekatan inokulum
dengan penghasilan butanol dan etanol. Kesimpulannya, kepakatan inokulum
member kesan terhadapan penghasilan butanol dan etanol.
vii
TABLE OF CONTENTS
CHAPTER TITLE PAGE
RESEARCH TITLE i
DECLARATION ii
DEDICATION iii
ACKNOWLEDGMENT iv
ABSTRACT v
ABSTRAK vi
TABLE OF CONTENTS vii
LIST OF TABLES xi
LIST OF FIGURES xii
LIST OF SYMBOLS / ABBREVIATIONS xiv
LIST OF APPENDICES xv
1 INTRODUCTION 1
1.1 Background of Research 1
1.2 Problem Statement 3
1.3 Research Objective 4
1.4 Research Scopes 4
1.5 Significance of Study 5
2 LITERATURE REVIEW 6
2.1 Introduction 6
viii
2.2 Fermentation Substrate 6
2.2.1 Reinforced Clostridia Media 7
2.2.2 Palm Oil Mill Effluent (POME) 9
2.2.2.1 Characteristics of Palm Oil Mill
Effluent (POME)
9
2.2.2.2 Potential of Palm Oil Mill
Effluent (POME): Renewable
Resources
10
2.3 Microbial Fermentation 11
2.3.1 Acetone-Butanol-Ethanol fermentation
(ABE fermentation): Anaerobic Process
11
2.3.1.1 Declined of Acetone-Butanol-
Ethanol Fermentation
(ABE Fermentation)
12
2.3.2 Clostridium acetobutylicum 13
2.3.2.1 Acidogenesis and
Solventogenesis Phases
15
2.4 Analytical Procedure 16
2.4.1 High Performance Liquid
Chromatography (HPLC)
16
2.4.1.1 Analyzing of reducing sugars in
palm oil mill effluent (POME)
16
2.4.2 Liquid-Liquid Extraction (LLE) 17
2.4.2.1 Drying Agents 18
2.4.3 Gas Chromatography-Flame Ionization
Detector (GC-FID)
19
2.4.3.1 Qualitative Analysis 21
2.5 Fermentation Product: Butanol and Ethanol 22
2.5.1 Butanol 22
2.5.2 Ethanol 23
3 METHODOLOGY 24
3.1 Introduction 24
ix
3.2 Materials 26
3.3 Equipment and Apparatus 26
3.3.1 Fermentation Process: Modified Bottle 27
3.4 Experimental Procedure 28
3.4.1 Palm oil mill effluent (POME) Analysis 28
3.4.1.1 Preparations of Standards 28
3.4.1.2 Preparation of palm oil mill
effluent (POME)
29
3.4.1.3 High Performance Liquid
Chromatography (HPLC)
analysis
30
3.4.2 Bacterial Cultivation 31
3.4.2.1 Inoculum Preparation 31
3.4.3 Preparation of Fermentation Media 33
3.4.4 Effect of Inoculum Concentration 35
3.4.5 Growth Profile 35
3.4.6 Analysis Procedure 35
3.4.6.1 Liquid-Liquid Extraction 36
3.4.6.2 Butanol and Ethanol Analysis 37
3.4.6.3 Glucose Assays 38
4 RESULTS AND DISCUSSION 41
4.1 Composition of palm oil mill effluent (POME) 41
4.2 Growth Profile 43
4.3 Comparison of glucose consumption between 5
% v/v, 10 % v/v and 15 % v/v and efficiency of
each inoculum size in POME
45
4.4 Comparison of glucose consumption between 5
% v/v, 10 % v/v and 15 % v/v and efficiency of
each inoculum size in RCM
48
4.5 Effect of different inoculums concentration on
butanol and ethanol production
50
4.5.1 Effect of 5 % v/v, 10 % v/v and 15 % v/v 50
x
of inoculums concentration on butanol
production in POME
4.5.2 Effect of 5 % v/v, 10 % v/v and 15 % v/v
of inoculums concentration on ethanol
production in POME
51
4.5.3 Effect of 5 % v/v, 10 % v/v and 15 % v/v
of inoculums concentration on butanol
production in RCM
54
4.5.4 Effect of 5 % v/v, 10 % v/v and 15 % v/v
of inoculums concentration on ethanol
production in RCM
55
5 CONCLUSION AND RECOMMENDATION 57
5.1 Conclusion 57
5.2 Recommendation 59
REFERENCES 60
APPENDICES 65
xi
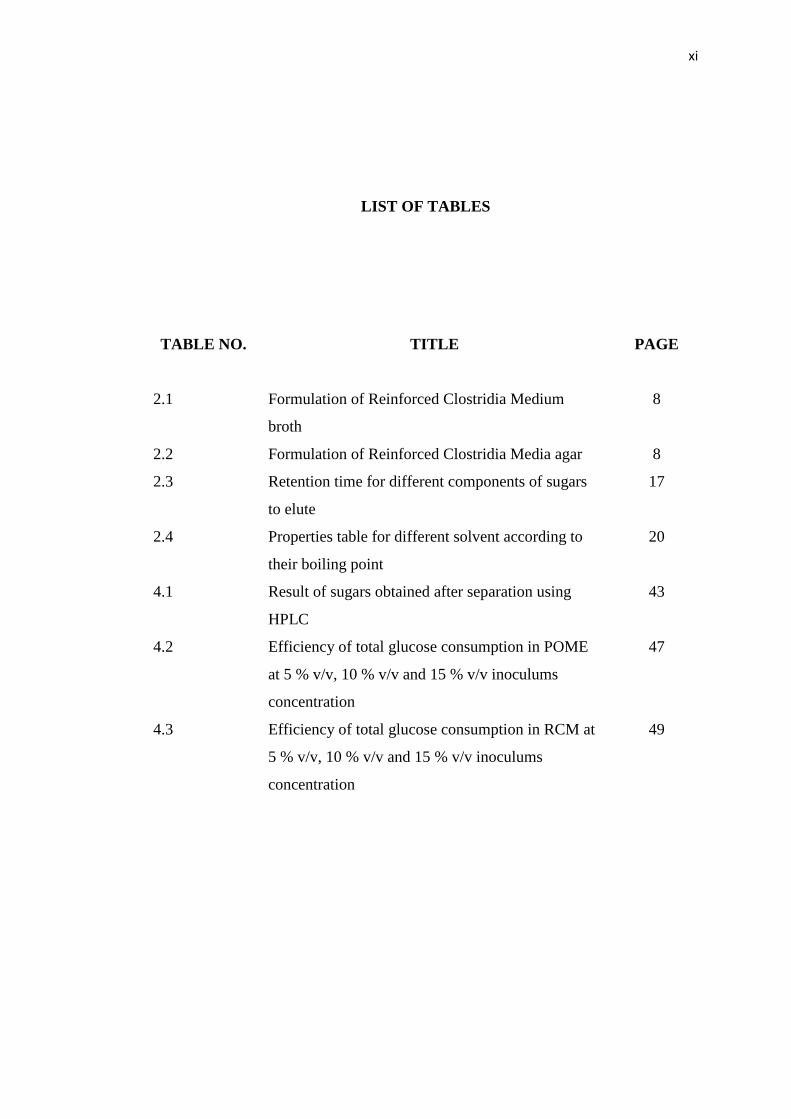
LIST OF TABLES
TABLE NO. TITLE PAGE
2.1
Formulation of Reinforced Clostridia Medium
broth
8
2.2 Formulation of Reinforced Clostridia Media agar 8
2.3 Retention time for different components of sugars
to elute
17
2.4 Properties table for different solvent according to
their boiling point
20
4.1 Result of sugars obtained after separation using
HPLC
43
4.2 Efficiency of total glucose consumption in POME
at 5 % v/v, 10 % v/v and 15 % v/v inoculums
concentration
47
4.3 Efficiency of total glucose consumption in RCM at
5 % v/v, 10 % v/v and 15 % v/v inoculums
concentration
49
xii
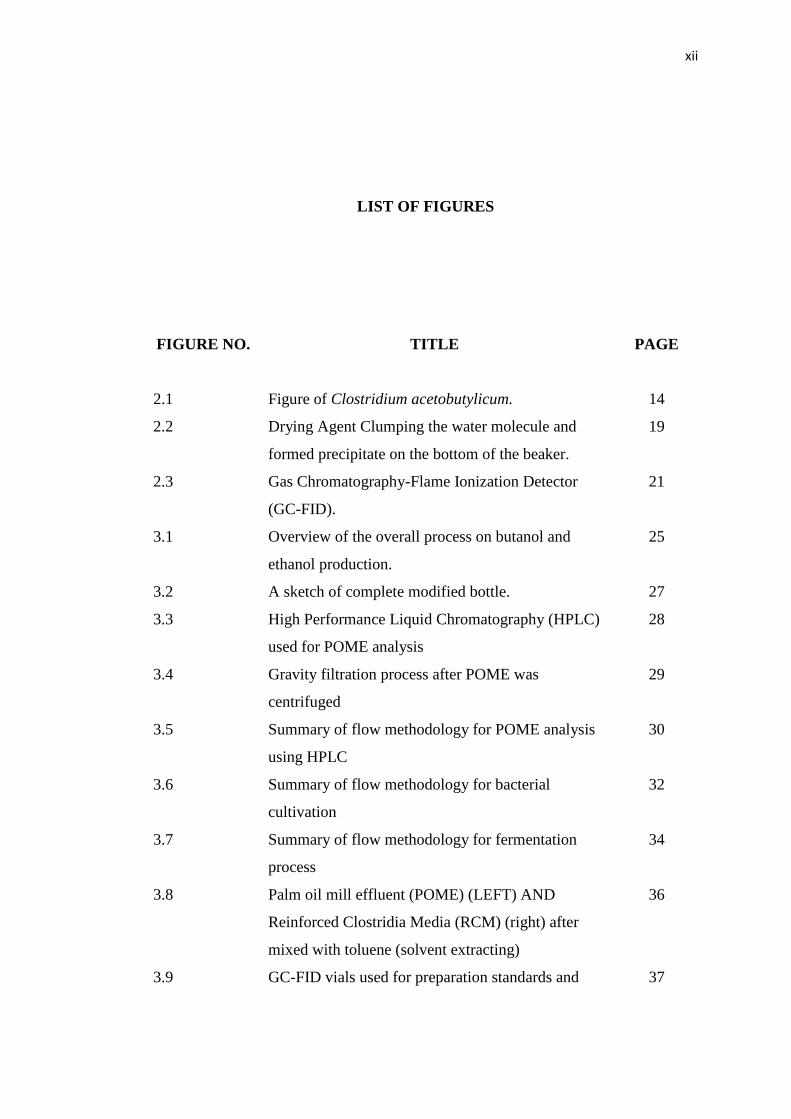
LIST OF FIGURES
FIGURE NO. TITLE PAGE
2.1
Figure of Clostridium acetobutylicum.
14
2.2 Drying Agent Clumping the water molecule and
formed precipitate on the bottom of the beaker.
19
2.3 Gas Chromatography-Flame Ionization Detector
(GC-FID).
21
3.1 Overview of the overall process on butanol and
ethanol production.
25
3.2 A sketch of complete modified bottle. 27
3.3 High Performance Liquid Chromatography (HPLC)
used for POME analysis
28
3.4 Gravity filtration process after POME was
centrifuged
29
3.5 Summary of flow methodology for POME analysis
using HPLC
30
3.6 Summary of flow methodology for bacterial
cultivation
32
3.7 Summary of flow methodology for fermentation
process
34
3.8 Palm oil mill effluent (POME) (LEFT) AND
Reinforced Clostridia Media (RCM) (right) after
mixed with toluene (solvent extracting)
36
3.9 GC-FID vials used for preparation standards and 37
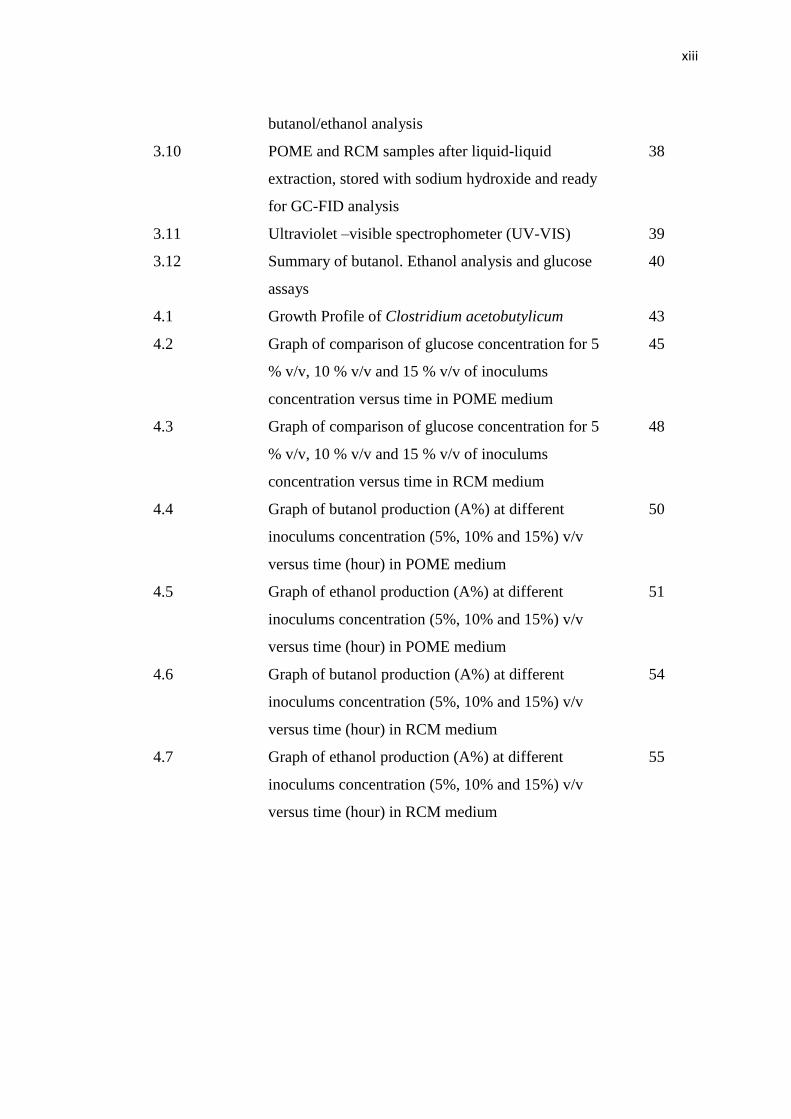
xiii
butanol/ethanol analysis
3.10 POME and RCM samples after liquid-liquid
extraction, stored with sodium hydroxide and ready
for GC-FID analysis
38
3.11 Ultraviolet –visible spectrophometer (UV-VIS) 39
3.12 Summary of butanol. Ethanol analysis and glucose
assays
40
4.1 Growth Profile of Clostridium acetobutylicum 43
4.2 Graph of comparison of glucose concentration for 5
% v/v, 10 % v/v and 15 % v/v of inoculums
concentration versus time in POME medium
45
4.3 Graph of comparison of glucose concentration for 5
% v/v, 10 % v/v and 15 % v/v of inoculums
concentration versus time in RCM medium
48
4.4 Graph of butanol production (A%) at different
inoculums concentration (5%, 10% and 15%) v/v
versus time (hour) in POME medium
50
4.5 Graph of ethanol production (A%) at different
inoculums concentration (5%, 10% and 15%) v/v
versus time (hour) in POME medium
51
4.6 Graph of butanol production (A%) at different
inoculums concentration (5%, 10% and 15%) v/v
versus time (hour) in RCM medium
54
4.7 Graph of ethanol production (A%) at different
inoculums concentration (5%, 10% and 15%) v/v
versus time (hour) in RCM medium
55
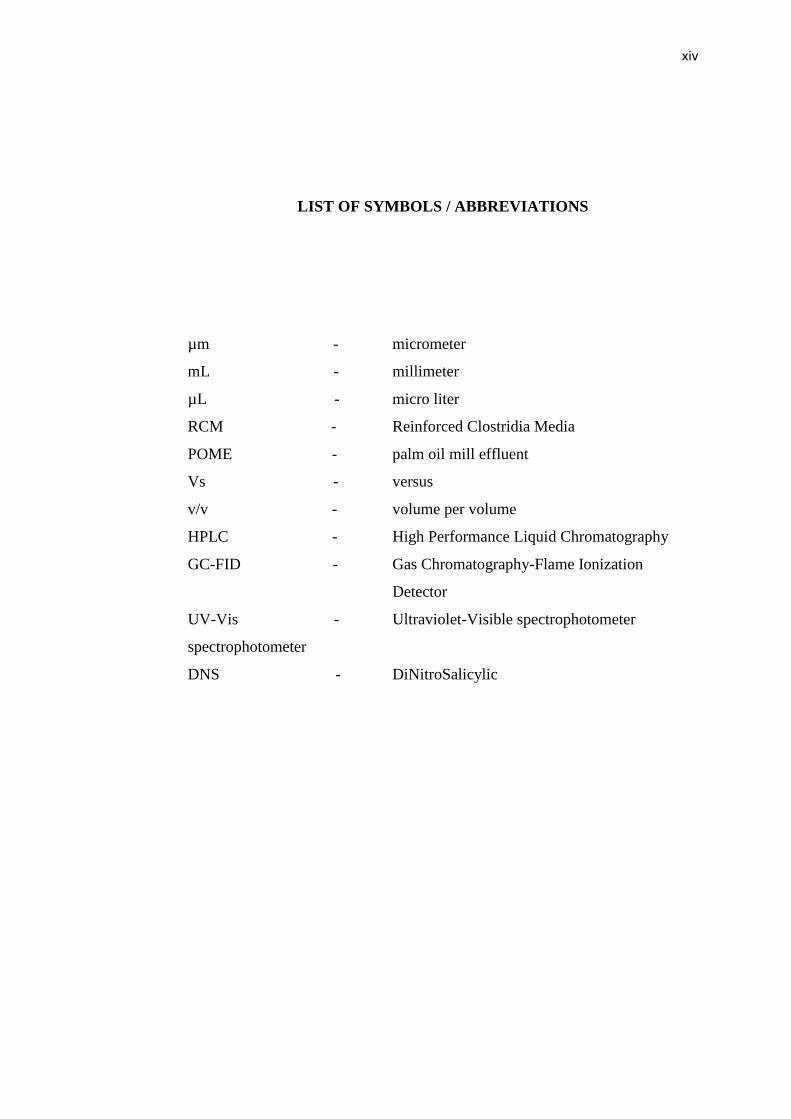
xiv
LIST OF SYMBOLS / ABBREVIATIONS
µm - micrometer
mL - millimeter
µL - micro liter
RCM - Reinforced Clostridia Media
POME - palm oil mill effluent
Vs - versus
v/v - volume per volume
HPLC - High Performance Liquid Chromatography
GC-FID - Gas Chromatography-Flame Ionization
Detector
UV-Vis -
spectrophotometer
Ultraviolet-Visible spectrophotometer
DNS - DiNitroSalicylic
xv
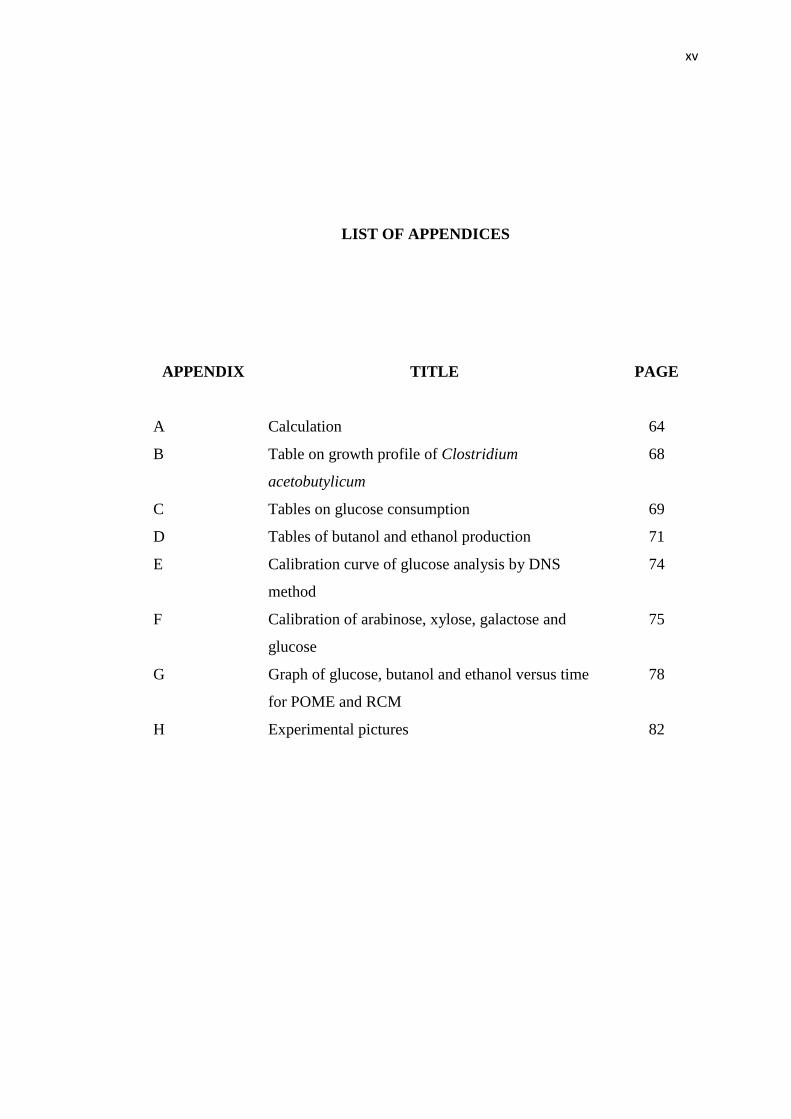
LIST OF APPENDICES
APPENDIX TITLE PAGE
A Calculation 64
B Table on growth profile of Clostridium
acetobutylicum
68
C Tables on glucose consumption 69
D Tables of butanol and ethanol production 71
E Calibration curve of glucose analysis by DNS
method
74
F Calibration of arabinose, xylose, galactose and
glucose
75
G Graph of glucose, butanol and ethanol versus time
for POME and RCM
78
H Experimental pictures 82
CHAPTER 1
INTRODUCTION
1.1 Background of Research
Nowadays, fuel is the major topic had been discussed over these decades,
because of the population growth is increasing while percentage of fuel available is
decreasing. Thompson, (2003) claimed that public has enjoyed using up the
gasoline, heating oil, plastic and countless other oil products for decades. They did
not notice that petroleum kept flowing generously and had been announced by
environmentalists who reported that fossil fuels would run out. Even though media
keep constantly convinced public that, there will be a new oil discoveries and
increasing stocks oil, but still fuel is running empty. Moreover, petroleum is a basic
human needs primarily used for transportation to do their own routine. In Malaysia,
the development of automotive industry has cause increase in the numbers of cars,
vans, buses, lorries and etc on the road which needs petrol to move (Jailani and
Jaafar, 1999). Thus, this issue will force on Malaysian Government to provide
others alternative fuel for the future appears that petroleum is running out.
Then, researchers begin to take an opportunity to resolve the scarcity of fossil
fuels problems which starting late of 1970s and early 1980s they found that alcohol
fuel can be an alternative fuel for the future and easily being produced from
renewable resources was very promising (Qureshi and Blaschek, 2000). Butanol,
2
ethanol, and acetone were classified as alcohol and because of researchers found that
those alcohol can be produced using biologically substrate, thus they called it as
bioalcohol. Furthermore, studies showed that the most suitable and powered
bioalcohol was butanol or already known as biobutanol suitable used for combustion
engine for cars and other transportations. Biobutanol can be produced from
renewable resources such as molasses, corn, wheat straw, corn stove, corn fiber, and
other agricultural byproducts in the process named as acetone-butanol-ethanol
(ABE) fermentation.
For decades, public only noticed presence of ethanol as an alternative fuel for
the next potential biofuel, but researcher had found that butanol was a chemical
which had excellent fuel characteristics, for example, butanol had a higher calorific
value than ethanol according to their numbers of carbon atoms (Qureshi and
Blaschek, 2000). ABE fermentation was the oldest fermentation technique to
produce bioalcohol from renewable resources. Similar to others fermentation
method, ABE fermentation was still utilize the substrate containing carbon sources
from glucose using microbes but commonly used anaerobic bacteria which was
obligate no oxygen during the process. The microbial fermentation of carbohydrates
to butanol was well known and had potentially attractive for several economic
reasons (Syed et al., 2008). Most reasons in alternative energy were the values were
very concerned on the product being produced in terms of pricing and quality of the
products. This means that people started trusted on the presence of butanol as
another alternative energy for their transportation fuel since biobutanol was being
introduced for ages.
Although, in production of biofuel had several alternative of raw materials
but researcher had found that palm oil mill effluent (POME) had a greater potential
used as renewable resources in production of biobutanol. POME was known as
wastes generated in the vast amount at palm oil industry which POME can affect the
watercourse if did not treated very well. In addition, Kalil et al. (2003) and Wu et al.
(2007) showed that in their studies that POME contain high concentration of
lignocelluloses that can be utilized by Clostridium acetobutylicum ad converted it
into valuable product such as butanol, ethanol and acetone.
3
1.2 Problem Statement
The sustainability of the petroleum industry in Malaysia was increasingly
becoming an issue because world was currently in an energy crisis. Fossil fuels were
the lifeblood of our society and for many others around the world. Furthermore,
fossil fuels, coal, oil and natural gas, were a non-renewable source of energy.
Formed from plants and animals that lived up to 300 million years ago, fossil fuels
are found in deposits beneath the earth. The main problem was petroleum was from
non renewable energy and it took so many years to produce oil and gas.
Alternative forms of energy were currently under development even though
most of them were only in their initial stages. In addition, conventional process only
utilized food products as our renewable sources but society will deal with food crisis
during producing an alternative energy. The key factors which determined the
economic viability of the ABE fermentation were the costs of raw material. For
example researchers were using maize as the substrate in ABE fermentation, if the
price of maize at particular time increased thus automatically the price of butanol
also increases, because cost of substrate made about 60% of the overall cost of
production.
Furthermore, POME was abundance and worse waste water in Malaysia.
More than 40 million tons of POME was generated in Malaysia. Therefore, the palm
oil mill industry in Malaysia was identified as the one that produces the largest
pollution load into the rivers throughout the country. Another aspect of pollution
was from environmental impacts, such as drilling, generation of polluting wastes,
greenhouse gases and climate change not produced by renewable energy produced
from non-renewable energy. In addition, petroleum can create incomplete
combustion thus releasing carbon monoxide and becoming threat to public health.
So, concluded that POME is a low cost substrate that can be used to in ABE
fermentation and converting it into valuable product used as a combustion engine.
Furthermore, utilizing POME as a substrate for fermentation can be one of method to
treat the waste.
4
1.3 Research Objective
The research was proposed to achieve an objective in investigated production
of butanol which was;
1. To study the effect of inoculums concentration on butanol and ethanol
production by Clostridium acetobutylicum.
1.4 Research Scopes
In order to achieve following objectives, several research scopes have been
identified;
1. To study on growth profile of Clostridium acetobutylicum in different
batch medium (Reinforced Clostridia Media (RCM) and Palm Oil
Mill Effluent (POME)).
2. To complete composition analysis of batch fresh POME using High
Performance Liquid Chromatography (HPLC).
3. To study the effect of different inoculums concentration in the range
of 5% v/v, 10% v/v and 15% v/v on anaerobic fermentation.
4. To study on glucose consumption of different batch of fresh POME
and RCM using Ultraviolet and Visible Spectroscopy (UV - VIS).
5
1.5 Significance of Study
Pollution from residual oil content in the wastewater was one of the serious
environmental problems. Due to the rapid development of the palm oil industry in
Malaysia, a large volume of palm oil mill effluent (POME) had been produced.
Thus, Environmental Act regulated that, POME must be treated first before
discharge into the river. In connection with the issue of pollution, this study could
shows to the public that POME can be fully utilized in the production of valuable
product such as biofuel through microbial fermentation. POME was one of
abundance wastes in Malaysia which 50% of water from palm oil mill factory will
end up as palm oil mill effluent (POME). In addition, POME contains higher
concentration of biological oxygen demand (BOD) and chemical oxygen demand
(COD) which will harm aquatic life if there was no pretreatment before being
released into the river. Hence, by using POME as a source for valuable product thus
this study was applicable for converting “Waste to Wealth”, which “Waste” was the
palm oil mill effluent (POME) while “Wealth” was the valuable product, butanol
used as biofuel for the future.
Moreover, the number of human population in the country increased thus will
increase the numbers of car users. Development of high growth, encourage the
population to represent the vehicle for them. As a result, it wills effects of the
liberation of carbon monoxide from incomplete combustion when using the petrol,
which then lead to the air pollution problem. In 1990, the number of motor vehicles
on the peninsula only surpassed by 4, 249, 758 units. . These reliable figures will
increase by 17 % per year and extension was estimated over 500, 000 tons of
pollutants produced in the atmosphere at each year affected by increasing numbers
of vehicle (Jailani and Jaafar, 1999). Immediate action was taken from this study
where butanol was used to replace the utilization of petroleum as transportation fuel.
Butanol has similar characteristics with gasoline and petrol known as biofuel will
undergo complete combustion and finally will produced carbon dioxide that less
hazardous than carbon monoxide. Thus, this study will overcome the air pollution
problem by applying biobutanol as biofuel since it helps to reduce pollution in this
country.
CHAPTER 2
LITERATURE REVIEW
2.1 Introduction
This chapter is about combining new and old interpretation in this recent
study which will summarize the important information regarding butanol production
by using solventogenic clostridia. In addition, detailed discussion on each particular
topic such as, raw material, fermentation process, process selection and product
determination will be presented in this chapter.
2.2 Fermentation Substrate
In the fermentation process, the basic need is glucose which act as carbon
source then converted it into products. This study shows that substrate being used
that compatible with the Clostridium acetobutylicum are varies. Takriff et al. (2009)
demonstrated that Reinforced Clostridium Medium (RCM) which is an establish
medium for clostridia while Palm Oil Mill Effluent (POME) is an alternative
medium for the fermentation. In addition, there are a lots of establish medium for
7
clostridia such as Clostridia Basal Medium (CBM), Cooked Meat Medium (CMM),
Potato Medium and etc. Those medium differ in composition but similar usage for
clostridia. This study only focus on RCM as an establish medium for Clostridium
acetobutylicum, while POME is selected for an alternative medium because of their
characteristics suitable for butanol production, even though there are another
alternative such as wheat straw and corn but POME has a best characteristics for this
process.
2.2.1 Reinforced Clostridia Media (RCM)
Reinforced Clostridia Media (RCM) is used for cultivating and enumerating
clostridia, other anaerobes, and other species of bacteria from foods and clinical
specimens. RCM provides enough necessity for clostridia and other anaerobe to
growth and regenerate. In addition RCM can be used as fermentation medium,
preparation of inoculums and to obtain pure culture by streaking method.
Furthermore, RCM is used to suspend the preserved spores and activate the
vegetative cell of clostridia (Castano, 2003). Moreover, RCM used for fermentation
media compared to other alternative medium or so called as “control experiment”
(Takriff et al., 2009).
There are two types of RCM for cultivation of clostridia, RCM broth and
RCM agar. Both has similar composition but agar content in RCM agar is much
higher than RCM broth and mostly suitable for plating media. Table 1.1 is the
summarization composition of RCM broth with the particular formula and Table 1.2
is the summarization composition of RCM agar with different formula.
8
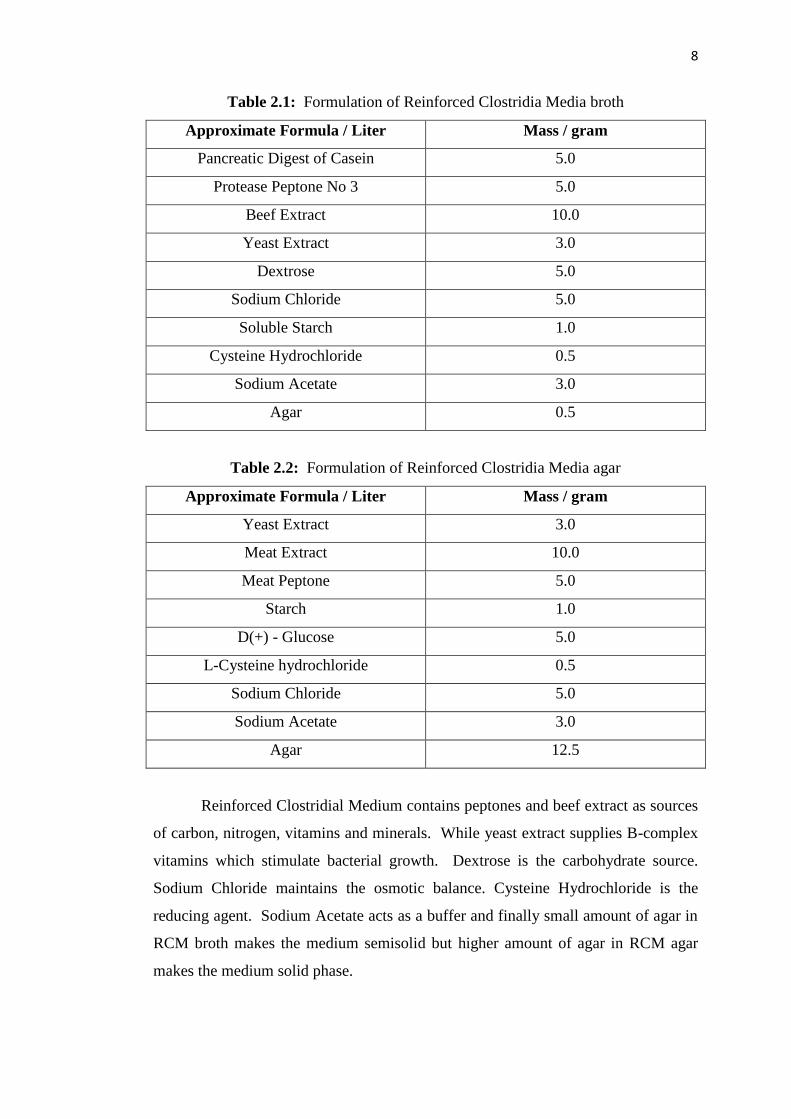
Table 2.1: Formulation of Reinforced Clostridia Media broth
Approximate Formula / Liter Mass / gram
Pancreatic Digest of Casein 5.0
Protease Peptone No 3 5.0
Beef Extract 10.0
Yeast Extract 3.0
Dextrose 5.0
Sodium Chloride 5.0
Soluble Starch 1.0
Cysteine Hydrochloride 0.5
Sodium Acetate 3.0
Agar 0.5
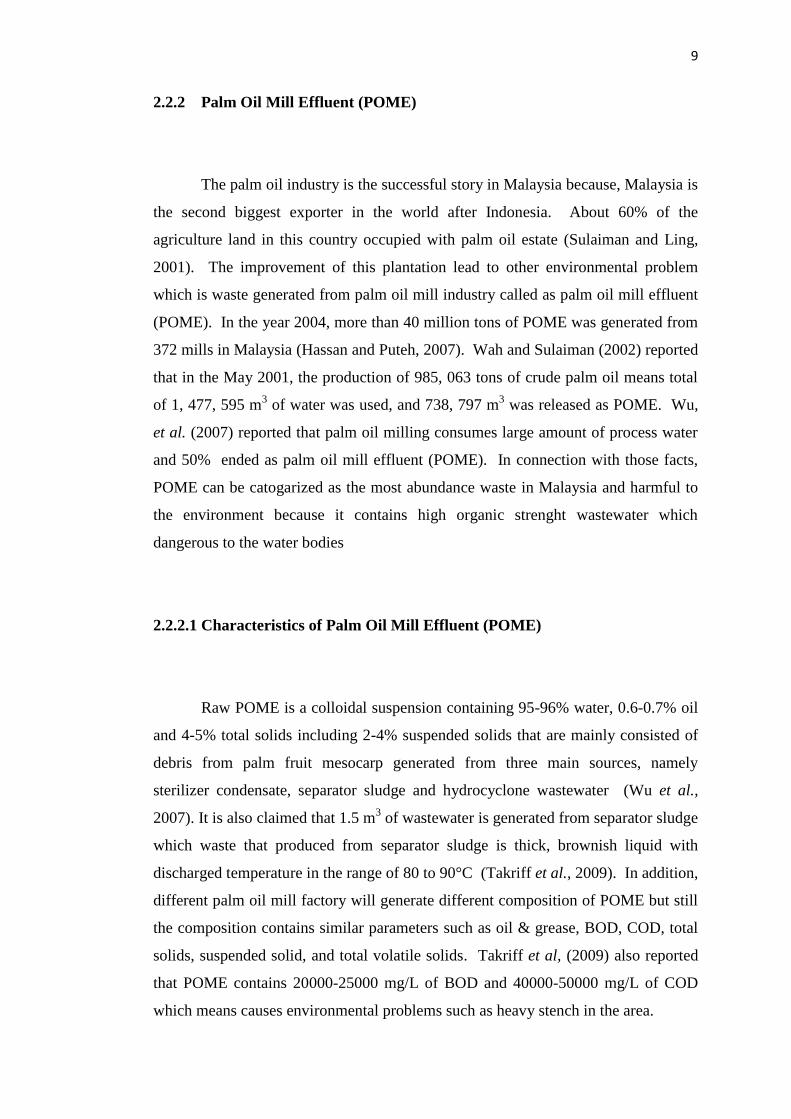
Table 2.2: Formulation of Reinforced Clostridia Media agar
Approximate Formula / Liter Mass / gram
Yeast Extract 3.0
Meat Extract 10.0
Meat Peptone 5.0
Starch 1.0
D(+) - Glucose 5.0
L-Cysteine hydrochloride 0.5
Sodium Chloride 5.0
Sodium Acetate 3.0
Agar 12.5
Reinforced Clostridial Medium contains peptones and beef extract as sources
of carbon, nitrogen, vitamins and minerals. While yeast extract supplies B-complex
vitamins which stimulate bacterial growth. Dextrose is the carbohydrate source.
Sodium Chloride maintains the osmotic balance. Cysteine Hydrochloride is the
reducing agent. Sodium Acetate acts as a buffer and finally small amount of agar in
RCM broth makes the medium semisolid but higher amount of agar in RCM agar
makes the medium solid phase.
9
2.2.2 Palm Oil Mill Effluent (POME)
The palm oil industry is the successful story in Malaysia because, Malaysia is
the second biggest exporter in the world after Indonesia. About 60% of the
agriculture land in this country occupied with palm oil estate (Sulaiman and Ling,
2001). The improvement of this plantation lead to other environmental problem
which is waste generated from palm oil mill industry called as palm oil mill effluent
(POME). In the year 2004, more than 40 million tons of POME was generated from
372 mills in Malaysia (Hassan and Puteh, 2007). Wah and Sulaiman (2002) reported
that in the May 2001, the production of 985, 063 tons of crude palm oil means total
of 1, 477, 595 m3 of water was used, and 738, 797 m
3 was released as POME. Wu,
et al. (2007) reported that palm oil milling consumes large amount of process water
and 50% ended as palm oil mill effluent (POME). In connection with those facts,
POME can be catogarized as the most abundance waste in Malaysia and harmful to
the environment because it contains high organic strenght wastewater which
dangerous to the water bodies
2.2.2.1 Characteristics of Palm Oil Mill Effluent (POME)
Raw POME is a colloidal suspension containing 95-96% water, 0.6-0.7% oil
and 4-5% total solids including 2-4% suspended solids that are mainly consisted of
debris from palm fruit mesocarp generated from three main sources, namely
sterilizer condensate, separator sludge and hydrocyclone wastewater (Wu et al.,
2007). It is also claimed that 1.5 m3 of wastewater is generated from separator sludge
which waste that produced from separator sludge is thick, brownish liquid with
discharged temperature in the range of 80 to 90°C (Takriff et al., 2009). In addition,
different palm oil mill factory will generate different composition of POME but still
the composition contains similar parameters such as oil & grease, BOD, COD, total
solids, suspended solid, and total volatile solids. Takriff et al, (2009) also reported
that POME contains 20000-25000 mg/L of BOD and 40000-50000 mg/L of COD
which means causes environmental problems such as heavy stench in the area.
10
2.2.2.2 Potential of Palm Oil Mill Effluent (POME): Renewable Resources
The most important economic factor in solvent fermentation is the cost of
raw material, which makes up 60% of the overall cost (Tsuey et al., 2006). Castano
(2003) reported that POME has high concentrations of hemicellulose, cellulose and
soluble carbohydrate that makes POME is much appropriate medium for clostridia to
utilize and converted into alcohol. The richness of carbon source in POME has
made it as good candidate for use as culture medium for microbial fermentation.
Moreover, this fact is supported by Rha et al.(2002) where their studies on POME
composition by using HPLC showed that, the composition of Palm Oil Mill Effluent
(POME) consists of various monosaccharides such as glucose, xylose, galactose and
others. While other method such as using ultrafiltration membrane by Wu et al.
(2007) showed that rententate from pretreated POME consists of protein and
carbohydrates and claimed that both useful materials using microbial fermentation.
Eventhough, based from POME characteristics consists high volume of water but
(Kalil et al., 2003) claimed that sedimented POME helped to remoce other toxic
materials and contains higher concentrations of lignocellulose and other insoluble
materials which supported growth of Clostridium acetobutylicum. In addition
lignocellulose is the most abundant renewable resource and have a great potential for
fermentation which lignocellulose will be hydrolyzed into hmicellulose, cellulose
and lignin (Jones and Woods, 1986). Hemicellulose will be converted to other
simple sugars such as xylose, arabinose and galactose, while cellulose will converted
into glucose and then will be utilized in fermentation process to produce acetone-
butanol-ethanol.
11
2.3 Microbial Fermentation
Fermentation process is the process that required carbon source and convert it
into products. Fermentation can be divided into two types of fermentation, which
are aerobic fermentation and anaerobic fermentation. Both process undergoes
different requirement, aerobic fermentation required oxygen throughout the process
while, anaerobic fermentation not required any oxygen. Microbial fermentation is
using microbes to utilize the substrate and divided based on the types of
fermentation. In this study, only anaerobic fermentation was consumed since,
clostridium species are used for acetone-butanol-ethanol (ABE) fermentation, which
ABE fermentation does not required oxygen during the process. ABE fermentation
is the most economic process to produce valuable product especially butanol that can
used as combustion engine in transportation.
2.3.1 Acetone-Butanol-Ethanol fermentation (ABE fermentation): Anaerobic
Process
Production of butanol from microbial fermentation was first determined by
Pasteur in 1861 and in latter part of the 19th
century the production of butanol by
anaerobic bacteria was studied by several investigators (Jones and Woods, 1986).
ABE fermentation can undergoes several of raw materials since clostridia species
could utilize variety of starchy substances to produce better yield of butanol.
Moreover, ABE fermentation was first carried out during first half of last century but
cannot compete with the economically with the petrochemical industry (Kobayashi,
et al., 2005). However, they claimed that there has been revival of interest in ABE
fermentation, since renewable resources as such domestic and agro-industrial wastes
have become possible alternative for the production of chemicals. Anaerobic
process for ABE fermentation could be a complicated process since Clostridium
acetobutylicum is a strictly anaerobic bacteria, which will be contaminated with
oxygen if they exposed too long with air. During ABE fermentation, anaerobe
12
bacteria will convert the substrate into three products acetone, butanol and ethanol
after undergoes acidogenesis phase and finally shifted into solventogenesis phase.
2.3.1.1 Declined of Acetone-Butanol-Ethanol Fermentation (ABE Fermentation)
Butanol production suffered from end-product inhibition thus affected the
cost of solvent recovery in industrial plants because of low concentration of solvents
(Qureshi and Blaschek, 2000). The cost of recovery of butanol is high due to the
fact that is concentration in the fermentation broth is low because of product
inhibition (Qureshi and Blaschek, 2000). In addition, between 1950s and 1960s,
fermentative produced ABE was unable to compete economically with petro
chemically produced ABE (Qureshi and Blaschek, 2000). This resulted in the virtual
elimination of this fermentation. As a result, the following factors which severely
affect the economics of butanol fermentation were identified ; (i) high cost substrate;
(ii) low product concentration (<20 g l-1
); (iii) low reactor productivities (<0.3 g l-1
h-
1); (iv) low ABE yields (0.28-0.33); and (v) an escalated cost of butanol recovery by
distillation which was the only technique for recovery at that time (Qureshi and
Blaschek, 2000). In order to reduce the cost of production, attempts were made to
utilize cheaper substrates such as molasses, whey permeates, and corn depending
upon availability and the region of the world where they are produced.
However, the decline in ABE fermentation was twofold. First, the
petrochemical industry grew at unprecedented rate, and by late 1950s competition
between the fermentation and chemical process had become very acute (Jones and
Woods, 1986). Second, particularly in the United States, molasses began to be used
in substantial amounts in cattle feed (Jones and Woods, 1986). Kalil et al. (2003)
claimed that the lower production of ABE might due to the use of glucose derived
from substrate (POME) instead of the whole POME as the medium.
13
Although many chemicals can be produced by fermentation, the
accumulation of toxic or inhibitory metabolites in the fermentation broth often
inhibits cell growth and product formation. Final product concentrations are low,
fermenter productivity is reduced, and wastewater treatment and product separation
costs are high. The acetone-butanol-ethanol fermentation is characterized by strong
product inhibition. This strong butanol inhibition adversely affects the economics of
the ABE fermentation in three main ways; butanol accumulation in the broth lowers
fermenter productivity so that large fermenter are required; butanol inhibition limits
the concentration of substrate that can be completely consumed, and thus large
volumes of wastewater are produced and product recovery is expensive due to the
low final product concentrations in the fermenter (Jones and Woods, 1986).
Another reason of product inhibition is process selected between continuous
and fed batch fermentation. Productivity in the continuous is lower than fed-batch
fermentation because of, first some bacteria may have been damaged during
circulation through the extraction loop; the bacteria had to pass through a diapgram
pump and several valves on each pass through the extraction (Roffler et al., 1988).
They also added that there will be any air entered the extraction system through the
many valves present could have inhibited the strictly anaerobic cells of Clostridium
acetobutylicum.
2.3.2 Clostridium acetobutylicum
Among the saccharolytic butyric acid-producing clostridia, there are number
of species capable of producing significant amounts of neutral solvents during the
later stages of batch fermentation under the appropriate conditions (Jones and
Woods, 1986). The strains used most extensively for the production of acetone,
ethanol and butanol are now generally classified as Clostridium acetobutylicum
which that there are numbers of different species of butanol-producing clostridia that
had been recognized. These strains categorized based on differences type and ratio
the solvents produced. For example Clostridium beijerinckii (Clostridum butylicum)
14
produces solvents in approximately the same ratio as Clostridium acetobutylicum,
but isopropanol is produced in replacing acetone.
Clostridium acetobutylicum is an anaerobe microorganism which lacks the
metabolic enzyme systems for using oxygen in respiration. Because strict, obligate,
anaerobes also lack of enzyme for processing toxic oxygen, they cannot tolerate any
free oxygen in the immediate environment. Growing anaerobic bacteria usually
requires special media, methods of incubation, and handling chamber (Cowan and
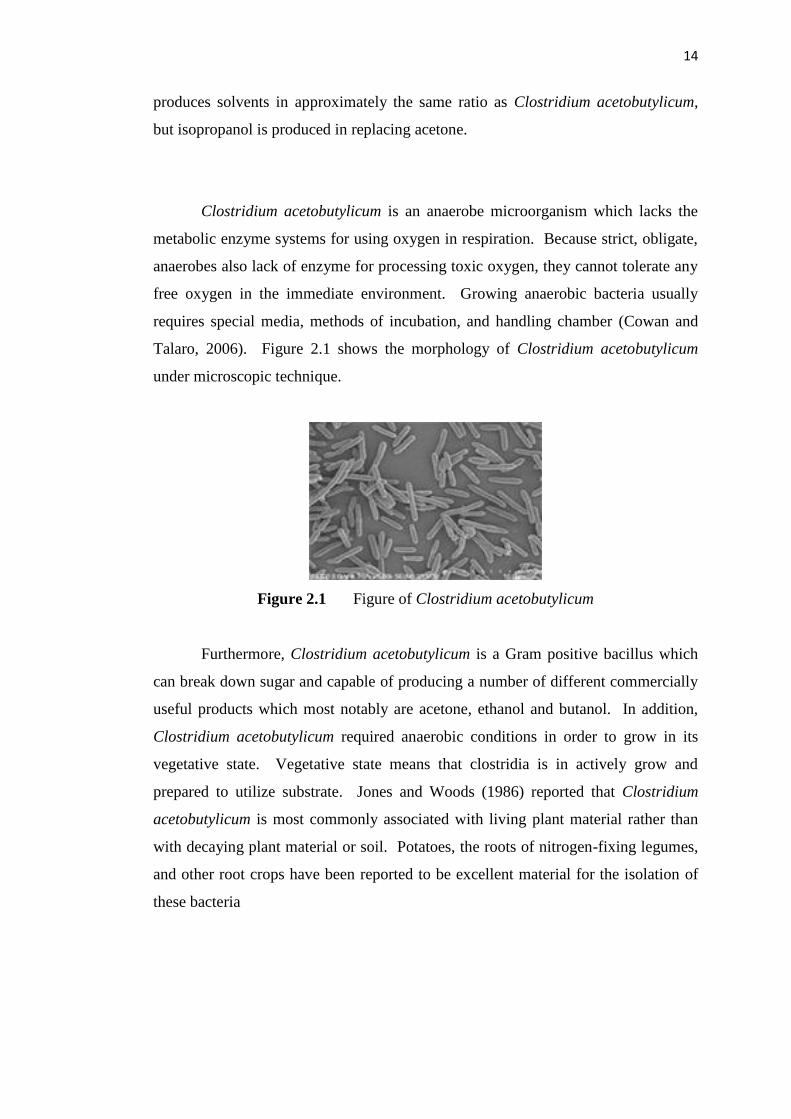
Talaro, 2006). Figure 2.1 shows the morphology of Clostridium acetobutylicum
under microscopic technique.
Figure 2.1 Figure of Clostridium acetobutylicum
Furthermore, Clostridium acetobutylicum is a Gram positive bacillus which
can break down sugar and capable of producing a number of different commercially
useful products which most notably are acetone, ethanol and butanol. In addition,
Clostridium acetobutylicum required anaerobic conditions in order to grow in its
vegetative state. Vegetative state means that clostridia is in actively grow and
prepared to utilize substrate. Jones and Woods (1986) reported that Clostridium
acetobutylicum is most commonly associated with living plant material rather than
with decaying plant material or soil. Potatoes, the roots of nitrogen-fixing legumes,
and other root crops have been reported to be excellent material for the isolation of
these bacteria
15
2.3.2.1 Acidogenesis and Solventogenesis Phases
In ABE fermentation the most popular studies is about the phase shifting
from acidogenic to the solventogenic phase. Schuster et al. (1998) examined the
characteristics of Clostridium acetobutylicum which was during exponential growth
of Clostridium acetobutylicum, the major fermentation products are acetate and
butyrate called as acidogenic phase. As the acids accumulate, the growth ceases, and
sugar is converted into acetone, butanol and ethanol and called as solventogenic
phase. Takriff et al. (2009) also showed that Clostridium acetobutylicum undergoes
biphasic phase of fermentation, where at the initial period,a rapid microbial growth
occurred and then accumlated the acetic and butyric acid then pH will reduce to
acidic medium. They also added that net acid production ceased and synthesis of
solvent began thus acetone, butanol and ethanol will be produced.
Jones and Woods (1986) supported those facts is by claiming that in a normal
batch culture, Clostridium acetobutylicum produce hydrogen, carbon dioxide,
acetate, and butyrate during the initial growth phase (acidogenic phase) which results
in a decrease in the pH of the culture medium. As the culture enters the stationary
growth phase, the metabolism of the cells undergoes a shift solvent production
(solventogenic phase). Fond et al. (1984) found that residual glucose concentration
is weak during the 50 first hours whereas the level of butyric acid reaches a
maximum. They also succeed knowing that solvent and glucose concentration
increase in the culture medium simultaneously to a partially reassimilation of the
butyric acids. He also claimed that total glucose consumption and butanol formation
are related to the butyric acid concentration.
In additon, the concentration of acetic acid is almost constant throughout the
process. Based from metabolic pathway of Clostridium acetobutylicum, acetic acid
will converted into acetone and ethanol whereby, butyric acid will convert into
butanol and finally it can be conclude that, higher butyric acid at the acidogenic
phase will produce higher butanol concentration in solventogenic phase.
16
2.4 Analytical Procedure
Recent studies by Harvey (2000) using analytical procedure to determine the
product quantitatively or qualitatively using different analytical equipment based on
the characteristics of analyte. Analytes defined as the constituents of interest in a
sample. There are two different analyzing techniques which are determination of
monosachharides in palm oil mill effluent (POME) using High Performance Liquid
Chromatography (HPLC) and for butanol and ethanol percentage are qualitatively
anayzed by using Gas Chromatography – Flame Ionization Detector (GC – FID)
2.4.1 High Performance Liquid Chromatography (HPLC)
Of all the chromatographic techniques whose mobile phase is a liquid, High
Performance Liquid Chromatography (HPLC) is perhaps the best knowns (Rouessac
& Rouessac, 2007). HPLC consists two different phases which are mobile phase and
stationary phase. Stationary phase (SP) in contact with the mobile phase (MP) is the
second medium with which the compounds initially dissolved in the mobile phase
will interact. The heart of HPLC assays is the column selection. Different type of
column will give different result based on the elution time. In addition, HPLC
consists of two types of phase such as normal phase (polar stationary phase and non-
polar solvent phase) and reverse phase (non-polar stationary phase and polar
solvent). In this study normal phase is being used and carbohydrate column with RI
detector is used to determine reducing sugars in POME.
2.4.1.1 Analyzing of reducing sugars in palm oil mill effluent (POME)
In determining the composition of reducing sugars in palm oil mill effluent
(POME) using analytical equipment such as HPLC is important to study the phase of
the analyte. POME is a liquid based analyte that suitable for HPLC assays since
17
Liew et al. (2006) reported that Gas Chromatography (GC) will only used to analyze
solvents, whereas HPLC is used to analyze organic acids and reducing sugars. The
HPLC assays technique is supported by Rha et al. (2002) which proved that POME
could be run using HPLC to determine the other monosachharides using particular
preparation method. The research shows that palm essence sample resulting various
reducing sugars such as xylose, glucose and mannose quantitatively from calibration
curve equation from external standard run. The results shows that xylose has the
higher concentration 1.285 x 10⁻²
mg/ml followed by glucose 1.03 x 10⁻² mg/ml and
finally mannose is 8.5 x 10⁻⁴
. Ngan et al. (2004) decided to determine the
components of POME by using two different methods which are Liquid
Chromatography (LC) and Gas Chromatography – Flame Ionization Detector (GC –
FID) and found that the main components are starch, glucose, fructose and glycerine
in POME. In addition, since this study choose the Supelcosil LC-NH2 column, it
will separate monosaccharides, disaccharides, and some trisaccharides. Sugar
retentation decreases as the proportion of water:acetonitrile in the mobile phase is
increased. Sugars generally will be eluted in order of increasing molecular weight.
Table 2.3 shows the retentation time index for carbohydrate columns by Sigma-
Aldrich:
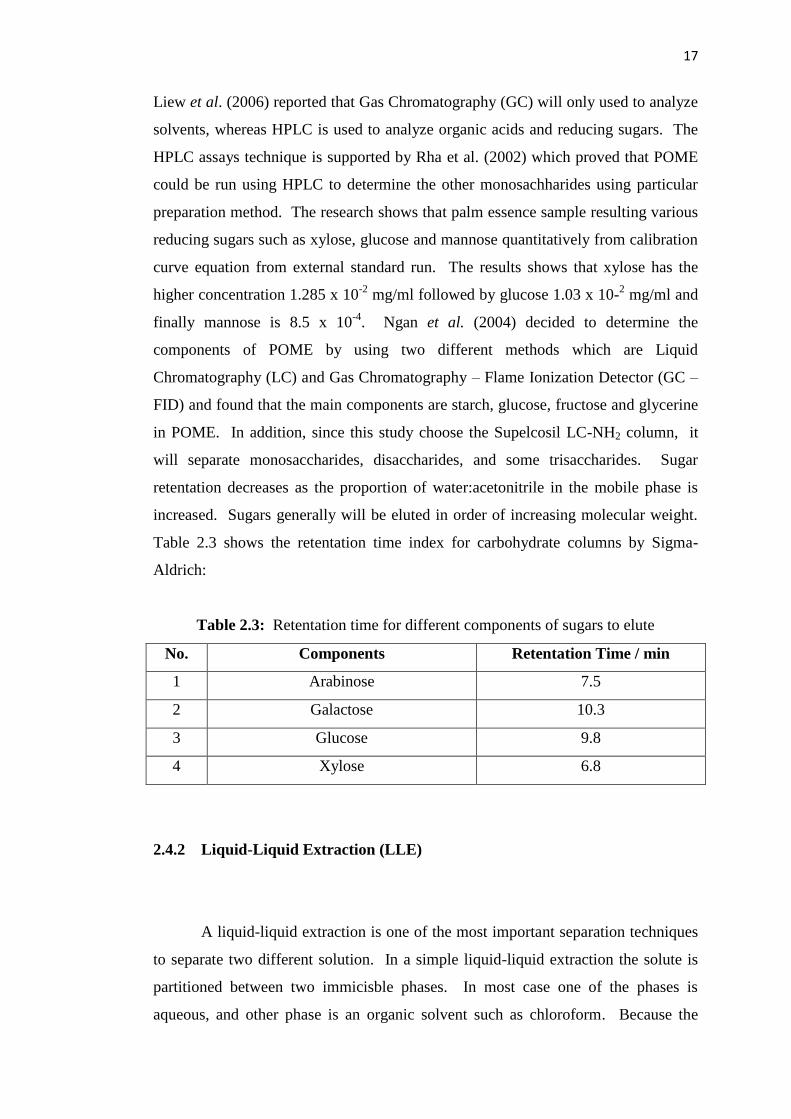
Table 2.3: Retentation time for different components of sugars to elute
No. Components Retentation Time / min
1 Arabinose 7.5
2 Galactose 10.3
3 Glucose 9.8
4 Xylose 6.8
2.4.2 Liquid-Liquid Extraction (LLE)
A liquid-liquid extraction is one of the most important separation techniques
to separate two different solution. In a simple liquid-liquid extraction the solute is
partitioned between two immicisble phases. In most case one of the phases is
aqueous, and other phase is an organic solvent such as chloroform. Because the
18
phases are immisicble, they form two layers, with the denser phase on the bottom
(Harvey, 2000). Liquid-Liquid Extraction (LLE) used as preparation for GC
analysis which to eliminate the water content in the solution. Roffler et al, (1988)
investigated that in batch extractive fermentation, an immisicible organic solvent is
added directly to a batch culture of microorganism because butanol is toxic to the
clostridia thus organic solvent used to extract butanol from the medium. In addition,
the organic solvent being used are oleyl alcohol and benzyl benzoate which both are
are strong extractant that can extract butanol in higher concentration (Roffler et al,
1988). But, differ from Chuichulcherm and Chutmanop (2000) result which they
compared the organic solvent between oleyl alcohol, 2-ethyl-1-hexanol and palm oil
methyl ester. The result showed that 2-ethyl-1-hexanol has the greatest potential in
extraction of butanol because oleyl alcohol is much expensive while 2-ethyl-1-
hexanol is more economic. In this study, toluene is used as organic solvent for LLE
process which toluene is best known as universal solvent which applicable to extract
most alcohol form immisicible solution. In addition, butanol, ethanol and tolune has
lesser density (0.810 g/ml, 0.789 g/ml, 0.867 g/ml) than water (0.932 g/ml), thus
water which more denser than solvent will be at the bottom.
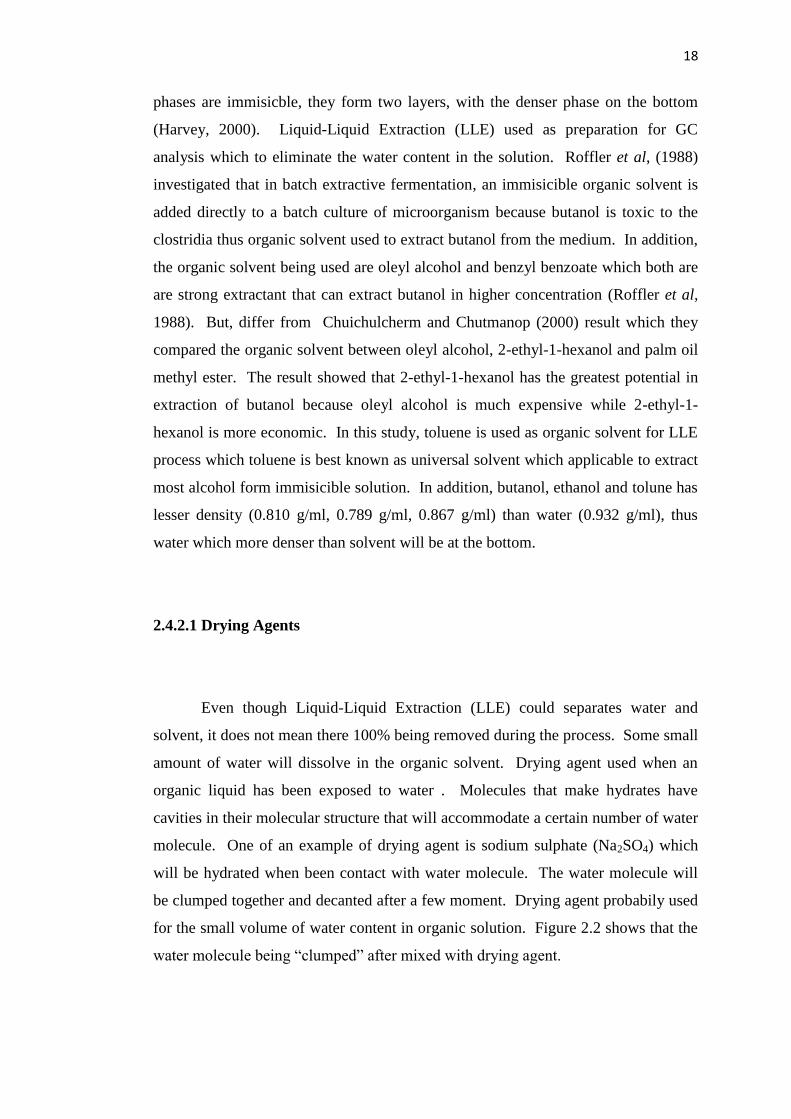
2.4.2.1 Drying Agents
Even though Liquid-Liquid Extraction (LLE) could separates water and
solvent, it does not mean there 100% being removed during the process. Some small
amount of water will dissolve in the organic solvent. Drying agent used when an
organic liquid has been exposed to water . Molecules that make hydrates have
cavities in their molecular structure that will accommodate a certain number of water
molecule. One of an example of drying agent is sodium sulphate (Na2SO4) which
will be hydrated when been contact with water molecule. The water molecule will
be clumped together and decanted after a few moment. Drying agent probabily used
for the small volume of water content in organic solution. Figure 2.2 shows that the
water molecule being “clumped” after mixed with drying agent.
19
Figure 2.2: Drying Agent Clumping the water molecule and formed precipitate
on the bottom of the beaker
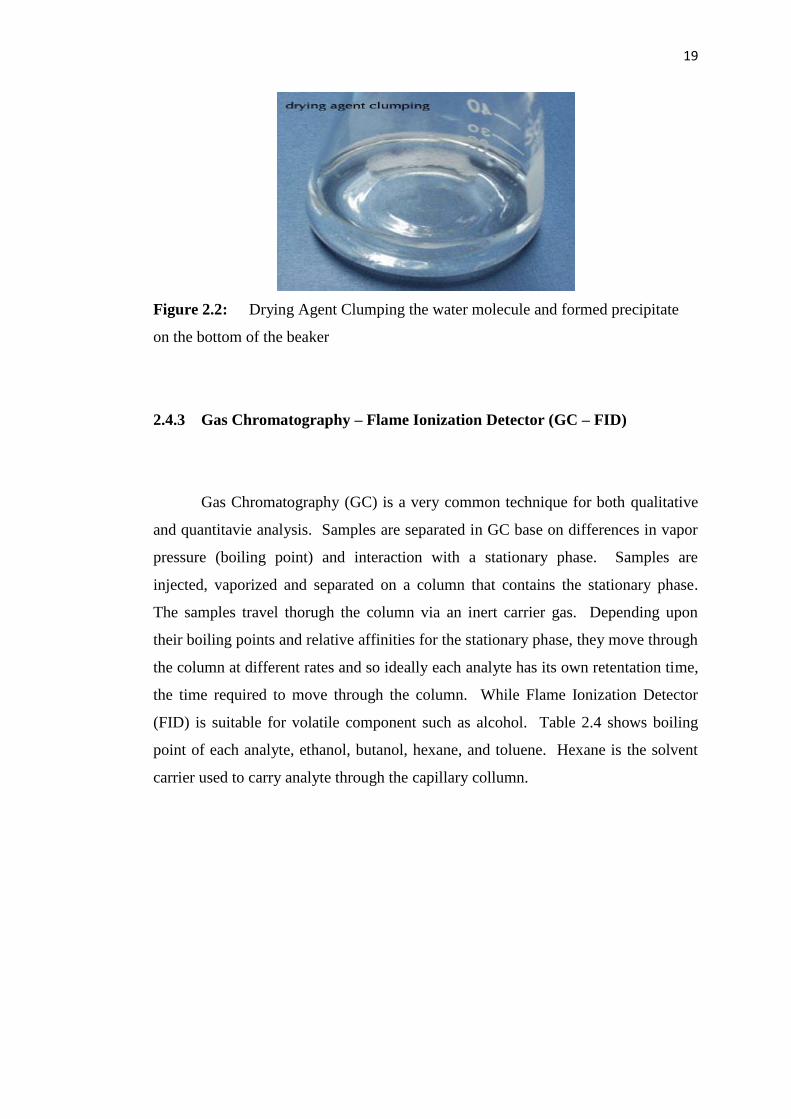
2.4.3 Gas Chromatography – Flame Ionization Detector (GC – FID)
Gas Chromatography (GC) is a very common technique for both qualitative
and quantitavie analysis. Samples are separated in GC base on differences in vapor
pressure (boiling point) and interaction with a stationary phase. Samples are
injected, vaporized and separated on a column that contains the stationary phase.
The samples travel thorugh the column via an inert carrier gas. Depending upon
their boiling points and relative affinities for the stationary phase, they move through
the column at different rates and so ideally each analyte has its own retentation time,
the time required to move through the column. While Flame Ionization Detector
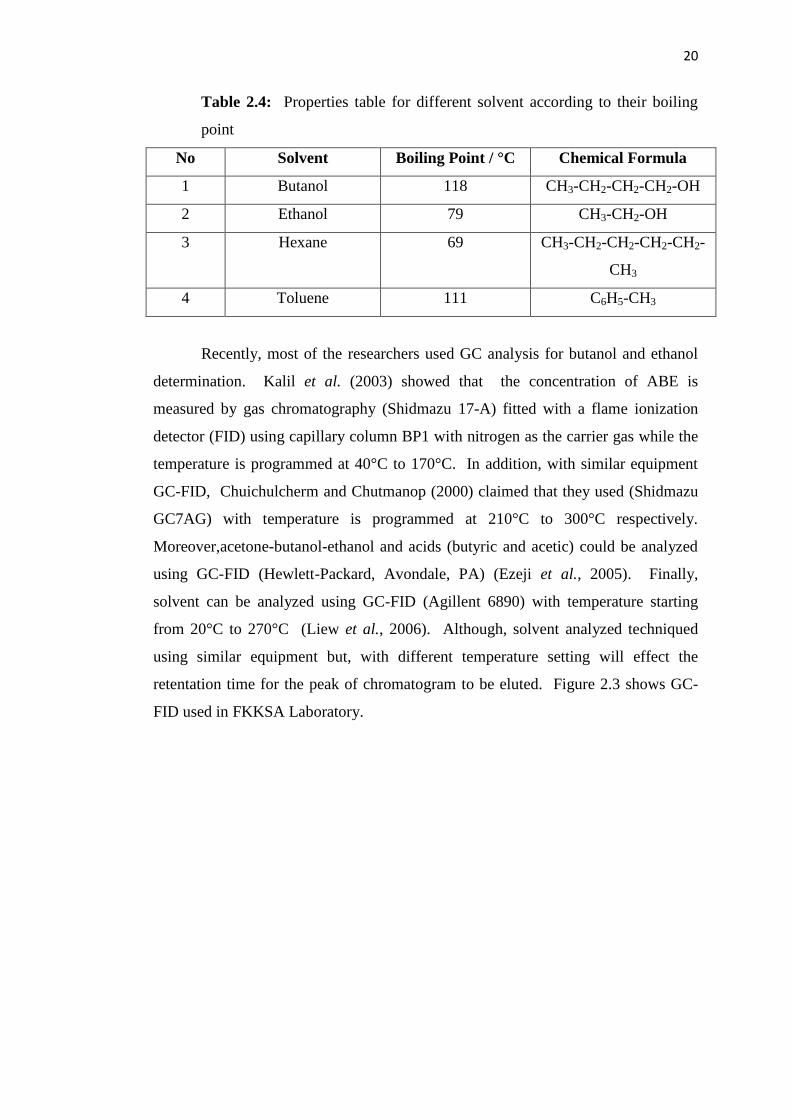
(FID) is suitable for volatile component such as alcohol. Table 2.4 shows boiling
point of each analyte, ethanol, butanol, hexane, and toluene. Hexane is the solvent
carrier used to carry analyte through the capillary collumn.
20
Table 2.4: Properties table for different solvent according to their boiling
point
No Solvent Boiling Point / °C Chemical Formula
1 Butanol 118 CH3-CH2-CH2-CH2-OH
2 Ethanol 79 CH3-CH2-OH
3 Hexane 69 CH3-CH2-CH2-CH2-CH2-
CH3
4 Toluene 111 C6H5-CH3
Recently, most of the researchers used GC analysis for butanol and ethanol
determination. Kalil et al. (2003) showed that the concentration of ABE is
measured by gas chromatography (Shidmazu 17-A) fitted with a flame ionization
detector (FID) using capillary column BP1 with nitrogen as the carrier gas while the
temperature is programmed at 40°C to 170°C. In addition, with similar equipment
GC-FID, Chuichulcherm and Chutmanop (2000) claimed that they used (Shidmazu
GC7AG) with temperature is programmed at 210°C to 300°C respectively.
Moreover,acetone-butanol-ethanol and acids (butyric and acetic) could be analyzed
using GC-FID (Hewlett-Packard, Avondale, PA) (Ezeji et al., 2005). Finally,
solvent can be analyzed using GC-FID (Agillent 6890) with temperature starting
from 20°C to 270°C (Liew et al., 2006). Although, solvent analyzed techniqued
using similar equipment but, with different temperature setting will effect the
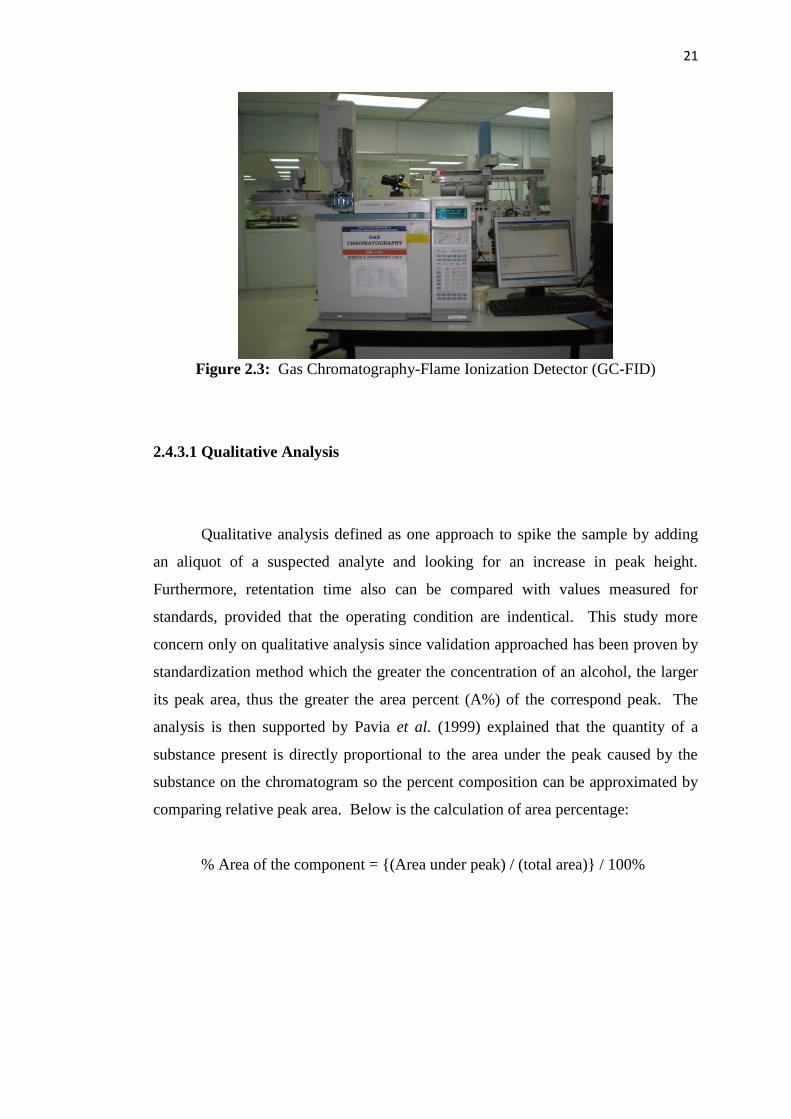
retentation time for the peak of chromatogram to be eluted. Figure 2.3 shows GC-
FID used in FKKSA Laboratory.
21
Figure 2.3: Gas Chromatography-Flame Ionization Detector (GC-FID)
2.4.3.1 Qualitative Analysis
Qualitative analysis defined as one approach to spike the sample by adding
an aliquot of a suspected analyte and looking for an increase in peak height.
Furthermore, retentation time also can be compared with values measured for
standards, provided that the operating condition are indentical. This study more
concern only on qualitative analysis since validation approached has been proven by
standardization method which the greater the concentration of an alcohol, the larger
its peak area, thus the greater the area percent (A%) of the correspond peak. The
analysis is then supported by Pavia et al. (1999) explained that the quantity of a
substance present is directly proportional to the area under the peak caused by the
substance on the chromatogram so the percent composition can be approximated by
comparing relative peak area. Below is the calculation of area percentage:
% Area of the component = {(Area under peak) / (total area)} / 100%
22
2.5 Fermentation Product: Butanol and Ethanol
During ABE fermentation there are three different product will be produce
after fermentation process which are, acetone, butanol and ethanol. But only ethanol
and butanol been compared after the GC analysis. Commonly both product will
appeared after undergoes acidogenesis and solventogenesis phases.
2.5.1 Butanol
Nowadays, federal governments were concern to avoid overly dependent in
oil and gas production, where it has been estimated that the wells will emptied in 10
to 20 years later. A new “green” fuel namely as butanol has been found as a new
biofuel replacing ethanol. Butanol is a four carbon alcohol. It has double the amount
of carbon of ethanol, which equates to a 25 percent increase in harvestable energy
(Btu`s). Butanol is produced by fermentation, from corn, grass, leaves, agricultural
waste and other biomass. Butanol is the one of first generation biofuel as known as
biogasoline.
Butanol is a chemical which has excellent fuel characteristics. It has a higher
calorific value than ethanol, and a low freezing point (Qureshi and Blaschek, 2000).
Moreover, butanol is an alcohol that does not have to be blended with fossil fuels.
The most important is butanol consumed in an internal combustion engine to held no
carbon monoxide which is environmentally harmful byproducts of combustion,
carbon dioxide (CO2) is the combustion byproduct of butanol, and is considered
environmentally „green‟
More or less, butanol is far less corrosive than ethanol and can be shipped
and distributed through existing pipelines and filling stations. Butanol solves the
safety problems associated with the infrastructure of the hydrogen supply. Reformed
butanol has four more hydrogen atoms than ethanol, resulting in a higher energy
output and is used as fuel. Butanol is a superior fuel to ethanol and an industrial
23
solvent that can be produced from renewable resources employing a number of
organisms including Clostridium acetobutylicum and /or Clostridium beijerinckii
(Qureshi and Blaschek, 2000).
2.5.2 Ethanol
Ethanol or ethyl alcohol is a clear, colorless liquid with a characteristic,
agreeable odor and for ages applied as alcoholic beverages industry. Bioethanol is
well established chemical in the world, hence most people in the foreign country
preferred to use ethanol as for the fuel transportation. Bioethanol can be produced
from renewable resources such as agricultural byproduct and undergoes microbial
fermentation. Ethanol having 2 numbers of atoms in chemical structure makes
ethanol less preferable than butanol which having 4 carbon atoms hence has high
calorific values the bioethanol (Qureshi and Blaschek, 2000). In addition, ethanol
has its own advantages which ethanol does burn cleaner than gasoline. This is
proven when car user used 85/15 percent blend of ethanol to gasoline, do create
fewer toxic emissions. Furthermore, by lowering the amount of greenhouse gases
and ozone created by car exhaust, the use of ethanol is believed to be much better
alternative to gasoline.
Ethanol has its disadvantages which are ethanol could be too corrosive
because ethanol can absorb water and dirt very easily, and if those contaminants are
not filtered out successfully, they can cause damage and corrosion inside the engine
block. Moreover, ethanol seems not fulfill the characteristics of gasoline, which
means car users need more ethanol to drive the same distance, and ethanol prices are
expected to be higher than gasoline prices when it is implemented on a national
scale.
CHAPTER 3
METHODOLOGY
3.1 Introduction
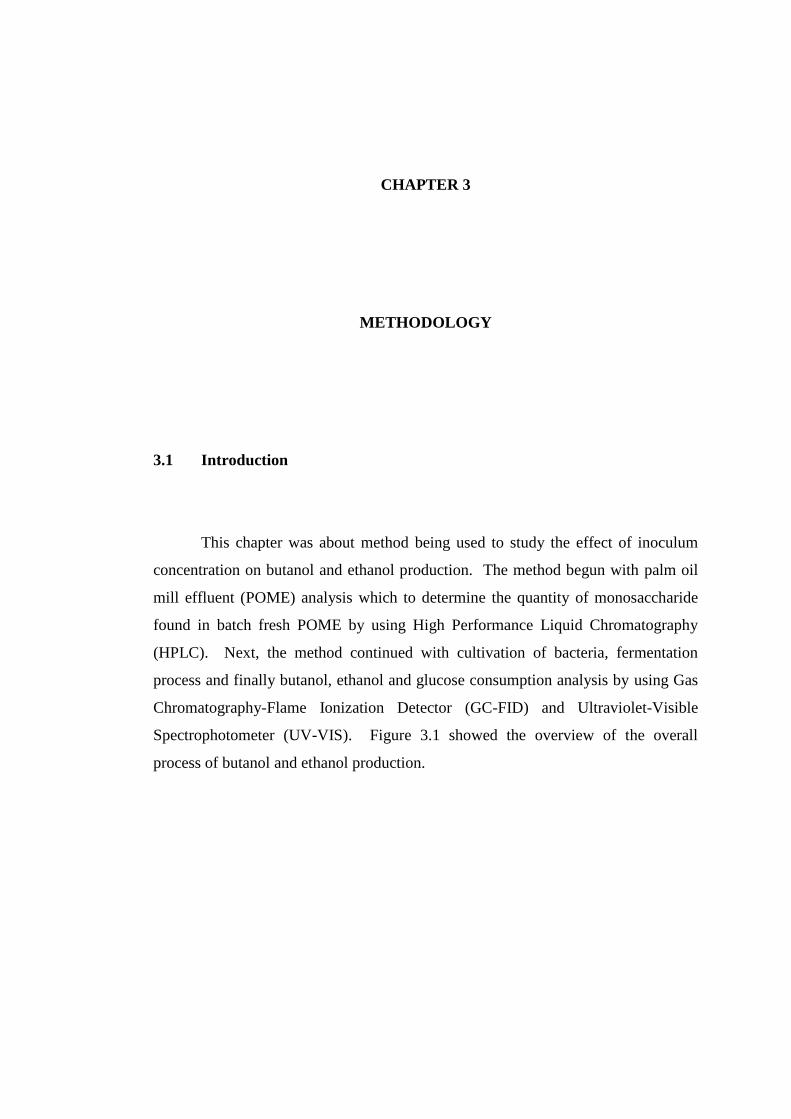
This chapter was about method being used to study the effect of inoculum
concentration on butanol and ethanol production. The method begun with palm oil
mill effluent (POME) analysis which to determine the quantity of monosaccharide
found in batch fresh POME by using High Performance Liquid Chromatography
(HPLC). Next, the method continued with cultivation of bacteria, fermentation
process and finally butanol, ethanol and glucose consumption analysis by using Gas
Chromatography-Flame Ionization Detector (GC-FID) and Ultraviolet-Visible
Spectrophotometer (UV-VIS). Figure 3.1 showed the overview of the overall
process of butanol and ethanol production.
25
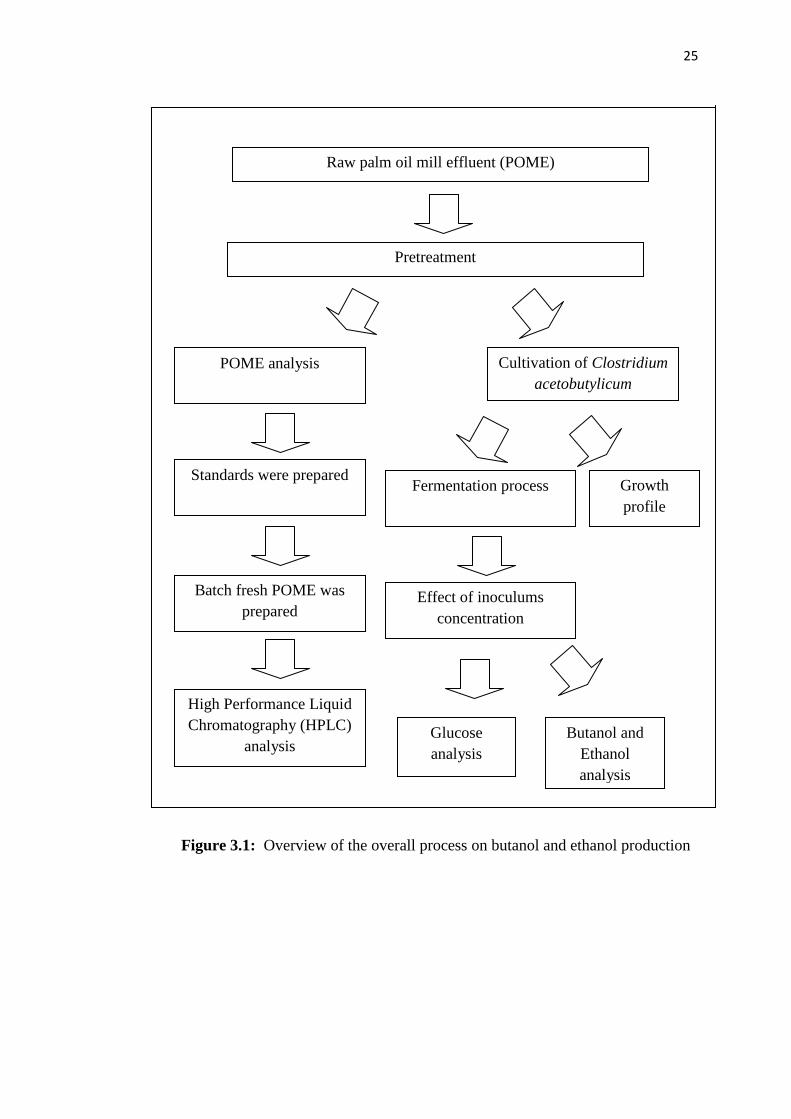
Figure 3.1: Overview of the overall process on butanol and ethanol production
Raw palm oil mill effluent (POME)
Pretreatment
POME analysis Cultivation of Clostridium
acetobutylicum
Standards were prepared
Batch fresh POME was
prepared
High Performance Liquid
Chromatography (HPLC)
analysis
Growth
profile
Fermentation process
Effect of inoculums
concentration
Glucose
analysis
Butanol and
Ethanol
analysis
26
3.2 Materials
Palm oil mill effluent (POME) obtained from Palm Oil Mill Factory Lepar
Hilir, Pahang. Clostridium acetobutylicum preserved in glycerol stock was obtained
from University Kebangsaan Malaysia (UKM), Bangi, Selangor. Sodium hydroxide
(NaOH) was from Sigma. Chromatographic standards for HPLC such as glucose
(99% purity), xylose (99% purity), arabinose (99% purity) and galactose (99%
purity) were come from Sigma. Chromatographic standards for GC-FID such as
hexane (99% purity), ethanol (99% purity), butanol and toluene were purchased from
Sigma. Another material being used was Reinforced Clostridia Media (RCM) broth
and Reinforced Clostridia Media (RCM) agar which were weighed at 38 gram and
52.5 gram using analytical balance. Then, RCM agar and RCM broth were
autoclaved at 121°C for 15 minutes. Sodium sulphate (Na2SO4) was came from
Sigma similar with acetonitrile was purchased from same chemical company.
Ultrapure water, distilled water and nitrogen gas were provided in Faculty of
Chemical Engineering and Natural Resources (FKKSA) laboratory. 70% ethanol
also purchased from Sigma. Moreover, Dinitroalicyclic reagent (DNS reagent) was
prepared using standard methods.
3.3 Equipment and apparatus
Equipment used such as refrigerated centrifuge, clamp incubator shaker,
anaerobic chamber, laminar flow cabinet, chiller at 4°C, refrigerator at -20°C, UV-
Vis Spectrophotometer, water bath at 90°C, autoclave, hot plate, HPLC, GC-FID,
analytical balance, and pH meter were provided in FKKSA laboratory. Furthermore,
apparatus used during experimental procedure were sample bottles, beakers,
separator funnels, stirrer, spatula, syringe filter (0.20 µm), scotch bottles (250 mL
and 500 mL), aluminum foils, petri dish, Bunsen burner, sterilized tooth picks,
cuvette, sterilized syringe, modified bottle (will be discussed later), parafilm,
measuring cylinder, test tubes, test tubes rack, micropipette, volumetric flask,
27
centrifuge bottle, conical flask, funnels, 0.45µm filter and retort stands borrowed
from FKKSA laboratory.
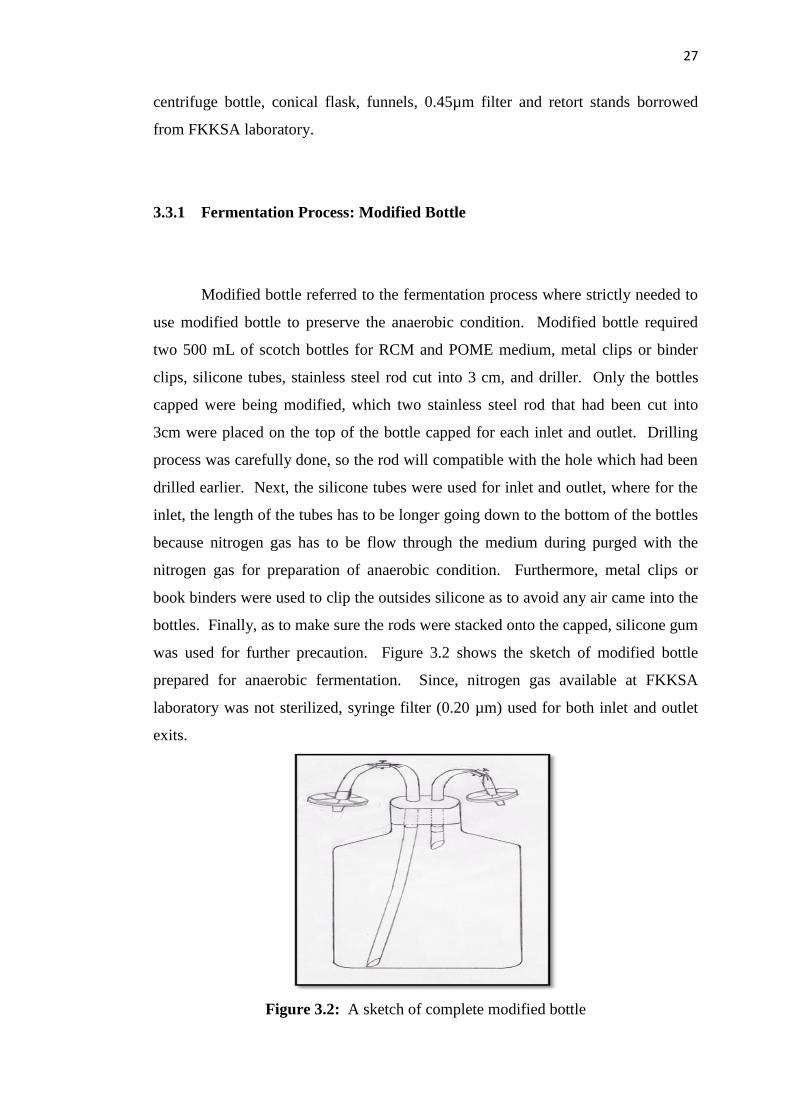
3.3.1 Fermentation Process: Modified Bottle
Modified bottle referred to the fermentation process where strictly needed to
use modified bottle to preserve the anaerobic condition. Modified bottle required
two 500 mL of scotch bottles for RCM and POME medium, metal clips or binder
clips, silicone tubes, stainless steel rod cut into 3 cm, and driller. Only the bottles
capped were being modified, which two stainless steel rod that had been cut into
3cm were placed on the top of the bottle capped for each inlet and outlet. Drilling
process was carefully done, so the rod will compatible with the hole which had been
drilled earlier. Next, the silicone tubes were used for inlet and outlet, where for the
inlet, the length of the tubes has to be longer going down to the bottom of the bottles
because nitrogen gas has to be flow through the medium during purged with the
nitrogen gas for preparation of anaerobic condition. Furthermore, metal clips or
book binders were used to clip the outsides silicone as to avoid any air came into the
bottles. Finally, as to make sure the rods were stacked onto the capped, silicone gum
was used for further precaution. Figure 3.2 shows the sketch of modified bottle
prepared for anaerobic fermentation. Since, nitrogen gas available at FKKSA
laboratory was not sterilized, syringe filter (0.20 µm) used for both inlet and outlet
exits.
Figure 3.2: A sketch of complete modified bottle
28
3.4 Experimental Procedure
3.4.1 Palm oil mill effluent (POME) Analysis
3.4.1.1 Preparations of Standards
Standards used in POME analysis; glucose, xylose, arabinose, and galactose
had been prepared at concentration of 10 g/L, 20 g/L, 30 g/L 40 g/L and 50 g/L
respectively. In order to prepare those standards, a stock solution containing 50 g/L
of each standard must be prepared carefully. 5 gram of each standard was weighed
using analytical balance accurately. Then, after weighed four different standards,
each of them had to be diluted with ultrapure water. Ultrapure water used since,
HPLC required particular diluents for the analysis. The solution had to be mixed
thoroughly using stirrer till all the particles were dissolved. Then each 2 mL, 4 mL,
6 mL, and 8 mL were taken out using 100 µL micropipette from stock solution to
prepared 10 g/L, 20 g/L, 30 g/L and 50 g/L and diluted with different 10 mL
volumetric flask and finally ultrapure water was top upped with the solution and
mixed thoroughly. Each standard had to be filtered using 0.45 µm filter before
transferred into HPLC vials. Finally, each standard was then transferred into HPLC
vials till 1µL for calibration glucose, xylose, galactose and arabinose determination.
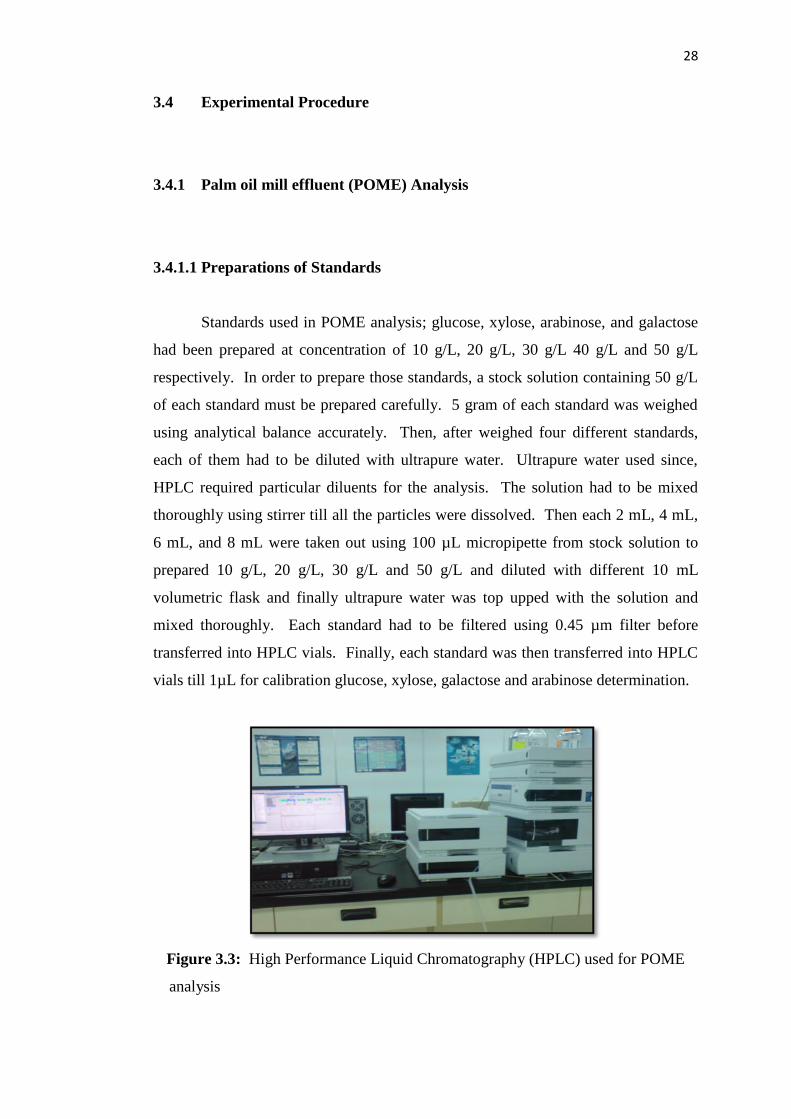
Figure 3.3: High Performance Liquid Chromatography (HPLC) used for POME
analysis
29
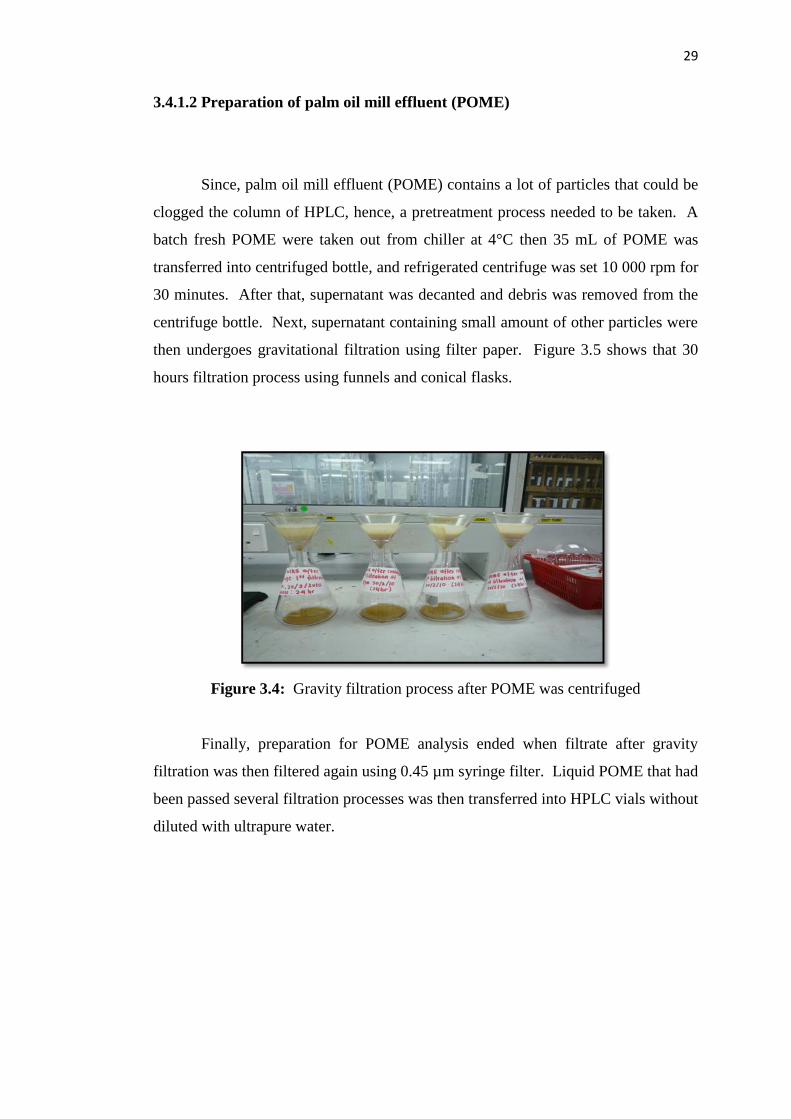
3.4.1.2 Preparation of palm oil mill effluent (POME)
Since, palm oil mill effluent (POME) contains a lot of particles that could be
clogged the column of HPLC, hence, a pretreatment process needed to be taken. A
batch fresh POME were taken out from chiller at 4°C then 35 mL of POME was
transferred into centrifuged bottle, and refrigerated centrifuge was set 10 000 rpm for
30 minutes. After that, supernatant was decanted and debris was removed from the
centrifuge bottle. Next, supernatant containing small amount of other particles were
then undergoes gravitational filtration using filter paper. Figure 3.5 shows that 30
hours filtration process using funnels and conical flasks.
Figure 3.4: Gravity filtration process after POME was centrifuged
Finally, preparation for POME analysis ended when filtrate after gravity
filtration was then filtered again using 0.45 µm syringe filter. Liquid POME that had
been passed several filtration processes was then transferred into HPLC vials without
diluted with ultrapure water.
30
3.4.1.3 High Performance Liquid Chromatography (HPLC) analysis
POME analysis finally entered the final stage of monosaccharide analysis.
This analysis required standards and sample run together to get better result.
Specification of properties of HPLC were, column used was SUPELCOSIL LC-
NH2, 25 cm x 4.6 mm, detector used was RI detector, flow rate was at 2 mL/min,
injection was 10-100 µL, 150 µg each sugar, ambient temperature and mobile phase
used was acetonitrile:water (75:25). Analyte that suitable were sugars. Analysis
ended after determination of calibration curve for external standards and sample
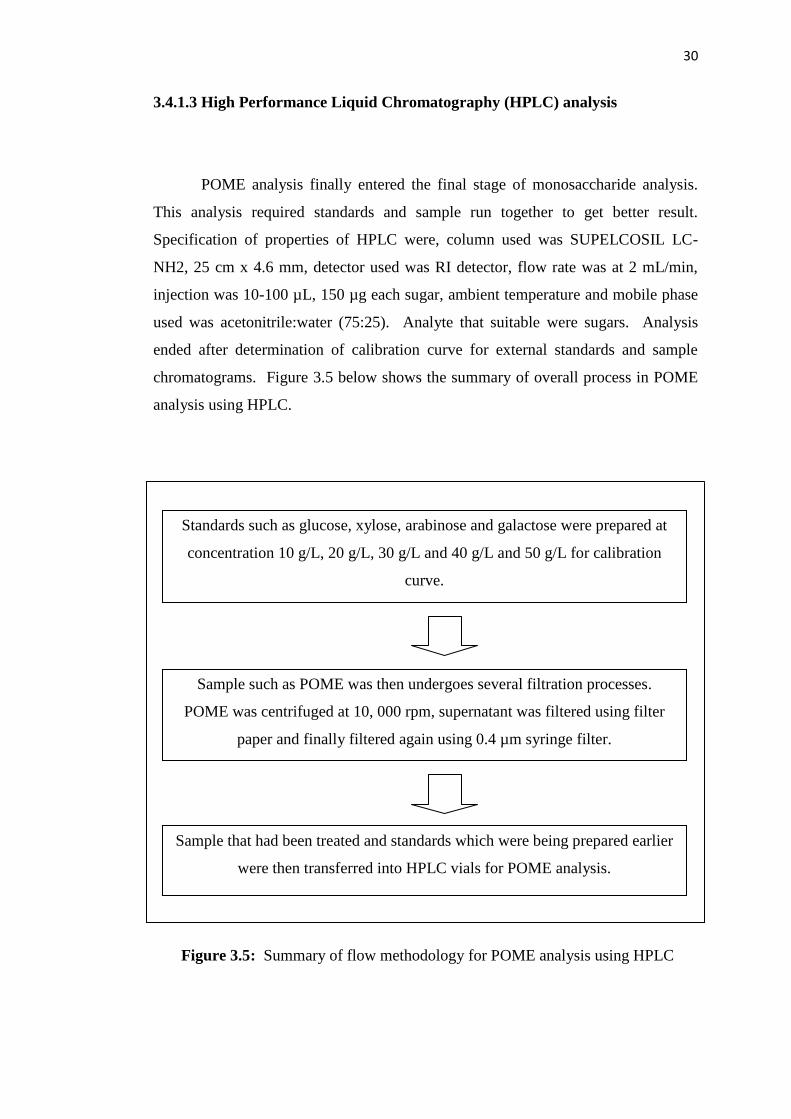
chromatograms. Figure 3.5 below shows the summary of overall process in POME
analysis using HPLC.
Figure 3.5: Summary of flow methodology for POME analysis using HPLC
Standards such as glucose, xylose, arabinose and galactose were prepared at
concentration 10 g/L, 20 g/L, 30 g/L and 40 g/L and 50 g/L for calibration
curve.
Sample such as POME was then undergoes several filtration processes.
POME was centrifuged at 10, 000 rpm, supernatant was filtered using filter
paper and finally filtered again using 0.4 µm syringe filter.
Sample that had been treated and standards which were being prepared earlier
were then transferred into HPLC vials for POME analysis.
31
3.4.2 Bacterial Cultivation
All procedures must have done in laminar flow cabinet with septic technique
to avoid any contamination. Besides that all apparatus that have been contacted with
the biological worked must be sterilized before used especially measuring cylinder
used to transfer RCM broth and tooth picks used for inoculating procedure. RCM
broth was then seeded with Clostridium acetobutylicum in the anaerobic chamber at
open flask from glycerol stock. Inoculated medium was incubated in the anaerobic
chamber for 24 to 30 hours at temperature 37°C. Besides that, RCM agar that has
been prepared earlier was used to pour onto petri dish for sub-cultured technique.
After incubation process, petri dish was inoculated using sterilized tooth picks and
was incubated in the anaerobic chamber for 48 hours.
3.4.2.1 Inoculum Preparation
After plate media was incubated, and obtained a single colony which have
similar color and size compared to other inoculated plate media, a new sterilized
tooth pick was used to inoculate a single colony from the plate media into the RCM
broth for inoculums preparation. Most of the works were done in anaerobic chamber
at open flask. The liquid medium that has been seeded with single colony was then
incubating in anaerobic chamber for 18 hours. The growth of culture in RCM
medium was monitored by measuring and OD at 680 nm using UV-Vis
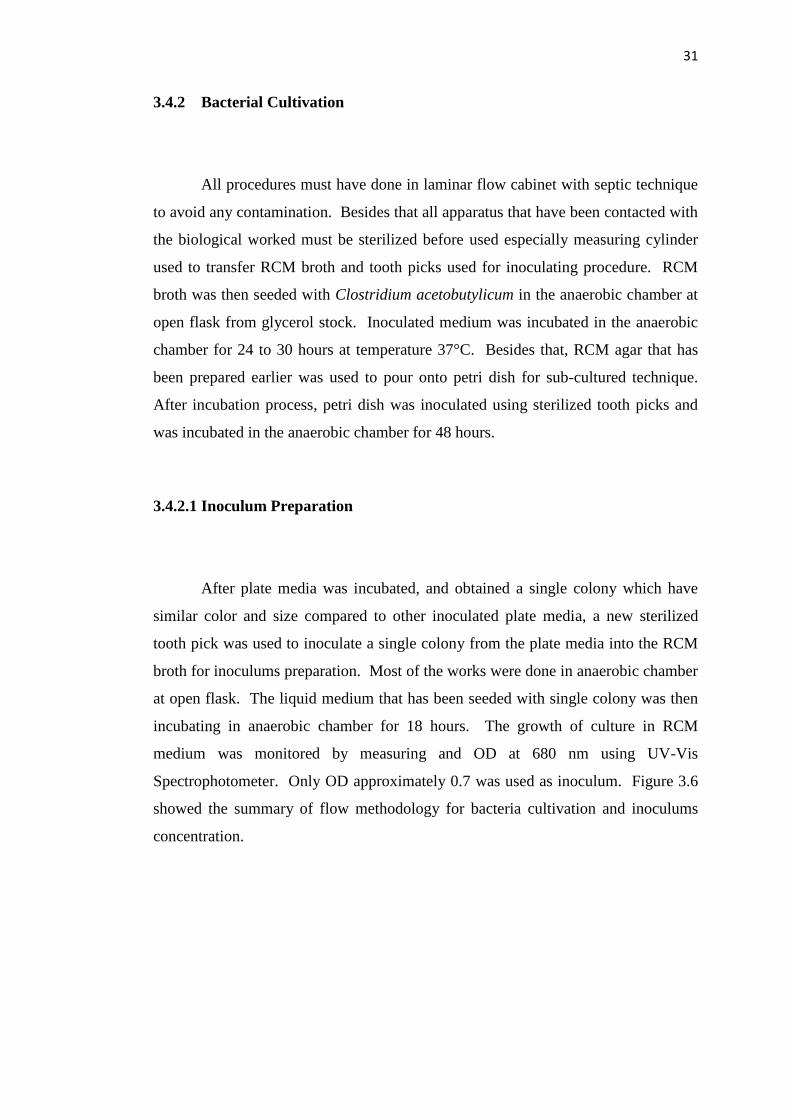
Spectrophotometer. Only OD approximately 0.7 was used as inoculum. Figure 3.6
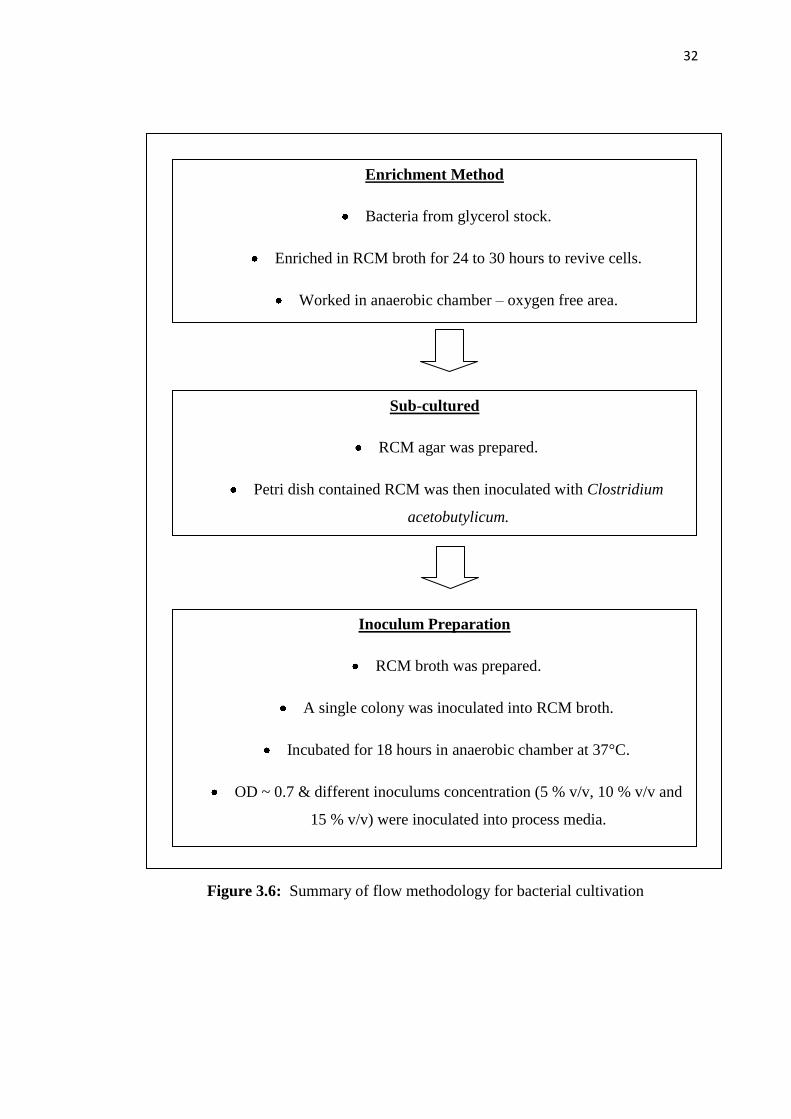
showed the summary of flow methodology for bacteria cultivation and inoculums
concentration.
32
Figure 3.6: Summary of flow methodology for bacterial cultivation
Enrichment Method
Bacteria from glycerol stock.
Enriched in RCM broth for 24 to 30 hours to revive cells.
Worked in anaerobic chamber – oxygen free area.
Sub-cultured
RCM agar was prepared.
Petri dish contained RCM was then inoculated with Clostridium
acetobutylicum.
Inoculum Preparation
RCM broth was prepared.
A single colony was inoculated into RCM broth.
Incubated for 18 hours in anaerobic chamber at 37°C.
OD ~ 0.7 & different inoculums concentration (5 % v/v, 10 % v/v and
15 % v/v) were inoculated into process media.
33
3.4.3 Preparation of Fermentation Media
Fresh POME was sedimented in the chiller at 4°C for 24 hours while RCM
broth was weighed at 38 gram using analytical balance and diluted with 1 liter
distilled water. The supernatant layer (upper part) was decanted while POME sludge
(lower part) was then diluted with distilled water to obtained desired concentration.
Initial pH was increased by added sodium hydroxide (NaOH) to 5.8. Both medium
were sterilized at 121°C for 15 minutes. After that, both medium were cooled to the
room temperature. Then, nitrogen gas was purged for 10 minutes for each medium
to provide anaerobic condition for Clostridium acetobutylicum. Both medium,
POME and RCM broth were seeded with inoculums that had been prepared earlier in
the anaerobic chamber. After that, both medium were clipped using metal clip
before transferred out from the anaerobic chamber. Both medium were incubated in
clamp incubator shaker at optimal condition, 200 rpm, 35°C, 90 % POME, 10 % v/v,
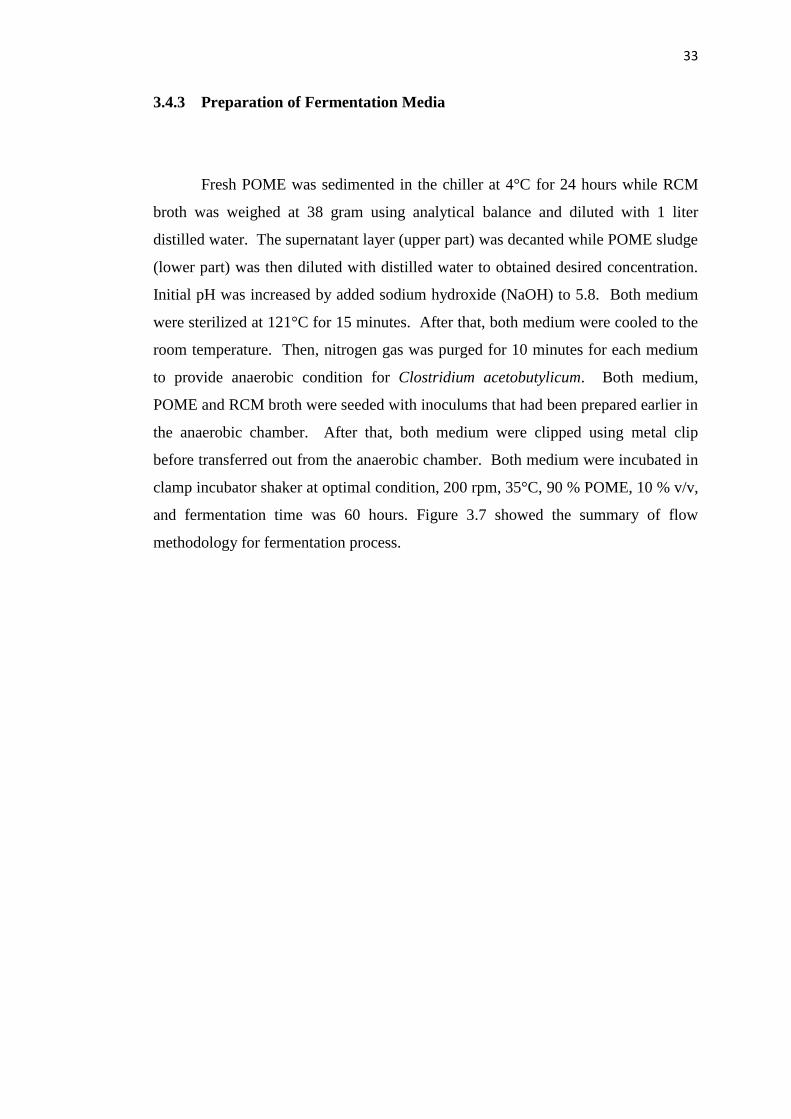
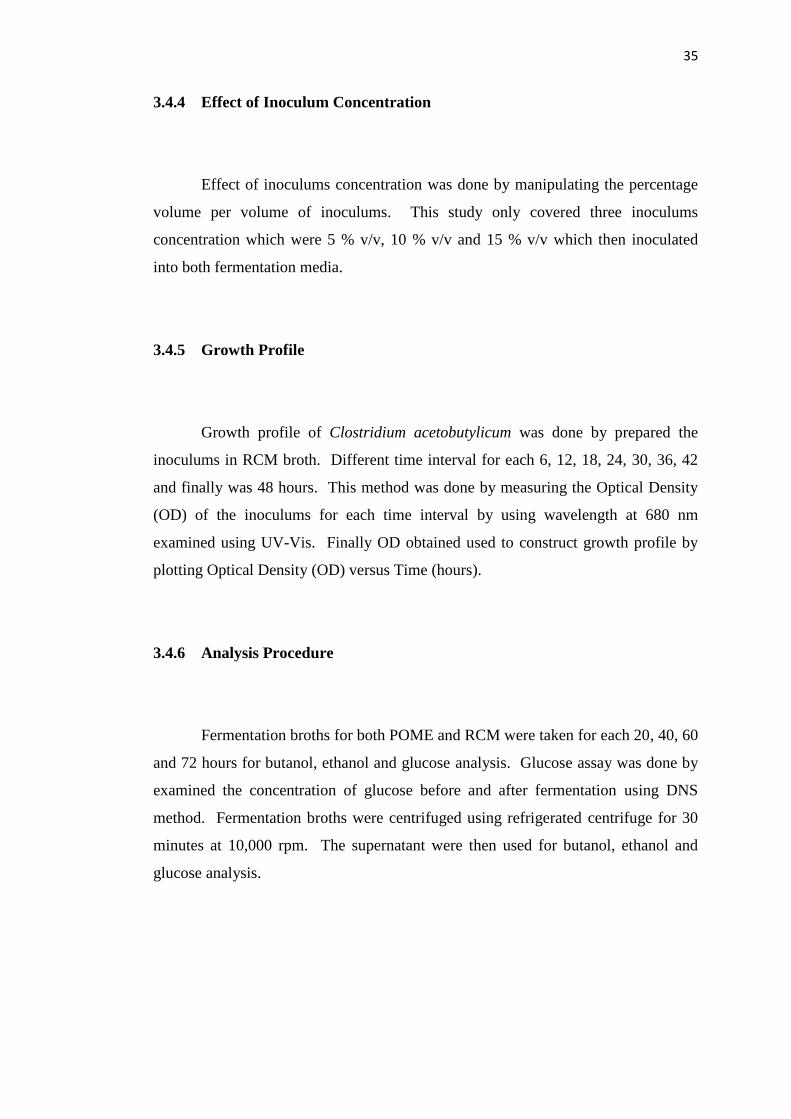
and fermentation time was 60 hours. Figure 3.7 showed the summary of flow
methodology for fermentation process.
34
Figure 3.7: Summary of flow methodology for fermentation process
Media Preparation
POME sedimentation.
RCM broth preparation
POME 90 % was diluted with distilled water.
pH of POME was increased to 5.8 using NaOH.
Sterilization
Bothe POME and RCM were autoclaved at 121°C for 15 minutes.
Anaerobic Condition
Bothe POME and RCM were purged with nitrogen gas.
Fermentation
Both POME and RCM were inoculated with inoculums.
Effect of inoculums concentration.
Optimal conditions were 35°C, 200 rpm, 90 % substrate, 10 % v/v and
incubation day was 72 hours.
35
3.4.4 Effect of Inoculum Concentration
Effect of inoculums concentration was done by manipulating the percentage
volume per volume of inoculums. This study only covered three inoculums
concentration which were 5 % v/v, 10 % v/v and 15 % v/v which then inoculated
into both fermentation media.
3.4.5 Growth Profile
Growth profile of Clostridium acetobutylicum was done by prepared the
inoculums in RCM broth. Different time interval for each 6, 12, 18, 24, 30, 36, 42
and finally was 48 hours. This method was done by measuring the Optical Density
(OD) of the inoculums for each time interval by using wavelength at 680 nm
examined using UV-Vis. Finally OD obtained used to construct growth profile by
plotting Optical Density (OD) versus Time (hours).
3.4.6 Analysis Procedure
Fermentation broths for both POME and RCM were taken for each 20, 40, 60
and 72 hours for butanol, ethanol and glucose analysis. Glucose assay was done by
examined the concentration of glucose before and after fermentation using DNS
method. Fermentation broths were centrifuged using refrigerated centrifuge for 30
minutes at 10,000 rpm. The supernatant were then used for butanol, ethanol and
glucose analysis.
36
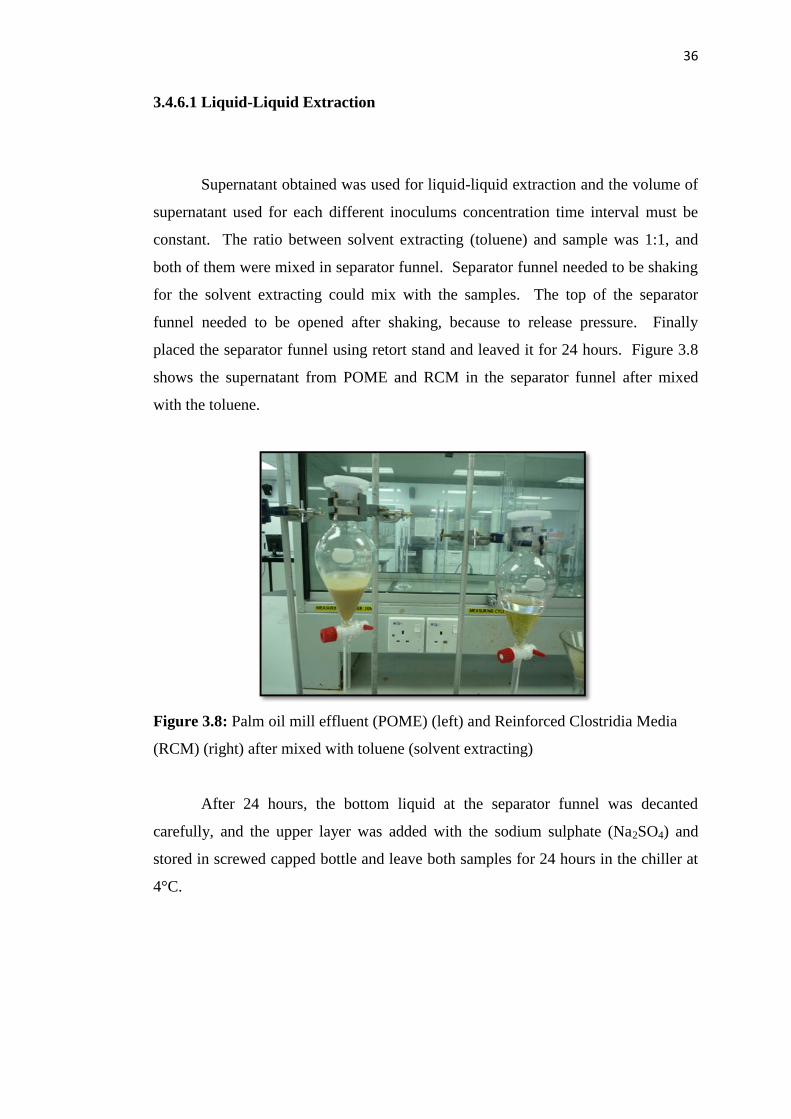
3.4.6.1 Liquid-Liquid Extraction
Supernatant obtained was used for liquid-liquid extraction and the volume of
supernatant used for each different inoculums concentration time interval must be
constant. The ratio between solvent extracting (toluene) and sample was 1:1, and
both of them were mixed in separator funnel. Separator funnel needed to be shaking
for the solvent extracting could mix with the samples. The top of the separator
funnel needed to be opened after shaking, because to release pressure. Finally
placed the separator funnel using retort stand and leaved it for 24 hours. Figure 3.8
shows the supernatant from POME and RCM in the separator funnel after mixed
with the toluene.
Figure 3.8: Palm oil mill effluent (POME) (left) and Reinforced Clostridia Media
(RCM) (right) after mixed with toluene (solvent extracting)
After 24 hours, the bottom liquid at the separator funnel was decanted
carefully, and the upper layer was added with the sodium sulphate (Na2SO4) and
stored in screwed capped bottle and leave both samples for 24 hours in the chiller at
4°C.
37
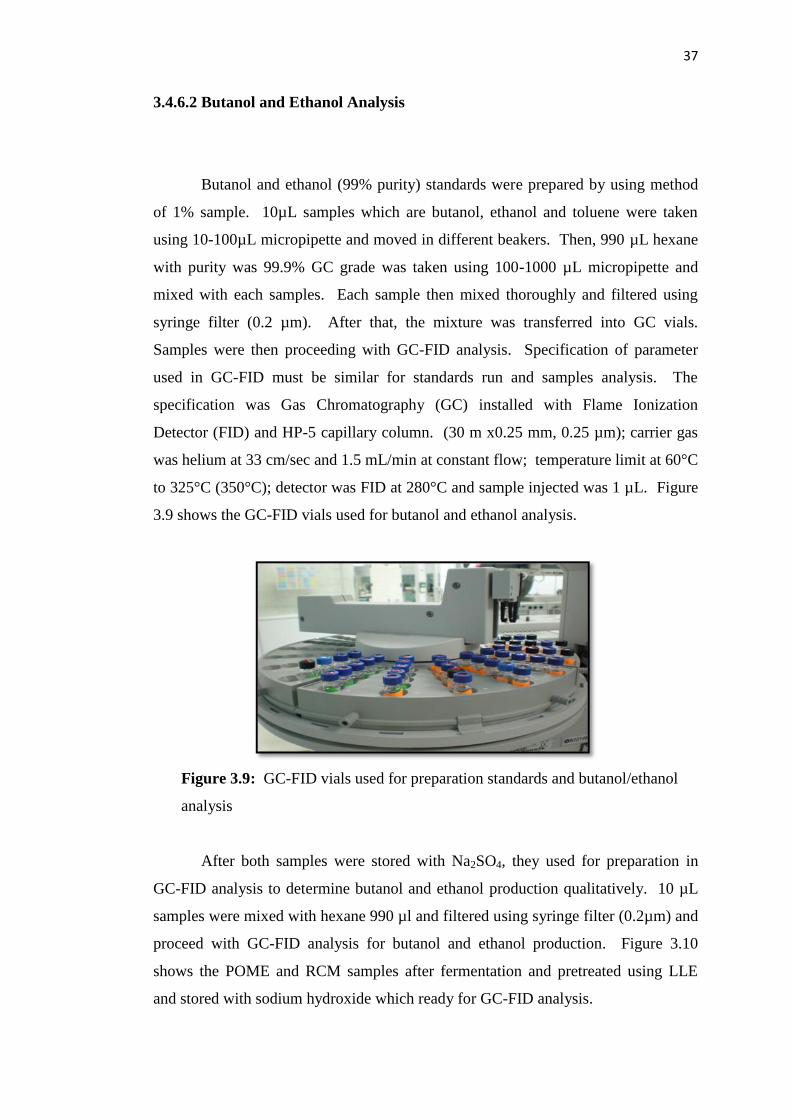
3.4.6.2 Butanol and Ethanol Analysis
Butanol and ethanol (99% purity) standards were prepared by using method
of 1% sample. 10µL samples which are butanol, ethanol and toluene were taken
using 10-100µL micropipette and moved in different beakers. Then, 990 µL hexane
with purity was 99.9% GC grade was taken using 100-1000 µL micropipette and
mixed with each samples. Each sample then mixed thoroughly and filtered using
syringe filter (0.2 µm). After that, the mixture was transferred into GC vials.
Samples were then proceeding with GC-FID analysis. Specification of parameter
used in GC-FID must be similar for standards run and samples analysis. The
specification was Gas Chromatography (GC) installed with Flame Ionization
Detector (FID) and HP-5 capillary column. (30 m x0.25 mm, 0.25 µm); carrier gas
was helium at 33 cm/sec and 1.5 mL/min at constant flow; temperature limit at 60°C
to 325°C (350°C); detector was FID at 280°C and sample injected was 1 µL. Figure
3.9 shows the GC-FID vials used for butanol and ethanol analysis.
Figure 3.9: GC-FID vials used for preparation standards and butanol/ethanol
analysis
After both samples were stored with Na2SO4, they used for preparation in
GC-FID analysis to determine butanol and ethanol production qualitatively. 10 µL
samples were mixed with hexane 990 µl and filtered using syringe filter (0.2µm) and
proceed with GC-FID analysis for butanol and ethanol production. Figure 3.10
shows the POME and RCM samples after fermentation and pretreated using LLE
and stored with sodium hydroxide which ready for GC-FID analysis.
38
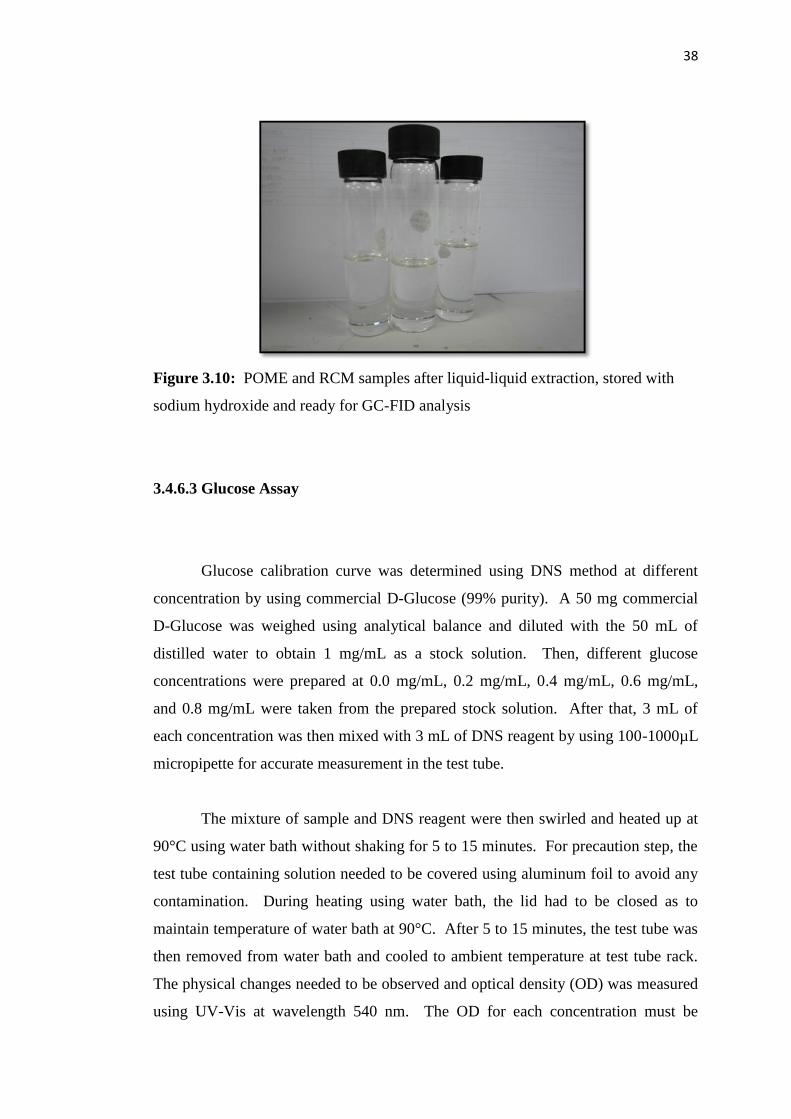
Figure 3.10: POME and RCM samples after liquid-liquid extraction, stored with
sodium hydroxide and ready for GC-FID analysis
3.4.6.3 Glucose Assay
Glucose calibration curve was determined using DNS method at different
concentration by using commercial D-Glucose (99% purity). A 50 mg commercial
D-Glucose was weighed using analytical balance and diluted with the 50 mL of
distilled water to obtain 1 mg/mL as a stock solution. Then, different glucose
concentrations were prepared at 0.0 mg/mL, 0.2 mg/mL, 0.4 mg/mL, 0.6 mg/mL,
and 0.8 mg/mL were taken from the prepared stock solution. After that, 3 mL of
each concentration was then mixed with 3 mL of DNS reagent by using 100-1000µL
micropipette for accurate measurement in the test tube.
The mixture of sample and DNS reagent were then swirled and heated up at
90°C using water bath without shaking for 5 to 15 minutes. For precaution step, the
test tube containing solution needed to be covered using aluminum foil to avoid any
contamination. During heating using water bath, the lid had to be closed as to
maintain temperature of water bath at 90°C. After 5 to 15 minutes, the test tube was
then removed from water bath and cooled to ambient temperature at test tube rack.
The physical changes needed to be observed and optical density (OD) was measured
using UV-Vis at wavelength 540 nm. The OD for each concentration must be
39
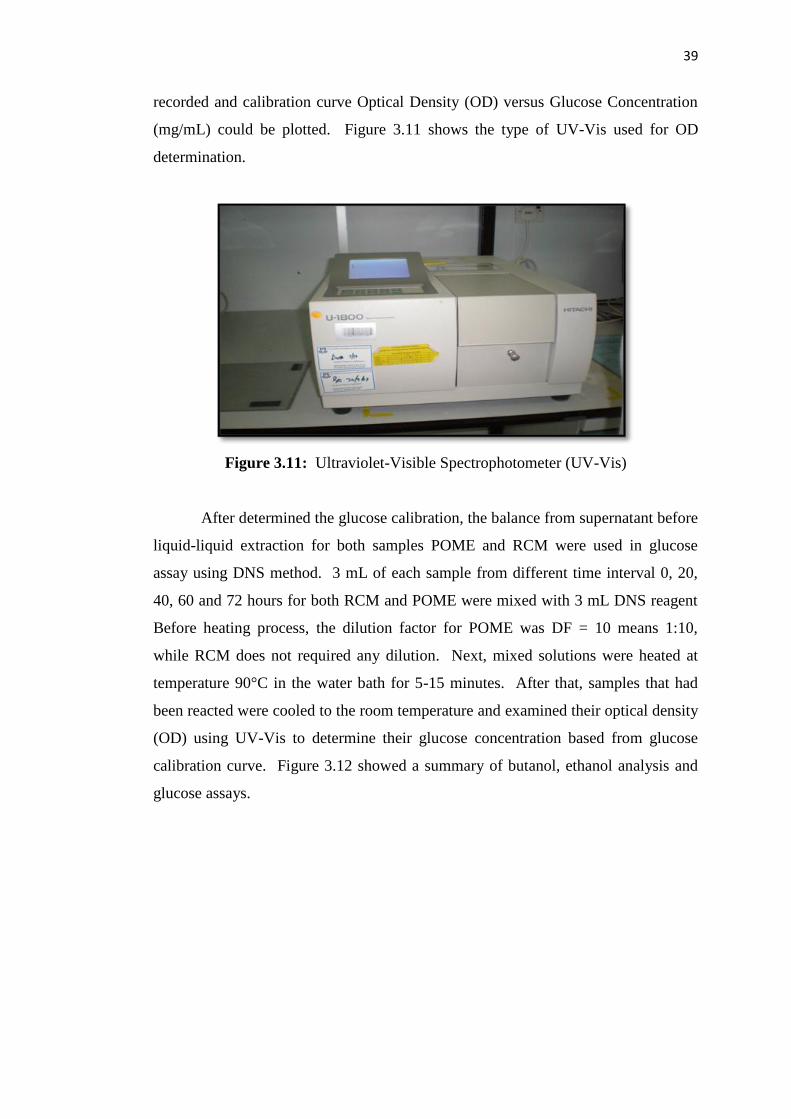
recorded and calibration curve Optical Density (OD) versus Glucose Concentration
(mg/mL) could be plotted. Figure 3.11 shows the type of UV-Vis used for OD
determination.
Figure 3.11: Ultraviolet-Visible Spectrophotometer (UV-Vis)
After determined the glucose calibration, the balance from supernatant before
liquid-liquid extraction for both samples POME and RCM were used in glucose
assay using DNS method. 3 mL of each sample from different time interval 0, 20,
40, 60 and 72 hours for both RCM and POME were mixed with 3 mL DNS reagent
Before heating process, the dilution factor for POME was DF = 10 means 1:10,
while RCM does not required any dilution. Next, mixed solutions were heated at
temperature 90°C in the water bath for 5-15 minutes. After that, samples that had
been reacted were cooled to the room temperature and examined their optical density
(OD) using UV-Vis to determine their glucose concentration based from glucose
calibration curve. Figure 3.12 showed a summary of butanol, ethanol analysis and
glucose assays.
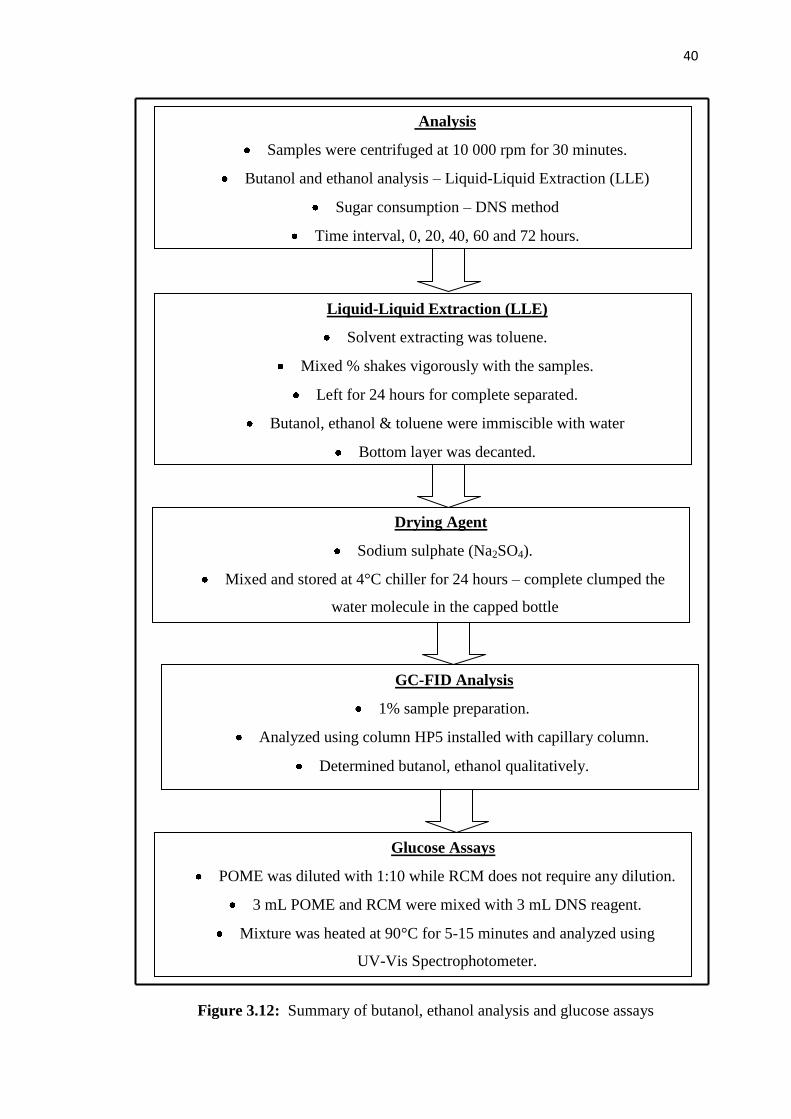
40
Figure 3.12: Summary of butanol, ethanol analysis and glucose assays
Analysis
Samples were centrifuged at 10 000 rpm for 30 minutes.
Butanol and ethanol analysis – Liquid-Liquid Extraction (LLE)
Sugar consumption – DNS method
Time interval, 0, 20, 40, 60 and 72 hours.
Liquid-Liquid Extraction (LLE)
Solvent extracting was toluene.
Mixed % shakes vigorously with the samples.
Left for 24 hours for complete separated.
Butanol, ethanol & toluene were immiscible with water
Bottom layer was decanted.
Drying Agent
Sodium sulphate (Na2SO4).
Mixed and stored at 4°C chiller for 24 hours – complete clumped the
water molecule in the capped bottle
GC-FID Analysis
1% sample preparation.
Analyzed using column HP5 installed with capillary column.
Determined butanol, ethanol qualitatively.
Glucose Assays
POME was diluted with 1:10 while RCM does not require any dilution.
3 mL POME and RCM were mixed with 3 mL DNS reagent.
Mixture was heated at 90°C for 5-15 minutes and analyzed using
UV-Vis Spectrophotometer.
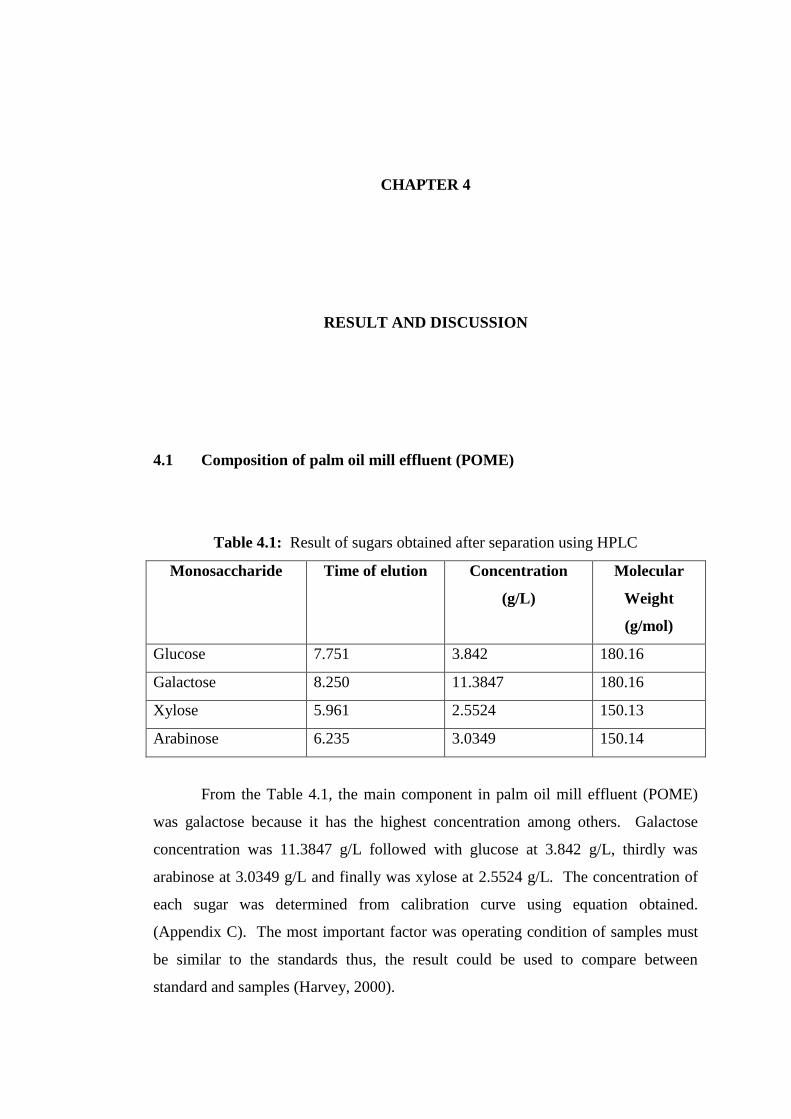
CHAPTER 4
RESULT AND DISCUSSION
4.1 Composition of palm oil mill effluent (POME)
Table 4.1: Result of sugars obtained after separation using HPLC
Monosaccharide Time of elution Concentration
(g/L)
Molecular
Weight
(g/mol)
Glucose 7.751 3.842 180.16
Galactose 8.250 11.3847 180.16
Xylose 5.961 2.5524 150.13
Arabinose 6.235 3.0349 150.14
From the Table 4.1, the main component in palm oil mill effluent (POME)
was galactose because it has the highest concentration among others. Galactose
concentration was 11.3847 g/L followed with glucose at 3.842 g/L, thirdly was
arabinose at 3.0349 g/L and finally was xylose at 2.5524 g/L. The concentration of
each sugar was determined from calibration curve using equation obtained.
(Appendix C). The most important factor was operating condition of samples must
be similar to the standards thus, the result could be used to compare between
standard and samples (Harvey, 2000).
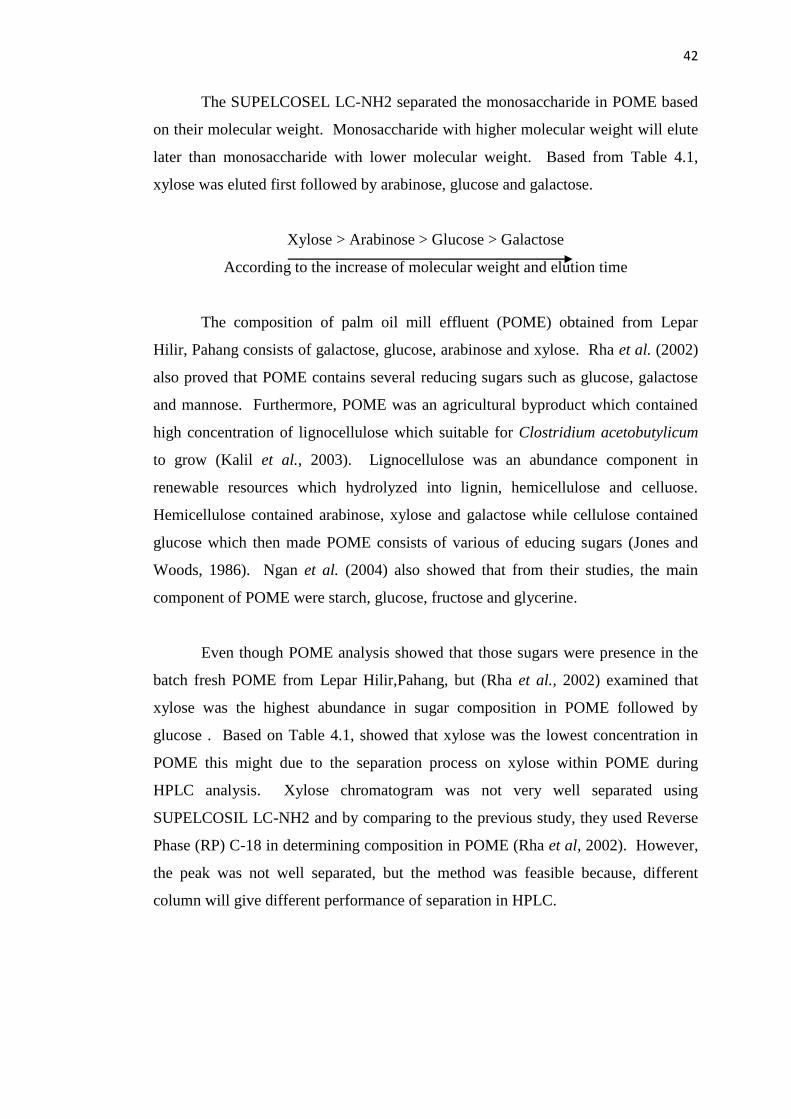
42
The SUPELCOSEL LC-NH2 separated the monosaccharide in POME based
on their molecular weight. Monosaccharide with higher molecular weight will elute
later than monosaccharide with lower molecular weight. Based from Table 4.1,
xylose was eluted first followed by arabinose, glucose and galactose.
Xylose > Arabinose > Glucose > Galactose
According to the increase of molecular weight and elution time
The composition of palm oil mill effluent (POME) obtained from Lepar
Hilir, Pahang consists of galactose, glucose, arabinose and xylose. Rha et al. (2002)
also proved that POME contains several reducing sugars such as glucose, galactose
and mannose. Furthermore, POME was an agricultural byproduct which contained
high concentration of lignocellulose which suitable for Clostridium acetobutylicum
to grow (Kalil et al., 2003). Lignocellulose was an abundance component in
renewable resources which hydrolyzed into lignin, hemicellulose and celluose.
Hemicellulose contained arabinose, xylose and galactose while cellulose contained
glucose which then made POME consists of various of educing sugars (Jones and
Woods, 1986). Ngan et al. (2004) also showed that from their studies, the main
component of POME were starch, glucose, fructose and glycerine.
Even though POME analysis showed that those sugars were presence in the
batch fresh POME from Lepar Hilir,Pahang, but (Rha et al., 2002) examined that
xylose was the highest abundance in sugar composition in POME followed by
glucose . Based on Table 4.1, showed that xylose was the lowest concentration in
POME this might due to the separation process on xylose within POME during
HPLC analysis. Xylose chromatogram was not very well separated using
SUPELCOSIL LC-NH2 and by comparing to the previous study, they used Reverse
Phase (RP) C-18 in determining composition in POME (Rha et al, 2002). However,
the peak was not well separated, but the method was feasible because, different
column will give different performance of separation in HPLC.
43
4.2 Growth Profile
Figure 4.1: Growth Profile of Clostridium acetobutylicum
Population of bacteria does not maintain its potential growth rate and does
not double endlessly. Quantitative laboratory studies indicate that a population
typically displays a predictable pattern, or growth curve, over time. Figure 4.1
shows the growth curve of Clostridium acetobutylicum in different fermentation
medium. Red line shows the curve of bacteria in Reinforced Clostridia Media
(RCM) has a similar pattern with the Blue line indicates growth curve of bacteria in
palm oil mill effluent (POME).
From the graph (Figure 4.1), it showed that at 0 to 6 hours illustrated that
Clostridium acetobutylicum was at lag phase or relatively “flat” period. The period
happen when, newly inoculated cells required a period of adjustment, enlargement
and synthesis. POME growth curve shows at the first lag phase was slightly higher
than RCM growth curve, this was because, clostridia at the vegetative cell was
rapidly dividing themselves and quickly adapted into a new environment. The
length of lag phase was varies for different culture. Clostridia shows better
performance for both medium when their length of lag period much shorter and
rapidly entered exponential phase.
44
Investigation on exponential phase entered between time interval was at 6 to
18 hours demonstrated that, the cells reach the maximum rate of cell division during
the exponential growth. This phase will continue as long as cells have adequate
nutrients and the environment was favorable (Cowan and Talaro, 2006).
Performance of clostridia seems supported the previous dicussion because, from
figure 4.1 showed that within the time interval of 6 to 18 hours, the curve increased
rapidly for both growth rate in POME and RCM medium. This explained that, the
maximum growth in RCM and POME medium was at after 18 hours with optical
density (OD) was approximately 0.7. (Shown in the purple circle). The physical
changes showed, the medium in RCM was cloudy but physical changes in POME
cannot be seen. Based from the Figure 4.1, the maximum growth of Clostridium
acetobutylicum was at OD 0.7, thus it was suitable used for inoculum in fermentation
media since more clostridia cells were produced at OD 0.7. Both studies by Kalil et
al. (2003) and Takriff et al. (2009) were also used inoculum with OD was 0.7 after
18 hours of incubation period
Similar to basic growth curve of others microbes, clostridia growth curve for
both POME and RCM will entered stationery phase. The population entered
survival mode in which cells stop growing or grow slowly. After 18 to 30 hours
time interval, clostridia growth curve was decreased gradually. But after 30 hours to
72 hours, curve of both medium were gave different result. After stationary phase,
POME clostrida growth curve seem became slower explained that, due to the use of
glucose derived from POME instead of the whole POME as the medium (Kalil et al.,
2003).
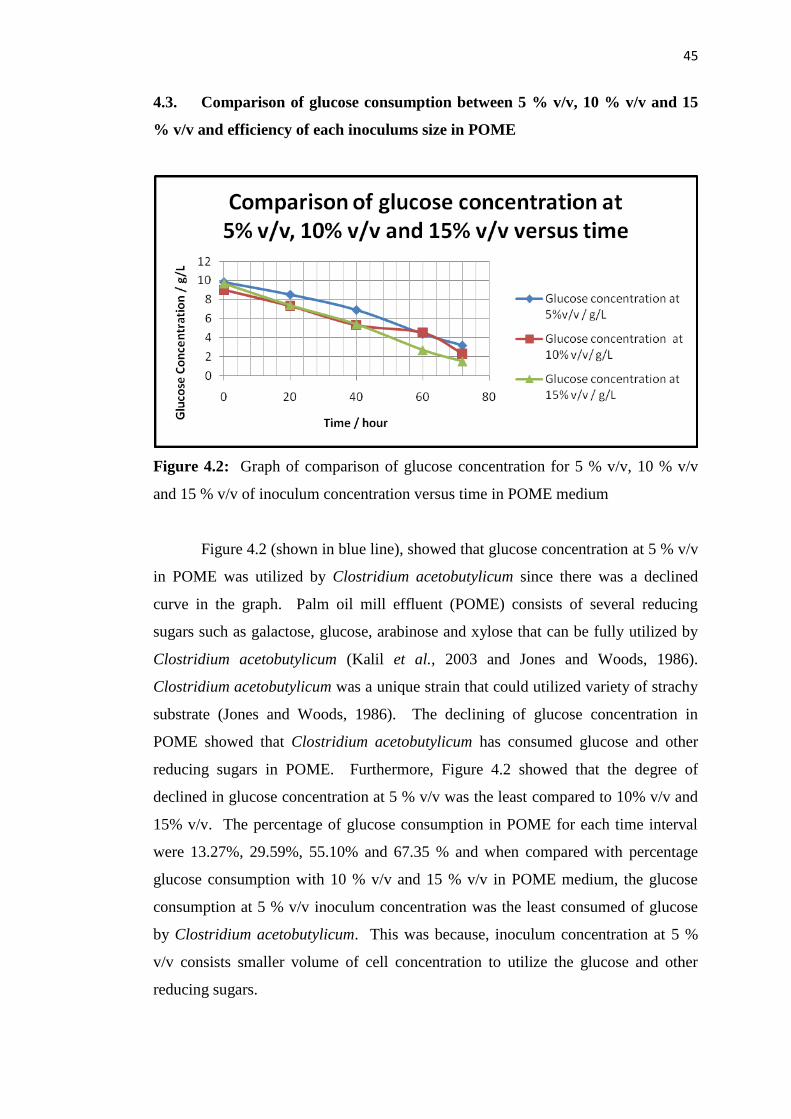
45
4.3. Comparison of glucose consumption between 5 % v/v, 10 % v/v and 15
% v/v and efficiency of each inoculums size in POME
Figure 4.2: Graph of comparison of glucose concentration for 5 % v/v, 10 % v/v
and 15 % v/v of inoculum concentration versus time in POME medium
Figure 4.2 (shown in blue line), showed that glucose concentration at 5 % v/v
in POME was utilized by Clostridium acetobutylicum since there was a declined
curve in the graph. Palm oil mill effluent (POME) consists of several reducing
sugars such as galactose, glucose, arabinose and xylose that can be fully utilized by
Clostridium acetobutylicum (Kalil et al., 2003 and Jones and Woods, 1986).
Clostridium acetobutylicum was a unique strain that could utilized variety of strachy
substrate (Jones and Woods, 1986). The declining of glucose concentration in
POME showed that Clostridium acetobutylicum has consumed glucose and other
reducing sugars in POME. Furthermore, Figure 4.2 showed that the degree of
declined in glucose concentration at 5 % v/v was the least compared to 10% v/v and
15% v/v. The percentage of glucose consumption in POME for each time interval
were 13.27%, 29.59%, 55.10% and 67.35 % and when compared with percentage
glucose consumption with 10 % v/v and 15 % v/v in POME medium, the glucose
consumption at 5 % v/v inoculum concentration was the least consumed of glucose
by Clostridium acetobutylicum. This was because, inoculum concentration at 5 %
v/v consists smaller volume of cell concentration to utilize the glucose and other
reducing sugars.
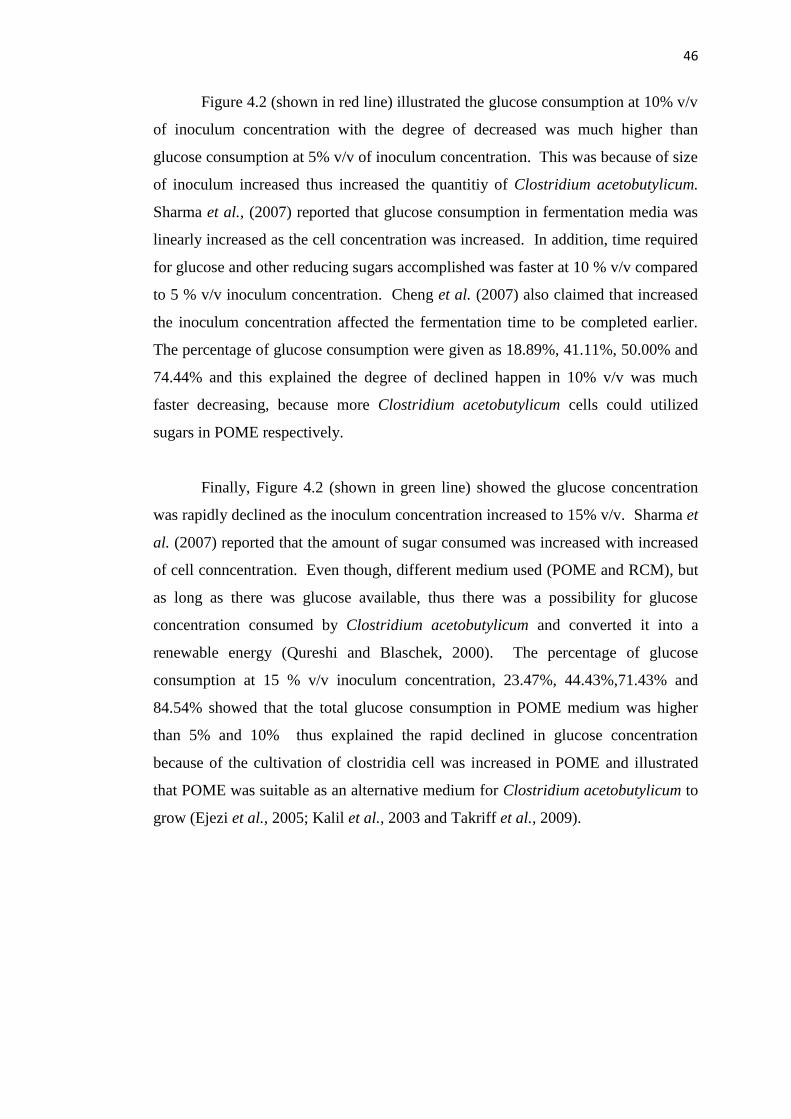
46
Figure 4.2 (shown in red line) illustrated the glucose consumption at 10% v/v
of inoculum concentration with the degree of decreased was much higher than
glucose consumption at 5% v/v of inoculum concentration. This was because of size
of inoculum increased thus increased the quantitiy of Clostridium acetobutylicum.
Sharma et al., (2007) reported that glucose consumption in fermentation media was
linearly increased as the cell concentration was increased. In addition, time required
for glucose and other reducing sugars accomplished was faster at 10 % v/v compared
to 5 % v/v inoculum concentration. Cheng et al. (2007) also claimed that increased
the inoculum concentration affected the fermentation time to be completed earlier.
The percentage of glucose consumption were given as 18.89%, 41.11%, 50.00% and
74.44% and this explained the degree of declined happen in 10% v/v was much
faster decreasing, because more Clostridium acetobutylicum cells could utilized
sugars in POME respectively.
Finally, Figure 4.2 (shown in green line) showed the glucose concentration
was rapidly declined as the inoculum concentration increased to 15% v/v. Sharma et
al. (2007) reported that the amount of sugar consumed was increased with increased
of cell conncentration. Even though, different medium used (POME and RCM), but
as long as there was glucose available, thus there was a possibility for glucose
concentration consumed by Clostridium acetobutylicum and converted it into a
renewable energy (Qureshi and Blaschek, 2000). The percentage of glucose
consumption at 15 % v/v inoculum concentration, 23.47%, 44.43%,71.43% and
84.54% showed that the total glucose consumption in POME medium was higher
than 5% and 10% thus explained the rapid declined in glucose concentration
because of the cultivation of clostridia cell was increased in POME and illustrated
that POME was suitable as an alternative medium for Clostridium acetobutylicum to
grow (Ejezi et al., 2005; Kalil et al., 2003 and Takriff et al., 2009).
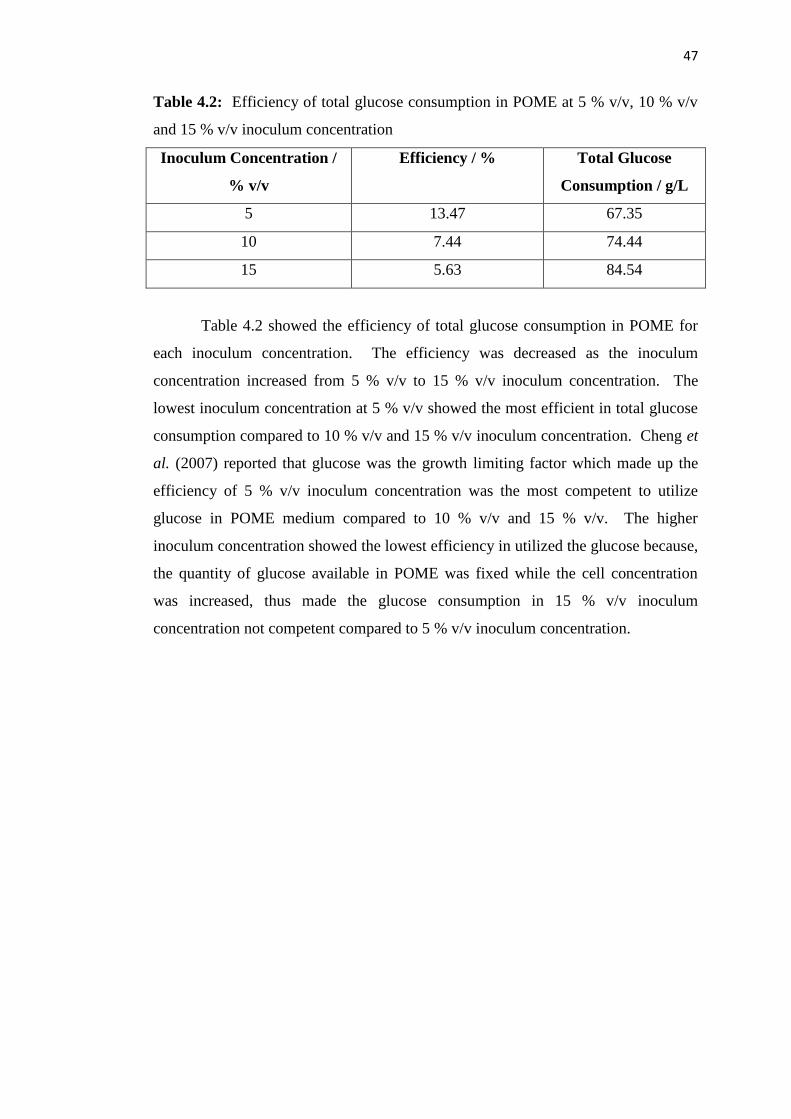
47
Table 4.2: Efficiency of total glucose consumption in POME at 5 % v/v, 10 % v/v
and 15 % v/v inoculum concentration
Inoculum Concentration /
% v/v
Efficiency / % Total Glucose
Consumption / g/L
5 13.47 67.35
10 7.44 74.44
15 5.63 84.54
Table 4.2 showed the efficiency of total glucose consumption in POME for
each inoculum concentration. The efficiency was decreased as the inoculum
concentration increased from 5 % v/v to 15 % v/v inoculum concentration. The
lowest inoculum concentration at 5 % v/v showed the most efficient in total glucose
consumption compared to 10 % v/v and 15 % v/v inoculum concentration. Cheng et
al. (2007) reported that glucose was the growth limiting factor which made up the
efficiency of 5 % v/v inoculum concentration was the most competent to utilize
glucose in POME medium compared to 10 % v/v and 15 % v/v. The higher
inoculum concentration showed the lowest efficiency in utilized the glucose because,
the quantity of glucose available in POME was fixed while the cell concentration
was increased, thus made the glucose consumption in 15 % v/v inoculum
concentration not competent compared to 5 % v/v inoculum concentration.
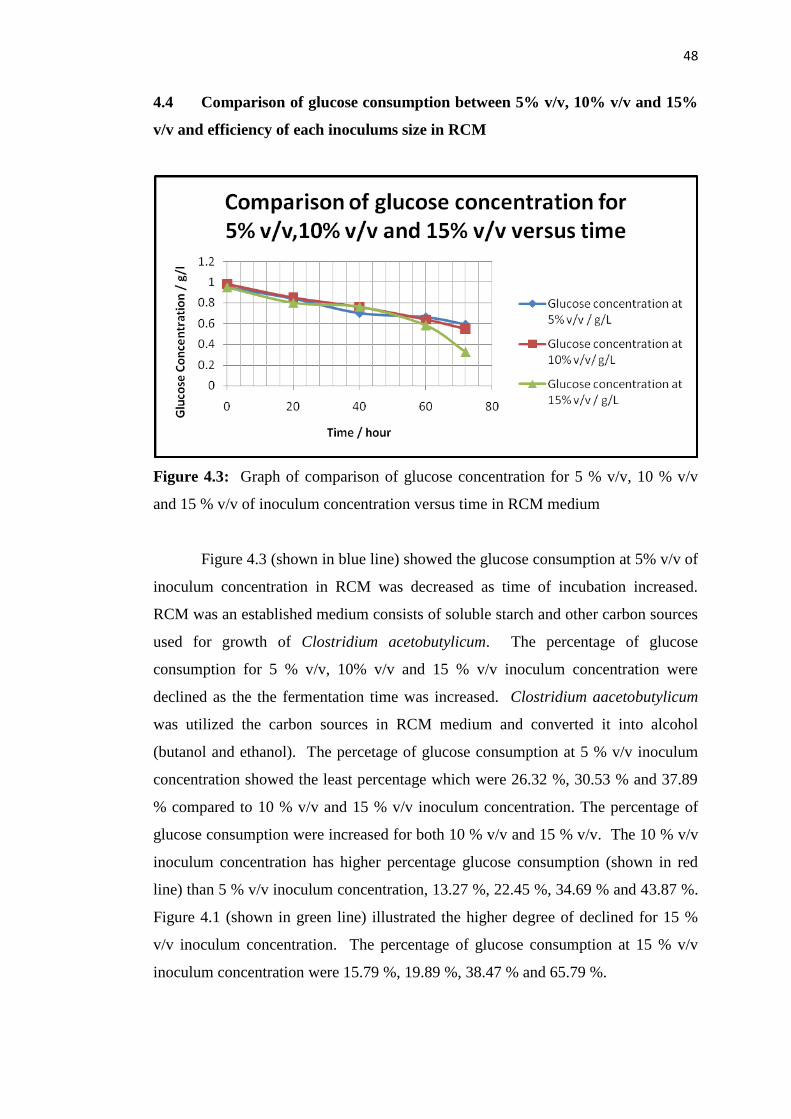
48
4.4 Comparison of glucose consumption between 5% v/v, 10% v/v and 15%
v/v and efficiency of each inoculums size in RCM
Figure 4.3: Graph of comparison of glucose concentration for 5 % v/v, 10 % v/v
and 15 % v/v of inoculum concentration versus time in RCM medium
Figure 4.3 (shown in blue line) showed the glucose consumption at 5% v/v of
inoculum concentration in RCM was decreased as time of incubation increased.
RCM was an established medium consists of soluble starch and other carbon sources
used for growth of Clostridium acetobutylicum. The percentage of glucose
consumption for 5 % v/v, 10% v/v and 15 % v/v inoculum concentration were
declined as the the fermentation time was increased. Clostridium aacetobutylicum
was utilized the carbon sources in RCM medium and converted it into alcohol
(butanol and ethanol). The percetage of glucose consumption at 5 % v/v inoculum
concentration showed the least percentage which were 26.32 %, 30.53 % and 37.89
% compared to 10 % v/v and 15 % v/v inoculum concentration. The percentage of
glucose consumption were increased for both 10 % v/v and 15 % v/v. The 10 % v/v
inoculum concentration has higher percentage glucose consumption (shown in red
line) than 5 % v/v inoculum concentration, 13.27 %, 22.45 %, 34.69 % and 43.87 %.
Figure 4.1 (shown in green line) illustrated the higher degree of declined for 15 %
v/v inoculum concentration. The percentage of glucose consumption at 15 % v/v
inoculum concentration were 15.79 %, 19.89 %, 38.47 % and 65.79 %.
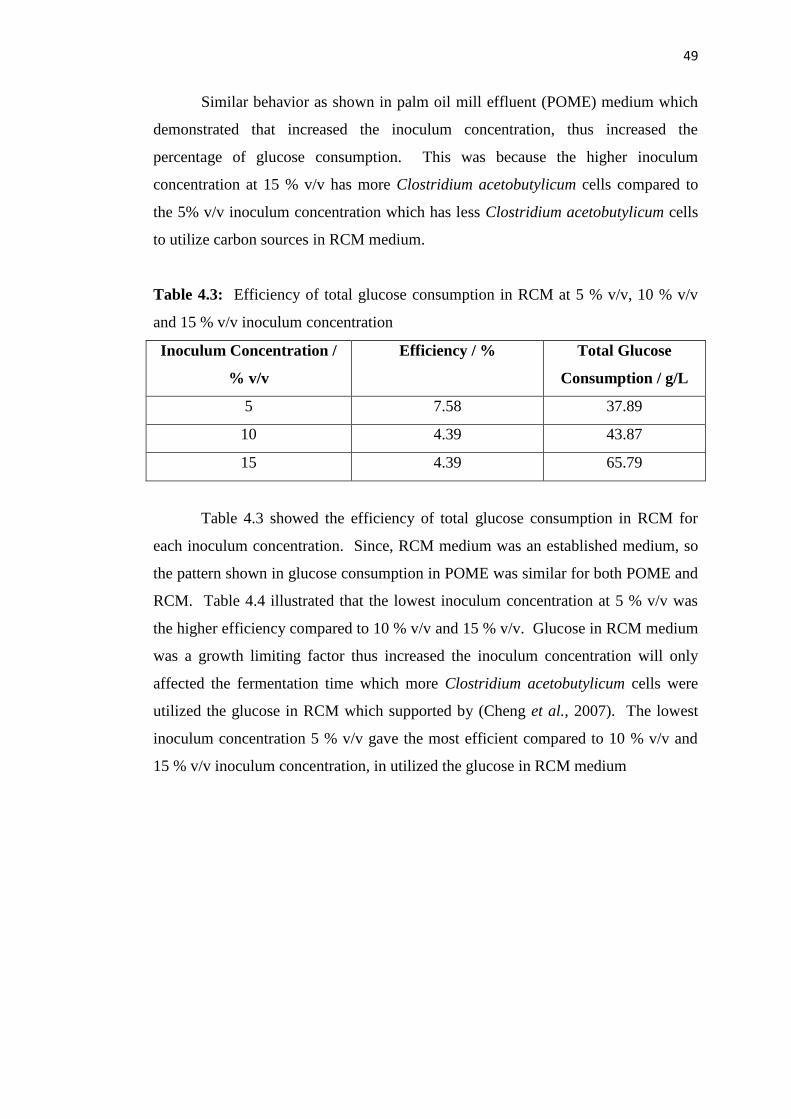
49
Similar behavior as shown in palm oil mill effluent (POME) medium which
demonstrated that increased the inoculum concentration, thus increased the
percentage of glucose consumption. This was because the higher inoculum
concentration at 15 % v/v has more Clostridium acetobutylicum cells compared to
the 5% v/v inoculum concentration which has less Clostridium acetobutylicum cells
to utilize carbon sources in RCM medium.
Table 4.3: Efficiency of total glucose consumption in RCM at 5 % v/v, 10 % v/v
and 15 % v/v inoculum concentration
Inoculum Concentration /
% v/v
Efficiency / % Total Glucose
Consumption / g/L
5 7.58 37.89
10 4.39 43.87
15 4.39 65.79
Table 4.3 showed the efficiency of total glucose consumption in RCM for
each inoculum concentration. Since, RCM medium was an established medium, so
the pattern shown in glucose consumption in POME was similar for both POME and
RCM. Table 4.4 illustrated that the lowest inoculum concentration at 5 % v/v was
the higher efficiency compared to 10 % v/v and 15 % v/v. Glucose in RCM medium
was a growth limiting factor thus increased the inoculum concentration will only
affected the fermentation time which more Clostridium acetobutylicum cells were
utilized the glucose in RCM which supported by (Cheng et al., 2007). The lowest
inoculum concentration 5 % v/v gave the most efficient compared to 10 % v/v and
15 % v/v inoculum concentration, in utilized the glucose in RCM medium
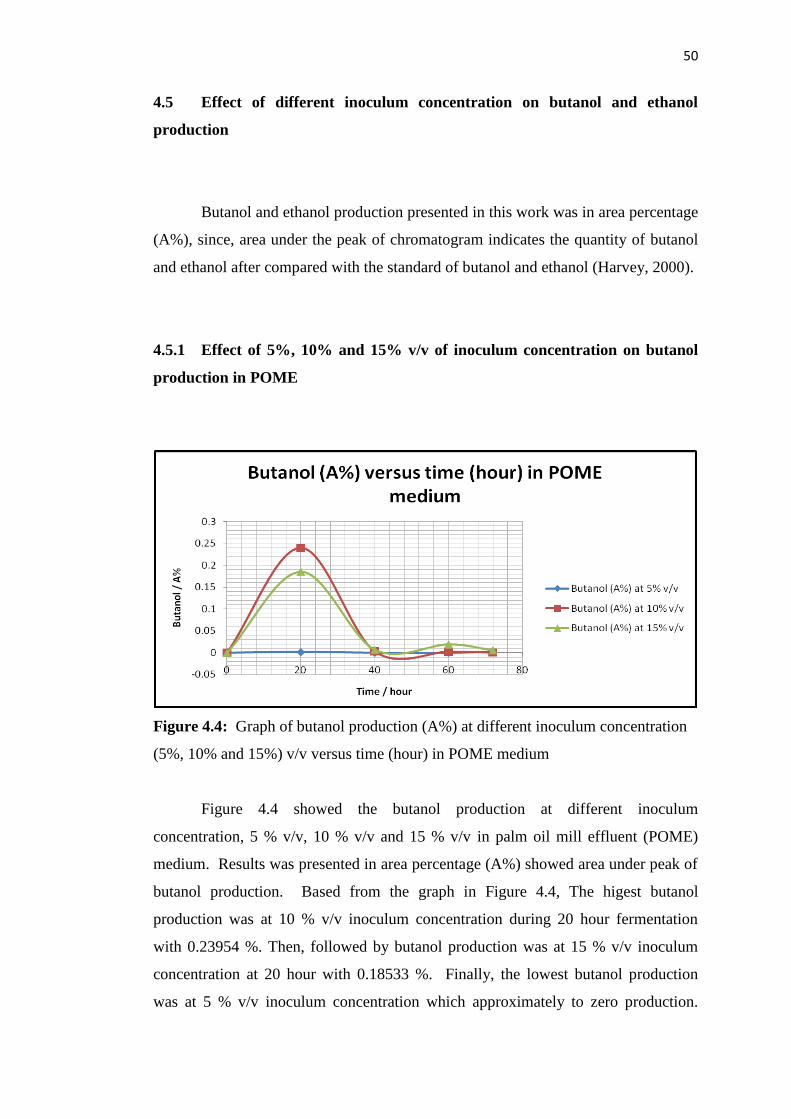
50
4.5 Effect of different inoculum concentration on butanol and ethanol
production
Butanol and ethanol production presented in this work was in area percentage
(A%), since, area under the peak of chromatogram indicates the quantity of butanol
and ethanol after compared with the standard of butanol and ethanol (Harvey, 2000).
4.5.1 Effect of 5%, 10% and 15% v/v of inoculum concentration on butanol
production in POME
Figure 4.4: Graph of butanol production (A%) at different inoculum concentration
(5%, 10% and 15%) v/v versus time (hour) in POME medium
Figure 4.4 showed the butanol production at different inoculum
concentration, 5 % v/v, 10 % v/v and 15 % v/v in palm oil mill effluent (POME)
medium. Results was presented in area percentage (A%) showed area under peak of
butanol production. Based from the graph in Figure 4.4, The higest butanol
production was at 10 % v/v inoculum concentration during 20 hour fermentation
with 0.23954 %. Then, followed by butanol production was at 15 % v/v inoculum
concentration at 20 hour with 0.18533 %. Finally, the lowest butanol production
was at 5 % v/v inoculum concentration which approximately to zero production.
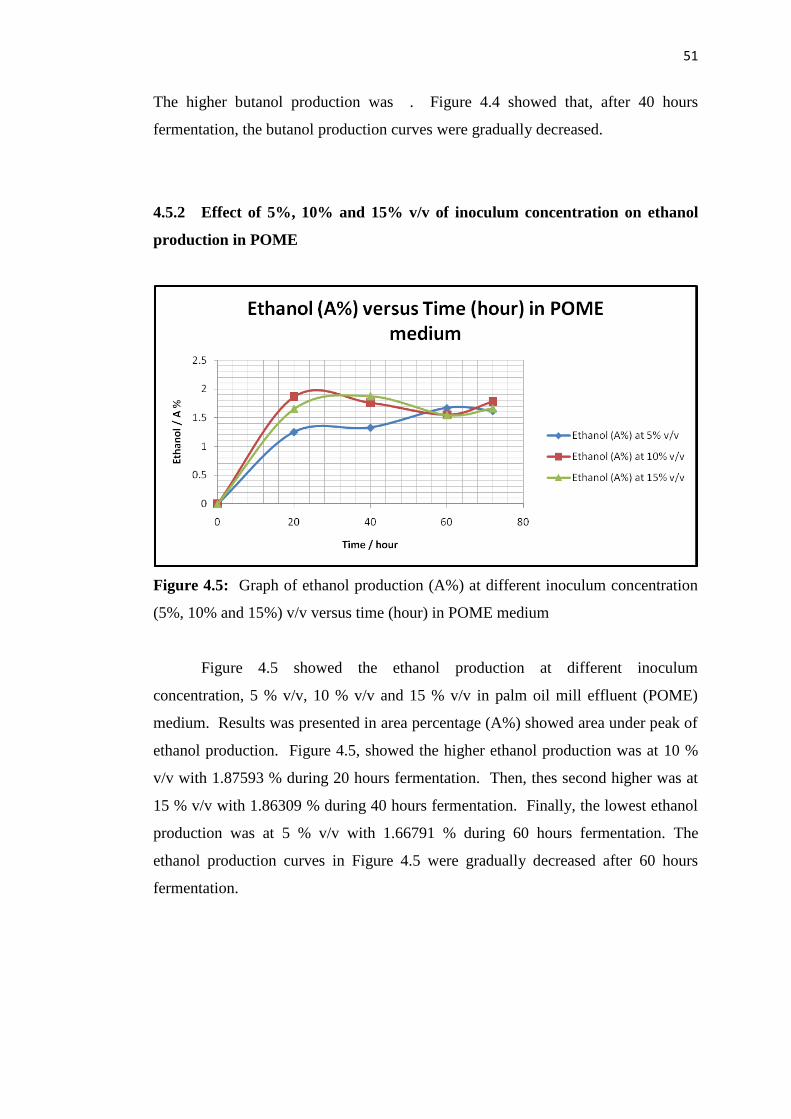
51
The higher butanol production was . Figure 4.4 showed that, after 40 hours
fermentation, the butanol production curves were gradually decreased.
4.5.2 Effect of 5%, 10% and 15% v/v of inoculum concentration on ethanol
production in POME
Figure 4.5: Graph of ethanol production (A%) at different inoculum concentration
(5%, 10% and 15%) v/v versus time (hour) in POME medium
Figure 4.5 showed the ethanol production at different inoculum
concentration, 5 % v/v, 10 % v/v and 15 % v/v in palm oil mill effluent (POME)
medium. Results was presented in area percentage (A%) showed area under peak of
ethanol production. Figure 4.5, showed the higher ethanol production was at 10 %
v/v with 1.87593 % during 20 hours fermentation. Then, thes second higher was at
15 % v/v with 1.86309 % during 40 hours fermentation. Finally, the lowest ethanol
production was at 5 % v/v with 1.66791 % during 60 hours fermentation. The
ethanol production curves in Figure 4.5 were gradually decreased after 60 hours
fermentation.
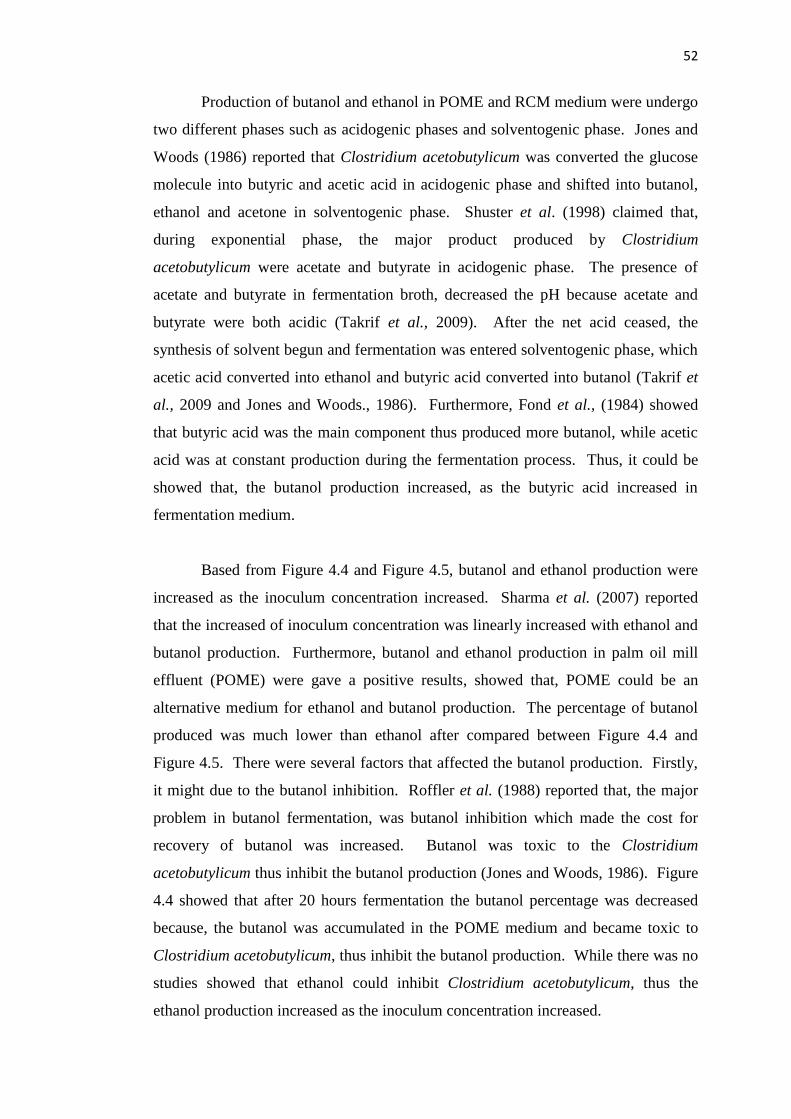
52
Production of butanol and ethanol in POME and RCM medium were undergo
two different phases such as acidogenic phases and solventogenic phase. Jones and
Woods (1986) reported that Clostridium acetobutylicum was converted the glucose
molecule into butyric and acetic acid in acidogenic phase and shifted into butanol,
ethanol and acetone in solventogenic phase. Shuster et al. (1998) claimed that,
during exponential phase, the major product produced by Clostridium
acetobutylicum were acetate and butyrate in acidogenic phase. The presence of
acetate and butyrate in fermentation broth, decreased the pH because acetate and
butyrate were both acidic (Takrif et al., 2009). After the net acid ceased, the
synthesis of solvent begun and fermentation was entered solventogenic phase, which
acetic acid converted into ethanol and butyric acid converted into butanol (Takrif et
al., 2009 and Jones and Woods., 1986). Furthermore, Fond et al., (1984) showed
that butyric acid was the main component thus produced more butanol, while acetic
acid was at constant production during the fermentation process. Thus, it could be
showed that, the butanol production increased, as the butyric acid increased in
fermentation medium.
Based from Figure 4.4 and Figure 4.5, butanol and ethanol production were
increased as the inoculum concentration increased. Sharma et al. (2007) reported
that the increased of inoculum concentration was linearly increased with ethanol and
butanol production. Furthermore, butanol and ethanol production in palm oil mill
effluent (POME) were gave a positive results, showed that, POME could be an
alternative medium for ethanol and butanol production. The percentage of butanol
produced was much lower than ethanol after compared between Figure 4.4 and
Figure 4.5. There were several factors that affected the butanol production. Firstly,
it might due to the butanol inhibition. Roffler et al. (1988) reported that, the major
problem in butanol fermentation, was butanol inhibition which made the cost for
recovery of butanol was increased. Butanol was toxic to the Clostridium
acetobutylicum thus inhibit the butanol production (Jones and Woods, 1986). Figure
4.4 showed that after 20 hours fermentation the butanol percentage was decreased
because, the butanol was accumulated in the POME medium and became toxic to
Clostridium acetobutylicum, thus inhibit the butanol production. While there was no
studies showed that ethanol could inhibit Clostridium acetobutylicum, thus the
ethanol production increased as the inoculum concentration increased.
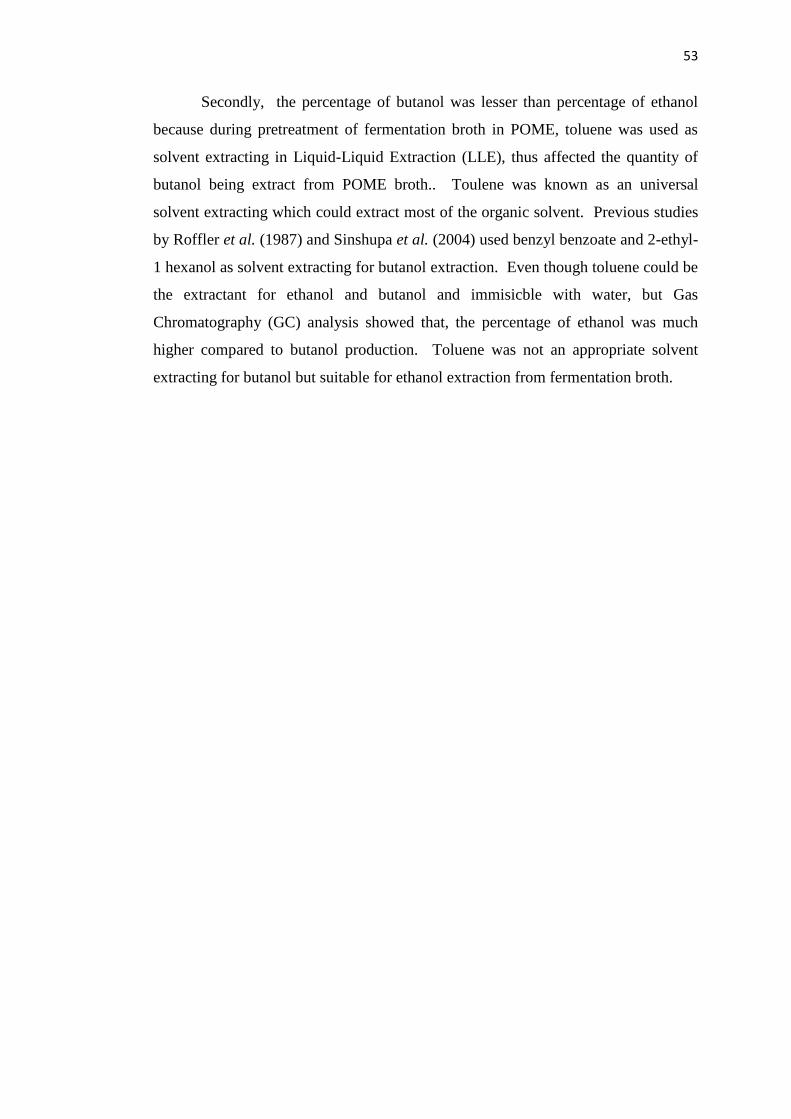
53
Secondly, the percentage of butanol was lesser than percentage of ethanol
because during pretreatment of fermentation broth in POME, toluene was used as
solvent extracting in Liquid-Liquid Extraction (LLE), thus affected the quantity of
butanol being extract from POME broth.. Toulene was known as an universal
solvent extracting which could extract most of the organic solvent. Previous studies
by Roffler et al. (1987) and Sinshupa et al. (2004) used benzyl benzoate and 2-ethyl-
1 hexanol as solvent extracting for butanol extraction. Even though toluene could be
the extractant for ethanol and butanol and immisicble with water, but Gas
Chromatography (GC) analysis showed that, the percentage of ethanol was much
higher compared to butanol production. Toluene was not an appropriate solvent
extracting for butanol but suitable for ethanol extraction from fermentation broth.
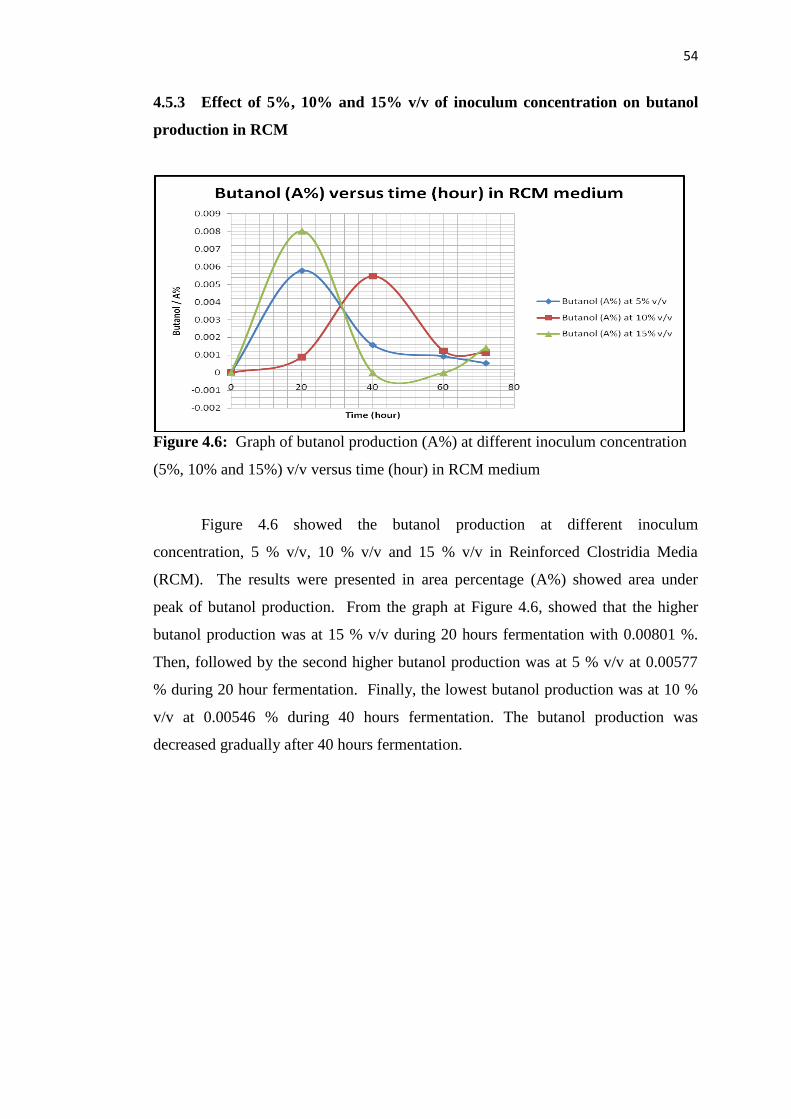
54
4.5.3 Effect of 5%, 10% and 15% v/v of inoculum concentration on butanol
production in RCM
Figure 4.6: Graph of butanol production (A%) at different inoculum concentration
(5%, 10% and 15%) v/v versus time (hour) in RCM medium
Figure 4.6 showed the butanol production at different inoculum
concentration, 5 % v/v, 10 % v/v and 15 % v/v in Reinforced Clostridia Media
(RCM). The results were presented in area percentage (A%) showed area under
peak of butanol production. From the graph at Figure 4.6, showed that the higher
butanol production was at 15 % v/v during 20 hours fermentation with 0.00801 %.
Then, followed by the second higher butanol production was at 5 % v/v at 0.00577
% during 20 hour fermentation. Finally, the lowest butanol production was at 10 %
v/v at 0.00546 % during 40 hours fermentation. The butanol production was
decreased gradually after 40 hours fermentation.
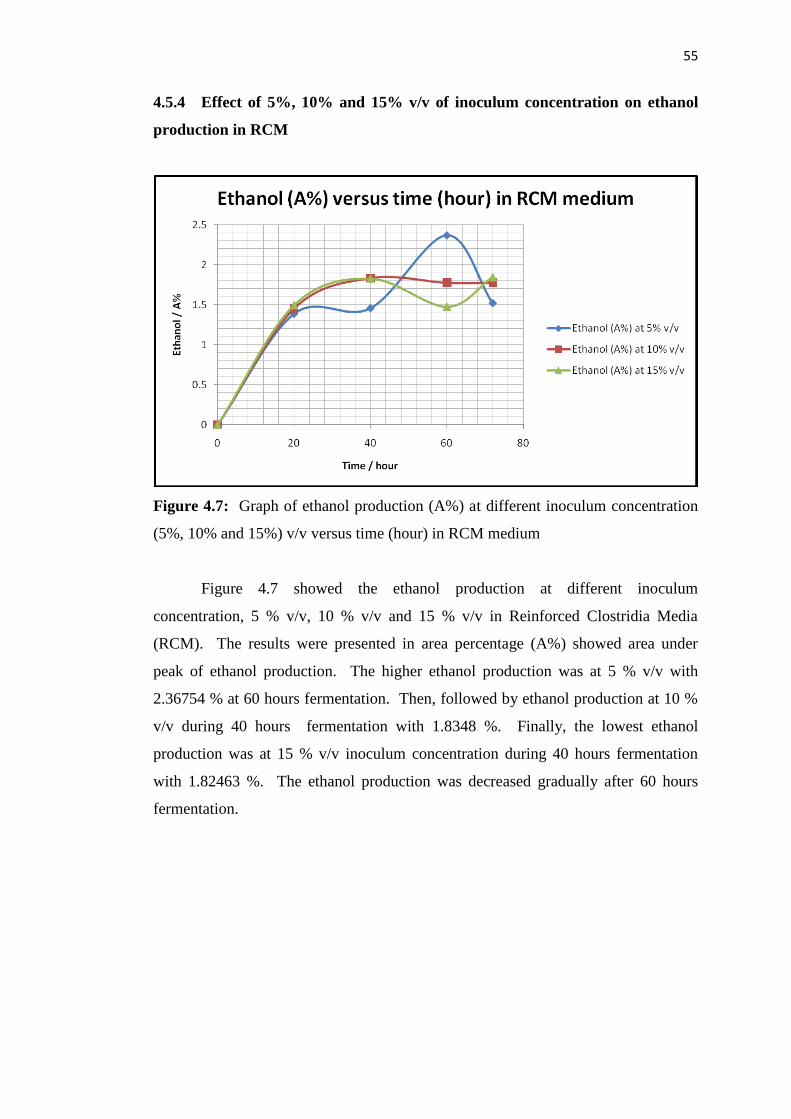
55
4.5.4 Effect of 5%, 10% and 15% v/v of inoculum concentration on ethanol
production in RCM
Figure 4.7: Graph of ethanol production (A%) at different inoculum concentration
(5%, 10% and 15%) v/v versus time (hour) in RCM medium
Figure 4.7 showed the ethanol production at different inoculum
concentration, 5 % v/v, 10 % v/v and 15 % v/v in Reinforced Clostridia Media
(RCM). The results were presented in area percentage (A%) showed area under
peak of ethanol production. The higher ethanol production was at 5 % v/v with
2.36754 % at 60 hours fermentation. Then, followed by ethanol production at 10 %
v/v during 40 hours fermentation with 1.8348 %. Finally, the lowest ethanol
production was at 15 % v/v inoculum concentration during 40 hours fermentation
with 1.82463 %. The ethanol production was decreased gradually after 60 hours
fermentation.
56
Reinforced Clostridia Media (RCM) was an established medium for
Clostridium acetobutylicum to grow and produced butanol and ethanol during
microbila fermentation. Figure 4.6 showed butanol production increased as the
inoculum concentration increased and supported by Sharma et al. (2007) showed
that butanol and ethanol production were linearly increased with increased of
inoculum concentration. 15 % v/v inoculum concentration consists higher
Clostridium acetobutylicum cells compared to 5 % v/v inoculum concentration
which has less Clostridium acetobutylicum cells, which utilized the carbon sources
in RCM and POME medium. Figure 4.7 of ethanol production does not supported
the finding by Sharma et al (2007) because, the the ethanol production was
decreased as the inoculum concentration increased . This was a new finding which
showed that, ethanol production was optimal at 5 % v/v inoculum concentration,
further increased the inoculum concentration will decreased the ethanol production.
Takriff et al. (2009) claimed that POME is rich with natural carbon source
and dissolve complex substance requires mixing to enhance substrate interface with
the microorganisms to produce high yield. In the absence of mixing, the various
components of POME which made-up the substrate for fermentation will sediment to
the bottom of the fermenter thus lowering the microorganisms-substrate interface
(Takriff et al., 2009). In addition the decline of ABE fermentation might be due to
the deficiency of sugar when needed (Qureshi and Blaschek., 2000).
CHAPTER 5
CONCLUSION AND RECOMMENDATION
5.1 Conclusion
Biobutanol and bioethanol were successfully produced from Reinforced
Clostridia Media (RCM) as an established clostridia media and an alternative media
was palm oil mill effluent (POME). Butanol and ethanol fermentation was anaerobic
fermentation which Clostridium acetobutylicum was obligate anaerobic condition to
utilize the carbon sources in POME and RCM. POME analysis was done by
employed HPLC analysis and result showed that POME consist four types of
reducing sugars which were galactose, glucose, arabinose and xylose. This showed
that POME could be used as substrate that was required for supported clostridia
growth. In addition the maximum butanol production for both POME and RCM
medium were 0.18533% at 15% v/v (POME) and 0.00801% at 5% v/v (RCM) and.
Result showed that increasing the inoculum concentration would reduce the
fermentation time, increased the total glucose consumption and increased the butanol
production. While the maximum production of ethanol in both POME and RCM
media were, 1.87593% at 15% v/v during 40 hours of fermentation time (POME)
and 2.36754% at 5% v/v during 60 hours (RCM) . Result showed that ethanol
required more fermentation time to produce at higher amount of ethanol and
inoculum concentration does affect the production.

58
Although, the concentration of butanol and ethanol produced from both POME and
RCM medium was quite low, but still an interesting process since the process only
less chemicals required and uses biomass as raw material. Evaluation on economic
potential would be carried out for further studies.
59
5.2 Recommendation
Throughout this research there are several recommendation regarding to
improve the production of butanol and analysis of palm oil mill effluent (POME)
using High Performance Liquid Chromatography (HPLC).
Based from result obtained in this research shows that, the production of
butanol and ethanol were oscillated for both POME and RCM medium and this is
might due to the Liquid-Liquid Extraction Method (LLE). The selection of solvent
extracting was not suitable for butanol, thus it is recommended that, the solvent
extracting suitable for extracting butanol are, (Sinshupa et al., 2005) or benzyl
benzoate (Roffler et al., 1988). In addition, before implementing LLE, it was
suggested by (Sinshupa et al., 2005) to undergo a mass transfer between the solvent
extracting and the fermentation broth for 3 hours before do the LLE method.
Moreover, the resolution peak on butanol chromatogram showed less
efficient compared to ethanol production. This is might be the selection of column
for butanol separation. Different column will give different performance, thus Liew
et al., 2006) suggested to implement BP column for GC analysis on butanol because
it gave good separation in butanol analysis.
REFERENCES
Butanol fuel. (2010, March 23). Retrieved April 29, 2010, from Wikipedia:
http://en.wikipedia.org/wiki/Butanol_fuel
Castano, D. M. (2003). Anaerobic, solvent-producing bacteria: Molecular
characterization, polysaccharolytic activity and agroindustrial waste
degeneration. Thesis , 29.
Chuichulcherm, S., & Chutmanop, J. (n.d.) (2000). Butanol separation from ABE
model fermentation broth by liquid-liquid extraction.
Cheng, C.K., Hani, H. Hani., & Ku Ismail, K. S. (2007). Production of Boethanol
from Palm Empty Fruit Bunch. ICoSM.
Clostridium acetobutylicum. (2007, July 13). Retrieved April 28, 2010, from
Wikipedia http://microbewiki.kenyon.edu/index.php/
Clostridium_acetobutylicum
Cowan, M. K., & Talaro, K. P. (2006). Microbiology A System Approach. New
York: McGraw-Hill.
Ethanol Fuel. (2010, April 28). Retrieved April 29, 2010, from Wikipedia, the free
encyclopedia: http://en.wikipedia.org/wiki/Ethanol_fuel
61
Ezeji, T., Qureshi,N. & Blaschek, H.P. (2005). Continuous butanol fermentation and
feed starch retrogradation: butanol fermentation sustainability using
Clostridium beijerinckii BA101. Journal Of Biotechnology , 179 - 187.
Harvey, D. (2000). Modern Analytical Chemistry. Singapore: McGraw Hill
International Edition.
Hassan, M. A., & Puteh, M. H. (2007). Pretreatment of Palm Oil Mill Effluent
(POME):A Comparison Study using Chitosan and Alum. Malaysian Journal
of Civil Engineering , 19(2) : 128 - 141.
Jailani, M.A. & Mohd Jaafar, M.N (1999). Emisi ekxos Dari Kenderaan Brmotor,
Kesannya Ke Atas Atmosfera dan Kaedah Pengurangannya : Satu Kajian.
Jurnal Mekanikal, Jilid III
Jones, D. T., & Woods, D. R. (1986). Acetone-Butanol Fermentation Revisited.
Microbilogical Reviews , 484 - 524.
Kalil, M. S., Kit, P. W., Wan Yusoff, W. M., Sadazo, Y., & Rakmi, A. R. (2003).
Direct Fermentation of Palm Oil Mill Effluent to Acetone-butanol-ethanol by
Solvent Producing Clostridia. Journal of Biological Sciences , 6 (14): 1273-
1275.
Schuster, K.C., Van Den Heuvel., R., Gutierrez, N.A. & Maddox, I.S. (1998).
Development of markers for product formation and cell cycle in batch
cultivation of Clostridium aacetobutylicum ATCC 824. Application
Microbiol Biotechnol , 669 - 676.
62
Kobayashi, G., Eto, K., Tashiro, Y., Okubo, K., Sonomoto, K., & Ishizaki, A.
(2005). Utilization of Excess Sludge by Acetone-Butanol-Ethanol
Fermentation Employing Clostridium saccharpperbutylacetonicum N1-4
(ATCC 13564). Journal of Bioscience and Bioengineering , Vol. 99,
517 - 519.
Lab Technique. (n.d.). Retrieved April 29, 2010, from Organic Courses Home:
http://orgchem.colorado.edu/hndbksupport/drying/drying.html
Liew, S., & Arbakariya, A. R. (2006). Production of Solvent (acetone-butanol-
ethanol) in Continuous Fermentation. Malaysian Journal of Microbiology ,
Vol 2(2) pp.42-50.
Takriff, M.S, Masngut, N., Kadhum, A.A.H., Kalil, M.S. & Mohammad, A.W.
(2009). Solvent fermentation from Palm Oil Mill Effluent using Clostridium
acetobutylicum in Oscillatory Flow Bioreactor. Sains Malaysiana , 38 (2), 1
91-196.
Ngan, M. A., Tanisho, S., Morimoto, M., & Yoshino, S. (2004). Development of the
Conversion Technology of Biomass into Bioenergy.
Fond, O., Petitdemance, E., Pettidemance, H., & Gay, R. (1984). Effect Glucose
Flow On The Acetone Butanol Fermentation in fed batch culture.
Biotecnology Letters,Vol 6 No 1 13 - 18.
Pavia, Lampman & Kriz (1999). Introduction to Organic Laboratory Techniques,
3rd edition.
Qureshi, N., & Blaschek, H. P. (2000). Economics of Butanol Fermentation Using
Hyper-Butanol Producing Clostridium beijerinckii BA101. Trans ICheme ,
Vol. 78.
63
Reinforced Clostridia Media 1774. (2009). Retrieved April 28, 2010, from
acumedia, A Subsidiary of Neogen Corporation:
http://www.neogen.com/acumedia/pdf/ProdInfo/7714_PI.pdf
Reinfroced Clostridial Medium. (n.d.). Retrieved April 28, 2010, from Section III:
http://www.bd.com/ds/technicalCenter/inserts/Reinforced_Clostridial_
Medium.pdf
Rha, C., Sambandan, T., Rulfs, J., & Kissinger, M. (2002), Detection of
Monosaccharide in palm oil mill effluent (POME) essence usinh HPLC,
Thesis.
Sharma, N., Kaira, K., Oberoi, H. S., & Bansal, S. (2007). Optimization of
fermentation parameters for production of ethanol from kinnow waste and
banana peels by simultaneous saccharification and fermentation. Indian J.
Microbiol , 47:310 - 316.
Shakhashiri, P. (2009,). Ethanol. Retrieved April 29, 2010, from Chemical of the
Weekhttp://scifun.chem.wisc.edu/chemweek/pdf/ethanol.pdf
Skoog, Fundamentals of Analytical Chemistry, 8th Edition, Chapters 31 (GC) and 8
Section C (standardization methods).
Roffler, S.R., Blanch, H.W. and Wike, C.R. (1988). In Situ Extractive Fermentation
of Acetone and Butanol. Biotechnology and Bioengineering , Vol. 31,135 -
143.
Stormes, M. N. (n.d.). Solubility and Drying Agents. Retrieved April 29, 2010, from
Study Aids. http://www.brymawr.edu/Acads/Chem/mnerzsto/drying-
agents_1999.htm
Sulaiman, N. M., & Ling, C. K. (n.d.) (2001). Membrane ultrafiltration of treated
Palm Oil Mill Effluent (POME).
64
Tsuey, L. S., Ariff, A., Mohamad, R., & Abdul Rahim, R. (2006). Improvements of
GC and HPLC analyses in Solvent (Acetone-Butanol-Ethanol) Fermentation
by Clostridium saccharobutylicum Using a Mixture of Starch and Glycerol
as Carbon Source. Biotechnology and Bioprocess Engineering , 11:293 -
298.
Wah, W. P., & Sulaiman, N. M. (2002). Pre-treatment and membrane ultrafiltration
using treated palm oil mill effluent (POME). Journal Science Technology ,
891 - 898.
Wu, T., Mohammad, A.W., Jahim, Md.J., & Anuar, N.. (2007). Palm oil mill effluet
(POME) treatment and bioresources recovery using ultrafiltration
membrane: Effect of pressure on membrane fouling. Biochemical
Engineering Journal , 309-317.
APPENDIX A
CALCULATION
A1. Calculation on preparing of 2/3 of fermentation medium
Fermentation medium was prepared in 500 mL of Schott bottle. Thus total
volume was 500 mL while the working volume was calculated as below:
2/3 x Total Volume = 2/3 x 500 mL = 333.33 mL, approximately took 300 mL
Similar to liquid medium was prepared in 250 mL of Schott bottle. The
working volume was calculated as below:
2/3 x Total Volume = 2/3 x 250 mL = 166.66 mL, approximately took 167 mL
66
A2. Calculation on preparing the inoculums concentration
Inoculum concentration was calculated based on volume per volume (v/v).
The further detailed on calculating inoculums concentration shown as below:
5% v/v inoculum concentration
5/100 x working volume of fermenter = 5/100 x 300 mL = 15 mL of
inoculum needed to be seeded into production medium
10% v/v inoculum concentration
10/100 x working volume of fermenter = 10/100 x 300 mL = 30 mL of
inoculum needed to be seeded into production medium
15% v/v inoculum concentration
15/100 x working volume of fermenter = 15/100 x 300 mL = 45 mL of
inoculums needed to be seeded into production medium
67
A3. Calculation on preparing dilution factor (DF) on POME
Since POME was very concentrated with other particles thus POME needed
to be diluted with distilled water to obtain required glucose concentration. Formula
that to be used was M1V1 = M2V2;
M1 = Initial concentration
V1 = Volume initial
M2 = Concentration that will needed
V2 = Final volume
Dilution was conducted in 1/10 , thus 1 mL sample top up with 9 mL of distilled
water. Thus, the final volume was 10 mL. To calculate the Dilution Factor (DF)
which used to get actual glucose concentration was calculated as formula below;
Dilution Factor (DF) = final volume / aliquot volume
DF = 10 mL / 1mL of sample = 10
Thus, DF is 10
68
A4. Calculation on preparing sample for GC analysis
Butanol and ethanol analysis has to be undergoes GC preparation sample
similar for both sample and standards. The preparation needed to be done at 1%, 2%
and so on samples. Calculation will be demonstrated on 1% and 2% sample where
the hexane volume needed to be diluted with sample was differ for each sample
preparation;
1% sample preparation
10 µL of sample + 990 µL of hexane or organic solvent used for GC analysis
2% sample preparation
20 µL of sample + 980 µL of hexane or organic solvent used for GC analysis
A5. Calculation on percentage of total glucose consumption
For example in 5% v/v inoculums concentration the percentage of glucose
consumption was;
Initial glucose concentration in RCM medium was 0.95 g/L. Thus, the 20 hour
glucose consumption was 0.84 g/L;
% of glucose concentration = {(0.95 – 0.84) g/L / 0.95 g/L} x 100 = 11.58%
A6. Calculation on efficiency of total glucose consumption
5% v/v will consumed 37.89%, thus 1% v/v will gave 7.578% of
efficiency on total glucose consumption
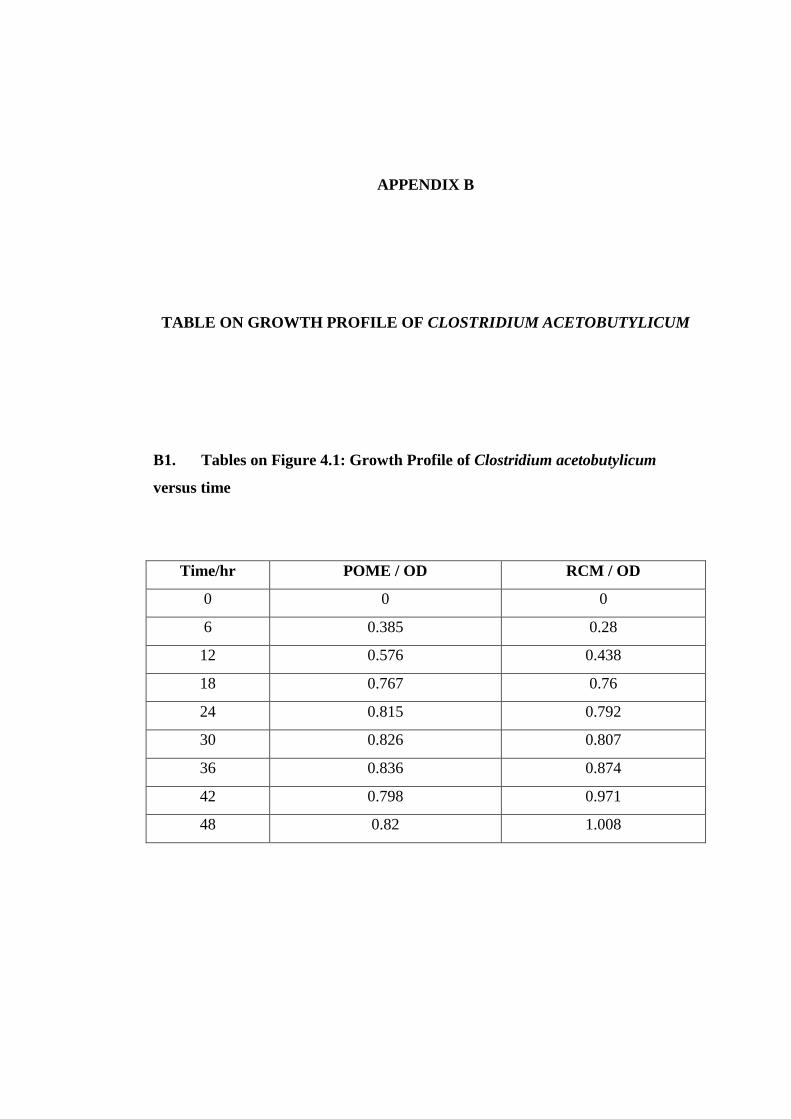
APPENDIX B
TABLE ON GROWTH PROFILE OF CLOSTRIDIUM ACETOBUTYLICUM
B1. Tables on Figure 4.1: Growth Profile of Clostridium acetobutylicum
versus time
Time/hr POME / OD RCM / OD
0 0 0
6 0.385 0.28
12 0.576 0.438
18 0.767 0.76
24 0.815 0.792
30 0.826 0.807
36 0.836 0.874
42 0.798 0.971
48 0.82 1.008
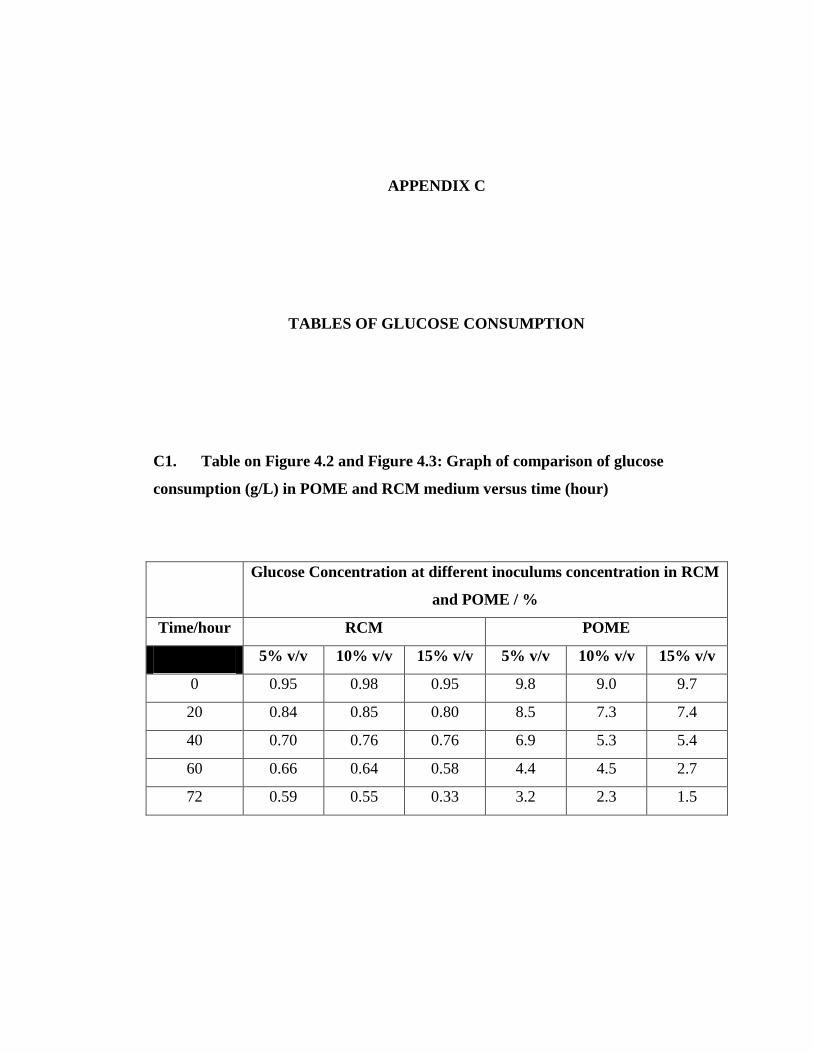
APPENDIX C
TABLES OF GLUCOSE CONSUMPTION
C1. Table on Figure 4.2 and Figure 4.3: Graph of comparison of glucose
consumption (g/L) in POME and RCM medium versus time (hour)
Glucose Concentration at different inoculums concentration in RCM
and POME / %
Time/hour RCM POME
5% v/v 10% v/v 15% v/v 5% v/v 10% v/v 15% v/v
0 0.95 0.98 0.95 9.8 9.0 9.7
20 0.84 0.85 0.80 8.5 7.3 7.4
40 0.70 0.76 0.76 6.9 5.3 5.4
60 0.66 0.64 0.58 4.4 4.5 2.7
72 0.59 0.55 0.33 3.2 2.3 1.5
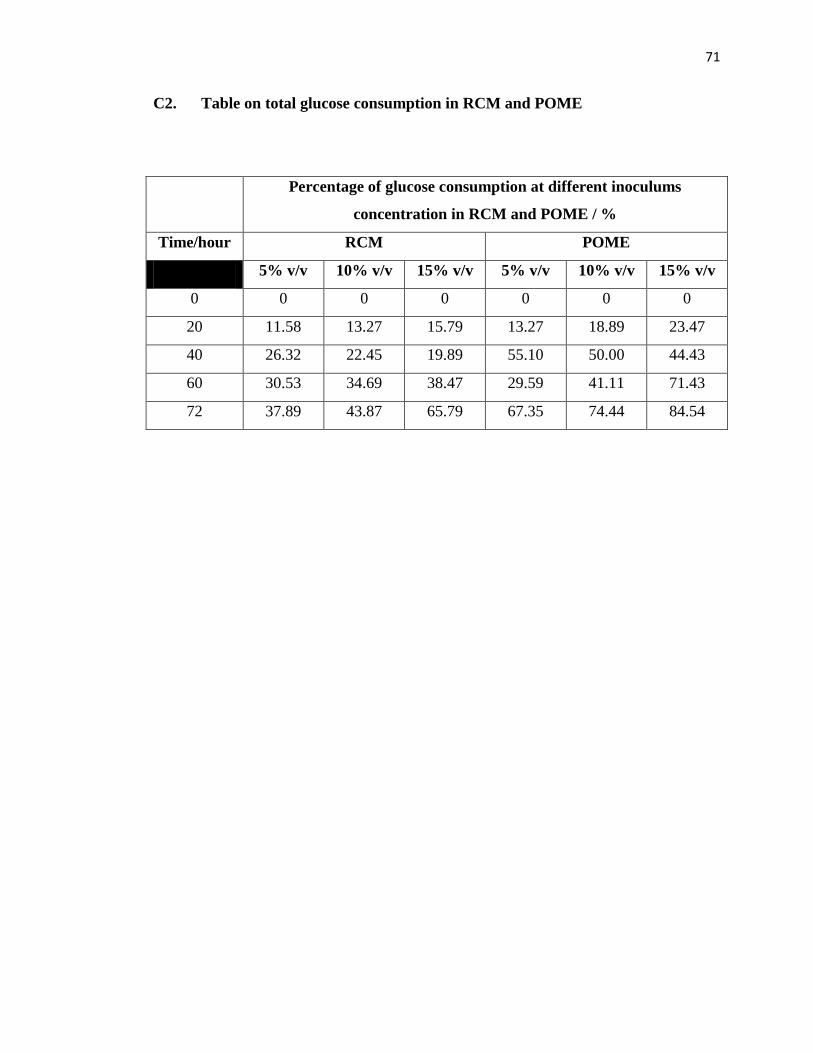
71
C2. Table on total glucose consumption in RCM and POME
Percentage of glucose consumption at different inoculums
concentration in RCM and POME / %
Time/hour RCM POME
5% v/v 10% v/v 15% v/v 5% v/v 10% v/v 15% v/v
0 0 0 0 0 0 0
20 11.58 13.27 15.79 13.27 18.89 23.47
40 26.32 22.45 19.89 55.10 50.00 44.43
60 30.53 34.69 38.47 29.59 41.11 71.43
72 37.89 43.87 65.79 67.35 74.44 84.54
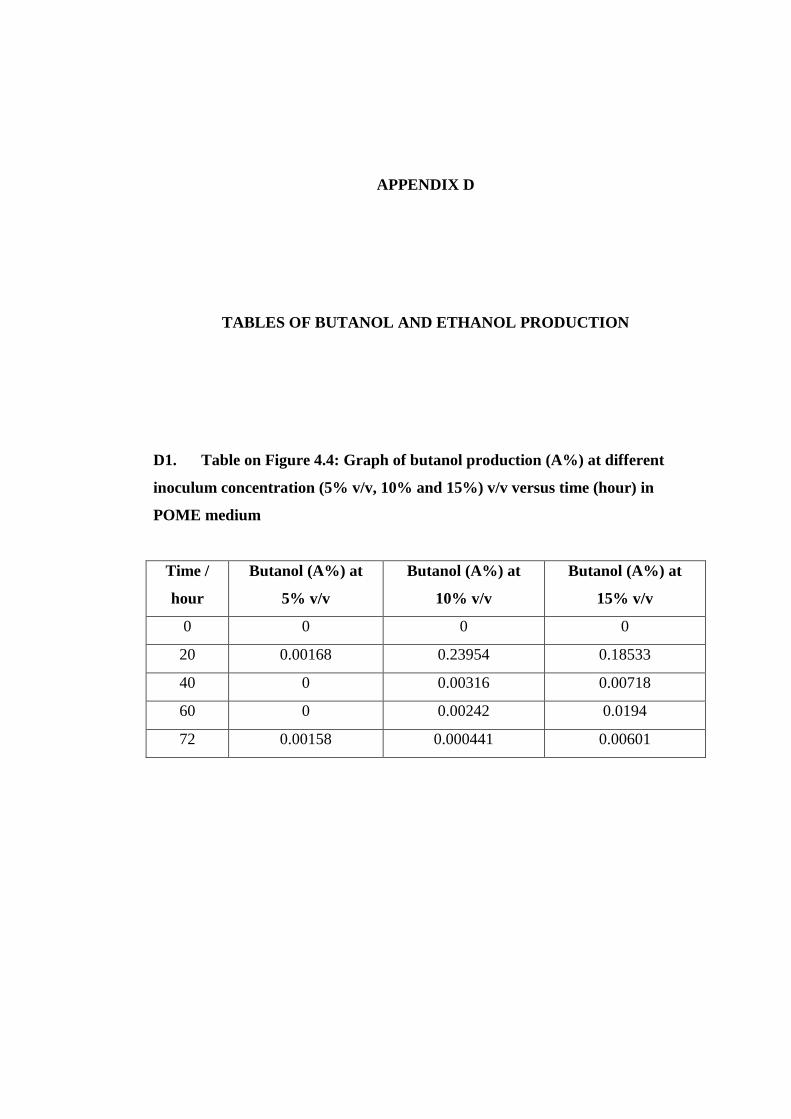
APPENDIX D
TABLES OF BUTANOL AND ETHANOL PRODUCTION
D1. Table on Figure 4.4: Graph of butanol production (A%) at different
inoculum concentration (5% v/v, 10% and 15%) v/v versus time (hour) in
POME medium
Time /
hour
Butanol (A%) at
5% v/v
Butanol (A%) at
10% v/v
Butanol (A%) at
15% v/v
0 0 0 0
20 0.00168 0.23954 0.18533
40 0 0.00316 0.00718
60 0 0.00242 0.0194
72 0.00158 0.000441 0.00601
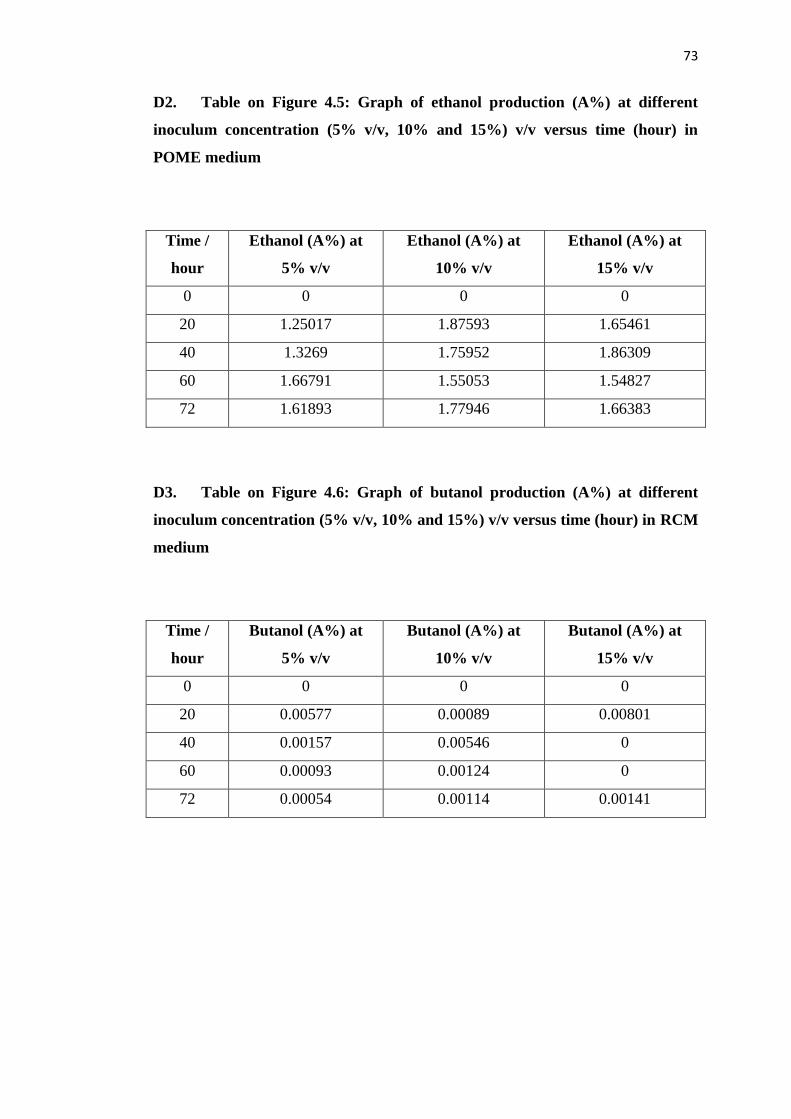
73
D2. Table on Figure 4.5: Graph of ethanol production (A%) at different
inoculum concentration (5% v/v, 10% and 15%) v/v versus time (hour) in
POME medium
Time /
hour
Ethanol (A%) at
5% v/v
Ethanol (A%) at
10% v/v
Ethanol (A%) at
15% v/v
0 0 0 0
20 1.25017 1.87593 1.65461
40 1.3269 1.75952 1.86309
60 1.66791 1.55053 1.54827
72 1.61893 1.77946 1.66383
D3. Table on Figure 4.6: Graph of butanol production (A%) at different
inoculum concentration (5% v/v, 10% and 15%) v/v versus time (hour) in RCM
medium
Time /
hour
Butanol (A%) at
5% v/v
Butanol (A%) at
10% v/v
Butanol (A%) at
15% v/v
0 0 0 0
20 0.00577 0.00089 0.00801
40 0.00157 0.00546 0
60 0.00093 0.00124 0
72 0.00054 0.00114 0.00141
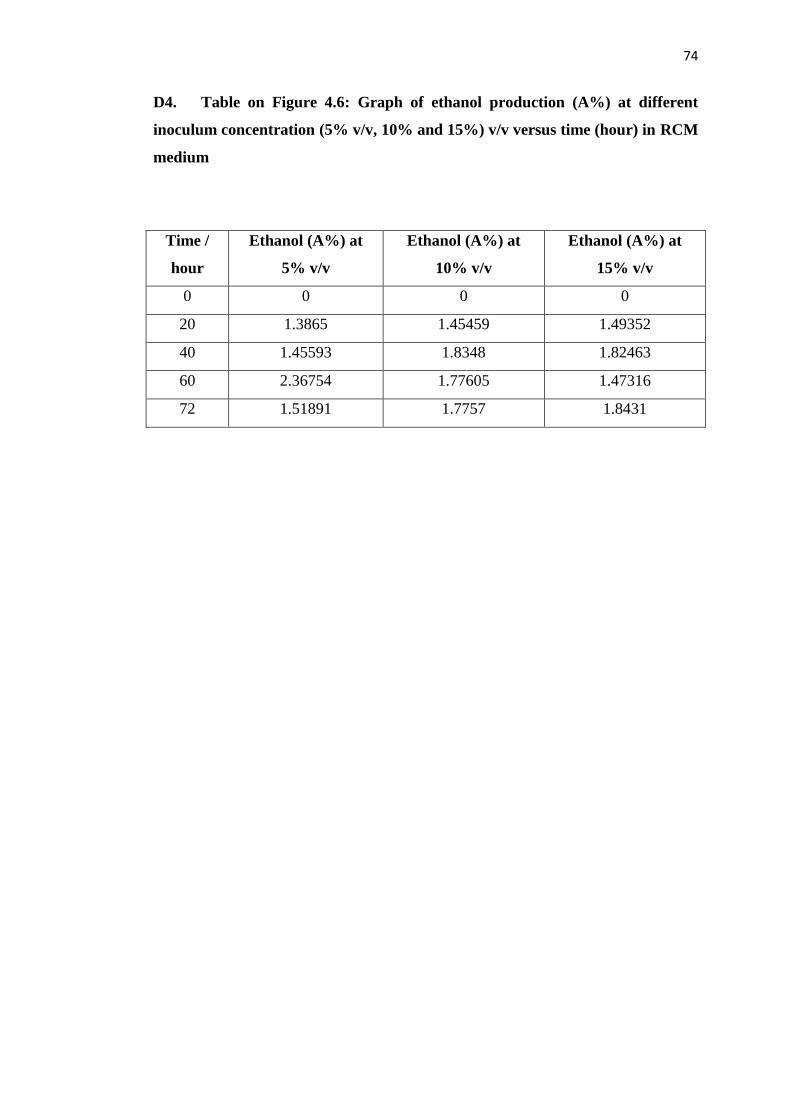
74
D4. Table on Figure 4.6: Graph of ethanol production (A%) at different
inoculum concentration (5% v/v, 10% and 15%) v/v versus time (hour) in RCM
medium
Time /
hour
Ethanol (A%) at
5% v/v
Ethanol (A%) at
10% v/v
Ethanol (A%) at
15% v/v
0 0 0 0
20 1.3865 1.45459 1.49352
40 1.45593 1.8348 1.82463
60 2.36754 1.77605 1.47316
72 1.51891 1.7757 1.8431
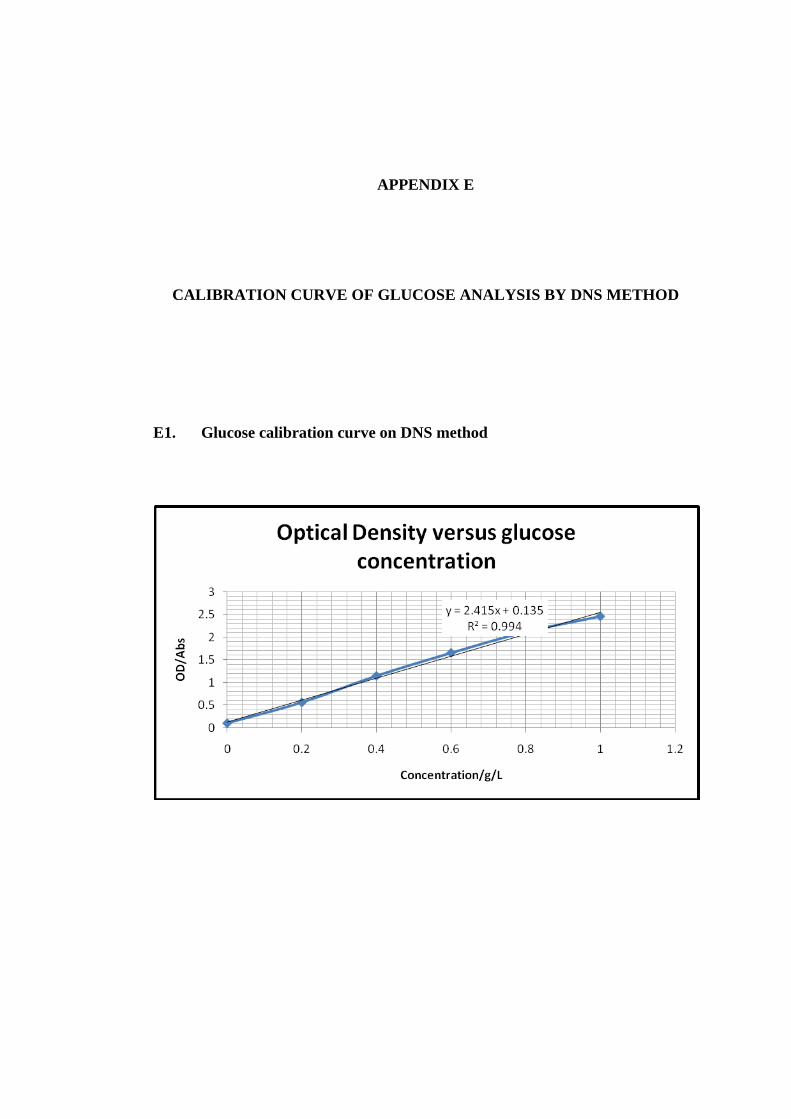
APPENDIX E
CALIBRATION CURVE OF GLUCOSE ANALYSIS BY DNS METHOD
E1. Glucose calibration curve on DNS method
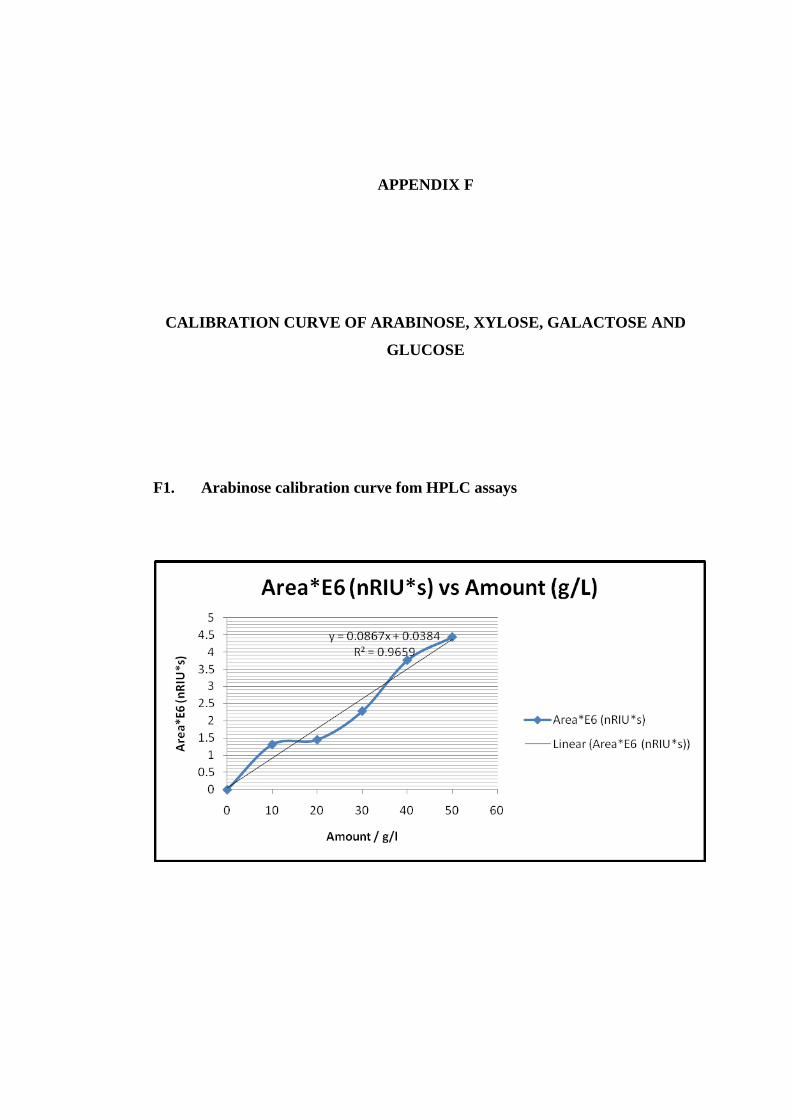
APPENDIX F
CALIBRATION CURVE OF ARABINOSE, XYLOSE, GALACTOSE AND
GLUCOSE
F1. Arabinose calibration curve fom HPLC assays
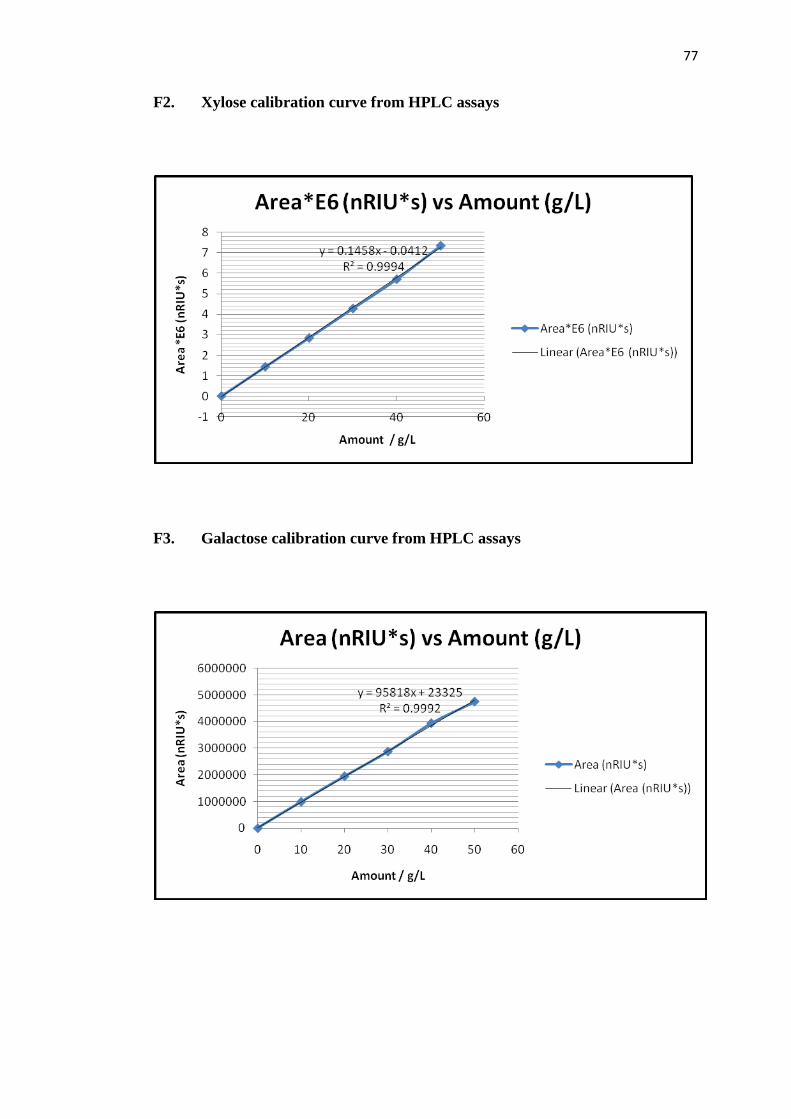
77
F2. Xylose calibration curve from HPLC assays
F3. Galactose calibration curve from HPLC assays
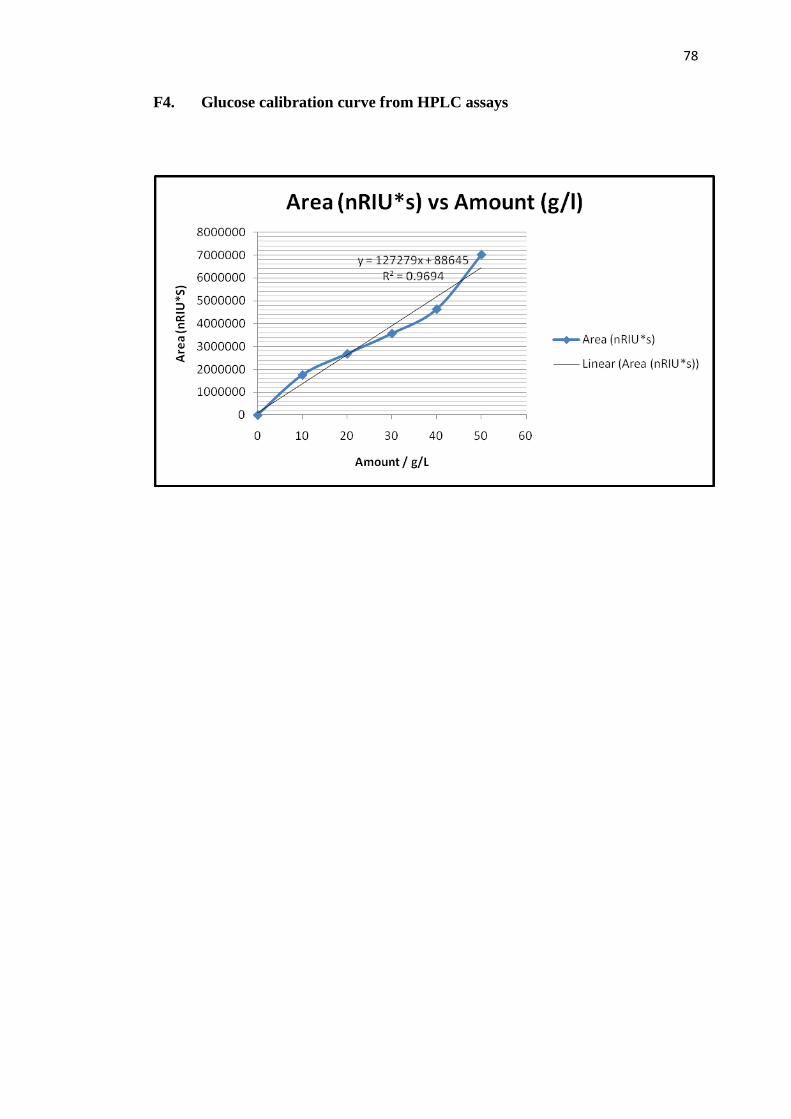
78
F4. Glucose calibration curve from HPLC assays
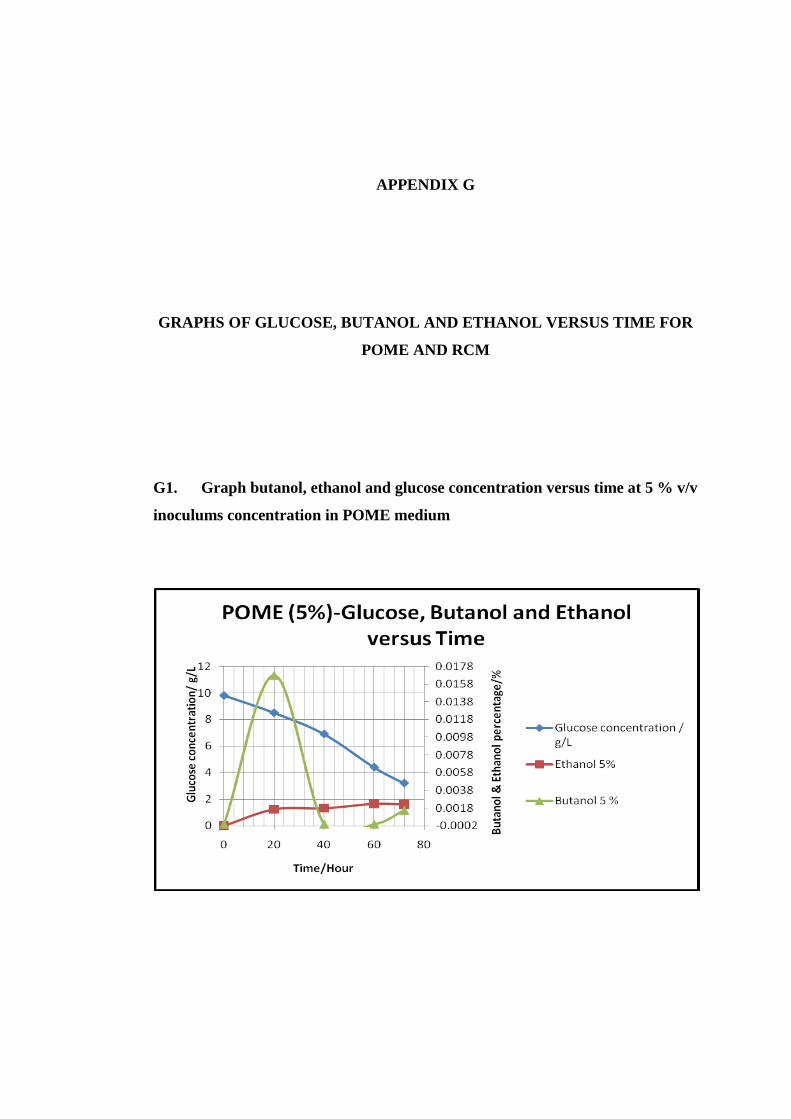
APPENDIX G
GRAPHS OF GLUCOSE, BUTANOL AND ETHANOL VERSUS TIME FOR
POME AND RCM
G1. Graph butanol, ethanol and glucose concentration versus time at 5 % v/v
inoculums concentration in POME medium
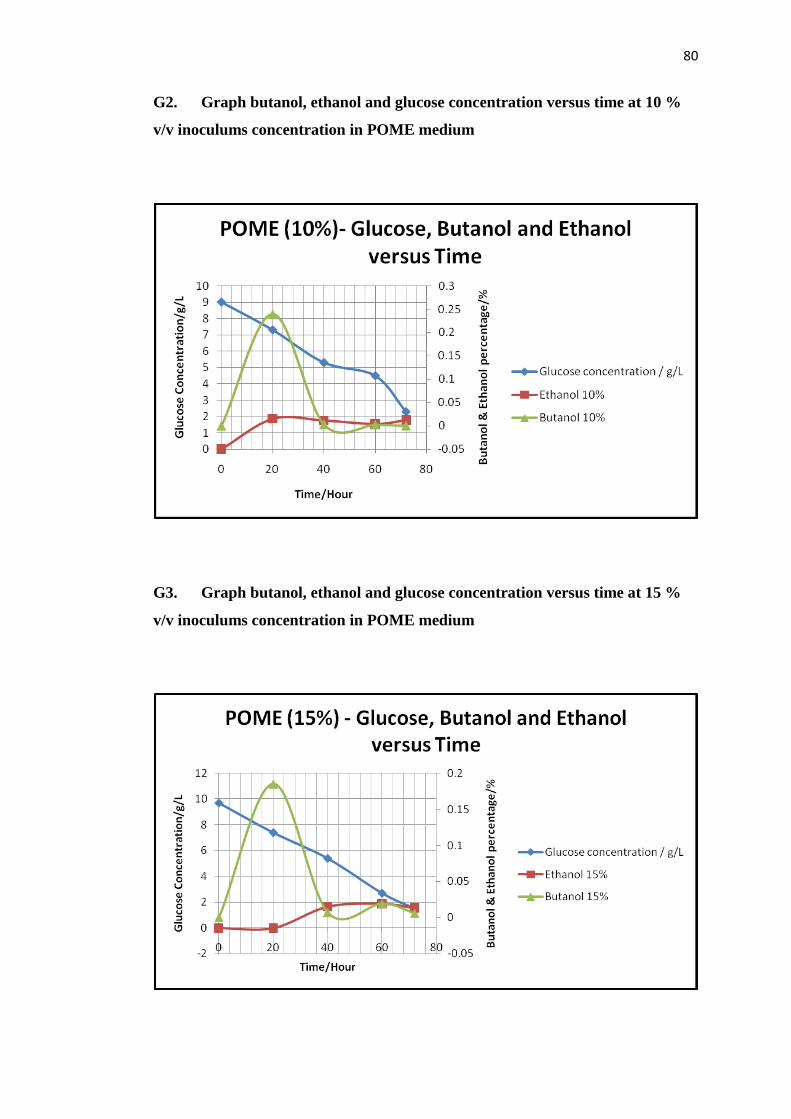
80
G2. Graph butanol, ethanol and glucose concentration versus time at 10 %
v/v inoculums concentration in POME medium
G3. Graph butanol, ethanol and glucose concentration versus time at 15 %
v/v inoculums concentration in POME medium
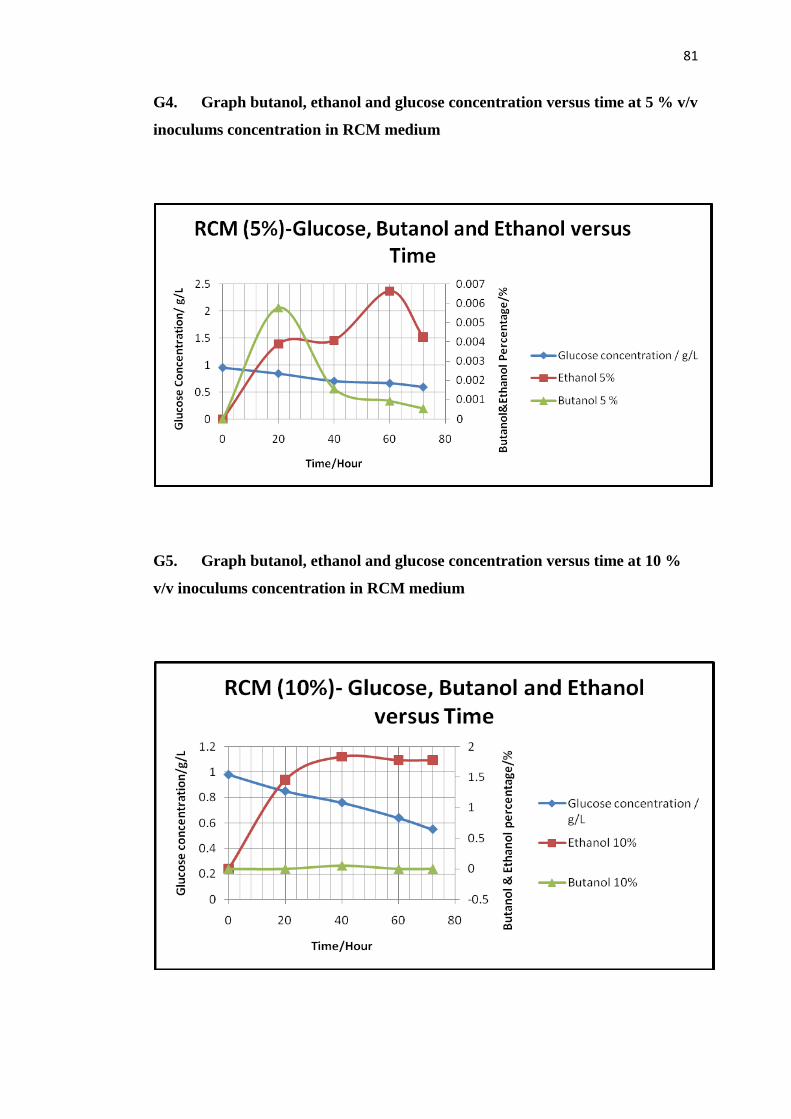
81
G4. Graph butanol, ethanol and glucose concentration versus time at 5 % v/v
inoculums concentration in RCM medium
G5. Graph butanol, ethanol and glucose concentration versus time at 10 %
v/v inoculums concentration in RCM medium
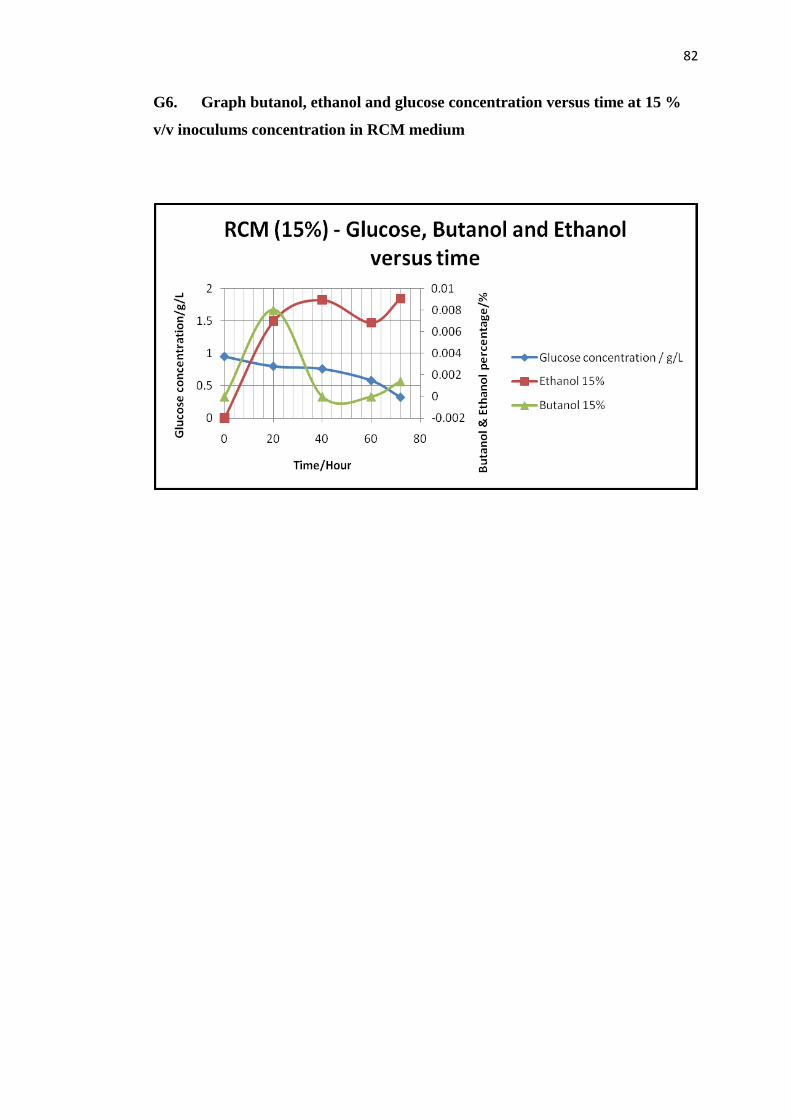
82
G6. Graph butanol, ethanol and glucose concentration versus time at 15 %
v/v inoculums concentration in RCM medium
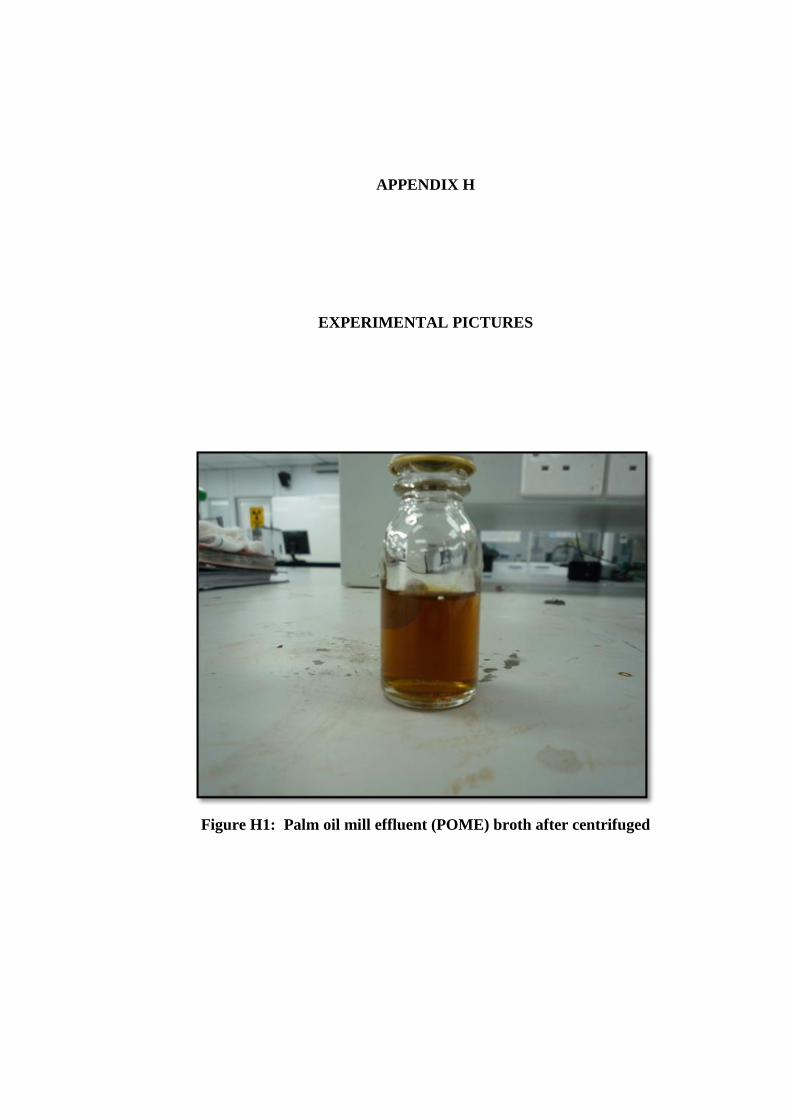
APPENDIX H
EXPERIMENTAL PICTURES
Figure H1: Palm oil mill effluent (POME) broth after centrifuged
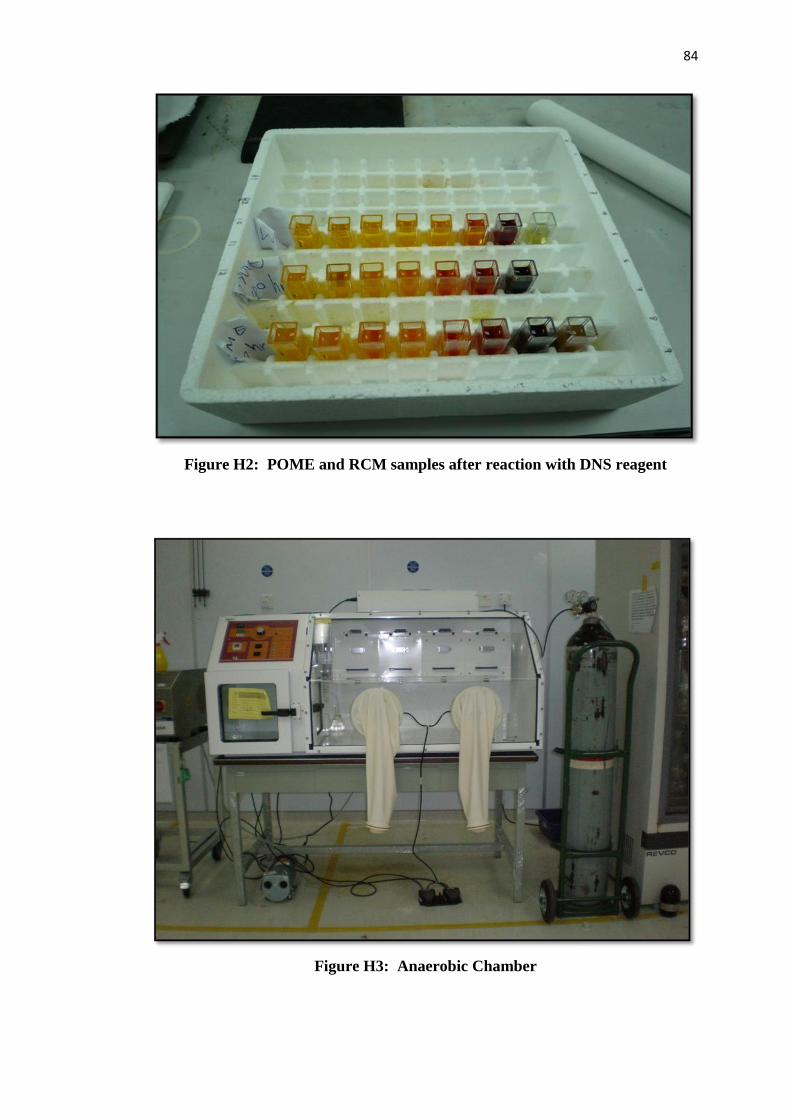
84
Figure H2: POME and RCM samples after reaction with DNS reagent
Figure H3: Anaerobic Chamber