does status quo interpretation affect welfare estimates?3)/jeko_52(3)-9.pdf · hypothetical...
TRANSCRIPT
Jurnal Ekonomi Malaysia 52(3) 2018 115 - 128http://dx.doi.org/10.17576/JEM-2018-5203-9
Does Status Quo Interpretation Affect Welfare Estimates?(Adakah Interpretasi Status Quo Memberi Kesan kepada Anggaran Kebajikan?)
Bakti Hasan-BasriUniversiti Utara Malaysia
Shamsul Bahrain RawiUniversiti Utara Malaysia
Hamimi OmarUniversiti Utara Malaysia
ABSTRACT
In choice experiments (CEs), respondents select their most preferred alternative from a series of choices. One of these alternatives is the status quo (SQ) option, which resembles the current scenario. Previous studies have shown that the way the researcher defines the SQ may be different from how the respondents interpret the same option. Using the case study of white water rafting (WWR) recreation, we investigated the effect of SQ definition on the demand function used to estimate the willingness to pay (WTP) of students who participate in WWR. We applied the confidence interval approach, where WTP values are considered to be significantly different if their confidence intervals do not overlap. We found that the WTP estimates for some attributes (i.e., challenge at the advanced and intermediate levels, and advanced safety) were statistically different. The number of significant estimates suggest that the SQ interpreted by the respondents (as an individual and as a group) are better than that of defined by the researchers. Therefore, we suggest that for purchasing decisions related to nature-based recreational goods such as WWR, the SQ should be determined by the respondents rather than by the researchers.
Keywords: Choice experiments (CEs); status quo (SQ); willingness to pay (WTP); white water rafting (WWR)
ABSTRAK
Dalam eksperimen pilihan, responden dikehendaki memilih alternatif yang paling mereka gemari daripada senarai pilihan yang ada. Salah satu daripada alternatif ini ialah alternatif status quo (SQ) iaitu pilihan yang menggambarkan senario semasa. Kajian lepas telah menunjukkan SQ terjemahan penyelidik berkemungkinan berbeza dengan SQ terjemahan responden. Menggunakan kajian rekreasi berakit air deras (WWR), kami menyiasat kesan terjemahan SQ yang berbeza ini terhadap fungsi permintaan aktiviti WWR di mana fungsi ini akan digunakan bagi menganggar nilai kesanggupan membayar (WTP) bagi pelajar yang menjalankan aktiviti ini. Kami menggunakan pendekatan selang keyakinan di mana nilai anggaran WTP akan dianggap berbeza secara signifikan sekiranya selang keyakinan WTP tersebut tidak bertindan dengan selang keyakinan WTP yang lain. Kami mendapati bahawa anggaran WTP bagi sesetengah atribut (iaitu atribut Cabaran- tahap pertengahan dan lanjutan, dan atribut Keselamatan tahap lanjutan) adalah berbeza secara statistik. Bilangan anggaran WTP yang signifikan ini merumuskan bahawa SQ terjemahan responden (secara perseorangan atau berkumpulan) adalah lebih baik daripada SQ terjemahan penyelidik. Kesimpulannya, kami mencadangkan bahawa untuk pembelian perkhidmatan rekreasi berasaskan sumber alam seperti WWR, terjemahan SQ sebaiknya diberikan oleh responden berbanding penyelidik.
Kata Kunci: Eksperimen pilihan; status quo;kesangupan membayar; rakit air deras
INTRODUCTION
Recreation is about activities, pastimes, and experiences that one chooses to do in his or her free time. Taking part in recreational activities helps individuals to cultivate a sense of well-being, relaxation, and satisfaction. Recreational areas are public areas for sports and games, which are often used as venues for socialization (family and friends gathering). Tribe (2011) defines recreation as the pursuit of leisure activities during one’s spare
time. Similarly, Andkjær and Arvidsen (2015) and Hall and Page (2014) define recreation by referreing to leisure activities that are undertaken by anyone, but emphasizing on natural settings and outdoor activities as the major components. Thus, outdoor recreation can take place anywhere—in one’s own backyard, a local park, a protected area or some distance away—as part of a tourism activity. The United Nation World Tourism Organization (United Nation World Tourism Organization 1999) defines tourism as an activity that
116 Jurnal Ekonomi Malaysia 52(3)
involves a temporary movement of people from their usual environment for a period of one day to one year for purposes of leisure, business, and others. In this sense, recreational activities can be considered as a catalyst for tourism industry, particularly for natural area tourism.
Natural area tourism can be classified into three categories: nature-based, wildlife, and adventure (Newsome et al. 2012). Wildlife tourism refers to the observation of wildlife in its natural setting. There are many different kinds of wildlife-watching holidays. Tourists can choose a luxury hotel-based safari in Kenya, wilderness backpacking in the Rockies, or an Antarctic cruise to watch penguins and killer whales. Nature-based tourism, on the other hand, is broader (in concept) than wilderness tourism as the former embraces the whole landscape. It is based on tourists’ attraction to the natural area, with activities such as stargazing, camping, photographing, hiking, visiting parks, birdwatching, and fishing. Whereas wildlife tourism and nature-based tourism are about nature, adventure tourism is about an individuals’ participation in more challenging recreational activities that take place in the natural setting.
In adventure tourism, the activities are done in natural areas, which may be on land, air, or water (Margaryana & Fredmanb 2017). The activities involve contact with nature, knowledge-based activities, and (to some extent) involve physical challenge (Tsaur et al. 2013). Weiler and Hall (1992) define adventure tourism as “…a broad spectrum of outdoor recreational and touristic activities, often commercialization and involving an interaction with the natural environment away from the participant’s home range and containing elements of risk; in which the outcome is influenced by the participant, setting, and management of the touristic experience.” Although the activities in adventure tourism can take place in urban and indoor settings, most are done outdoors, with many activities held in relatively remote areas (Fuchs et al. 2016; Buckley 2010).
Adventure tourism can be categorized as either soft or hard. This categorization is generally based on the required level of experience and fitness of the participants, and on the degree of the participants’ exposure to risks (Newsome et al. 2012). Examples of soft adventure include moderate hiking, wildlife observation, horseback riding, and bird watching. On the other hand, mountain-related activities; off-road recreational vehicles (4WD); Sahara rally; and kayaking, canoeing, or rafting on white-water rivers, wilderness float trips, black water cave river, lakes, or ocean are usually considered to be hard adventure tourism activities. Most of these activities are physically demanding, which provide the participants with a sense of exhilaration and fulfilment.
Among the leading and highly pursued nature-based outdoor recreational activity in adventure tourism is white water rafting (WWR). The sport provides a wide
range of commercially operated adventure and exciting recreational activities for adventure-seeking individuals. In recent years, the demand for WWR activities has significantly grown as outdoor recreation has become more commercialized (Buckley 2012).
WWR can be classified as a guided commercial tour, and the principal attraction is the outdoor activity that relies on the features of the natural terrain. It helps the participants to experience adventure (both mentally and physically), and generally requires specific equipment (English & Bowker 1996; Swarbrooke et al. 2003; Wu & Liang 2011).
Specifically, WWR uses a raft to navigate through the turbulent areas of a river known as the rapids. The rapids would then stir up the water, resulting in what is called “white water”. The objective of WWR is to surf these rapids while keeping everyone in the boat safe. This sport has varying levels and classification, depending on the roughness of the water that the participant will navigate through. Accordingly, the river’s rapids are classified into six international scales, which define the level of difficulty of the course (Table 1).
Note that the classification system in Table 1 serves only as a guide. Most rivers have the combined features of the rapids described in each classification, and most rivers have varying degrees of difficulty that can change each year due to fluctuations in water level, felled trees, recent flooding, geological disturbances, or bad weather.
Having defined the activities involved in WWR, this paper continues to investigate the attributes of WWR that concern WWR participants. It further attempts to valuate these attributes by using the choice experiments (CEs) technique. This study investigates how the interpretation of status quo influences the decision-making process of the respondents. The status quo option is one of the alternatives included in the choice card presented to respondents.
Status quo (SQ) is a Latin phrase referring to the current scenario. This current scenario can be interpreted as either doing nothing or maintaining one’s current or previous decision (Samuelson & Zeckhauser 1988). The phrase has been applied in many economic literature, and one of them is in environmental valuation. In the stated CEs technique, the SQ is included and paired with hypothetical scenarios to form a choice card. The SQ option is included in the choice sets because it mimics real market transaction (Carson et al. 1994); it also has to be included to follow the Hicksian welfare measurement argument as cited by Hanley et al. (2001).
One of the earliest studies involving the SQ was conducted by Samuelson and Zeckhauser (1988). In their study, the authors investigated how individuals would respond to the SQ alternative. Since then, the SQ has been investigated by many analysts, inter alia, Kahneman et al. (1991); Boxall et al. (2009); and Marsh et al. (2011).
Although many analysts have already studied the issue of SQ interpretation (e.g. Athiainen et al.
117Does Status Quo Interpretation Affect Welfare Estimates?
2014; Banzhaf et al. 2001; Marsh et al. 2011), all of them have focused on the effect of individual-defined SQ; none has investigated the effect of group-defined SQ. Individual-defined SQ refers to a scenario where a respondent interprets the SQ on his own, whereas group-defined SQ is a case where a respondent discusses the interpretation of the SQ with other individuals. For instance, Marsh et al. (2011), in their study on water quality management, studied the effect of individual-defined SQ. The researchers allowed the respondents to interpret the SQ based on their own understanding of the current condition, and were also presented with the SQ as defined by the researchers. In comparing these two approaches, they found that the respondents were more willing to pay for the proposed water quality program if the SQ is based on their own definition rather than that of the researchers’.
Accordingly, the study of Marsh et al. (2011) has motivated us to further explore the effect of SQ interpretation on the CEs technique. Instead of relying solely on the individual’s interpretation of SQ as suggested by the researchers, we enhanced the analysis by also investigating the group-defined SQ. The rationale behind this is that people’s decisions to purchase recreational activities relating to environmental goods are made based on group discussion. In the same vein, individual interpretation of SQ also needs to be investigated since in some recreational activities such as WWR, how the researchers interpret the SQ might be different from how the respondents interpret the same concept. This paper then aims to investigate whether or not the types of SQ interpretation can affect welfare estimates.
As stated above, SQ is one of the alternatives in CEs technique, therefore the respondents decision on choosing the alternatives that are presented to them is subject to their interpretation on the SQ. If the respondents
believe that the utility derive from the SQ is higher than the utility that derive from the hypothetical alternatives then they will choose the SQ. However, the repondents interpretation on the SQ may not be similar to the ones intrepreted by the researchers. If this is the case then it will affect the respondents’ choice and eventually can affect the calculated welfare estimates.
The remainder of the paper is organized as follows. Section 2 provides a brief overview of the issues surrounding the SQ option in CEs and in WWR as a recreational activity. The section explains the circumstances where WWR can be considered as a complex recreational activity. Section 3 discusses the study design and model specification. Section 4 presents and discusses the empirical results. Finally, a concluding section is presented in Section 5.
LITERATURE REVIEW
Choice experiments is a stated preference approach often used in economic valuation. This method requires respondents to select their most preferred alternative from a series of alternatives (Bateman et al. 2002). The alternatives are presented in a choice card format, which consists of an SQ alternative combined with hypothetical alternatives.
The application of CEs for valuing nonmarket goods was first introduced by Louviere and Woodworth (1983), and the technique has since been used to valuate the economic benefits of, inter alia, recreational parks (Siderelis & Moore 1998); river quality (Hanley et al. 2006); transport services (Hensher 2006); and heritage sites (Willis 2009). The approach has also been used to investigate transferability in economic benefits studies (Colombo et al. 2007).
TABLE 1. Degrees of Difficulty in Whitewater Rafting
Level InterpretationIEasy
Fast moving water with small waves. Few obstructions. Risk to participants is slight.
IINovice
Straightforward rapids with wide, clear channels which are evident without scouting. Occasional manoeuvring may be required, but rocks and medium-sized waves are easily missed by trained paddlers.
IIIIntermediate
Waves numerous, high, irregular rocks, rapids with narrow passage requiring expertise in manoeuvring. Scouting usually needed, requires good guide and equipment.
IVAdvanced
Long, intense, powerful but predictable rapids, waves high and irregular, dangerous rocks, scouting is mandatory for the first time. Powerful and precise manoeuvring is required. Requires expert guide and good quality equipment.
VExpert
Long distance obstructed or violent rapids which expose paddlers to above average danger. Drops may contain large unavoidable waves or holes with complex demanding routes. Rapids may continue for long distances between pools, requiring a high level of fitness. Rapids may continue for long distances between pools, demanding a high level of fitness. At the high end of the scale, several of these factors may be combined. Scouting is recommended but may be difficult. Swims are dangerous, and rescue is often difficult even for experts.
VIExpert
Extreme and exploratory rapids. These runs almost never been attempted and often exemplify the extremes of difficulty, unpredictability and danger. The consequences of errors are very severe and rescue may be impossible.
Source: “American Whitewater” (2016)
118 Jurnal Ekonomi Malaysia 52(3)
Several researchers have investigated the issues in CEs as an approach, such as issues in the selection of attributes and levels of alternatives (Blamey et al. 2002), and in pairing alternatives (Bliemer & Rose 2006). In addition, issues relating to questionnaire design (e.g., whether to use the label or no-label alternatives, number of attributes to be included in the choice alternatives, and number of alternatives in each choice card) have been investigated by Blamey et al. (2000); Caussade et al. (2005); and Bergmann et al. (2008).
Another issue being investigated in CEs is the effect of SQ interpretation on welfare estimates. The SQ effect was first introduced by Samuelson and Zeckhauser (1988), and many researchers (e.g., Boxall et al. 2009; Kahneman et al. 1991) have since followed their footsteps to investigate the effect. Willis (2009), for instance, investigated the SQ effect on preferences uncertainty. In his study on the economic benefits of heritage sites, the researcher found that the respondents were uncertain of the utility derived from the SQ alternative that had been presented to them. On the other hand, they were more certain of the utility from the hypothetical alternatives.
Another research area in the SQ effect is the cognitive challenge imposed on the respondents when answering CEs questions (e.g. Boxall et al. 2009; Whittington & Adamowicz 2011). Whittington and Adamowicz (2011) argued that many researchers who use the stated preference method employ the hypothetical SQ without carefully considering how it may cause cognitive burden on the respondents. Accordingly, Boxall et al. (2009) investigated the relationship between the SQ option and cognitive burden; the authors found that respondents tended to choose the SQ if the hypothetical alternatives in the experiments were complex. In terms of the relationship between the SQ and the socioeconomic characterestics of the respondents, the researchers found that ageing people tended to select the SQ. However, those with higher educational level were less likely than those with lower educational level to select the SQ. The authors also investigated the SQ affect on welfare estimates. They found the positive mean value welfare estimates if the SQ is excluded from the analysis. Otherwise, the mean value is negative if the SQ is included. Domínguez-Torreiro and Soliño (2011) found similar result in their study on the effect of provided and perceived SQ on welfare estimates. They found that the different SQ treatment may have an impact on the individual’s choices and eventually affect the welfare estimates. In terms of the relationship between the SQ complexity and welfare estimates, Boxall et al. (2009) concluded that the mean value welfare estimates is likely to be lowered if the complex SQ is applied in CEs.
Many analysts (e.g. Blamey et al. 1999; Willis 2009) define the SQ in their CEs analysis. However, as argued by Marsh et al. (2011), the approach could lead to bias
results if respondents have their own interpretations of the scenario. Thus, Marsh et al. (2011) focused their analysis on the SQ effect, specifically on how the respondents interpret this option. Therefore, in the valuation of the proposed water quality program, the authors employed an approach in which the respondents were allowed to give their own definition of the SQ.
However, this approach can only be valid if a purchase decision is made by an individual; the method may no longer apply if it is done by a group. Thus, we attempt to address this limitation by including the group’s interpretation of the SQ in our analysis.
Using the CEs approach to analyze nature-based recreation goods such WWR is a challenging undertaking, mainly because the SQ is subject to individual experiences. For instance, individuals who are not familiar or have little information about the goods will have a different meaning of the SQ from their counterparts. Thus, the interpretation of the SQ can vary widely within the study population. In addition, many purchasing decisions on nature-based recreation goods are made based on group discussion. If this is the case, then the WTP values derived from an analysis that considered only individual purchase decisions may be inaccurate and may lead to wrong policy recommendations.
Although many researchers have investigated group purchasing decisions (e.g., Arora & Allenby 1999; Corfman & Lehmann 1987) in marketing literature, to the best of our knowledge, no CEs study has focused on how a group’s interpretation of the SQ can affect the derived WTP values. Purchasing decisions in nature-based recreational goods such as WWR are usually made based on group discussion. For example, rafters have to discuss and then agree which rapids they want to navigate through. The choice is subject to many factors, and one of the main considerations in this decision-making process is the skill level of the rafters. If some members of the group think that they cannot manage a particular type of rapid, then they would not consider that rapid type. Otherwise, those rafters would not participate in the activity.
The participants of WWR are expected to gain an extraordinary experience from the activity. However, the satisfaction gained from a WWR experience cannot be easily defined because satisfaction is a hedonic (but complex) encounter between rafters, nature, and activity. Such satisfaction may be based on different attributes such as challenge, safety, and amenities and facilities. A challenge can be derived, for instance, from surviving the rough rapids and the amount of time freezing in wet clothes. Safety involves having reliable rafting equipment, competent and knowledgeable guide, and assurance of minimal physical injury. On the other hand, amenities and facilities relate to an acceptable level of lodging, food, and toilet facilities. In our study, we based these attributes on our review of previous literature and on the results of our focus group meetings with WWR participants.
119Does Status Quo Interpretation Affect Welfare Estimates?
These attributes will be explained in more detail in the next section.
Since extraordinary experience (among others) emerge from the dynamic interaction of participants, it is difficult to predict rafters’ behavior. Thus, the emotional content of these interactions may be described as phenomenal since WWR experience is spontaneous and unrehearsed. In addition, the emotion itself is subjective as it fluctuates from one individual to another and from one social situation to another. Due to these elements of experience and satisfaction, researchers find WWR to be a complex and challenging activity to predict. In light of this, we relied on the participants’ meaning of the SQ (as an individual and as a group), since different participants with different expectations and experiences may produce different SQ definitions.
METHODOLOGY
In CEs, the first stage involves determining the attributes and their corresponding levels. Thus, following Bateman et al. (2002), we reviewed relevant articles on the subject and conducted focus group meetings with people who engage in WWR activities. A total of 24 undergraduate students from the Universiti Utara Malaysia (UUM) participated in the meetings. They were selected based on the criteria that they should have had participated in WWR activities in the last six months prior to the date of the meetings. The participants were divided into three groups of eight students, and were assigned to a group based on their motivation for engaging in WWR activities: for socialization, for challenge, and for escaping the demands of routine life. Since the participants in each group shared similar motivations, such a setting enabled them to discuss and reach a consensus on the attributes to be provided for the WWR activities.
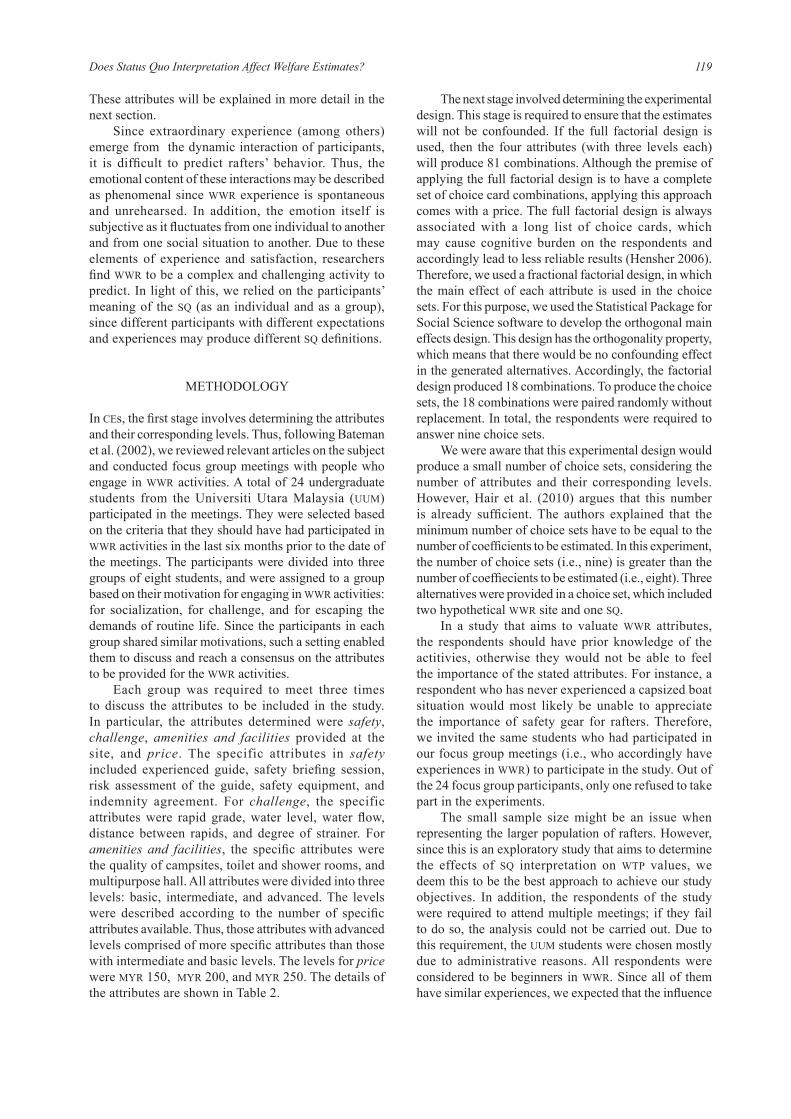
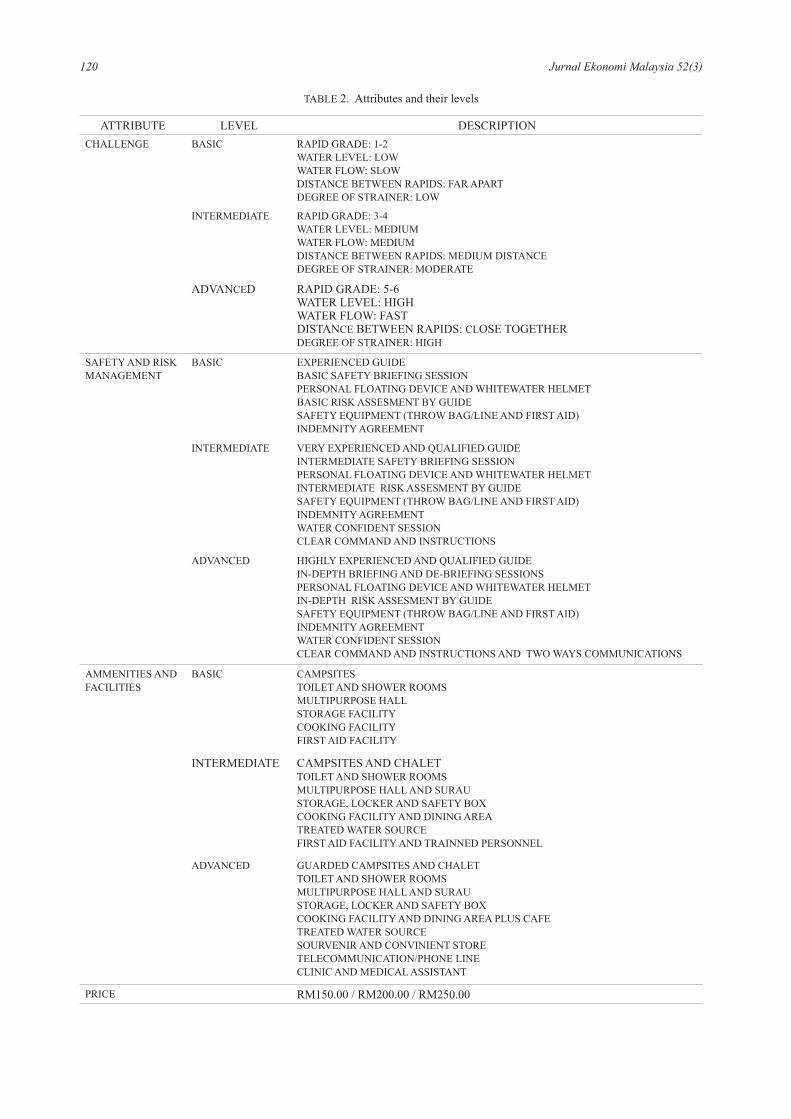
Each group was required to meet three times to discuss the attributes to be included in the study. In particular, the attributes determined were safety, challenge, amenities and facilities provided at the site, and price. The specific attributes in safety included experienced guide, safety briefing session, risk assessment of the guide, safety equipment, and indemnity agreement. For challenge, the specific attributes were rapid grade, water level, water flow, distance between rapids, and degree of strainer. For amenities and facilities, the specific attributes were the quality of campsites, toilet and shower rooms, and multipurpose hall. All attributes were divided into three levels: basic, intermediate, and advanced. The levels were described according to the number of specific attributes available. Thus, those attributes with advanced levels comprised of more specific attributes than those with intermediate and basic levels. The levels for price were MYR 150, MYR 200, and MYR 250. The details of the attributes are shown in Table 2.
The next stage involved determining the experimental design. This stage is required to ensure that the estimates will not be confounded. If the full factorial design is used, then the four attributes (with three levels each) will produce 81 combinations. Although the premise of applying the full factorial design is to have a complete set of choice card combinations, applying this approach comes with a price. The full factorial design is always associated with a long list of choice cards, which may cause cognitive burden on the respondents and accordingly lead to less reliable results (Hensher 2006). Therefore, we used a fractional factorial design, in which the main effect of each attribute is used in the choice sets. For this purpose, we used the Statistical Package for Social Science software to develop the orthogonal main effects design. This design has the orthogonality property, which means that there would be no confounding effect in the generated alternatives. Accordingly, the factorial design produced 18 combinations. To produce the choice sets, the 18 combinations were paired randomly without replacement. In total, the respondents were required to answer nine choice sets.
We were aware that this experimental design would produce a small number of choice sets, considering the number of attributes and their corresponding levels. However, Hair et al. (2010) argues that this number is already sufficient. The authors explained that the minimum number of choice sets have to be equal to the number of coefficients to be estimated. In this experiment, the number of choice sets (i.e., nine) is greater than the number of coeffiecients to be estimated (i.e., eight). Three alternatives were provided in a choice set, which included two hypothetical WWR site and one SQ.
In a study that aims to valuate WWR attributes, the respondents should have prior knowledge of the actitivies, otherwise they would not be able to feel the importance of the stated attributes. For instance, a respondent who has never experienced a capsized boat situation would most likely be unable to appreciate the importance of safety gear for rafters. Therefore, we invited the same students who had participated in our focus group meetings (i.e., who accordingly have experiences in WWR) to participate in the study. Out of the 24 focus group participants, only one refused to take part in the experiments.
The small sample size might be an issue when representing the larger population of rafters. However, since this is an exploratory study that aims to determine the effects of SQ interpretation on WTP values, we deem this to be the best approach to achieve our study objectives. In addition, the respondents of the study were required to attend multiple meetings; if they fail to do so, the analysis could not be carried out. Due to this requirement, the UUM students were chosen mostly due to administrative reasons. All respondents were considered to be beginners in WWR. Since all of them have similar experiences, we expected that the influence
120 Jurnal Ekonomi Malaysia 52(3)
TABLE 2. Attributes and their levels
ATTRIBUTE LEVEL DESCRIPTIONCHALLENGE BASIC RAPID GRADE: 1-2
WATER LEVEL: LOWWATER FLOW: SLOWDISTANCE BETWEEN RAPIDS: FAR APARTDEGREE OF STRAINER: LOW
INTERMEDIATE RAPID GRADE: 3-4WATER LEVEL: MEDIUMWATER FLOW: MEDIUMDISTANCE BETWEEN RAPIDS: MEDIUM DISTANCEDEGREE OF STRAINER: MODERATE
ADVANCED RAPID GRADE: 5-6WATER LEVEL: HIGHWATER FLOW: FASTDISTANCE BETWEEN RAPIDS: CLOSE TOGETHERDEGREE OF STRAINER: HIGH
SAFETY AND RISK MANAGEMENT
BASIC EXPERIENCED GUIDEBASIC SAFETY BRIEFING SESSIONPERSONAL FLOATING DEVICE AND WHITEWATER HELMETBASIC RISK ASSESMENT BY GUIDESAFETY EQUIPMENT (THROW BAG/LINE AND FIRST AID)INDEMNITY AGREEMENT
INTERMEDIATE VERY EXPERIENCED AND QUALIFIED GUIDEINTERMEDIATE SAFETY BRIEFING SESSIONPERSONAL FLOATING DEVICE AND WHITEWATER HELMETINTERMEDIATE RISK ASSESMENT BY GUIDESAFETY EQUIPMENT (THROW BAG/LINE AND FIRST AID)INDEMNITY AGREEMENTWATER CONFIDENT SESSIONCLEAR COMMAND AND INSTRUCTIONS
ADVANCED HIGHLY EXPERIENCED AND QUALIFIED GUIDEIN-DEPTH BRIEFING AND DE-BRIEFING SESSIONSPERSONAL FLOATING DEVICE AND WHITEWATER HELMETIN-DEPTH RISK ASSESMENT BY GUIDESAFETY EQUIPMENT (THROW BAG/LINE AND FIRST AID)INDEMNITY AGREEMENTWATER CONFIDENT SESSIONCLEAR COMMAND AND INSTRUCTIONS AND TWO WAYS COMMUNICATIONS
AMMENITIES AND FACILITIES
BASIC CAMPSITESTOILET AND SHOWER ROOMSMULTIPURPOSE HALLSTORAGE FACILITYCOOKING FACILITYFIRST AID FACILITY
INTERMEDIATE CAMPSITES AND CHALETTOILET AND SHOWER ROOMSMULTIPURPOSE HALL AND SURAUSTORAGE, LOCKER AND SAFETY BOXCOOKING FACILITY AND DINING AREATREATED WATER SOURCEFIRST AID FACILITY AND TRAINNED PERSONNEL
ADVANCED GUARDED CAMPSITES AND CHALETTOILET AND SHOWER ROOMSMULTIPURPOSE HALL AND SURAUSTORAGE, LOCKER AND SAFETY BOXCOOKING FACILITY AND DINING AREA PLUS CAFETREATED WATER SOURCESOURVENIR AND CONVINIENT STORETELECOMMUNICATION/PHONE LINECLINIC AND MEDICAL ASSISTANT
PRICE RM150.00 / RM200.00 / RM250.00
121Does Status Quo Interpretation Affect Welfare Estimates?
of dominant participants in determining the group SQ would be minimal.
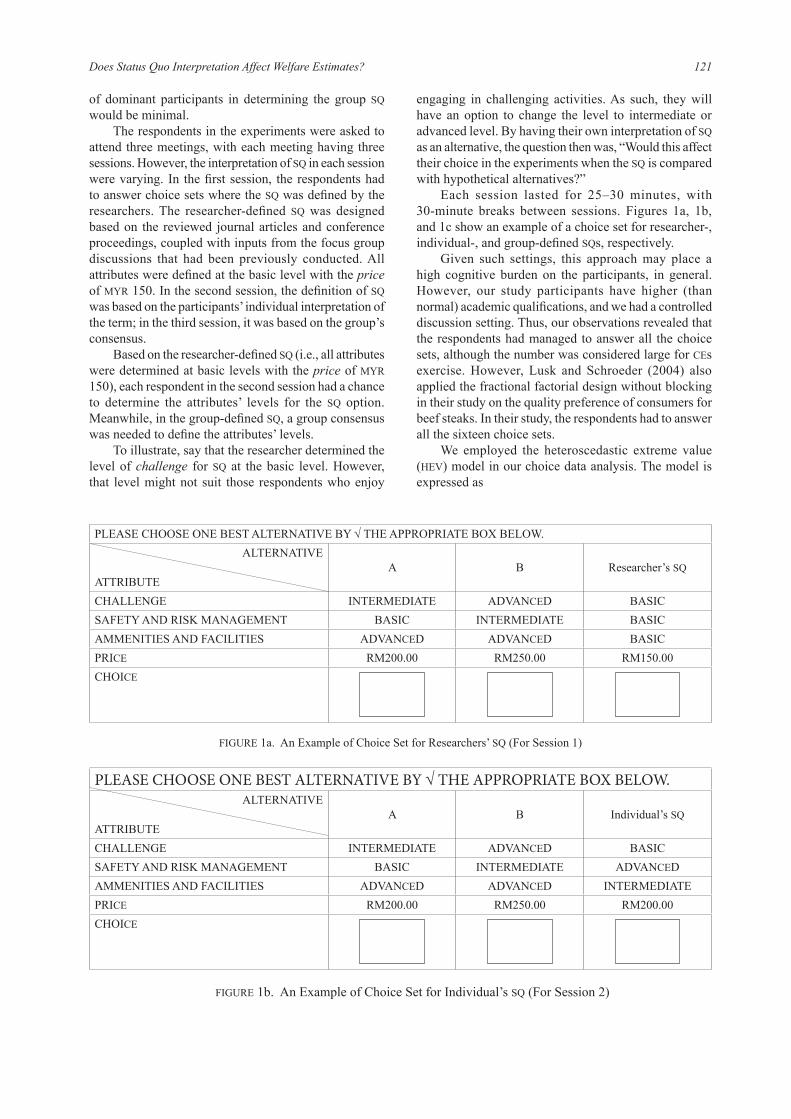
The respondents in the experiments were asked to attend three meetings, with each meeting having three sessions. However, the interpretation of SQ in each session were varying. In the first session, the respondents had to answer choice sets where the SQ was defined by the researchers. The researcher-defined SQ was designed based on the reviewed journal articles and conference proceedings, coupled with inputs from the focus group discussions that had been previously conducted. All attributes were defined at the basic level with the price of MYR 150. In the second session, the definition of SQ was based on the participants’ individual interpretation of the term; in the third session, it was based on the group’s consensus.
Based on the researcher-defined SQ (i.e., all attributes were determined at basic levels with the price of MYR 150), each respondent in the second session had a chance to determine the attributes’ levels for the SQ option. Meanwhile, in the group-defined SQ, a group consensus was needed to define the attributes’ levels.
To illustrate, say that the researcher determined the level of challenge for SQ at the basic level. However, that level might not suit those respondents who enjoy
engaging in challenging activities. As such, they will have an option to change the level to intermediate or advanced level. By having their own interpretation of SQ as an alternative, the question then was, “Would this affect their choice in the experiments when the SQ is compared with hypothetical alternatives?”
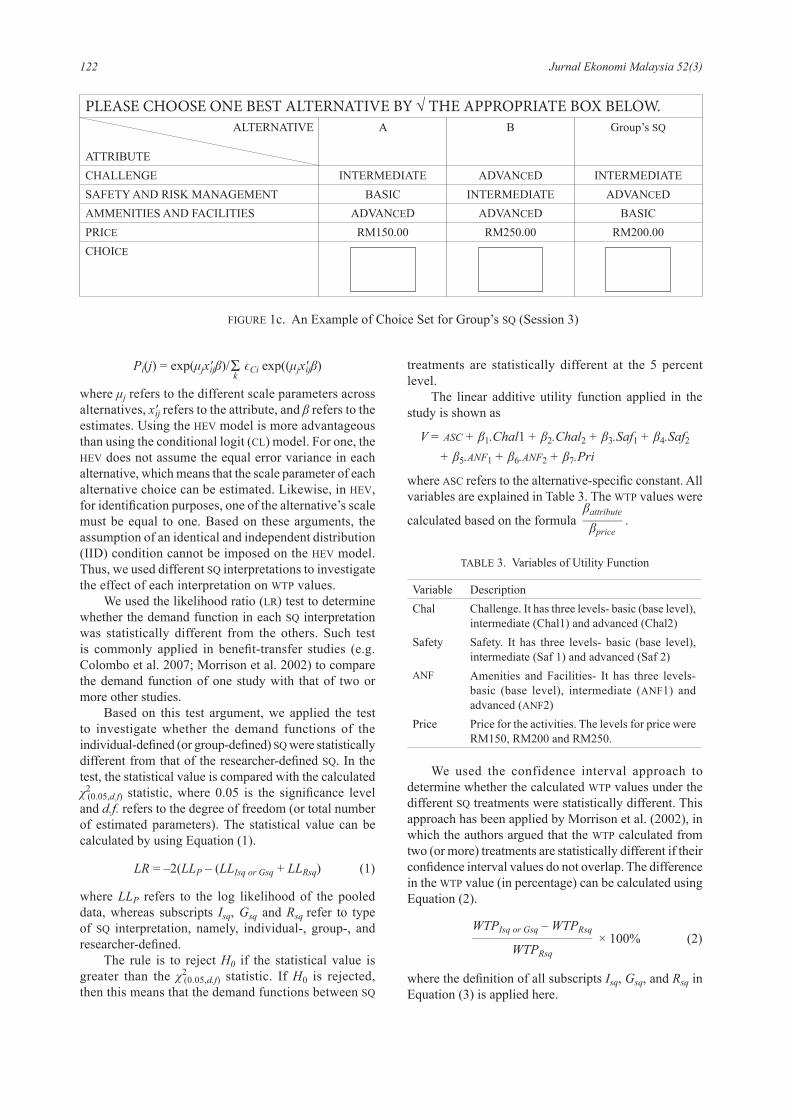
Each session lasted for 25–30 minutes, with 30-minute breaks between sessions. Figures 1a, 1b, and 1c show an example of a choice set for researcher-, individual-, and group-defined SQs, respectively.
Given such settings, this approach may place a high cognitive burden on the participants, in general. However, our study participants have higher (than normal) academic qualifications, and we had a controlled discussion setting. Thus, our observations revealed that the respondents had managed to answer all the choice sets, although the number was considered large for CEs exercise. However, Lusk and Schroeder (2004) also applied the fractional factorial design without blocking in their study on the quality preference of consumers for beef steaks. In their study, the respondents had to answer all the sixteen choice sets.
We employed the heteroscedastic extreme value (HEV) model in our choice data analysis. The model is expressed as
PLEASE CHOOSE ONE BEST ALTERNATIVE BY √ THE APPROPRIATE BOX BELOW.ALTERNATIVE
ATTRIBUTEA B Researcher’s SQ
CHALLENGE INTERMEDIATE ADVANCED BASICSAFETY AND RISK MANAGEMENT BASIC INTERMEDIATE BASIC AMMENITIES AND FACILITIES ADVANCED ADVANCED BASIC PRICE RM200.00 RM250.00 RM150.00CHOICE
FIGURE 1a. An Example of Choice Set for Researchers’ SQ (For Session 1)
PLEASE CHOOSE ONE BEST ALTERNATIVE BY √ THE APPROPRIATE BOX BELOW. ALTERNATIVE
ATTRIBUTEA B Individual’s SQ
CHALLENGE INTERMEDIATE ADVANCED BASICSAFETY AND RISK MANAGEMENT BASIC INTERMEDIATE ADVANCED AMMENITIES AND FACILITIES ADVANCED ADVANCED INTERMEDIATE PRICE RM200.00 RM250.00 RM200.00CHOICE
FIGURE 1b. An Example of Choice Set for Individual’s SQ (For Session 2)
122 Jurnal Ekonomi Malaysia 52(3)
Pi(j) = exp(μjx'ijβ)/Σk
ϵCi exp((μjx'ijβ)
where μj refers to the different scale parameters across alternatives, x'ij refers to the attribute, and β refers to the estimates. Using the HEV model is more advantageous than using the conditional logit (CL) model. For one, the HEV does not assume the equal error variance in each alternative, which means that the scale parameter of each alternative choice can be estimated. Likewise, in HEV, for identification purposes, one of the alternative’s scale must be equal to one. Based on these arguments, the assumption of an identical and independent distribution (IID) condition cannot be imposed on the HEV model. Thus, we used different SQ interpretations to investigate the effect of each interpretation on WTP values.
We used the likelihood ratio (LR) test to determine whether the demand function in each SQ interpretation was statistically different from the others. Such test is commonly applied in benefit-transfer studies (e.g. Colombo et al. 2007; Morrison et al. 2002) to compare the demand function of one study with that of two or more other studies.
Based on this test argument, we applied the test to investigate whether the demand functions of the individual-defined (or group-defined) SQ were statistically different from that of the researcher-defined SQ. In the test, the statistical value is compared with the calculated χ2
(0.05,d.f) statistic, where 0.05 is the significance level and d.f. refers to the degree of freedom (or total number of estimated parameters). The statistical value can be calculated by using Equation (1).
LR = –2(LLP – (LLIsq or Gsq + LLRsq) (1)
where LLP refers to the log likelihood of the pooled data, whereas subscripts Isq, Gsq and Rsq refer to type of SQ interpretation, namely, individual-, group-, and researcher-defined.
The rule is to reject H0 if the statistical value is greater than the χ2
(0.05,d.f) statistic. If H0 is rejected, then this means that the demand functions between SQ
treatments are statistically different at the 5 percent level.
The linear additive utility function applied in the study is shown as
V = ASC + β1.Chal1 + β2.Chal2 + β3.Saf1 + β4.Saf2 + β5.ANF1 + β6.ANF2 + β7.Pri
where ASC refers to the alternative-specific constant. All variables are explained in Table 3. The WTP values were
calculated based on the formula βattribute––––––βprice
.
TABLE 3. Variables of Utility Function
Variable DescriptionChal Challenge. It has three levels- basic (base level),
intermediate (Chal1) and advanced (Chal2)Safety Safety. It has three levels- basic (base level),
intermediate (Saf 1) and advanced (Saf 2)ANF Amenities and Facilities- It has three levels-
basic (base level), intermediate (ANF1) and advanced (ANF2)
Price Price for the activities. The levels for price were RM150, RM200 and RM250.
PLEASE CHOOSE ONE BEST ALTERNATIVE BY √ THE APPROPRIATE BOX BELOW. ALTERNATIVE
ATTRIBUTE
A B Group’s SQ
CHALLENGE INTERMEDIATE ADVANCED INTERMEDIATESAFETY AND RISK MANAGEMENT BASIC INTERMEDIATE ADVANCED AMMENITIES AND FACILITIES ADVANCED ADVANCED BASIC PRICE RM150.00 RM250.00 RM200.00CHOICE
FIGURE 1c. An Example of Choice Set for Group’s SQ (Session 3)
We used the confidence interval approach to determine whether the calculated WTP values under the different SQ treatments were statistically different. This approach has been applied by Morrison et al. (2002), in which the authors argued that the WTP calculated from two (or more) treatments are statistically different if their confidence interval values do not overlap. The difference in the WTP value (in percentage) can be calculated using Equation (2).
WTPIsq or Gsq – WTPRsq––––––––––––––––––
WTPRsq × 100% (2)
where the definition of all subscripts Isq, Gsq, and Rsq in Equation (3) is applied here.
123Does Status Quo Interpretation Affect Welfare Estimates?
RESULTS AND DISCUSSION
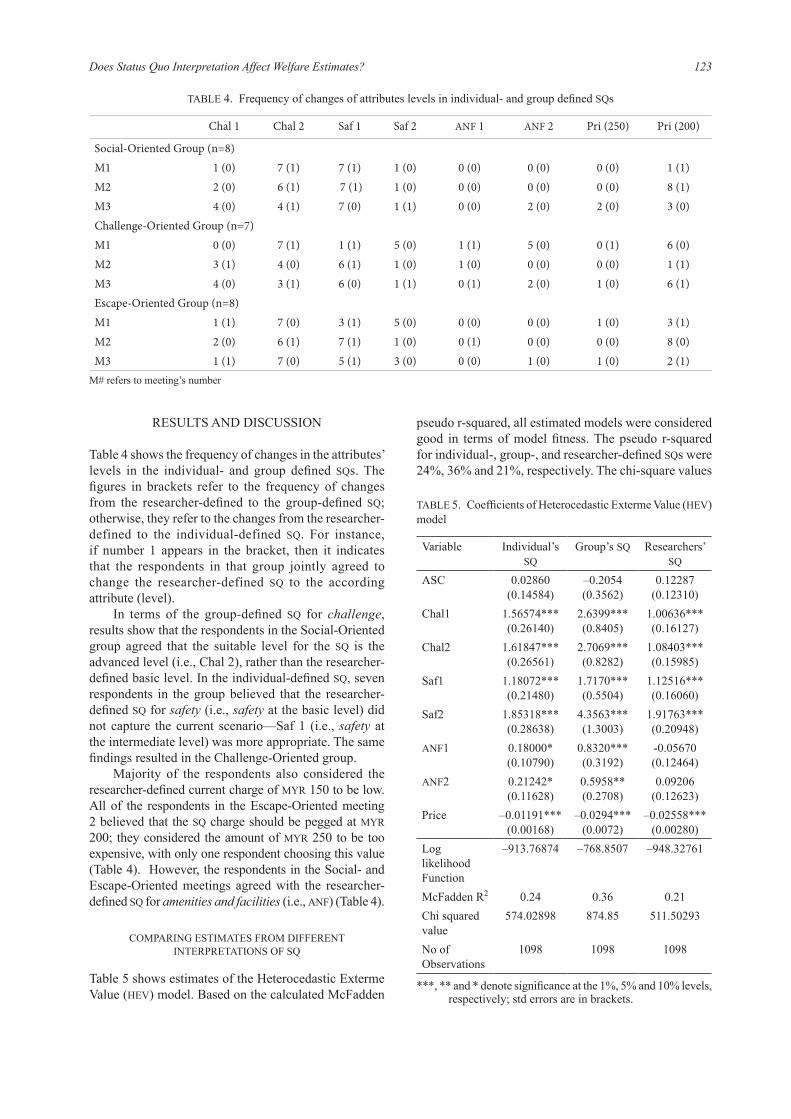
Table 4 shows the frequency of changes in the attributes’ levels in the individual- and group defined SQs. The figures in brackets refer to the frequency of changes from the researcher-defined to the group-defined SQ; otherwise, they refer to the changes from the researcher-defined to the individual-defined SQ. For instance, if number 1 appears in the bracket, then it indicates that the respondents in that group jointly agreed to change the researcher-defined SQ to the according attribute (level).
In terms of the group-defined SQ for challenge, results show that the respondents in the Social-Oriented group agreed that the suitable level for the SQ is the advanced level (i.e., Chal 2), rather than the researcher-defined basic level. In the individual-defined SQ, seven respondents in the group believed that the researcher-defined SQ for safety (i.e., safety at the basic level) did not capture the current scenario—Saf 1 (i.e., safety at the intermediate level) was more appropriate. The same findings resulted in the Challenge-Oriented group.
Majority of the respondents also considered the researcher-defined current charge of MYR 150 to be low. All of the respondents in the Escape-Oriented meeting 2 believed that the SQ charge should be pegged at MYR 200; they considered the amount of MYR 250 to be too expensive, with only one respondent choosing this value (Table 4). However, the respondents in the Social- and Escape-Oriented meetings agreed with the researcher-defined SQ for amenities and facilities (i.e., ANF) (Table 4).
COMPARING ESTIMATES FROM DIFFERENT INTERPRETATIONS OF SQ
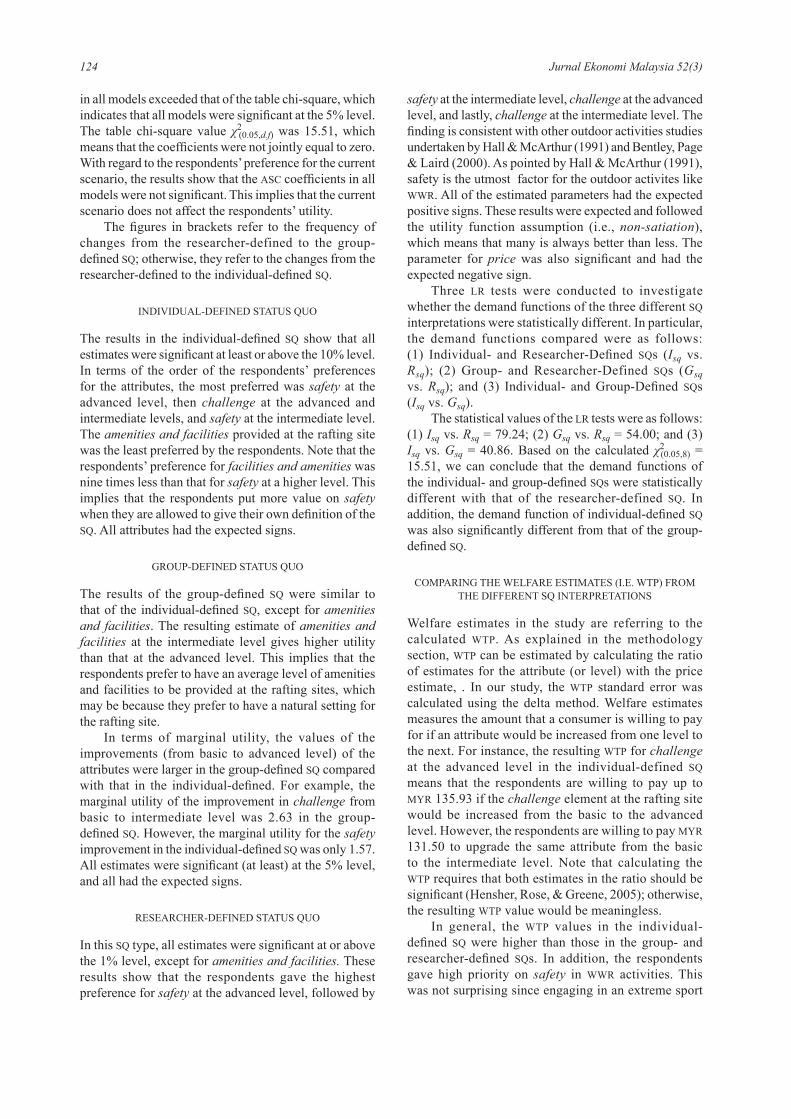
Table 5 shows estimates of the Heterocedastic Exterme Value (HEV) model. Based on the calculated McFadden
pseudo r-squared, all estimated models were considered good in terms of model fitness. The pseudo r-squared for individual-, group-, and researcher-defined SQs were 24%, 36% and 21%, respectively. The chi-square values
TABLE 4. Frequency of changes of attributes levels in individual- and group defined SQs
Chal 1 Chal 2 Saf 1 Saf 2 ANF 1 ANF 2 Pri (250) Pri (200)
Social-Oriented Group (n=8)M1 1 (0) 7 (1) 7 (1) 1 (0) 0 (0) 0 (0) 0 (0) 1 (1)M2 2 (0) 6 (1) 7 (1) 1 (0) 0 (0) 0 (0) 0 (0) 8 (1)M3 4 (0) 4 (1) 7 (0) 1 (1) 0 (0) 2 (0) 2 (0) 3 (0)Challenge-Oriented Group (n=7)M1 0 (0) 7 (1) 1 (1) 5 (0) 1 (1) 5 (0) 0 (1) 6 (0)M2 3 (1) 4 (0) 6 (1) 1 (0) 1 (0) 0 (0) 0 (0) 1 (1)M3 4 (0) 3 (1) 6 (0) 1 (1) 0 (1) 2 (0) 1 (0) 6 (1)Escape-Oriented Group (n=8)M1 1 (1) 7 (0) 3 (1) 5 (0) 0 (0) 0 (0) 1 (0) 3 (1)M2 2 (0) 6 (1) 7 (1) 1 (0) 0 (1) 0 (0) 0 (0) 8 (0)M3 1 (1) 7 (0) 5 (1) 3 (0) 0 (0) 1 (0) 1 (0) 2 (1)
M# refers to meeting’s number
TABLE 5. Coefficients of Heterocedastic Exterme Value (HEV) model
Variable Individual’s SQ
Group’s SQ Researchers’ SQ
ASC 0.02860(0.14584)
–0.2054(0.3562)
0.12287(0.12310)
Chal1 1.56574***(0.26140)
2.6399***(0.8405)
1.00636***(0.16127)
Chal2 1.61847***(0.26561)
2.7069***(0.8282)
1.08403***(0.15985)
Saf1 1.18072***(0.21480)
1.7170***(0.5504)
1.12516***(0.16060)
Saf2 1.85318***(0.28638)
4.3563***(1.3003)
1.91763***(0.20948)
ANF1 0.18000*(0.10790)
0.8320***(0.3192)
-0.05670(0.12464)
ANF2 0.21242*(0.11628)
0.5958**(0.2708)
0.09206(0.12623)
Price –0.01191***(0.00168)
–0.0294***(0.0072)
–0.02558***(0.00280)
Log likelihood Function
–913.76874 –768.8507 –948.32761
McFadden R2 0.24 0.36 0.21Chi squared value
574.02898 874.85 511.50293
No of Observations
1098 1098 1098
***, ** and * denote significance at the 1%, 5% and 10% levels, respectively; std errors are in brackets.
124 Jurnal Ekonomi Malaysia 52(3)
in all models exceeded that of the table chi-square, which indicates that all models were significant at the 5% level. The table chi-square value χ2
(0.05,d.f) was 15.51, which means that the coefficients were not jointly equal to zero. With regard to the respondents’ preference for the current scenario, the results show that the ASC coefficients in all models were not significant. This implies that the current scenario does not affect the respondents’ utility.
The figures in brackets refer to the frequency of changes from the researcher-defined to the group-defined SQ; otherwise, they refer to the changes from the researcher-defined to the individual-defined SQ.
INDIVIDUAL-DEFINED STATUS QUO
The results in the individual-defined SQ show that all estimates were significant at least or above the 10% level. In terms of the order of the respondents’ preferences for the attributes, the most preferred was safety at the advanced level, then challenge at the advanced and intermediate levels, and safety at the intermediate level. The amenities and facilities provided at the rafting site was the least preferred by the respondents. Note that the respondents’ preference for facilities and amenities was nine times less than that for safety at a higher level. This implies that the respondents put more value on safety when they are allowed to give their own definition of the SQ. All attributes had the expected signs.
GROUP-DEFINED STATUS QUO
The results of the group-defined SQ were similar to that of the individual-defined SQ, except for amenities and facilities. The resulting estimate of amenities and facilities at the intermediate level gives higher utility than that at the advanced level. This implies that the respondents prefer to have an average level of amenities and facilities to be provided at the rafting sites, which may be because they prefer to have a natural setting for the rafting site.
In terms of marginal utility, the values of the improvements (from basic to advanced level) of the attributes were larger in the group-defined SQ compared with that in the individual-defined. For example, the marginal utility of the improvement in challenge from basic to intermediate level was 2.63 in the group-defined SQ. However, the marginal utility for the safety improvement in the individual-defined SQ was only 1.57. All estimates were significant (at least) at the 5% level, and all had the expected signs.
RESEARCHER-DEFINED STATUS QUO
In this SQ type, all estimates were significant at or above the 1% level, except for amenities and facilities. These results show that the respondents gave the highest preference for safety at the advanced level, followed by
safety at the intermediate level, challenge at the advanced level, and lastly, challenge at the intermediate level. The finding is consistent with other outdoor activities studies undertaken by Hall & McArthur (1991) and Bentley, Page & Laird (2000). As pointed by Hall & McArthur (1991), safety is the utmost factor for the outdoor activites like WWR. All of the estimated parameters had the expected positive signs. These results were expected and followed the utility function assumption (i.e., non-satiation), which means that many is always better than less. The parameter for price was also significant and had the expected negative sign.
Three LR tests were conducted to investigate whether the demand functions of the three different SQ interpretations were statistically different. In particular, the demand functions compared were as follows: (1) Individual- and Researcher-Defined SQs (Isq vs. Rsq); (2) Group- and Researcher-Defined SQs (Gsq vs. Rsq); and (3) Individual- and Group-Defined SQs (Isq vs. Gsq).
The statistical values of the LR tests were as follows: (1) Isq vs. Rsq = 79.24; (2) Gsq vs. Rsq = 54.00; and (3) Isq vs. Gsq = 40.86. Based on the calculated χ2
(0.05,8) = 15.51, we can conclude that the demand functions of the individual- and group-defined SQs were statistically different with that of the researcher-defined SQ. In addition, the demand function of individual-defined SQ was also significantly different from that of the group-defined SQ.
COMPARING THE WELFARE ESTIMATES (I.E. WTP) FROM THE DIFFERENT SQ INTERPRETATIONS
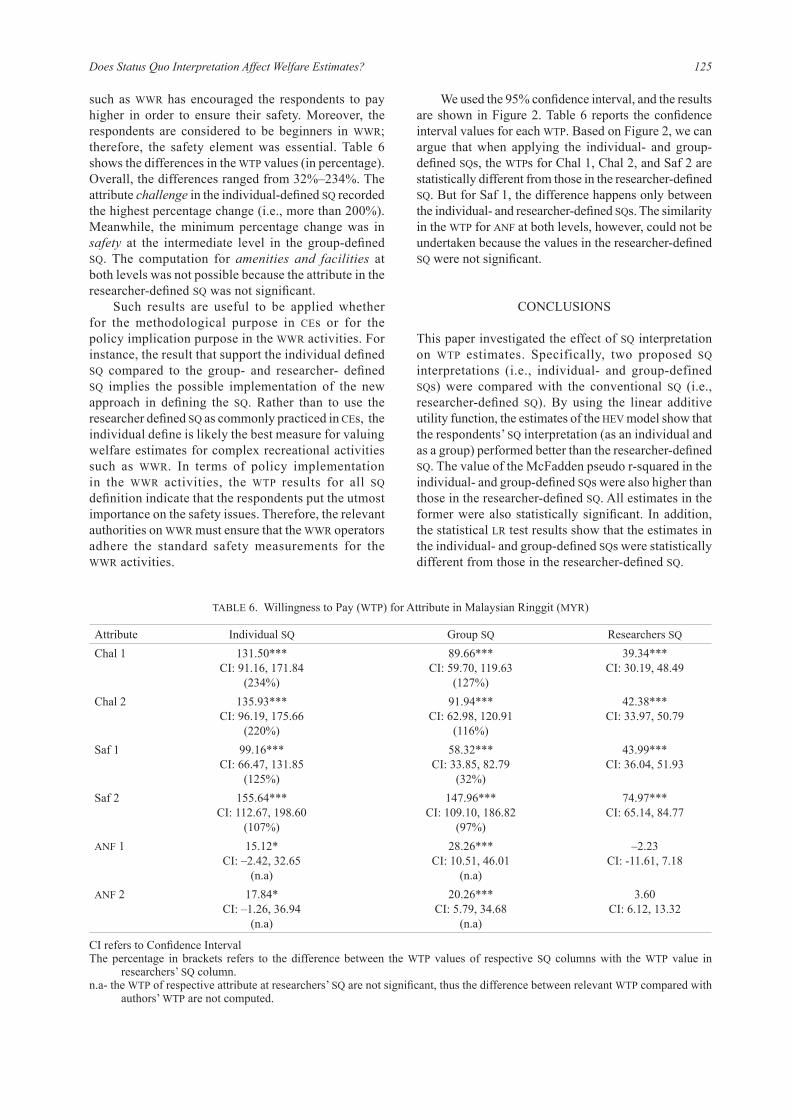
Welfare estimates in the study are referring to the calculated WTP. As explained in the methodology section, WTP can be estimated by calculating the ratio of estimates for the attribute (or level) with the price estimate, . In our study, the WTP standard error was calculated using the delta method. Welfare estimates measures the amount that a consumer is willing to pay for if an attribute would be increased from one level to the next. For instance, the resulting WTP for challenge at the advanced level in the individual-defined SQ means that the respondents are willing to pay up to MYR 135.93 if the challenge element at the rafting site would be increased from the basic to the advanced level. However, the respondents are willing to pay MYR 131.50 to upgrade the same attribute from the basic to the intermediate level. Note that calculating the WTP requires that both estimates in the ratio should be significant (Hensher, Rose, & Greene, 2005); otherwise, the resulting WTP value would be meaningless.
In general, the WTP values in the individual-defined SQ were higher than those in the group- and researcher-defined SQs. In addition, the respondents gave high priority on safety in WWR activities. This was not surprising since engaging in an extreme sport
125Does Status Quo Interpretation Affect Welfare Estimates?
such as WWR has encouraged the respondents to pay higher in order to ensure their safety. Moreover, the respondents are considered to be beginners in WWR; therefore, the safety element was essential. Table 6 shows the differences in the WTP values (in percentage). Overall, the differences ranged from 32%–234%. The attribute challenge in the individual-defined SQ recorded the highest percentage change (i.e., more than 200%). Meanwhile, the minimum percentage change was in safety at the intermediate level in the group-defined SQ. The computation for amenities and facilities at both levels was not possible because the attribute in the researcher-defined SQ was not significant.
Such results are useful to be applied whether for the methodological purpose in CEs or for the policy implication purpose in the WWR activities. For instance, the result that support the individual defined SQ compared to the group- and researcher- defined SQ implies the possible implementation of the new approach in defining the SQ. Rather than to use the researcher defined SQ as commonly practiced in CEs, the individual define is likely the best measure for valuing welfare estimates for complex recreational activities such as WWR. In terms of policy implementation in the WWR activities, the WTP results for all SQ definition indicate that the respondents put the utmost importance on the safety issues. Therefore, the relevant authorities on WWR must ensure that the WWR operators adhere the standard safety measurements for the WWR activities.
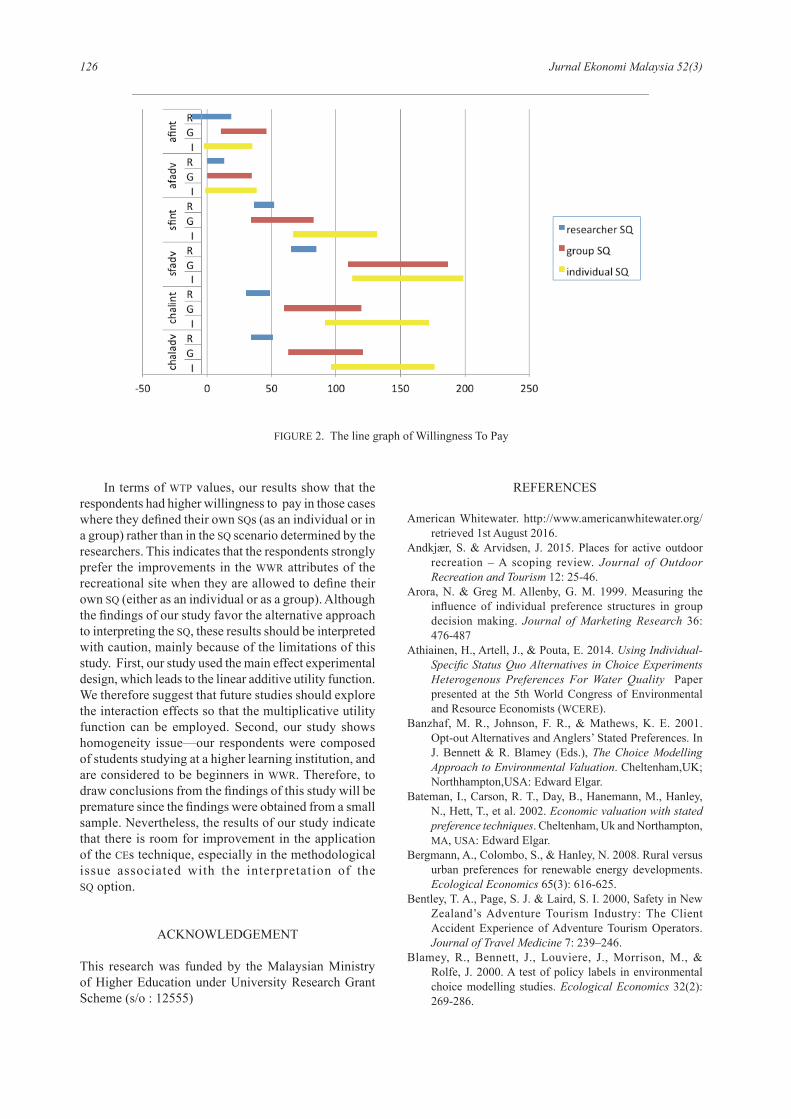
We used the 95% confidence interval, and the results are shown in Figure 2. Table 6 reports the confidence interval values for each WTP. Based on Figure 2, we can argue that when applying the individual- and group-defined SQs, the WTPs for Chal 1, Chal 2, and Saf 2 are statistically different from those in the researcher-defined SQ. But for Saf 1, the difference happens only between the individual- and researcher-defined SQs. The similarity in the WTP for ANF at both levels, however, could not be undertaken because the values in the researcher-defined SQ were not significant.
CONCLUSIONS
This paper investigated the effect of SQ interpretation on WTP estimates. Specifically, two proposed SQ interpretations (i.e., individual- and group-defined SQs) were compared with the conventional SQ (i.e., researcher-defined SQ). By using the linear additive utility function, the estimates of the HEV model show that the respondents’ SQ interpretation (as an individual and as a group) performed better than the researcher-defined SQ. The value of the McFadden pseudo r-squared in the individual- and group-defined SQs were also higher than those in the researcher-defined SQ. All estimates in the former were also statistically significant. In addition, the statistical LR test results show that the estimates in the individual- and group-defined SQs were statistically different from those in the researcher-defined SQ.
TABLE 6. Willingness to Pay (WTP) for Attribute in Malaysian Ringgit (MYR)
Attribute Individual SQ Group SQ Researchers SQ
Chal 1 131.50***CI: 91.16, 171.84
(234%)
89.66***CI: 59.70, 119.63
(127%)
39.34***CI: 30.19, 48.49
Chal 2 135.93***CI: 96.19, 175.66
(220%)
91.94***CI: 62.98, 120.91
(116%)
42.38***CI: 33.97, 50.79
Saf 1 99.16***CI: 66.47, 131.85
(125%)
58.32***CI: 33.85, 82.79
(32%)
43.99***CI: 36.04, 51.93
Saf 2 155.64***CI: 112.67, 198.60
(107%)
147.96***CI: 109.10, 186.82
(97%)
74.97***CI: 65.14, 84.77
ANF 1 15.12*CI: –2.42, 32.65
(n.a)
28.26***CI: 10.51, 46.01
(n.a)
–2.23CI: -11.61, 7.18
ANF 2 17.84*CI: –1.26, 36.94
(n.a)
20.26***CI: 5.79, 34.68
(n.a)
3.60CI: 6.12, 13.32
CI refers to Confidence IntervalThe percentage in brackets refers to the difference between the WTP values of respective SQ columns with the WTP value in
researchers’ SQ column.n.a- the WTP of respective attribute at researchers’ SQ are not significant, thus the difference between relevant WTP compared with
authors’ WTP are not computed.
126 Jurnal Ekonomi Malaysia 52(3)
In terms of WTP values, our results show that the respondents had higher willingness to pay in those cases where they defi ned their own SQs (as an individual or in a group) rather than in the SQ scenario determined by the researchers. This indicates that the respondents strongly prefer the improvements in the WWR attributes of the recreational site when they are allowed to defi ne their own SQ (either as an individual or as a group). Although the fi ndings of our study favor the alternative approach to interpreting the SQ, these results should be interpreted with caution, mainly because of the limitations of this study. First, our study used the main effect experimental design, which leads to the linear additive utility function. We therefore suggest that future studies should explore the interaction effects so that the multiplicative utility function can be employed. Second, our study shows homogeneity issue—our respondents were composed of students studying at a higher learning institution, and are considered to be beginners in WWR. Therefore, to draw conclusions from the fi ndings of this study will be premature since the fi ndings were obtained from a small sample. Nevertheless, the results of our study indicate that there is room for improvement in the application of the CEs technique, especially in the methodological issue associated with the interpretation of the SQ option.
ACKNOWLEDGEMENT
This research was funded by the Malaysian Ministry of Higher Education under University Research Grant Scheme (s/o : 12555)
REFERENCES
American Whitewater. http://www.americanwhitewater.org/ retrieved 1st August 2016.
Andkjær, S. & Arvidsen, J. 2015. Places for active outdoor recreation – A scoping review. Journal of Outdoor Recreation and Tourism 12: 25-46.
Arora, N. & Greg M. Allenby, G. M. 1999. Measuring the infl uence of individual preference structures in group decision making. Journal of Marketing Research 36: 476-487
Athiainen, H., Artell, J., & Pouta, E. 2014. Using Individual-Specifi c Status Quo Alternatives in Choice Experiments Heterogenous Preferences For Water Quality Paper presented at the 5th World Congress of Environmental and Resource Economists (WCERE).
Banzhaf, M. R., Johnson, F. R., & Mathews, K. E. 2001. Opt-out Alternatives and Anglers’ Stated Preferences. In J. Bennett & R. Blamey (Eds.), The Choice Modelling Approach to Environmental Valuation. Cheltenham,UK; Northhampton,USA: Edward Elgar.
Bateman, I., Carson, R. T., Day, B., Hanemann, M., Hanley, N., Hett, T., et al. 2002. Economic valuation with stated preference techniques. Cheltenham, Uk and Northampton, MA, USA: Edward Elgar.
Bergmann, A., Colombo, S., & Hanley, N. 2008. Rural versus urban preferences for renewable energy developments. Ecological Economics 65(3): 616-625.
Bentley, T. A., Page, S. J. & Laird, S. I. 2000, Safety in New Zealand’s Adventure Tourism Industry: The Client Accident Experience of Adventure Tourism Operators. Journal of Travel Medicine 7: 239–246.
Blamey, R., Bennett, J., Louviere, J., Morrison, M., & Rolfe, J. 2000. A test of policy labels in environmental choice modelling studies. Ecological Economics 32(2): 269-286.
FIGURE 2. The line graph of Willingness To Pay
127Does Status Quo Interpretation Affect Welfare Estimates?
Blamey, R., Bennett, J., Louviere, J., Morrison, M., & Rolfe, J. 2002. Attribute causality in environmental choice modelling. Environmental and Resource Economics 23(2): 167-186.
Blamey, R., Bennett, J., & Morrison, M. 1999. Yea-saying in contingent valuation surveys. Land Economics 75(1): 126-141.
Bliemer, M. C. J., & Rose, J. M. 2006. Designing Stated Choice Experiments: State-of-the-Art. Paper presented at the 11th International Conference on Travel Behaviour Research.
Boxall, P., Adamowicz, V., & Moon, A. 2009. Complexity in choice experiments: choice of the status quo alternative and implications for welfare measurement. The Australian Journal of Agricultural and Resource Economics 53: 503-519.
Buckley, R. 2012. Rush as a key motivation in skilled adventure tourism: Resolving the risk recreation paradox. Tourism Management 33(4): 961-970.
Buckley, R. 2010. Adventure Tourism Management: Oxford: Elsevier.
Carson, R. T., Louviere, J., Anderson, D. A., Arabie, P., Bunch, D. S., Hensher, D. A., et al. 1994. Experimental analysis of choice. Marketing Letters 5(4): 351-367.
Caussade, S., Ortuzar, J. d. D., Rizzi, L. I., & Hensher, D. A. 2005. Assessing the influence of design dimensions on stated choice experiment estimates. Transportation Research Part B: Methodological 39(7): 621-640.
Colombo, S., Calatrava-Requena, J., & Hanley, N. 2007. Testing choice experiment for benefit transfer with preference heterogeneity. American Journal of Agricultural Economics 89(1): 135-151.
Corfman, K. P., & Lehmann, D. R. 1987. Models of cooperative group decision-making and relative influence: An experimental investigation of family purchase decisions. Journal of Consumer Research 14(1): 1-13.
Domínguez-Torreiro, M. & Soliño, M. 2011. Provided and perceived status quo in choice experiments: Implications for valuing the outputs of multifunctional rural areas. Ecological Economics (70): 2523-2531.
English, D.B.K. & Bowker, J. M. 1996. Sensitivity of whitewater rafting consumers surplus to pecuniary travel cost specifications. Journal of Environmental Management 47: 79-91.
Fuchs, G., Reichel, A. & Shani, A. 2016. Scuba divers: The thrill of risk or the search for tranquility. Tourism Recreation Research 41(2): 145-156.
Hair-Jr., J. F., Black, W. C., Babin, B. J., & Anderson, R. E. 2010. Multivariate Data Analysis. New Jersey: Pearson.
Hall, C.M. & McArthur, S. 1991. Comercial White Water Rafting in Australia. Leisure Options 1(2): 15-21
Hall, C.M. & Page, S.J. 2014. The Geography of Tourism and Recreation: Time, Place and Space (4th ed.). New York: Routledge.
Hanley, N., Mourato, S., & Wright, R. E. 2001. Choice modelling approaches: A superior alternatives for environmental valuation? Journal of Economic Surveys 15(3): 435-462.
Hanley, N., Wright, R. E., & Alvarez-Farizo, B. 2006. Estimating the economic value of improvements in river ecology using choice experiments: An application to the water framework directive. Journal of Environmental Management, 78(2): 183-193.
Hensher, D. A. 2006. How do respondents process stated choice experiments? Attribute consideration under varying information load. Journal of Applied Econometrics 21(6): 861-878.
Hensher, D. A., Rose, J. M., & Greene, W. H. 2005. Applied choice analysis: A Primer. Cambridge: Cambridge Univerisity Press.
Kahneman, D., Knetsch, J. L., & Thaler, R. J. 1991. The Endowment Effect, Loss Aversion and Status Quo Bias. Journal of Economics Perspective 5(1): 193-206.
Louviere, J., & Woodworth, G. 1983. Design and analysis of simulated consumer choice or allocation experiments: An approach based on aggregate data. Journal of Marketing Research 20(NOVEMBER): 350-367.
Lusk, J. L., & Schroeder, T. C. 2004. Are choice experiments incentive compatible? A test with quality differentiated beef steaks. American Journal of Agricultural Economics 86(2): 467-482.
Margaryana, L. & Fredmanb, P. 2017. Bridging outdoor recreation and nature-based tourism in a commercial context: Insights from the Swedish service providers. Journal of Outdoor Recreation and Tourism 17: 84-9.
Marsh, D., Mkwara, L., & Scarpa, R. 2011. Do respondents’ perceptions of the status quo matter in non-market valuation with choice experiments? An application to New Zealand freshwater streams. Sustainability 3: 1593-1615.
Morrison, M., Bennett, J., Blamey, R., & Louviere, J. 2002. Choice modeling and tests of benefit transfer. American Journal of Agricultural Economics 84(1): 161-170.
Newsome, D., Moore, S., & Dowling, R. K. 2012. Natural Area Tourism: Ecology, Impact and Management. Sydney: Channel View Publication.
Samuelson, W., & Zeckhauser, R. J. 1988. Status Quo Bias in Decision Making. Journal of Risk and Uncertainty 1(1): 7-59.
Siderelis, C., & Moore, R. L. 1998. Recreation demand and the influence of site preference variables. Journal of Leisure Research 30(3): 301-318.
Swarbrooke, J., Beard, C., Leckie, S. & Pomfret, G. 2003. Adventure tourism: The new frontier. Oxford: Butterworth-Heinemann
Tribe, J. 2011. The Economics of Recreation, Leisure and Tourism. 4th Edition. Oxford: Elsevier.
Tsaur, S.H., Lin, W.R. & Liu, J.S. 2013. Sources of challenge for adventure tourists: Scale development and validation. Tourism Management 38: 85-93.
United Nation World Tourism Organization. 1999. Tourism: 2020 vision (Executive Summary). Madrid: World Tourism Organization.
Weiler, B., & Hall, C. M. 1992. Special Interest Tourism. New Jersey: Belhaven Press.
Whittington, D., & Adamowicz, W. 2011. The use of hypothetical baselines in stated preference surveys. Environment for Development Discussion Paper Series, 11-11.
Willis, K. G. 2009. Assessing visitor preferences in the management of archaeological and heritage attractions: A case study of Hadrian’s Roman Wall. International Journal of Tourism Research 11: 487-505.
Wu, C.H. & Liang, R. 2011. The relationship between white-water rafting experience formation and customer reaction: A flow theory perspective. Tourism Management 32(2): 317-325.

128 Jurnal Ekonomi Malaysia 52(3)
Bakti Hasan-Basri*Department of Economics and AgribusinessSchool of Economics, Finance and BankingUniversiti Utara MalaysiaSintok 06010 KedahMALAYSIAE-mail: [email protected]
Shamsul Bahrain RawiDepartment of Economics and AgribusinessSchool of Economics, Finance and BankingUniversiti Utara MalaysiaSintok 06010 KedahMALAYSIAE-mail: [email protected]
Hamimi OmarSchool of Tourism, Hospitality and Environmental ManagementCollege of Law, Government and International StudiesUniversiti Utara MalaysiaSintok 06010 KedahMALAYSIAE-mail: [email protected]
*Corresponding author