comparative justification on intellectual capital
TRANSCRIPT

Comparative justification onintellectual capital
A. SeetharamanMultimedia University, Faculty of Management, Persiaran Multimedia,
Selangor Darul Ehsan, Malaysia
Kevin Lock Teng LowMonash University Malaysia, Bandar Sunway, Selangor Darul Ehsan,
Malaysia, and
A.S. SaravananMultimedia University, Faculty of Management, Persiaran Multimedia,
Selangor Darul Ehsan, Malaysia
Keywords Intellectual capital, Human capital, Financial reporting
Abstract With the development of computerization and networking capabilities, there is asignificantly enhanced opportunity for sharing information and knowledge world-wide. For anorganization to survive in these turbulent times, there is a great need for its continuous renewalthrough the introduction of new, innovative products and processes that are based on newknowledge. As a result, the management and measurement of intellectual capital have attracted alot of attention in recent years both in the media and from academia. This paper assesses differentmethodologies of intellectual capital measurements, both from a macro valuation standpoint andfrom the operating perspective. Valuation metrics are suggested and it demonstrates how it isapplied to a cross-section of firms. The paper also shows that there is no conceptual frameworkcommonly accepted and there is a considerable lack of consistency both inter-country andintra-country. This paper has taken three firms from distinct industries and has applied human,relational or structural capital metrics depending on which is the most relevant.
IntroductionKnowledge underlies the creation of value. Successfully utilizing that knowledgecontributes to the progress of society. Knowledge in business is manifested asintellectual capital, which includes human capital, structural capital, intellectual assetsand intellectual property. It is easy to get puzzled in the maze of terminologysurrounding intellectual capital. Knowledge management, organizational learning,intangible assets, invisible assets and revenues, are also a few of the buzzwords. Forthe purpose of this paper, we will refer to “intellectual capital” as the umbrella termunder which these other terms fall.
While everyone accepts the existence of intellectual capital (IC), extensive debatecontinues over how to measure and manage this capital. Some insist that theaccounting profession must emerge from the Middle Ages and recognize these assetson financial statements. Others argue that intangible assets are not measurable indollar terms. The continued debate has yet to be resolved with a generally acceptedmethod of measurement. This difficulty in valuation and lack of awareness ofintangible assets is leading managers today to make uninformed capital investmentdecisions. Current attempts to quantify intellectual capital recognize that thisdiscrepancy between the market capitalization of a firm and the replacement value of
The Emerald Research Register for this journal is available at The current issue and full text archive of this journal is available at
www.emeraldinsight.com/researchregister www.emeraldinsight.com/1469-1930.htm
JIC5,4
522
Journal of Intellectual CapitalVol. 5 No. 4, 2004pp. 522-539q Emerald Group Publishing Limited1469-1930DOI 10.1108/14691930410566997

the firm’s tangible assets is largely composed of the firm’s intellectual capital. Asreplacement value of assets can be difficult to measure, book value is used as a proxyfor replacement value.
Intangible assets include all assets that are not on the balance sheet, yet contributeto revenue generation. Intangible assets, like physical assets, create shareholder valuewhen they are expected to generate above average returns. A defining characteristic offirms with a high proportion of intangible assets, also called “knowledge firms”, is theirreliance on knowledge workers and the management of knowledge assets to add valuein their products and relationships. Knowledge assets are a type of intangible asset,which causes three unit qualities that physical assets lack. First, a physical asset is ascare because it can only be deployed in one place at a time (rival assets), knowledgeassets can be deployed simultaneously in multiple locations and for multiple projects.For examples, American Airlines Sabre reservation systems, which contains valuableinformation on flight schedules and is used by hundreds of travel agents and travelweb sites, accounts for 60 per cent of AMR Corporation’s total market value.
A second significant difference between tangible and intangible assets, whilephysical assets experience diminishing returns at some point, knowledge assets canexperience increasing returns. This increase is due to the cumulative nature ofknowledge. Finally, there are also network effects associated with knowledge assets.Knowledge assets have an inherent feedback mechanism that leads to theself-propagating virtuous circle. This “winner takes all” environment increases theimportance of being a first mover in knowledge intensive industry.
Intellectual capitalWe prefer a three-part definition of intellectual capital that includes human, relational,and structural components (see Figure 1).
Human capital – employee competenceOrganizational wealth of nations, “employee competence involves the capacity to act ina wide variety of situations to create both tangible and intangible assets”. Theseemployees of the firm contribute to generating knowledge and ideas. All employees arehuman capital, but all employees are not knowledge workers. An individual who workson an assembly line is considered human capital due to his potential of improving the
Figure 1.Types of intellectual
capital
Comparativejustification
523

process, but an employee who spends the lion’s share of his time generating, managing,and converting knowledge to value is termed a knowledge worker. The employee is anasset but perfectly mobile and cannot be owned. The workers’ increasing importance inthe new economy (or knowledge economy) can be seen by sky-rocketing compensationpackages in which the extreme cases make professional athletes look like paupers. Toreduce turnover, many firms are including equity and employee’s stock option planswith vesting periods. We know that certain key employee such as CEOs addtremendous value to organizations, as can be witnessed in the fall of the stock price afterannouncements of their resignations. Proof of the value of officers can also be seen inthe multi-million dollar insurance policies purchased on key officers of a firm.Furthermore, in start- ups, especially in the dot.com world a company’s market valuecan be comprised almost solely of the value of the management team. While in boththese examples the value of key personnel can be observed, the value of some of thecollective human capital of a firm is much harder to estimate.
Relational capital – externalRelational capital encompasses the external revenue generating aspects of the firms.Branding, reputations, strategic alliances, relationships with customers and suppliers,even a firm’s list of blue chip clients has revenue-generating potential. Customers willpay more for the Coca-Cola brand than a generic label brand. Network externalities arealso an example of relational capital.
Structural capital – internalThese are the enabling structures that allow the organization to exploit its intellectualcapital. These range from complete intangible success, the culture and spirit of theorganization, to more tangible items such as copyrights, trademarks, patents, internaldatabases, computer system and company intranets, which manage knowledge.
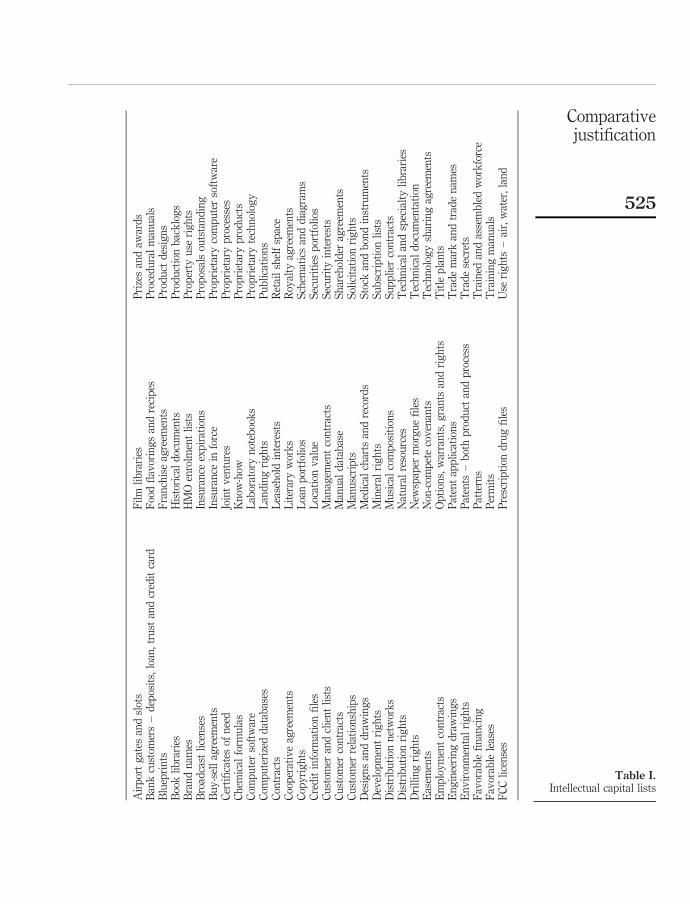
List of intellectual properties and intangible assetsTable I shows a list of intellectual properties and intangible assets which areidentifiable, transferable, with a determine life, and not subject to the day-to-day workefforts of the owner:
Objectives of the researchThe objectives of the research are:
. To understand the measurement, disclosure and management of IC for a betterunderstanding and definition of the concept.
. To study the accounting approaches applied to intangibles in different industriesand countries.
. To identify the techniques for IC measurement.
This work falls into the scope of a comparative study, but is complemented byclassification of different sets of practices. It also relates to an assessment of alternativeaccounting for intellectual capital. However, the main objective of this study is toexamine the approaches to intangibles, and to do so through international comparison.Given the current context of accounting, it is also interesting to observe the points ofdifferences across industries and firms in the same industries.
JIC5,4
524
Air
por
tg
ates
and
slot
sF
ilm
lib
rari
esP
rize
san
daw
ard
sB
ank
cust
omer
s–
dep
osit
s,lo
an,
tru
stan
dcr
edit
card
Foo
dfl
avor
ing
san
dre
cip
esP
roce
du
ral
man
ual
sB
luep
rin
tsF
ran
chis
eag
reem
ents
Pro
du
ctd
esig
ns
Boo
kli
bra
ries
His
tori
cal
doc
um
ents
Pro
du
ctio
nb
ack
log
sB
ran
dn
ames
HM
Oen
rolm
ent
list
sP
rop
erty
use
rig
hts
Bro
adca
stli
cen
ses
Insu
ran
ceex
pir
atio
ns
Pro
pos
als
outs
tan
din
gB
uy
-sel
lag
reem
ents
Insu
ran
cein
forc
eP
rop
riet
ary
com
pu
ter
soft
war
eC
erti
fica
tes
ofn
eed
Join
tv
entu
res
Pro
pri
etar
yp
roce
sses
Ch
emic
alfo
rmu
las
Kn
ow-h
owP
rop
riet
ary
pro
du
cts
Com
pu
ter
soft
war
eL
abor
ator
yn
oteb
ook
sP
rop
riet
ary
tech
nol
ogy
Com
pu
teri
zed
dat
abas
esL
and
ing
rig
hts
Pu
bli
cati
ons
Con
trac
tsL
ease
hol
din
tere
sts
Ret
ail
shel
fsp
ace
Coo
per
ativ
eag
reem
ents
Lit
erar
yw
ork
sR
oyal
tyag
reem
ents
Cop
yri
gh
tsL
oan
por
tfol
ios
Sch
emat
ics
and
dia
gra
ms
Cre
dit
info
rmat
ion
file
sL
ocat
ion
val
ue
Sec
uri
ties
por
tfol
ios
Cu
stom
eran
dcl
ien
tli
sts
Man
agem
ent
con
trac
tsS
ecu
rity
inte
rest
sC
ust
omer
con
trac
tsM
anu
ald
atab
ase
Sh
areh
old
erag
reem
ents
Cu
stom
erre
lati
onsh
ips
Man
usc
rip
tsS
olic
itat
ion
rig
hts
Des
ign
san
dd
raw
ing
sM
edic
alch
arts
and
reco
rds
Sto
ckan
db
ond
inst
rum
ents
Dev
elop
men
tri
gh
tsM
iner
alri
gh
tsS
ub
scri
pti
onli
sts
Dis
trib
uti
onn
etw
ork
sM
usi
cal
com
pos
itio
ns
Su
pp
lier
con
trac
tsD
istr
ibu
tion
rig
hts
Nat
ura
lre
sou
rces
Tec
hn
ical
and
spec
ialt
yli
bra
ries
Dri
llin
gri
gh
tsN
ewsp
aper
mor
gu
efi
les
Tec
hn
ical
doc
um
enta
tion
Eas
emen
tsN
on-c
omp
ete
cov
enan
tsT
ech
nol
ogy
shar
ing
agre
emen
tsE
mp
loy
men
tco
ntr
acts
Op
tion
s,w
arra
nts
,g
ran
tsan
dri
gh
tsT
itle
pla
nts
En
gin
eeri
ng
dra
win
gs
Pat
ent
app
lica
tion
sT
rad
em
ark
and
trad
en
ames
En
vir
onm
enta
lri
gh
tsP
aten
ts–
bot
hp
rod
uct
and
pro
cess
Tra
de
secr
ets
Fav
orab
lefi
nan
cin
gP
atte
rns
Tra
ined
and
asse
mb
led
wor
kfo
rce
Fav
orab
lele
ases
Per
mit
sT
rain
ing
man
ual
sF
CC
lice
nse
sP
resc
rip
tion
dru
gfi
les
Use
rig
hts
–ai
r,w
ater
,la
nd
Table I.Intellectual capital lists
Comparativejustification
525

The survey of literaturesDavid Skyrme Associates(2002) highlights a set of measures that can be used tomeasure progress in the form of balanced scorecard, which could add non-financialmeasures alongside financial measures as a tool for managers and a measure of overallperformance. However, there is no consensus whether to generate financial numbers tobackup the obvious logic of the cost savings endeavors through intellectual capital inthe yearly budget or whether we should record knowledge management as long termstrategic assets that someday will lead to innovation and increase efficiency(Abramson, 1998). In short, there is lack of sophisticated tools to measure the bottomline impact and deliver a dollar-value ROI for managing the company knowledge.
Intellectual capital can be measured by creating the shareholders’ value withoutrelying primarily on the traditional financial indicators (Sveiby, 1998). In most cases,the annual reports from companies do not give any accurate clues on “invisible” assetsto explain the difference between the market value and the net book value. IAS 1 –“Presentation of financial statements” requires that application of all internationalstandards is necessary in order to comply officially with International AccountingStandards. This appears to be a key statement for the move towards accountingharmonization. The feasibility of this kind of harmonization can be challenged if evenone standard is “rejected” by the companies. In the wake of the publication of IAS 38 –“intangible assets”, Stolowy and Cazavan (2001) examines the ways that 21 nationaland two international accounting standards approach intangibles, in terms of bothdefinition and treatment. The result shows that there is no conceptual frameworkcommonly accepted and that there is a considerable lack of consistency bothinter-country and intra-country. This challenges the principle of the acceptability of allinternational accounting standards by companies that wish to or are required to applyIASs. The disharmony highlighted by the advent of IAS 38 could be sign of the failureof international accounting harmonization.
Guthrie (2001) mentions the rise of the “new economy”, one principally driven byinformation and knowledge, international competitiveness and changing patterns ofinterpersonal activities is attributed to the increased prominence of intellectual capital(IC) as a management and research topic. There is indeed much to support the assertionthat IC in the new century will be instrumental in the determination of enterprise valueand national economic performance. Stemming from this awareness of the value ofknow-how is a drive to establish new metrics that can be used to record and report thevalue attributable to knowledge within an organization.
In today’s knowledge-based economy, intellectual capital (IC) is becoming a majorpart of companies’ value. Being able to manage and control IC requires that companiesshould identify, measure and report internally on IC. As financial accounting rules banfull disclosure on IC in the annual report, the external stakeholders lack information oncompanies’ value, which may lead to wrong or bad decisions made. To remedy thissituation, new tools must be developed which enable managers to identify and measurea company’s IC and to report on it within a consistent framework (van derMeer-Kooistra and Zijlstra, 2001). In deciding the measurement of IC, one shall notforget the key concepts when valuing or computing infringement damages for anyintellectual property. In addition, there are some distinctions between intellectualproperty and intangible assets with their respective attributes for quantifying theassets value from an economic analysis or appraisal perspective (Mard et al., 2000).
JIC5,4
526

Given the consideration increase in knowledge-based and technology drivencompanies, the accounting profession has been wrestling with the valuation ofintangibles and particularly intellectual capital. It is suggested that valuation should notbe left to the market but that internally the role of strategic management accounting canform valuation, support decisions and promote competitive advantage. This could beundertaken by referring to strategically driven and formally established performancemeasures, which are incorporated into a valuation model (Tayles et al., 2002). Brennan(2001) examines the extent to which 11 knowledge-based Irish listed companies areadopting methodologies for reporting of intellectual capital in their annual reports. Theirmarket and book values are compared and a content analysis of the annual reports of the11 listed companies was conducted. Knowledge-based Irish listed companies have asubstantial level of non-physical, intangible, intellectual capital assets. The level ofdisclosure of intellectual capital attributes by the 11 listed companies studied is low.
It is important to identify the issues such as exemplifying financial reporting andmanagement accounting perspectives on the emergence of intellectual capital. In aneffort to progress the project of accounting for intellectual capital, the adoption of acritical accounting perspective is suggested. This will entail exploring the possibilitiesof intellectual capital providing its own accounts, rather than remaining imprisonedwithin accounts devised by others (Roslender and Fincham, 2001).
Research frameworkFigure 2 shows the research framework of this paper. One of the objectives of thispaper is to ascertain the methods for measuring intellectual capital. Three firms arebeing analyzed here, which include eBay (www.ebay.com), Pfizer (www.pflizer.com)and Merrill Lynch (www.merrilllynch.com/) on their measurement of intellectualcapital. These firms are chosen here as the companies are specialized on customerservice and they have a large amount of intangible assets in the annual report.
Discussions and findingsUnderstanding of concept, measurements and management of ICUsing the suggested metrics in Tables II-IV, the first major objective research problemcould be explored in the following case studies done on three firms from districtindustries and applied either human, relational or structural capital metrics dependingon which was the most relevant.
Figure 2.Research framework
Comparativejustification
527

In order to understand, identify, manage and report within a consistent framework ofthe key components of IC, the following outlines are discussed in the case studies:
. Measuring relational capital at eBay – customer retention, strength ofrelationships with customers/information sharing ratio, customer acquisitioncosts, customer satisfaction index, brands equity, reputation, prestige of clientbase, strategic alliance /exclusive partnership.
Cost employee/trainingexpense
How much does the firm pay the employees in salary and equity relative tocomparable employees? Exercise caution when using training expense, as itdoes not indicate effectiveness of the training. A good benchmark to use iscomparison with other firms in your industry, which are providing similartraining.
Revenue generated byemployee
The discounted cash flow generated by employee-client relationship
Market capitalizationper knowledge worker
This ratio is interesting to use as a year over year measure to spot trending
Education level ofemployees/type ofdegree
Education includes academic achievement, on-the-job training andchallenging nature of completed projects. These two measures are closelylinked and measure the level of education of your knowledge workers.These figures are useful for comparison with competitors in addition tobenchmarking year over year
Value of area ofexpertise
Linked closely to education level. What is the employee responsible forwithin the firm? How important is that area to the success of the firm?
Knowledge workerturnover
These workers possess valuable knowledge regarding the firm, products,clients, processes and systems. They also appreciate from year to year (to acertain point). Therefore, it is important to measure their rate of turnover.Newer knowledge workers turn over more frequently; a measure of theratio of workers with greater than two years’ tenure; it also makes sense tomeasure knowledge worker satisfaction.
Knowledge tonon-knowledge workerratio
This measure is useful for making comparison between companies in thesame industry. It can be interpreted in two ways – if ratio is low it could bea sign either that the firm is leveraging knowledge workers, that they arefalling behind the competition in terms of proportion of knowledgeworkers. Other measures must be used in conjunction to interpret this one
Conversion ratio The ratio of workers that an organization converts from non-knowledgeworkers to knowledge workers. This ratio measures the effectiveness of theongoing learning and development going on within the organization
Employee network Client relationships of employee. Overlaps with relational capital
Number of years’experience in profession
This measure reflects the cumulative number of years of experience in theprofession of the knowledge workers of the organization. This figure isuseful as a year-to-year comparison to gauge if your knowledge base isgrowing
Ratio of learning projects Another measure of an employee’s competence and development is tomeasure the number of projects in which the professional feels challengedand add to their level of knowledge
Source: Kellogg TechVenture Anthology (2001)Table II.Human capital metrics
JIC5,4
528

. Measuring structural capital at Pfizer – patents, IT investment, R&D investment,trademarks, culture.
. Measuring human capital at Merrill Lynch – cost of employees training expense,revenue generated per employees, education level of employee, value of area ofexpertise and value of employee network.
(For detailed discussion, please refer to the Appendix.)
Customer retention The devotion of customers represents significant value to a company in theform of future expected cash flow and reputation effects that can lead tonew customers (and additional revenues)
Customer acquisitioncosts
The rate at which a company acquires new customers and the cost ofacquiring those customers demonstrate the value of its customer capital.Measures the effectiveness of advertising and relates to the strength of thecompany’s brand recognition
Market share Percentage of the market you control. The greater your market share, thegreater the competitive advantage you enjoy, which results in higherprofitability and valuation
Brand equity Elements of a brand’s image that have the ability to shift economic demandfor a brand. These elements include “the product or service represented bya brand, its authority as a brand, the approval conferred on the consumer ofthe brand and how the customer identifies with the brand”
Customer satisfactionindex
Getting feedback from customers as to their satisfaction with your productor service becomes much easier in the information age. It is important forcompanies to know their customers’ perception of the quality of theirofferings. Companies who show an interest in their customers’ opinions canalso generate higher customer retention
Prestige of clients base For companies in a new economy, acquiring high-profile clients such asMicrosoft, IBM, Amazon or Intel leads to considerable value in the form ofthe ability to generate new customers (and new revenues) and establishingbrand recognition by association with blue chip clients
Number of exclusiveclient relationship
The number of exclusive client relationships results in value creation for acompany in the form of reputation effects as well as securing future cashflows by locking in clients and preventing others from doing so
Strength of relationshipswith customers/information sharingratio
Companies who can develop close relationships with their customers andget them to share information with them serve their clients better andattract new customers more effectively. The percentage of customers whoshare information with you can indicate how loyal customers are and canresult in operational efficiencies that lead to higher profitability
Strategic alliances Similar to the prestige of a client base, forming strategic partnerships andalliances with high profile companies can generate considerable value for acompany. For a company like Greenlight.com which is trying to enter thefiercely competitive car e-tailing market, partnering with Amazon.comwhile costing them $82.5 million over five years resulted in brandrecognition and customer traffic that they otherwise would have spentoutrageous sums of money to acquire
Source: Kellogg TechVenture Anthology (2001)Table III.
Relational capital metrics
Comparativejustification
529

The main conclusions from this particular study are that:. human capital is important regardless of industry type;. human capital has a greater influence on how a business should be structured in
non-service industries compared to service industries;. customer capital has a significant influence over structural capital irrespective of
industry; and. finally, the development of structural capital has a positive relationship with
business performance regardless industry.
Comparison in accounting approaches in different countriesInitial classification shows the differences between the recognition of purchased andinternally generated intangible assets. There is also a distinction between R&D costs,goodwill and other intangible assets in the recognition criteria (See Table V).Depending on the standards, the capitalization may be mandatory or optional.
The exceptional treatment of writing off goodwill against reserves in businesscombinations is no longer adopted by the IASC, and is therefore more rarelyrecommended in national standards – only Denmark, Germany, The Netherlands andSwitzerland still allow it. The UK, which was a country known in Europe for writingoff goodwill, decided in standards FRS 10 (ASB, 1997) that this option could no longerbe allowed. All countries in the sample recognize purchased intangibles, and thisshows that once there is a reference to the market, the question of recognition is nolonger an issue.
However, this is not true for the recognition of internally generated intangibles. InGermany and Austria, if intangibles have been internally generated, under no
Culture The pattern of beliefs, values, practices and artefacts that define for itsmembers who they are and how they do things. Is the culture of the firmsconsistent with its goals? Does the firm have buy-in from its employees?
Frequently cited patents According to research done by Baruch Lev (2001), a correlation was foundbetween a company’s patenting history and its stock price. A typical USpatent cites about eight earlier US companies with patents, one or twoforeign patents and one or two non-patent references. The patents that arefrequently cited by others are usually of high financial value. Companieswith frequently cited patents are likely to see their stocks rise more rapidly
IT investment Information technology is a key tool in a knowledge-based economyR&D investment Expenditure on R&D generates value and it is reasonable to regard such
expenditure as an investment
Knowledge managementinfrastructure spending
Expenditure in this area is representative of a firm’s investment ineffectively disseminating knowledge throughout a company. There istremendous value in capturing and leveraging a company’s collectiveknowledge
Trade mark A company’s trade mark contributes to its brand equity and top-of-mindawareness in the marketplace
Source: Kellogg TechVenture Anthology (2001)Table IV.Structural capital metrics
JIC5,4
530

circumstances can an enterprise recognize them as assets. In the sample, theregulations on recognition of internally generated intangibles are as follows:
. none of countries and organization recognize internally generated goodwill;
. 18 out of 23 countries and organizations allow recognition of other internallygenerated intangibles assets, subject to certain conditions; and
. 20 out of 23 countries and organizations allow recognition of R&D costs or atleast development costs borne by the enterprise, subject to certain conditions.
These conditions are called “recognition criteria”. Nevertheless, it can be seen that allcountries and organizations use recognition criteria for capitalization of intangibles,which supports the view that definitions of intangibles are often too brief to be usefulin determining the appropriate accounting treatment.
Purchase intangiblesInternally generated intangibles
Countries and organizationsRecorded as
an assetWritten off
against reserves Capitalized Non-capitalized
European Union R,G,OAustralia R,G,O R,G,OBelgium R,G,O R,O GDenmark R,G,O G D R,G,OFinland R,G,O R,O GFrance R,G,O R,O (Software) G,O (brands)Germany R,G,O G R,G,OGreece R,G,O G R,O GIreland R,G,O D,O R,GItaly R,G,O D,O R,GLuxembourg R,G,O R,O GThe Netherlands R,G,O G R,O GPortugal R,G,O R,O (Start-up cost) GSpain R,G,O R,O GSweden R,G,O R,O GUK R,G,O D,O R,GOther countries R,G,OAustralia R,G,O R,O GCanada R,G,O D R,GJapan R,G,O O,D (classified as
deferred assets)R,G
Norway R,G,O R,O GSwitzerland R,G,O G D,O R,GUSA R,G,O O (namely software) R,GSupra-national accountingorganizationsIASC R,G,O D,O R,GEuropean Union R,G,O R (Research), G R,O G
Notes: R = R&D costs; D = only development costs (some countries and organizations make thedifference between research and development costs); G = goodwill; O = other intangible assetsSource: Guthrie et al. (2001)
Table V.Different accounting
approaches
Comparativejustification
531

Techniques to measure ICThe limitations of existing financial reporting system for capital markets and otherstakeholders have motivated an evolving dialogue on finding new ways to measureand report on a company’s IC. The product of this dialogue is a plethora of newmeasurement approaches that all have the aim, to a greater or lesser extent ofsynthesizing the financial and non-financial value generating aspects of the companyinto one external report. Principal among the new reporting models is the intangibleasset monitor (Sveiby, 1997, 1998); the balanced scorecard (Kaplan and Norton, 1992,1996); the Scandia Value Scheme (Edvinsson and Malone, 1997; Edvinsson, 1997); andthe intellectual capital accounts (Danish Agency for Trade and Industry, 1998, 1999).Another recommended measurement guidelines as highlighted in Table VI.
LimitationsThe biggest challenge so far is establishing a consensus about the needs to report,what to report and how to report IC of a company. Much of what has been done to datein the field of IC has intuitive appeal. The issue of whether the research works carriedout to date are enough to attract and convince the critical mass of supporters,particularly within the accounting profession. On the other hand, if measurement isconsidered worthwhile, and whether the measurement systems currently being usedby the likes of Skandia should be adopted or a new set of metrics and a differentmethodology need to be developed. More, the issue of reporting the information
Measure Components Comments
Market to bookratio (p/b)
Market valueBook value
Very crude, relies onaccounting data as a proxyfor value of tangible assets
Tobin’s Q ratio Market valueReplacementcost
Improvement over p/b;however, difficult toestimate replacement costfor some firm-specific assets
Calculateintangible value(CIV)
3 year averagepre-taxearnings
2 Industryaverage
ROA
£ Firm’stangibleassets
Good indicator of efficiencyof assets relative tocompetitors; however, relieson accounting conventions(ROA)
Knowledgecapital earnings(KCE)
Modifiedaverage threeyear historicalto normalizedearnings
2 Portion ofearnings
attributed tofinancial
assets
£ Portion ofearnings
attributedto capital
assets
Can also be used to calculatetotal value of intellectualcapital by average return ofknowledge-rich industries
PricewaterhouseCoopers LLPoverall value
Tangible assets + DCF ofintangible
assets
+ Goodwill(options of
firms)
This unique approachincorporates DCF valuationfor each assets and realoptions theory to pricegoodwill
Source: Kellogg TechVenture Anthology (2001)
Table VI.Types of measurementof IC
JIC5,4
532

regarding the value of the knowledge is still questionable. In short, there is a need formany more research works, debates and discussions, policy and developmental worksbefore any significant changes are likely to be made to the existing reporting systemsby most organizations.
ConclusionIntellectual capital (IC) represents the conversion of knowledge into value for a firm.Thus, intellectual assets (people, patents, process, and brand name) are the “debit” andintellectual capital is the “credit” or the equity invested in intellectual assets. Sincehuman capital and relational capital can be transient, companies must strive to covertthese assets into permanent structural capital. Managing intellectual capital is almostsynonymous with managing a new economy firm. Just as the proportion of intellectualcapital to book value of a knowledge firm is much larger than in a traditional firm, themanagement of the firm should also be weighing their efforts towards evaluating,building, and nurturing knowledge assets.
This article on the measurement of IC terrain highlights the case for re-engineeringthe traditional accounting and measurement components. If the efforts are not madetowards incorporating the value of intangibles into a formalized measurementframework, then for many public and private sector organizations, the managementreporting and financial statements will become increasingly irrelevant supportingtools for meaningful decision-making. Granted, for most internally-generatedintangibles, the article is not in a position to provide robust and entirely accuratemeasures and assign a monetary value. However, this article is able to assess whetherthe management of IC is headed in the right direction.
References
Abramson, G. (1998), Intellectual Capitalism: Measuring Up, available at: www.cio.com
ASB (1997), Financial Reporting Standard 10, Accounting Standard Board, Norwalk, CT.
Brennan, N. (2001), “Reporting intellectual capital in annual reports: evidence from Ireland”,Accounting, Auditing & Accountability Journal, Vol. 14 No. 4, pp. 423-36.
(The) Danish Trade and Industry Development Council (1998-1999), Intellectual Capital Accounts,Reporting and Managing Intellectual Capital, Danish Agency for Development of Tradeand Industry, Copenhagen.
David Skyrme Associates (2002), “Measuring intellectual capital: a plethora of methods”, InsightOverview, No. 24.
Edvinsson, L. (1997), “Developing intellectual capital at Skandia”, Long Range Planning, Vol. 30No. 3, pp. 366-73.
Edvinsson, L. and Malone, M. (1997), Intellectual Capital: The Proven Way to Establish YourCompany’s Real Value by Measuring Its Hidden Brain Power, Piatkus, London.
Guthrie, J. (2001), “The management, measurement and the reporting of intellectual capital”,Journal of Intellectual Capital, Vol. 2 No. 1, pp. 27-41.
Guthrie, J., Steane, P. and Dunford, R. (2001), “Stories from Australia on knowledge managementand intellectual capital”, Journal of Intellectual Capital, Vol. 2 No. 1.
Guthrie, J., Petty, R., Ferrier, F. and Wells, R. (1999), “There is no accounting for intellectualcapital in Australia: review of annual reporting practices and the internal measurement ofintangibles within Australian organizations”, OECD Conference Proceedings.
Comparativejustification
533

Kaplan, R.S. and Norton, D.P. (1992), “The balance scorecard – measures that driveperformance”, Harvard Business Review, Vol. 70 No. 1, pp. 58-63.
Kaplan, R.S. and Norton, D.P. (1996), “Using the balanced scorecard as a strategic managementsystem”, Harvard Business Review, Vol. 74 No. 1, pp. 75-86.
Kellogg TechVenture Anthology (2001), available at: www.ranjaygulati.com/new/research/BIOTECH.pdf
Lev, B. (2001), Intangibles: Management Measurement and Reporting, Brookings InstitutionPress, Washington, DC.
Mard, M.J., Hyden, S. and Rigby, J.S. Jr (2000), Intellectual Property Valuation, available at:www.fvginternational.com
Roslender, R. and Fincham, R. (2001), “Thinking critically about intellectual capital accounting”,Accounting, Auditing & Accountability Journal, Vol. 14 No. 4, pp. 383-99, available at:http://leporello.emerlandinsight.com
Stolowy, H. and Cazavan, A.J. (2001), “International accounting disharmony: the case ofintangibles”, Accounting, Auditing & Accountability Journal, Vol. 14 No. 4, pp. 477-97,available at: http://gesser.emerlandinsight.com
Sveiby, K.E. (1997), The New Organizational Wealth: Managing andMeasuring Knowledge-basedAssets, Berrett Koehler, San Francisco, CA.
Sveiby, K.E. (1998), “Measuring intangibles and intellectual capital – an emerging firststandard”, available at: www.sveiby.com.au/EmergingStandard.html.
Tayles, M., Bramley, A., Adshad, N. and Farr, J. (2002), “Dealing with the management ofintellectual capital: the potential role of strategic management accounting”, Accounting,Auditing & Accountability Journal, Vol. 15 No. 1, pp. 251-67, available at: http://leporello.emerlandinsight.com
van der Meer-Kooistra, J. and Zijlstra, S.M. (2001), “Reporting on intellectual capital”,Accounting, Auditing & Accountability Journal, Vol. 14 No. 4, pp. 456-74.
Further reading
Caddy, I. (2000), “Intellectual assets and liabilities”, Journal of Intellectual Capital, Vol. 2 No. 1,pp. 129-46.
Holland, J. (2001), “Financial institution, intangibles and corporate governance”, Accounting,Auditing & Accountability Journal, Vol. 14 No. 4, pp. 497-529, available at: http://gesser.emerlandinsight,com
Mouritsen, J. (2000), “Valuing expressive organizations: intellectual capital and the visualizationof value creation”, in Schultz, M., Hatch, M.J. and Larsen, M.H. (Eds), The ExpressiveOrganization, Oxford University Press, Oxford.
Sawhney, M., Gulati, R., Paoni, A. and the Kellogg TechVenture Team (2001), TechVenture: NewRules on Value and Profit from Silicon Valley [E-Book], John Wiley & Sons, Chichester.
Skandia (1998), Human Capital in Transformation, Report, Skandia, Southampton.
Appendix. Case studyeBayMeasuring relational capital at eBay. Online auctioneer eBay had a market capitalization of$28.06 billion (as of 31 December 2002) and physical assets of $238.8 million based on their mostrecent annual report. When you consider eBay’s value proposition, the words “brand”,“community”, and “customer service” immediately come to mind. One can argue that most of
JIC5,4
534

eBay’s high-flying valuation can be attributed to its relational capital. By scoring eBay on this setof relational capital metrics one begins to understand why it is one of the most successfulcompanies in the new economy.
Customer retention. eBay scores very high in customer retention because it is very easy toregister and post items. Conversely, this ease of use makes it conducive for customers to simplybrowse the site and not buy or post items. eBay works hard to make sure that customers have apositive first experience with eBay so that they will continue to use the site and become an activepart of the community. eBay’s strong sense of community also gives it very high customerretention. Community features such as chat rooms; bulletin boards and “About me” pagesencourage customer loyalty and repeat usage.
Strength of relationship with customers/information sharing – ratio. eBay is a prime exampleof a company that develops close relationships with its customers and gets them to shareinformation which enables eBay to serve its customers better and attract new customers.
Customer acquisition costs. In the world of e-commerce, companies are spending billions todrive traffic to their web sites and it is important for companies to measure their costs ofacquiring new customers. From 31 December 1998 to 31 December 2002, the number ofregistered eBay users grew from approximately two million to over 62 million and eBay spent$349 million on sales and marketing.
Customer satisfaction index. eBay’s Feedback Forum encourage every eBay user to providecomments and feedback on other eBay users with whom they interact and offers users profilethat provide feedback ratings and incorporate these comments. eBay does an excellence job ofutilizing the web and its large database of users to ask customers for their opinions. This leads toincreased customer satisfaction and builds community.
Brand equity. eBay’s brand equity can be measured by the premium they enjoy over theircompetitors. Many auction sites have cropped up in the wake of eBay’s success and many offertheir services free. However, eBay can continue to charge a small fee for posting its items sincethey offer such large community that consumers are willing to pay for it. Consumers know thatthe strong brand name of eBay brings more traffic to their offering and increases their chances ofgenerating interest in their auction items.
Reputation. Reputation is one aspect of eBay’s brand equity that is very strong. Consumersare sharing a lot of information about themselves, including credit card information and homeaddresses and they must trust that eBay will be responsible with this information. The companyhas developed a number of programs designed to make users more comfortable with dealing anunknown trading partner over the web. eBay has responded to fraud issues by implementing a“Safe Harbor” program and escrow services that has bolstered eBay’s reputation as a safe placeto trade. The company has also developed an extensive set of rules and guidelines designed toeducate users and help implement eBay’s policy of prohibiting the sale of illegal or pirated items.eBay’s increase in market value over the last year can be linked directly to its improvements insafety.
Prestige of client base. For eBay, the prestige of its client base is not an essential component ofits valuation since it targets the individual consumer. For eBay, the sheer size of its customerbase, not the prestige or quality of those customers, makes it appealing to strategic partner tostrategic partners, advertisers and service providers.
Strategic alliances/exclusive partnership. While many companies are utilizing strategicpartnership to increase brand awareness and attract customers, eBay is more a target for othere-commerce players than the one seeking out this relationship. However, eBay has a strongalliance with AOL as the preferred provider of personal trading services on AOL’s proprietaryservices AOL.com, Digital Cities, ICQ, CompuServe and Netscape. The AOL partnership is veryvaluable to eBay (it paid $95 million for the contract) in that it gives the company access toAOL’s subscriber base of 28.5 million.
Comparativejustification
535

By applying this set the relational capital metrics to eBay, one can generate a rough estimateof how its market value can be derived. The key to using this framework is that the companymust measure these attributes over time and assess areas for improvement. For example, whileeBay’s reputation as a safe trading environment is now a positive source of value for thecompany, the frauds problems they were suffering from last year would have been negativedrain on the market value (see Tables AI and AII).
PfizerMeasuring structural capital at Pfizer. Pharmaceutical company, Pfizer Inc. had a marketcapitalization of $138.3 billion (as of 31 December 2002) and physical assets of $23.88 billionbased on their most resent annual report. When you consider Pfizer’s mission to achieve andsustain its place as the world’s premier research-based health care company, one can argue thatmost of Pfizer’s valuation can be attributed to its structural capital. By scoring Pfizer on this setof structural capital metrics, one begins to understand why it is one of the world’s mostsuccessful pharmaceutical companies.
Patents. Pfizer, Inc. scores high in this area due to vast number of US and foreign patents thecompany owns licenses. These patents cover: pharmaceutical formulation, productmanufacturing processes and intermediate chemical compounds used in manufacturing.According to Pfizer, taken together the company’s patent and related rights are of materialimportance to their businesses in the USA and most other countries. Based on current productssales and considering the vagarious competition with products sold by others, the patent rightsPfizer considers significant in relation to the business as a whole are those for Norvasc, Cardura,Zithromax, Zoloft, Diflucan, Glucotrol, XL, Viagra and Trovan.
IT investment. According to Pfizer’s web site, the company must be willing to invest in newtechnologies in order to reap their ultimate benefit, a reduction in the cost of disease. An immenseamount of capital has been invested in the improved and access to the technologies has increaseexponentially.
Intangible assets ¼ $27.9 billion
Equity (tangibleassets) ¼ $23.88billion
External structure (relationalcapital) ¼ approx. 90 per cent ofintangible assets ¼ $25.11 billion
Internal structure (human and structuralcapital) ¼ approx. 10 per cent of intangibleassets ¼ $2.2 billion
Source: Company Annual Report (www.ebay.com)
Table AI.Market value ofeBay ¼ $51.78 billion
Retail capital metric
Assigned weight(percentage of relational
capital value)Contribution to value
($billion)
Customer retention 25 6.277Strength of relationship with customers 10 2.511Customer acquisition costs 5 1.255Customer satisfaction index 15 3.766Brand equity 20 5.022Reputation 20 5.022Prestige of client base 0 0.000Strategic alliances/partnerships 5 1.255Total 100 25.11
Source: Company Annual Report (www.ebay.com)Table AII.
JIC5,4
536

R&D investment. Pfizer is primarily a research organization and its R&D investment is thewellspring of its growth and profitability. The company’s central research component, 7,000professionals working in over 30 countries, comprises an R&D program of tremendous breadth.Pfizer’s R&D investment has exceeded two billion dollar annually. Pfizer currently supportsresearch facilities on three continents involved in 180 research projects across 31 major diseasegroups. According to Pfizer’s web site, their discovery researches may test millions of chemicalcompounds to find a dozen candidates drugs of which only might result in an approvedmedication. From discovery to approval can take up to 15 years, and average cost of bringing apharmaceutical product trademarks and 46 animal health trademark.
Trademarks. In Pfizer’s 2002 Annual Report, the company lists 134 trademarks: 46pharmaceutical patents, 42 over-the-counter product trademarks and 46 minimal healthtrademarks.
Culture. The Pfizer culture is dedicated to helping humanity and delivering exceptionalfinancial performance by discovering, developing and providing innovative health care productsthat lead to healthier and more productive lives. The values at the foundation of Pfizer’s businessinclude; integrity, innovation, respect for people, customer focus, teamwork, leadership,performance and community.
By applying this set of structural capital metrics to Pfizer, one can generate a rough estimateof how its market value can be derived. The key to using this framework is that the companymust measure these attributes over time and access areas for improvement. Tables AIII and AIVillustrates the breakdown of Pfizer’s market value and how the various structural capital metricscontribute to the total market value.
Merrill LynchMeasuring human capital at Merrill Lynch. The investment bank Merrill Lynch had a marketcapitalization of $58.1 billion (as of 27 December 2002) and physical assets of $22.9 billion as oftheir latest annual report. Much like other successful investment banks, Merrill Intellectual’scapital dwarfs its book value. Although investment banks’ products could be argued to be acommodity, the market recognized dramatic differences in the values of banks’ intellectual
Structural capital (Pfizer)
Assigned weight(percentage of structural
capital value)Contribution to value
($billions)
Patent 20 18.944Trade marks 35 33.152IT investment 5 4.736R&D investment 15 14.208Culture 25 23.68Total 100 94.72
Source: Company Annual Report (www.pflizer.com) Table AIV.
Intangible assets ¼ $118.4 billion
Equity (tangibleassets) $19.9million
Structural capital ¼ approx. 80 percent of intangible assets ¼ $94.72billion
(Human and relational capital) ¼ approx.20 per cent of intangible assets ¼ $23.68billion
Source: Company Annual Report (www.pflizer.com)
Table AIII.Market value of
Pfizer ¼ $138.3 billion
Comparativejustification
537

capital. Although Merrill has significant relational capital, we argue that the firm’s humancapital differentiate it from its competitors. If the senior banking professionals with importantclient relationship left the firm, so would the clients. That is why banks pay so much to stealtalent.
The first step in valuing human capital, regardless of industry, is to ask what role theemployees play in driving the value of business. What makes a firm distinct? What do customerspay for? The newly founded private equity arm of Merrill Lynch provides a good example of anentity whose people add the critical value. The group’s success depends totally on the ability ofits partners to raise and invest capital. Once the critical assets have been identified, in this casethe partners, the firms may begin to value their resources and may better manage their humancapital.
Cost of employee/training expense. How much does an employee cost Merrill in salary andfuture options? Is the employee replaceable? What is the asset’s replacement cost? In the case ofthe private equity group, the partner who raised the most capital from limited partners is notreplaceable to the individuals who contributed the funds. In most cases, the replacement cost ofan employee will equal the price as the going market rate. For instance, if any firm is willing topay more than another firm to attract talent, that price will become the market rate as every firmwill adjust their pay scale to retain personnel.
Revenue generated per employee. The income approach estimates an asset’s future earningpotential in the same way as a discounted cash flow analysis. In the case of an investmentbanker, it may be appropriate to measure the banker’s worth to the firm by the revenuegenerated from that banker’s client. What is the expected life of the cash flow? Does the employeehave a non-complete clause that precludes him from taking his client list to another bank? Whatis the risk associated with those expected cash flow? Each industry, and firms within eachindustry, must consider different factors in answering these questions.
Education level of employee. Managers may accurately measure the education level of newemployees. Does the addition of an employee add to the average academic achievement ofemployees, or decrease the average. Perhaps a single employee who graduated from the school ofhard knocks instead of Kellogg is good for the street smarts of a firm, but continued trend ofdecreasing academic achievement means trouble.
A manager should consider more though than just the academic achievements of hisemployees. “On-the-job” learning is often more meaningful than a classroom education. Is theemployee gaining new skills? The answers to these questions will enable a manager to moreeffectively measure and manage his human capital.
Value of area of expertise. As employees gain level of expertise while on the job, managersmay designate them as the owners of that information area. The goal of promoting employeeownership of interest areas is two-fold. The firm benefits as employee ownership creates areliable single source of update information for the rest of the firm. Equally important to the firm,the manager may also create a sense of accountability in the employee that will also make himmore valuable over the long term. The investment banking industry provides an interesting casestudy for information ownership.
Investment banks place their junior analyst in industry-specific group to create areas ofexpertise within the firm. In addition to industry segmentation, investment banks also encouragefunctional areas of expertise. Analysts are encouraged to own databases of information that areused across industries. For example, defensive strategy tactics are an important product offeredby new investment banks to all industries. By encouraging a single employee’s ownership of thedefense database, a manager may increase the worth of that individual employee to a firm. Thisprovides even a global firm with a single source of updated information that will keepindividuals from repeating the same work. The employee benefits, as well as receives exposurewithin the firm and the opportunity to prove himself.
JIC5,4
538

Value of employees’ network. Employees can add significant value to a firm through theirnetwork of external contacts. A manager can value that set of relationship in several ways.Continuing with the investment-banking example, senior bankers are compensated by howmuch revenue their client contacts generate. A fault with this measurement is that it fails toaccount for the senior banker. The revenue generated by each client may be a better measure ofthe team working on the deal than the individual banker at the point of contact may with theclient.
Another measure of the value of relationship is to estimate what the firm would lose inrevenue if that employee were to leave. For instance, if Merrill Lynch hired the son of prominentCEO, the value of that Merrill employee would not be limited to his actual work product, butwould also include the revenue generated from the firm’s relationship the father’s firm (seeTables AV and AVI.
Intangible assets ¼ $35.2 billion
Equity(tangibleassets) $22.9million
External structure (relationalcapital) ¼ approx. 25 per cent ofintangible assets ¼ $8.8 billion
Internal structure (human and structuralcapital) ¼ approx. 75 per cent of intangibleassets ¼ $26.4 billion
Source: Company Annual Report of Merrill Lynch
Table AV.Market value of Merrill
Lynch ¼ $58.1 billion
Human capital (Merrill Lynch)
Assigned weight(percentage of relational
capital value)Contribution to value
($ billion)
Revenue generated per employee 35.0 12.32Education level of employee 15.0 5.28Area of expertise 15.0 5.28Knowledge worker turnover 10.0 3.52Employee client list 25 8.8Total 100 35.20
Source: Company Annual Report of Merrill Lynch Table AVI.
Comparativejustification
539