chronostratigraphy of miocene turbiditic sequence … of miocene turbiditic sequence of sabah basin...
TRANSCRIPT
AAPG InllI7IJllu,nal Con/ertllCt d ExbibiJu,n Y4 AugUJt21-24, 1994, KmJaLumpur,Ma/ayJiJI
Chronostratigraphy of Miocene turbiditic sequence of Sabah Basin from nannofossil assemblages
MOlm RAzALI CHE KOB AND MAHAN! MOHAMED
PETRONAS Research and Scientific Services Lot 1026 PKNS Industrial Area
54200 Kuala Lumpur
Abstract: The Sabah Basin, Eastern Malaysia is a Neogene trench-associated sedimentary basin filled with progradational cycles of marine and coastal sediments that display spectacular arrays of facies changes. The strata also show a decreasing intensity of deformation resulting from an interplay of subsidence due to local extension and compression due to crustal convergence. Consequently, age determinations and correlation of these strata create various problems that reqwre special biostratigraphic methods. More reliable age-determinations of Miocene strata in the Sabah Basin, especially in turbiditic sequences, have been achieved through quantitative nannofossils analysis. Foraminiferal assemblages in this type of sequences in the basin commonly indicate unreliable ages which seemingly reflect
, undetected floods of older, allochthonous forms masking lesser preserved younger autochthonous type. The analyses of nannofossils from sediments in five wells also show mixtures of nannofossils of different ages. Analysis of nannofossils abundance allow the recognition of the more common occurrence of indigenous forms as compared to fewer reworked older types. The abundance pattern thus reflects the nature of sedimentary facies and support the turbiditic depositional model. The dominant indigenous assemblages, as differentiated from the reworked assemblages through quantitative analysis are then quite useful in determining the ages of this problematic Miocene sequence of the Sabah Basin.
INTRODUCTION
Turbidite sequences are extensive and economically important in the Sabah Basin. At several places, such sequences have been proven to contain hydrocarbons. As exploration activities move further basinward within the Sabah Basin, most of the sand bodies encountered are of turbiditic origm. The biochronostratigraphy of these sequences are still poorly documented. Because of this, accurate correlation and chronostratigraphic interpretation of these sediments are extremely difficult with biostratigraphic data sometimes giving misleading results.
At the present time, no purely biochronological studies have been published from the Sabah Basin. Most of the chronostratigraphic documentation with respect to this basin, are supplementary to other geological studies with biostratigraphic input occurring in the form of biostratigraphic schemes, details of which are kept in-house by operators and cannot substantially be checked for accuracy.
Previously, the pollen and spores served as the main correlative tool in the Sabah Basin. This is because of their wide geographical dispersal compared to other microfossils (e.g. foraminifera and calcareous nannofossils). Furthermore, the impoverished nature of the calcareous microfossils
Geol. Soc. MaIaY.lia, Bulletin 37, July 1995; pp. 143-163
in the more proximal sediments in the area (mostly coastal facies) has deterred their application.
As exploration activities move farther offshore, the paleoenvironments within most stratigraphic levels become more marine. Instead of coastal sands, the main exploration targets are deep marine sands which are largely of gravity flow origin. In this realm, calcareous microfossils, such as foraminifera are of greater biostratigraphic significance. Besides providing clues for paleoenvironments, they are also better tools for biochronology compared to pollen and spores. The distribution of calcareous nannofossils in this environment is controlled mainly by sedimentary facies. They are scarce in sandy facies and limited only to bigger specimens; the smaller species are easily washed away as their sizes are smaller than the sand grains. In contrast, muddy facies yields abundant of calcareous nannofossils.
Calcareous nannofossils are very useful in dating the deep marine turbiditic facies, such as those which occur in the Sabah Basin. In this facies, calcareous nannofossils have often proven to be the more significant biostratigraphic tool than foraminifera. Besides the favourable facies, they are also more resistant to dissolution compared to foraminifera (Bukry, 1971). Part of their resistance, may be the result of incorporation of a shield of
144 MOHO RAZALI CHE KOB AND MAHANI MOHAMED
acid-resistant, fibrillar, a cellulose-like polysaccharide material with the skeletal calcite (Franke and Brown, 1971). For this reason, it has been observed that at several localities in the Sabah Basin, while there are still significant numbers of calcareous nannofossils, the planktic foraminifera are absent or impoverished, presumably as a result of dissolution of their calcareous test. This dissolution is thought to occur in the turbiditic settings of the Miocene of the Sabah Basin even though deposition occurs above the calcite saturation limit. It is thought that this is due to the presence of acidic bottom waters which may develop at bathyal water depths where terrigenous input is high.
In addition to the problem of dissolution, the biochronological documentation of the turbiditic sequences of the Sabah Basin has been confused as a result of the presence of reworked fossils from older strata, which were eroded and subsequently redeposited through various turbiditic processes.
The reworked forms were concealed within the redeposited sediments , and were subsequently protected from the corrosive water that partially or completely consumed the exposed in situ calcareous fossils. The result is that within the turbiditic facies the reworked microfossils are found to be mixed with the in situ fossils in various proportions, and where cuttings are analysed from well sections, emphasis is given to older forms as younger ones are assumed to be contamination as a result oJ caving. The inability to differentiate which assemblages are in situ will obviously lead t o misleading chronostratigraphical conclusions.
This paper is concerned with the chronostratigraphy ofthe Upper Miocene turbiditic strata of Sabah Basin. A method is proposed which utilises the quantitative analysis of nannofossils flora to differentiate reworked forms from the in situ assemblages, in order to solve an intriguing biochronological puzzle within the Sabah Basin.
_ Dudar-1
/ /. Rusa Timur-1
/ / Mengkira-1 - -Solisip-1 T~bungo ,
_ Semuan-1
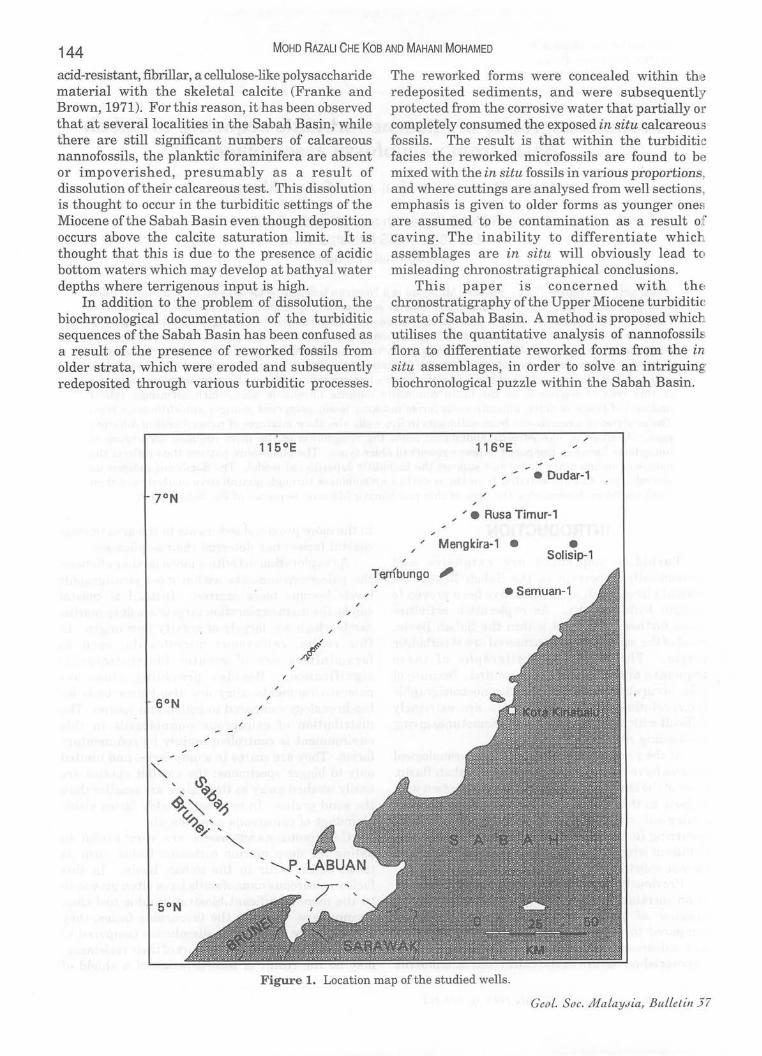
Figure 1. Location map ofthe studied wells.
Geo!. Soc. MaLaY.:Iia, BuLLetin 37
CHRONOSTRATIGRAPHY OF MIOCENE TURBIDITIC SEQUENCE OF SABAH BASIN FROM NANNOFOSSIL ASSEMBLAGES 145
Selected wells and intervals The five wells examined for calcareous
nannofossils in this study are Tembungo-1, Tembungo-2, Tembungo-3, Dudar-1 and Rusa Timur-1 (Fig. 1). These wells are located in western and northwestern part of the Sabah Basin. The samples were selected to cover the full range of the Miocene strata penetrated in each well.
Samples preparation and analytical technique
The analyses were carried out mostly on ditchcutting samples, as only a small selection of core samples were obtained from available sections. On average, samples were collected at 30' intervals although some were obtained at intervals up to 100'.
Slides were prepared following the standard procedure described by Lord (1982) with a slight modification; in that, the cleaning processes by ultrasonic and centrifuge were omitted. This was to avoid the destruction or loss of nannofossil specimens that might influence the results and interpretations. The slides were studied using an optical microscope (Olympus Model BH-2).
AP, noted above, a quantitative technique was used in this study. The technique involved documentation of every specimen observed within three randomly selected slide traverses on a 100 mm x 100 mm cover slip. The three traverses are equivalent to approximately 300 microscopic views at 1,250X enlargement.
The data were then computed to obtain a graphic saw-blade diagram of species frequencies. These data and diagram were used and manipulated for zonal and chronological interpretations.
The standard nannoplankton zonation scheme proposed by Martini (1971) is used in this study. In addition, information from the schemes of Bukry (1971), Okada and Bukry (1980) and Perch-Nielsen (1985) are also referred to where appropriate.
GENERAL GEOLOGY OF SABAH BASIN
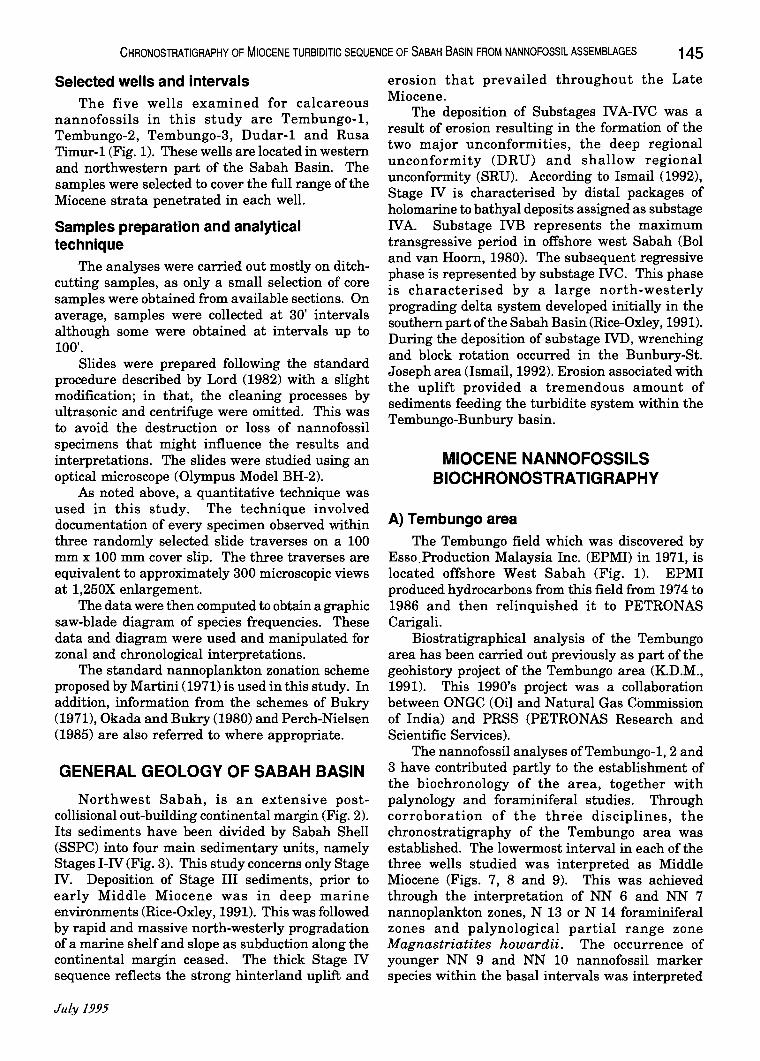
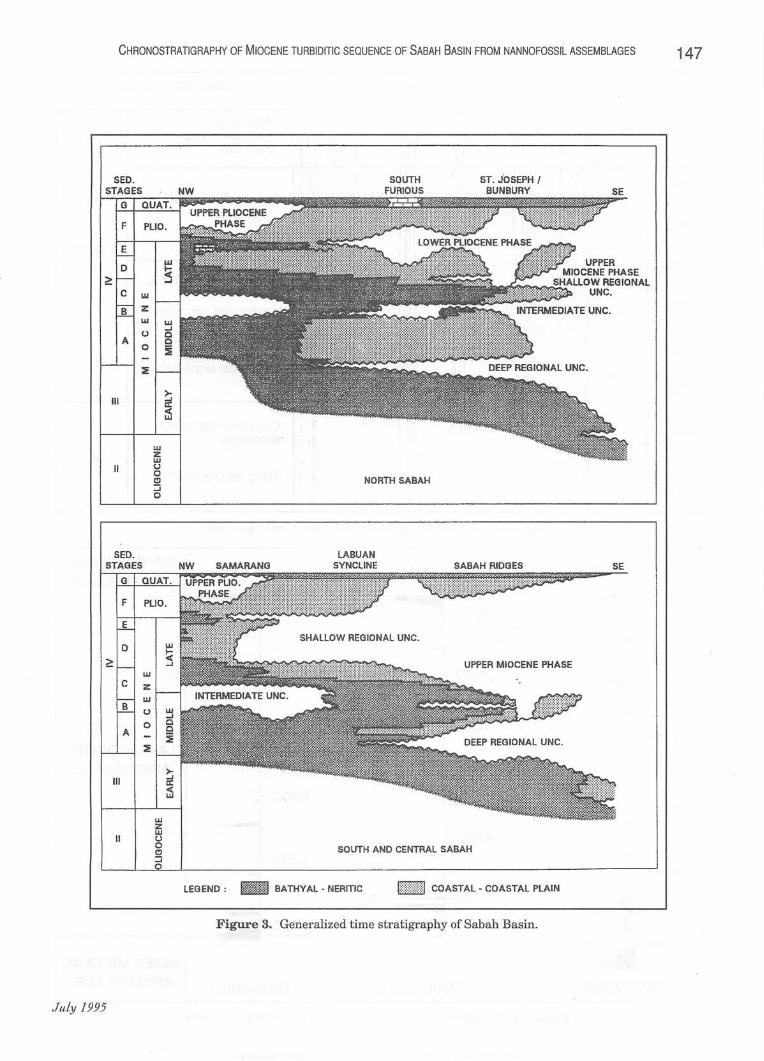
Northwest Sabah, is an extensive postcollisional out-building continental margin (Fig. 2). Its sediments have been divided by Sabah Shell (SSPC) into four main sedimentary units, namely Stages I-IV (Fig. 3). This study concerns only Stage IV. Deposition of Stage III sediments, prior to early Middle Miocene was in deep marine environments (Rice-Oxley, 1991). This was followed by rapid and massive north-westerly progradation of a marine shelf and slope as subduction along the continental margin ceased. The thick Stage IV sequence reflects the strong hinterland uplift and
July 1995
erosion that prevailed throughout the Late Miocene.
The deposition of Substages IV A-IVC was a result of erosion resulting in the formation of the two major unconformities, the deep regional unconformity (DRU) and shallow regional unconformity (SRU). According to Ismail (1992), Stage IV is characterised by distal packages of holomarine to bathyal deposits assigned as substage IVA. Substage !VB represents the maximum transgressive period in offshore west Sabah (Bol and van Hoorn, 1980). The subsequent regressive phase is represented by substage IVC. This phase is characterised by a large north-westerly prograding delta system developed initially in the southern part of the Sabah Basin (Rice-Oxley, 1991). During the deposition of substage IVD, wrenching and block rotation occurred in the Bunbury-St. Joseph area (Ismail, 1992). Erosion associated with the uplift provided a tremendous amount of sediments feeding the turbidite system within the Tembungo-Bunbury basin.
MIOCENE NANNOFOSSILS BIOCHRONOSTRATIGRAPHY
A) Tembungo area The Tembungo field which was discovered by
Esso.Production Malaysia Inc. (EPMI) in 1971, is located offshore West Sabah (Fig. 1). EPMI produced hydrocarbons from this field from 1974 to 1986 and then relinquished it to PETRONAS Carigali.
Biostratigraphical analysis of the Tembungo area has been carried out previously as part of the geohistory project of the Tembungo area (KD.M., 1991). This 1990's project was a collaboration between ONGC (Oil and Natural Gas Commission of India) and PRSS (PETRONAS Research and Scientific SerVices).
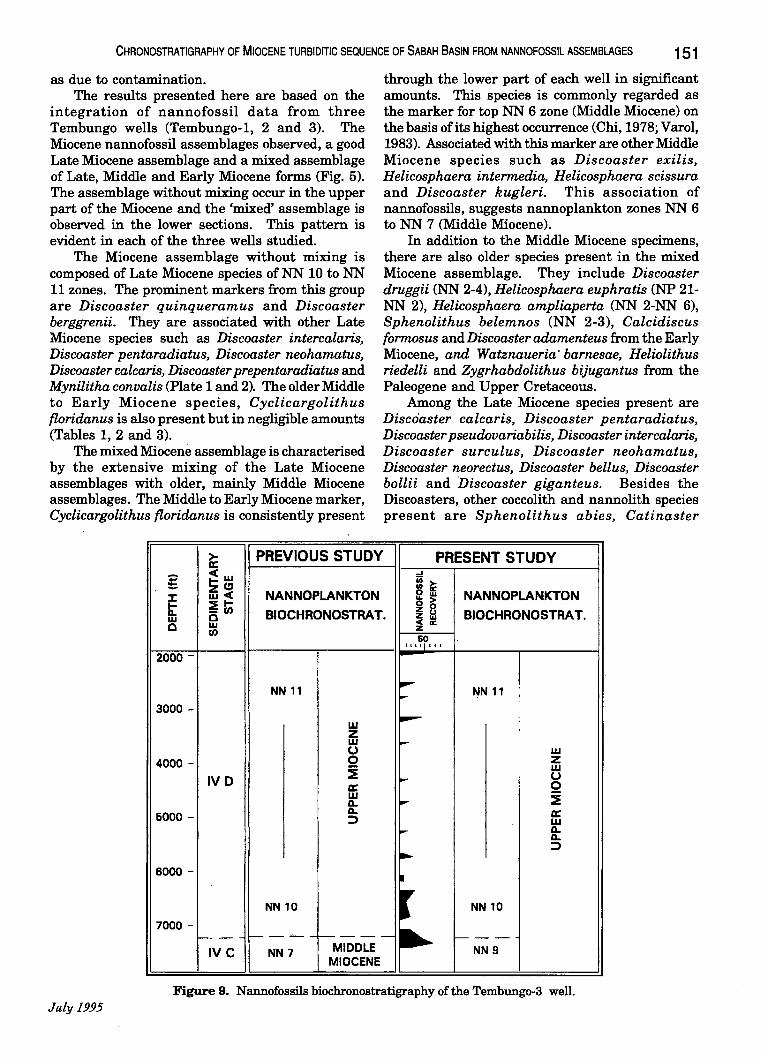
The nannofossil analyses ofTembungo-1, 2 and 3 have contributed partly to the establishment of the biochronology of the area, together with palynology and foraminiferal studies. Through corroboration of the three disciplines, the chronostratigraphy of the Tembungo area was established. The lowermost interval in each of the three wells studied was interpreted as Middle Miocene (Figs. 7, 8 and 9). This was achieved through the interpretation of NN 6 and NN 7 nannoplankton zones, N 13 or N 14 foraminiferal zones and palynological partial range zone Magnastriatites howardii. The occurrence of younger NN 9 and NN 10 nannofossil marker species within the basal intervals was interpreted
146
(a)
A
2 fIJ
i ~ 4 fIJ
6
(b)
SAlAH TROUGH
THRUST ZONE
South China Sea
.. ---. . '\. ... ,1 SARAWAK
LEGEND:
Intrusive
Extrusive
MOHO RAZALI CHE KOB AND MAHANI MOHAMED
I EXTENSIONAL ZONE
SAIAHIASIN
BASEMENT FAULTING
Neogene
Foldbelt
G. KINABALU
PALEOGENE FOLDBELT
Sulu Sea
o km 100
B
I ~ I· AnticiinelUpthNSt ~ ~ rvvvvl ~ ~ I!...!..!...!J Jurassic basement Major sedimentary fault
Figure 2. a) Regional cross section along A-B line. b) Schematic geological map of Sa bah (modified after Bol and van Hoom, 1980).
Geol. Soc. MalaYJia, Bulletin 37
CHRONOSTRATIGRAPHY OF MIOCENE TURBIDITIC SEQUENCE OF SABAH BASIN FROM NANNOFOSSIL ASSEMBLAGES 147
SED. STAGES
'" ~
w Z w U o
c:( w
SOUTH FURIOUS
ST. JOSEPH I BUNBURY
C!l NORTH SABAH
SED. STAGES
'"
II
JuLy 1995
::::; o
UJ Z w U o C!l ::::;
NW SAMARANG LABUAN
SYNCLINE SABAH RIDGES SE
~~--
UPPER MIOCENE PHASE
SOUTH AND CENTRAL SABAH
LEGEND; a@ BATHYAL - NERITIC 1"':\:)::1 COASTAL - COASTAL PLAIN
Figure 3. Generalized time stratigraphy of Sabah Basin.
148
,
DEPTH
6000 _
- ~ 6400 -
- r- 2000
6800 -~ -
7200 - 1-2200
- -7600 -
- _2400 8000 -
- -8400 -
- r-2600
(ft) (m)
DEPTH (tt) 50
2000
3000
4000
5000
6000
7000
MOHO RAZAu CHE KOB AND MAHANI MOHAMED
TEMBUNGO WELL LITHOSTRATIGRAPHY
4 2 5 1 6 3 Alterations
1\ r ~ t ~ sandstone and
t ~ claystone
)
oC Mainly
~ Claystone
........ ... IVD \. ~
t-Tembungo Sand Group -, I"'" -
~V ~~ r\ iii Interbedded sandstone ~
~ ~V! 1 and Claystone
Ii < ~ ( 1 )11\. c Submarine fan to 1
12 j~ ~~ \~ continental slope deposit
......... ~ f ~ f ~
I"", Claystone with minor sandstone
I' - IVC Deep marine deposit
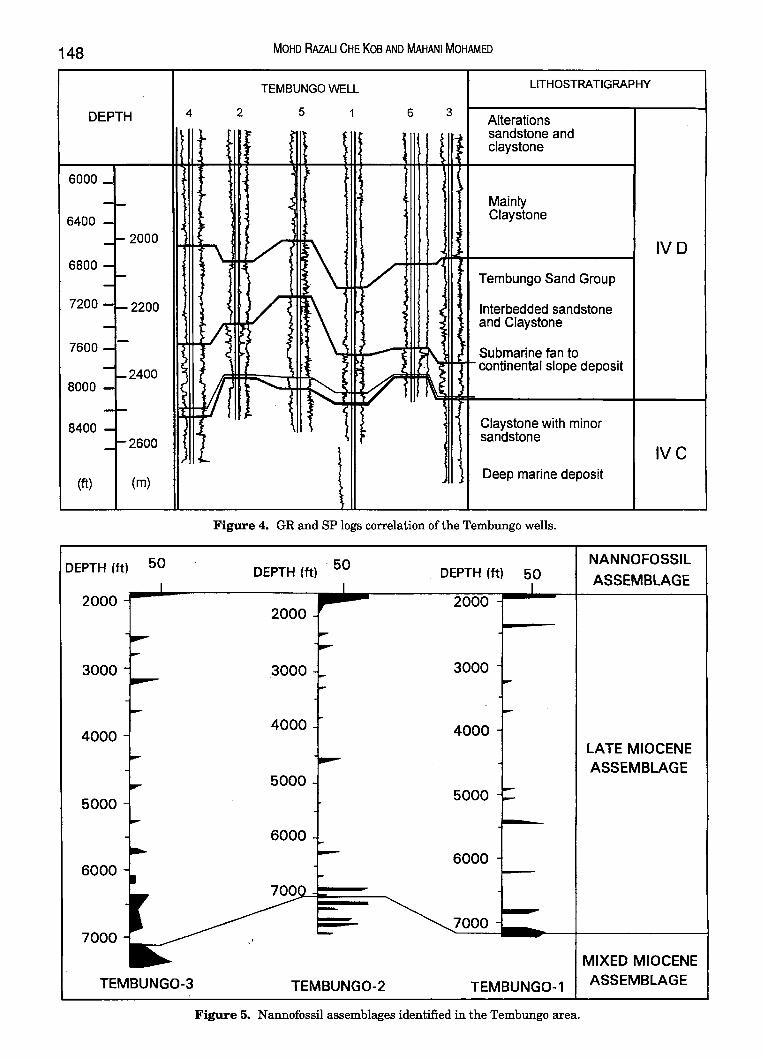
Figure 4. GR and SP logs correlation of the Tembungo wells.
DEPTH (ttl . 50
2000
.3000
4000
5000
6000
DEPTH (tt) 50
2000
3000
4000
5000
6000
7000
NANNOFOSSIL
ASSEMBLAGE
LATE MIOCENE ASSEMBLAGE
TEMBUNGO-3 TEMBUNGO-2 TEMBUNGO-1
MIXED MIOCENE ASSEMBLAGE
Figure 5. Nannofossil assemblages identified in the Tembungo area.
CHRONOSTRATIGRAPHY OF MIOCENE TURBIDITIC SEQUENCE OF SABAH BASIN FROM NANNOFOSSIL ASSEMBLAGES 149
TEMBUNGO-l
DEPTH (ft)
5660 - 5680 6580 - 6590 6242 - 6242 6810 - 6810 6812 - 6812 7020 - 7040 7120-7140 7220 -7240
TEMBUNGO-2
DEPTH (ft)
7150 - 7160 7220-7230 7290-7300 7350-7360 7400-7405 7465 -7470 7495 - 7500 7525 -7530 7540 -7555 7585 - 7590
TEMBUNGO-3
DEPTH 1ft)
6480 - 6500
6590 - 6640
6860 - 6880
7180 -7200
7360 -7380
7420 -7440
7480 - 7500
o
(s)
(a)
CJ1 0
lal
LATE MIOCENE
o o
(b)
LATE MIOCENE
o ""
(b)
LATE MIOCENE .. .. CJ1 0 o <II
(b)
MIDDLE MIOCENE .. o 0
(e) (d)
MIDDLE MIOCENE
<XI o .. "" Ol 0 ..
(e) (d)
MIDDLE MIOCENE .. .. o o CJ1 o o <II o
(e) (d)
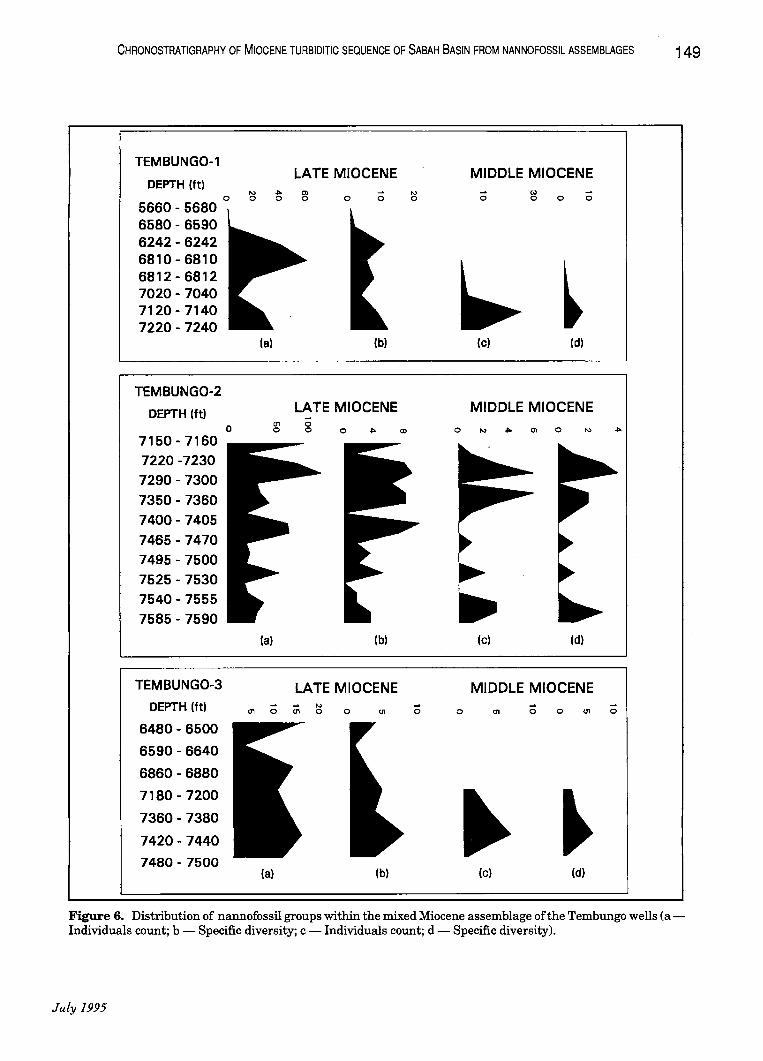
Figure 6. Distribution of nannofossil groups within the mixed Miocene assemblage of the Tembungo wells (aIndividuals count; b - Specific diversity; c·- Individuals count; d - Specific diversity).
July 1995

150 MOHO RAzAu CHE KOB AND MAHANI MOHAMED
> PREVIOUS STUDY PRESENT STUDY
~ II:
"" ~w 1/1 1/1 ~ :I: ZCJ NANi\lOPLANKTON Ii! !t NANNOPLANKTON t: ~~ o 0
BIOCHRONOSTRAT. 2 u BIOCHRONOSTRAT. w 5C1l 2 1&1 Q w ~ a:
rn 8fl 2000
NN 11 NN 11
3000 -w - w
4000 Z z IVD w w
U - U 0 0 ~ ~ a: ~ a:
5000 w ~ W D. D. D. D. :::) :::)
6000 ~
NN 10 NN 10 f--- -----7000 Ive ---- MIDDLE ---
NN7 MIOCENE NN9
Figure 7. Nannofossils biochronostratigraphy of the Tembungo-l well.
~ PREVIOUS STUDY PRESENT STUDY
g ~ d W 1/1 >
Z CJ 1/1 a: l: w
~ NANNOPLANKTON Ii! 1&1 NANNOPLANKTON
Ii: :E 0> BIOCHRONOSTRAT. 28 BIOCHRONOSTRA T. 5 rn 21&1 W
~ a: a w rn ~
2000-,.....
NN '1 ~ NN l' - ~
3000- l-I--
w w Z z 4000- w w
IVO u u 0 0 - :i
~ :i II: II: W w
5000- e.. e.. e.. e.. ::l ::l -
6000- i-~
- NN 10 NN 1~ i-
7000- t------------- ----~ 1----
- IVC MIDDLE ---NN6 MIOCENE - NN 9
Figure 8. Nannofossils biochronostratigraphy of the Tembungo-2 well. Geol. Soc. MaiaYJia, Bulletin 37
CHRONOSTRATIGRAPHY OF MIOCENE TURBIDITIC SEQUENCE OF SABAH BASIN FROM NANNOFOSSIL ASSEMBLAGES 151
as due to contamination. The results presented here are based on the
integration of nannofossil data from three Tembungo wells (Tembungo-1, 2 and 3). The Miocene nannofossil assemblages observed, a good Late Miocene assemblage and a mixed assemblage of Late, Middle and Early Miocene forms (Fig. 5). The assemblage without mixing occur in the upper part of the Miocene and the 'mixed' assemblage is observed in the lower sections. This pattern is evident in each of the three wells studied.
The Miocene assemblage without mixing is composed of Late Miocene species of NN 10 to NN 11 zones. The prominent markers from this group are Discoaster quinqueramus and Discoaster berggrenii. They are associated with other Late Miocene species such as Discoaster intercalaris, Discoaster pentaradiatus, Discoaster neohamatus, . Discoaster calcaris, Discoaster prepentaradiatus and Mynilitha convalis (Plate 1 and 2). The older Middle to Early Miocene species, Cyclicargolithus floridanus is also present but in negligible amounts (Tables 1, 2 and 3).
The mixed Miocene assemblage is characterised by the extensive mixing of the Late Miocene assemblages with older, mainly Middle Miocene assemblages. The Middle to Early Miocene marker, Cyclicargolithus floridanus is consistently present
through the lower part of each well in significant amounts. This species is commonly regarded as the marker for top NN 6 zone (Middle Miocene) on the basis ofits highest occurrence (Chi, 1978; Varol, 1983). Associated with this marker are other Middle Miocene species such as Discoaster exilis, Helicosphaera intermedia, Helicosphaera scissura and Discoaster kugleri. This association of nannofossils, suggests nannoplankton zones NN 6 to NN 7 (Middle Miocene).
In addition to the Middle Miocene specimens, there are also older species present in the mixed Miocene assemblage. They include Discoaster druggii (NN 2-4), Helicosphaera euphratis (NP 21-NN 2), Helicosphaera ampliaperta (NN 2-NN 6), Sphenolithus belemnos (NN 2-3), Calcidiscus formosus and Discoaster adamenteus from the Early Miocene, and Watznaueria' barnesae, Heliolithus riedelli and Zygrhabdolithus bijugantus from the Paleogene and Upper Cretaceous.
Among the Late Miocene species present are Discoaster calcaris, Discoaster pentaradiatus, Discoaster pseudovariabilis, Discoaster intercalaris, Discoaster surculus, Discoaster neohamatus, Discoaster neorectus, Discoaster bellus, Discoaster bollii and Discoaster giganteus. Besides the Discoasters, other coccolith and nannolith species present are Sphenolithus abies, Catinaster
~ PREVIOUS STUDY PRESENT STUDY g ~w
~ z" ~ w~ NANNOPLANKTON ~ NANNOPLANKTON
~fI) BIOCHRONOSTRAT. ~ BIOCHRONOSTRA T. w c c W II:
fI)
'" if" , 2000 -
NN 11 ......
~N 11 ... 3000 -
w .--Z w -0 w
4000 - 0 z :i w
IVO ... u a: 0 w .... :i Q.
6000 -Q. a: ;:) w ... Q.
Q. ;:)
• 6000 -
I
NN 10 r NN 10
7000--- -- --------
~ ---
Ive NN 7 MIDDLE NN 9 MIOCENE
Figure 9. Nannofossils hiochronostratigraphy of the Temhungo-3 well. July 1995
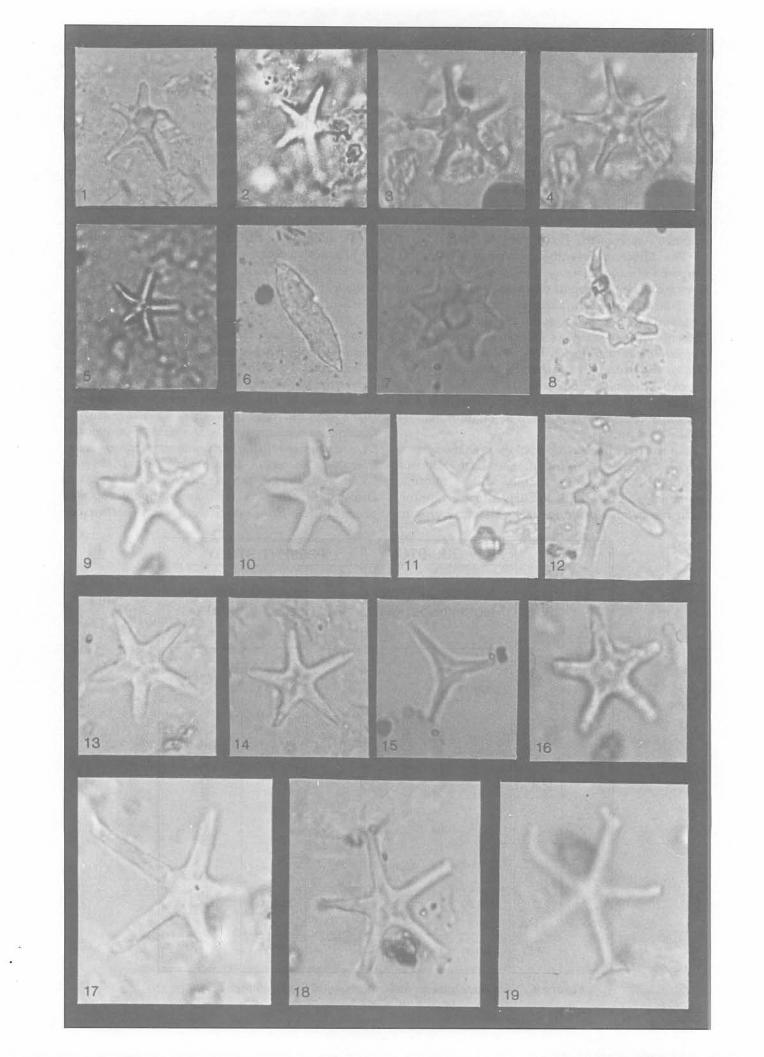
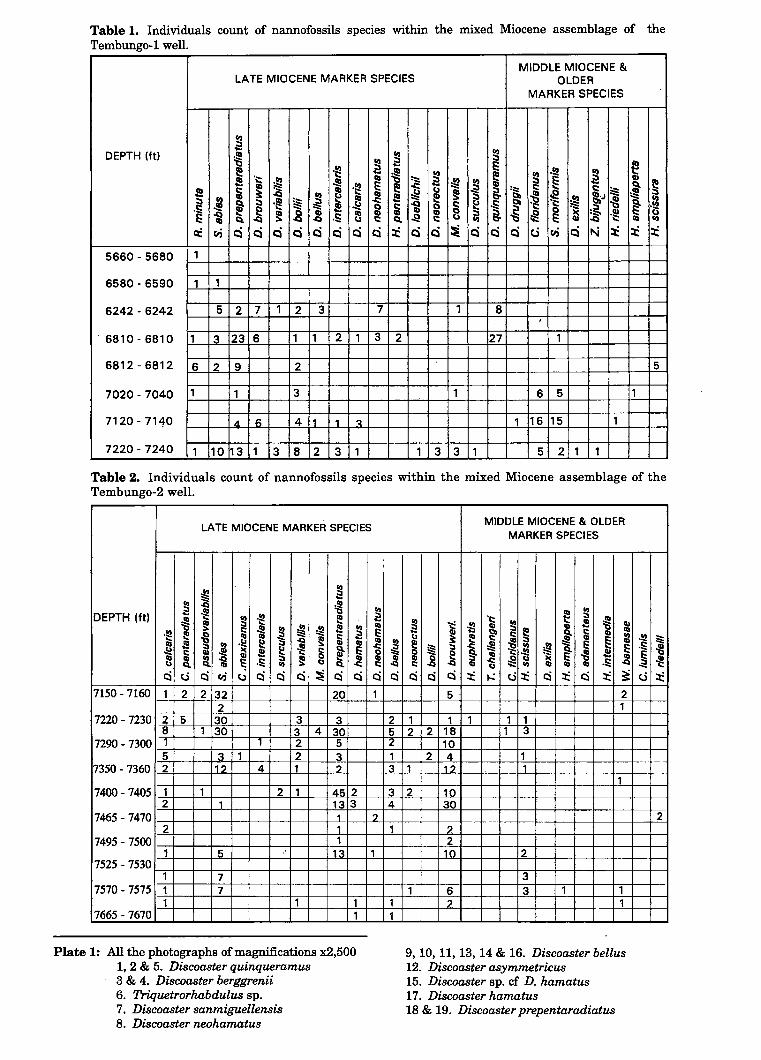
Table 1. Individuals count of nannofossils species within the mixed Miocene assemblage of the Tembungo-1 well.
MIDDLE MIOCENE & LATE MIOCENE MARKER SPECIES OLDER
MARKER SPECIES
~ !: DEPTH (ft) .S!
~ ~ 't::i .~ ~ g i .S!
~ !: .!2 ~ '1:: ·12 oS! .f! ~ 1 ~ 1 !: ~ g, ~ s i ; ~ III U i =i i c:: ....
~ :::a II) :::a .~ :;:::: !: e rl .@ s :::: I! 1 ~ ~ ~. &.1 ) .~ ·s :I ~ ~ :::e :::e .e '0;0
~ i i ~ 8 ·s i ~ .~ ~ e III c:a. ~ .8 ! ·s ! c:a. Ji! ;} i ~ ~ :a '1:: III fA Ii fIj r:l r:l r:l r:l r:l r:l r:l r:l ~ r:l r:l ~ r:l r:l r:l ti fIj r:l I'.j ~ ~ ~
5660 - 5680 1
6580 - 6590 1 1
6242 - 6242 5 2 7 1 2 3 7 1 8 I
. 6810 - 6810 1 3 23 6 1 1 2 1 3 2 27 1
6812-6812 6 2 9 2 5'
7020 - 7040 1 1 3 1 6 5 1
7120-7140 .II. B 4 11 1 It 1 16 15 1
7220 -7240 1 10 13 1 3 8 2 3 1 1 3 3 1 5 2 1 1 I
Table 2. Individuals count of nannofossils species within the mixed Miocene assemblage of the Tembungo-2 well.
LATE MIOCENE MARKER SPECIES
.!!! ~ ~
~ .q ~ DEPTH (ft) .!!! 'I! !g ~ I!
'ti ~ .f!! ~ S ~ 'r! I! 5i ~ g a == 51 iii S 1 ., .5! e ~ oQ ~ I ~ -I! § ! J.! c:: III .a ~ S :J I a1 ~ ~ ·s ., c:i Cj c:i fIj 0 c:i c:i c:i :!! c:i c:i
7150 -7160 1 2 2 32 20 2
7220 -7230 2 5 30 3 3 8 1 30 3 4 30
7290 -7300 1 1 2 5 5 3 1 2 3
7350 -7360 2 12 4 1 2
7400-7405 1 1 2 1 45 2 2 1 13 3
7465 -7470 1 2 1
7495 -7500 1 1 5 13
7525 -7530 1 7
7570 -7575 1 7 1 1 1
7665 -7670 1
Plate 1: All the photographs of magnifications x2,500 1, 2 & 5. Discoaster quinqueramus 3 & 4. Discoaster berggrenii 6. Triquetrorhabdulus sp. 7. Discoaster sanmiguellensis 8. Discoaster neohamatus
~
I !g a ::;: ~ ! c:i c:i 1
2 5 2 1 3
3 4
2 1
1
1 1
MIDDLE MIOCENE & OLDER MARKER SPECIES
!g '1:: ~ ~ ~ GI !g CD S CD
111 ~ -! ; ~ c: ~ i- 51 ~ e !!:: I! :! ·12 ,!!! :!., .f!! l ~ ..c:: j .~ ::;, a == ~ §- iii l:o!!! ~ s ~ ,g ~~ ~ 't:i
II) '5 iii III ·s c:i c:i c:i :t ....: Cj:t c:i :t c:i :t ~
5· 2 1
1 1 1 1 1 2 2 18 1 3
10 2 4 1
1 12 1 1
2 10 30
2 2
10 2
3 1 6 3 1 1
2 1
9, 10, 11, 13, 14 & 16. Discoaster bellus 12. Discoaster asymmetricus 15. Discoaster sp. cf D. hamatus 17. Discoaster hamatus 18 & 19. Discoaster prepentaradiatus
... Cj
!!::
i .~
:t
2
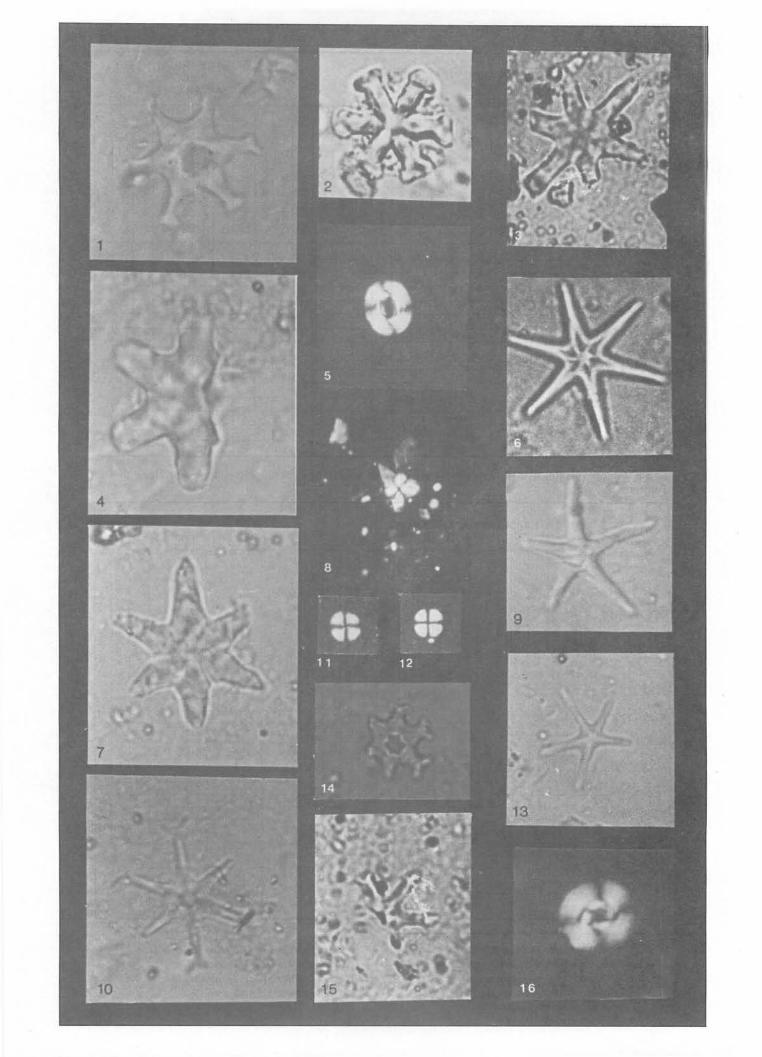
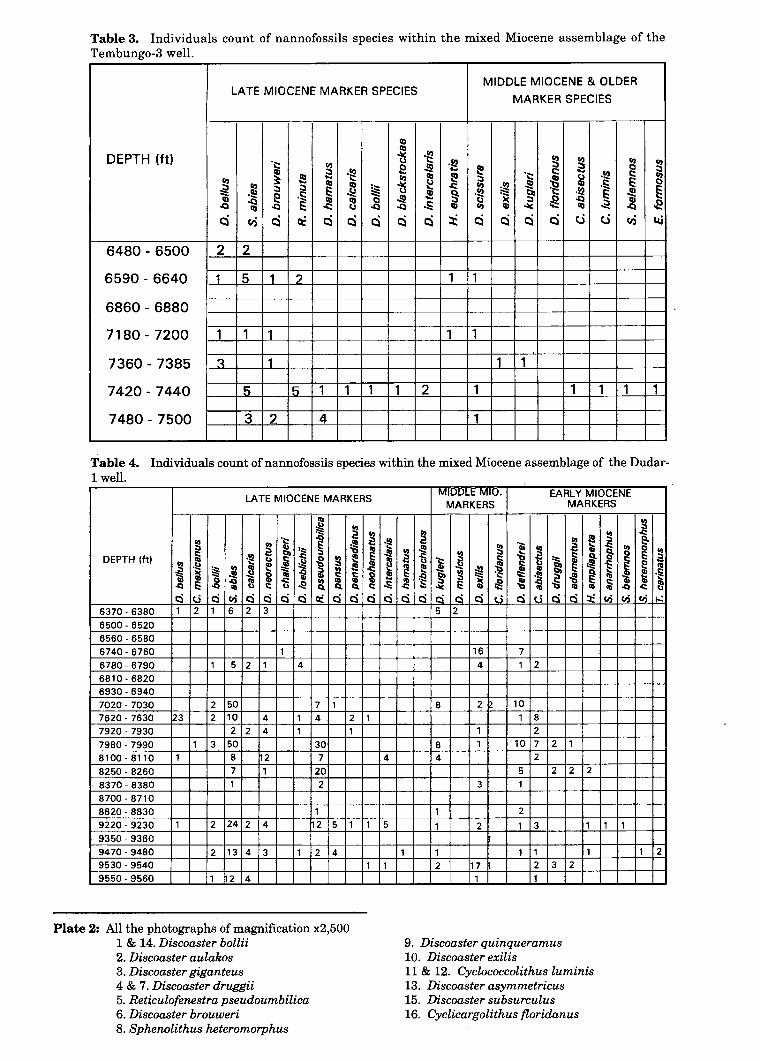
Table 3. Individuals count of nannofossils species within the mixed Miocene assemblage of the Tembungo-3 well.
MIDDLE MIOCENE & OLDER LATE MIOCENE MARKER SPECIES
MARKER SPECIES
CD
DEPTH (ft) -= .~ ! ~ 'c:; ! u -! ~ !
~ .~ S .!!! ~ 'c:; c:: .!! ~ ! .I!! ... .:l rJ ~ ~ ~ II)
II) j rJ .~ .!! .!!! .S: 0 :) ;:, :;:: ...
~ :::: .111 .s: :::: u !! g. :;: ~ 'c:; .!! § .!!!
CD .Cj ~ i .8 .!! ~ ~ ~ oQ CD oQ II) E: oQ .S: 111 --= ca .... oQ .e c:i ~ c:i Q:! c:i c:i c:i c:i c:i ~ c:i c:i c:i c:i ti ti ~ L&;
6480 - 6500 2 2
6590 - 6640 1 5 1 ? 1 1
6860 - 6880
7180 - 7200 1 1 1 1 1
7360 - 7385 ~ 1 1 1
7420 - 7440 5 5 1 1 1 1 2 1 1 1 1 1
7480 - 7500 3 2 4 1
Table 4. Individuals count of nannofossils species within the mixed Miocene assemblage of the Dudar-1 well.
LATE MIOCENE MARKERS
.~ ~ I ~ ~
0& .!!!
~ ~ ~ 1 DEPTH (tt) .! i ~ .g ~ ! '1 I;:: .~ !! I! :::;:
I ,.,
~ :::; Ii .! 11 Ii i .8 ~ t'J .Q .Q c:: u Q. Q.
c:i t.S c:i fIi c:i c:i c:i c:i ~ c:i c:i 6370- 6380 1 2 1 6 2 3
6500- 6520 6560 - 6580 6740- 6760 1 6780- 6790 1 5 2 1 4 6810 - 6820 6930- 6940 7020 - 7030 2 50 7 1 7620 - 7630 23 2 10 4 1 4 2 7920- 7930 2 2 4 1 1 7980 - 7990 1 3 50 30 8100 - 8110 1 8 2 7 8250 - 8260 7 1 20 8370- 8380 1 2 8700 - 8710 8820 - 8830 1 9220 - 9230 1 2 24 2 4 2 5 1 9350 - 9360 9470 - 9480 2 13 4 3 1 2 4 9530- 9540 9550- 9560 1 2 4
Plate 2: All the photographs of magnification x2,500 1 & 14. Discooster bollii 2. Discooster aulakos 3. Discooster giganteus 4 & 7. Discoaster druggii 5. Reticulofenestra pseudoumbilica 6. Discooster brouweri 8. Sphenolithus heteromorphus
~ ~ ~ 2 c:: c:i
1
1
1
.!II iii ~ l!! ·s c:i
4
5
1
MIDDLE MID. EARLY MIOCENE MARKERS MARKERS
~ ·iii ~
.!!!
.~ !l
~ J "5 i Ii :;:::
~ I! .!II :J:! ~ i ~ ~
"'S. ~ ':Ii to;; ~ i ~ ~ E ~ .g -t III
c:i c:i c:i c:i c:i u c:i (I ci 5 2
16 7 4 1 2
8 22 10 1 8
1 2
8 1 10 7 2 4 2
5 2 3 1
1 2
1 2 1 3
1 1 1 1 2 17 2 3
1 1
9. Discoaster quinqueramus 10. Discoaster exilis
~ ~ ~ .i I ~
18
c:i :x:
1
2 2
1
1 2
11 & 12. Cyclococcolithus luminis 13. Discoaster asymmetricus 15. Discoaster subsurculus 16. Cyclicargolithus floridanus
~ .c:: 2-1: iii fi
lIS
1
~
~ Qi .Q
lIS
1
~ .c:: e. ~ ~ e III l!! .~ QI l! .c::
lIS t-:
1 2
DEPTH (ft)
1920 - 1950
4080 - 4110
4620 - 4650
4890 - 4920
5430 - 5460
5940 - 5970
6380 - 6400
6560 - 6590
6760 - 6780
6930 - 6940
7620 - 7630
8010 - 8020
8280 - 8290
8730 - 8740
9220 - 9230
9490 - 9500
... NANNOFOSSI
EMBLAGE
LATE MIOCENE
ASSEMBLAGE
MIXED MIOCENE
ASSEMBLAGE
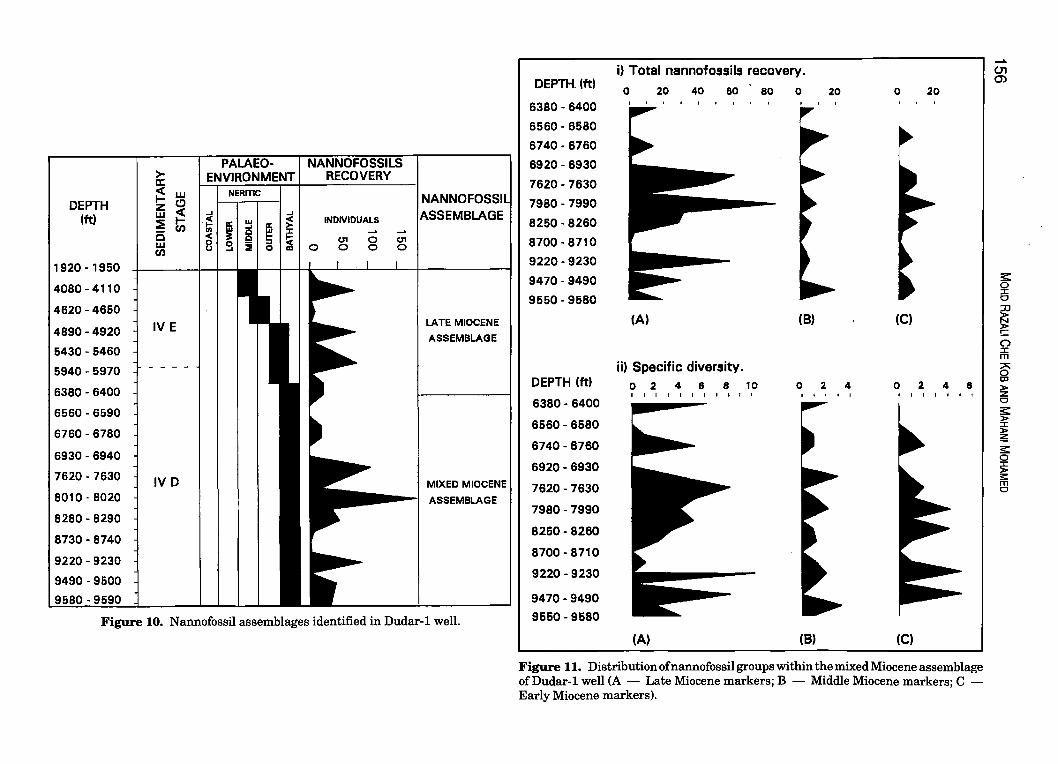
Figure 10. Nannofossil assemblages identified in Dudar-l well.
i) Total nannofossils recovery. DEPTH. (ft)
0 20 40 60
6380 - 6400
6560·6580
6740·6760
6920 - 6930
7620 - 7630
7980 -7990
8250·8260
8700·8710
9220 - 9230
9470·9490
9550·9580
(A)
ii) Specific diversity. DEPTH (ft) 0 2 4 8 8 10
6380 - 6400
6560 - 6580
6740 - 6760
6920 - 6930
7620 - 7630
7980 -7990
8250 - 8260
8700 - 8710
9220 - 9230
9470 - 9490
9550 - 9580
I I I I I I I I I I I
(A)
80 0 20
(B)
024
(8)
0 20
(C)
o 2 4 8 I I
(C)
Figure 11. Distribution of nannofossil groups within the mixed Miocene assemblage ofDudar-l well (A - Late Miocene markers; B - Middle Miocene markers; C -Early Miocene markers).
...... 01 0')
:s::: o :r: o
~ (") :r: m
6 ID » z o
~ s; ~
:s:::
~ m o
CHRONOSTRATIGRAPHY OF MIOCENE TURBIDITIC SEQUENCE OF SABAH BASIN FROM NANNOFOSSIL ASSEMBLAGES 157
mexicanus, Mynilitha convalis and Reticulofenestra spp. Most of the Discoasters recovered, appear as non-typical forms which sometimes are very difficult to identify. They seem to have undergone partial dissolution which has altered their original outline. They are therefore morphologically different from those forms observed above where pre-Late Miocene nannofossils are virtually absent.
The present conclusion for the age of the lowermost interval of the Tembungo wells is based on the quantitative nannofossil data. These data permit the differentiation between the indigenous forms and the contaminants. The high individual frequency, specific diversity and preservational evidence for dissolution are taken as criteria for determining the indigenous assemblage. The Late Miocene nannofossil forms within the mixed Miocene assemblage are dominant in each the studied wells (Fig. 6). Their individual frequency and specific diversity are higher than that of older nannofossil groups and because of this , it is concluded that the Late Miocene nannofossils assemblages are indigenous and that the older forms are the result of reworking. By considering the species content within the Late Miocene assemblage, the appropriate nannoplankton
PREVIOUS STUDY
zonation for this interval is NN 9 zone.
B) Dudar-1 Well
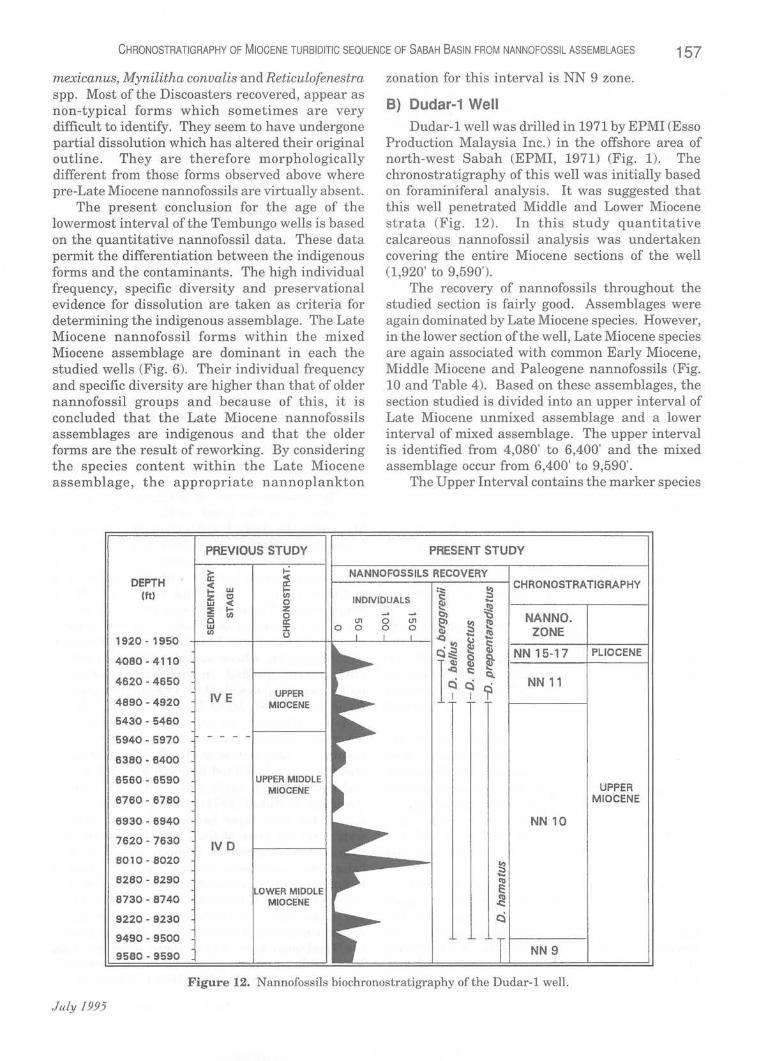
Dudar-1 well was drilled in 1971 by EPMI (Esso Production Malaysia Inc.) in the offshore area of north-west Sabah (EPMI, 1971) (Fig. 1). The chronostratigraphy of this well was initially based on foraminiferal analysis. It was suggested that this well penetrated Middle and Lower Miocene strata (Fig. 12). In this study quantitative calcareous nannofossil analysis was undertaken covering the entire Miocene sections of the well (1,920' to 9,590').
The recovery of nannofossils throughout the studied section is fairly good. Assemblages were again dominated by Late Miocene species. However, in the lower section of the well, Late Miocene species are again associated with common Early Miocene, Middle Miocene and Paleogene nannofossils (Fig. 10 and Table 4). Based on these assemblages, the section studied is divided into an upper interval of Late Miocene unmixed assemblage and a lower interval of mixed assemblage. The upper interval is identified from 4,080' to 6,400' and the mixed assemblage occur from 6,400' to 9,590'.
The Upper Interval contains the marker species
PRESENT STUDY
DEPTH (ft)
r--------,-------i CHRONOSTRATIGRAPHY :::: ~
JuLy 1995
1920 - 1950
4080 - 4110
4620 - 4650
4890 - 4920
5430 - 5460
5940 - 5970
6380 - 6400
6560 - 6590
6760 - 6780
6930 - 6940
7620 - 7630
8010 - 8020
8280 - 8290
8730 - 8740
9220 - 9230
9490 - 9500
9580 - 9590
IV E
IV D
UPPER MIOCENE
UPPER MIDDLE MIOCENE
R MIDDLE MIOCENE
0
INDIVIDUALS ~ ... ~ ~
~ U1 0 U1 0 0 0
~ ~ .~
Q::::::
H
... . !!! ~
~ ~ ... ~ ~ ~ 2 ~ c: Q.
c::i c? I
NANNO. ZONE
NN 11
NN 10
NN 9
Figure 12. Nannofossils biochronostr atigraphy of the Dudar-l well.
UPPER MIOCENE
158 MOHO RAZALI CHE KOB AND MAHANI MOHAMED
Discoaster berggrenii, Discoaster quinqueramus, Discoaster bellus and Discoaster neorectus. On the basis of these forms, the interval can be divided into two zones, zones NN 11 and NN 10 of Upper Miocene (Fig. 12).
Quantitative nannofossil analysis on the lower mixed interval shows traces of major assemblages of Late Miocene, Middle Miocene and Early Miocene (Fig. 11 and Table 4). Older Paleogene specimens are also present, but in minor quantities.
Comparison of the diversity and frequency of the above groups clearly shows the dominance of the Late Miocene assemblage over the other two assemblages, and suggests that the more diverse Late Miocene assemblage is indigenous and that the other two groups are due to reworking (Fig. 11).
Examination of the Late Miocene assemblages suggest that the mixed interval can be referred to the following nannofossil zones: the interval from 4,890' to 9,500' is assigned to zone NN 10 by the presence of Discoaster neorectus, Discoaster bellus, Discoaster neohamatus, Discoaster calcaris, Discoaster loeblichii, Discoaster bollii and Catinaster mexican us , whereas the underlying interval from 9,490' to 9,590' is assigned to zone NN 9 by the presence of Discoaster hamatus (Fig. 12).
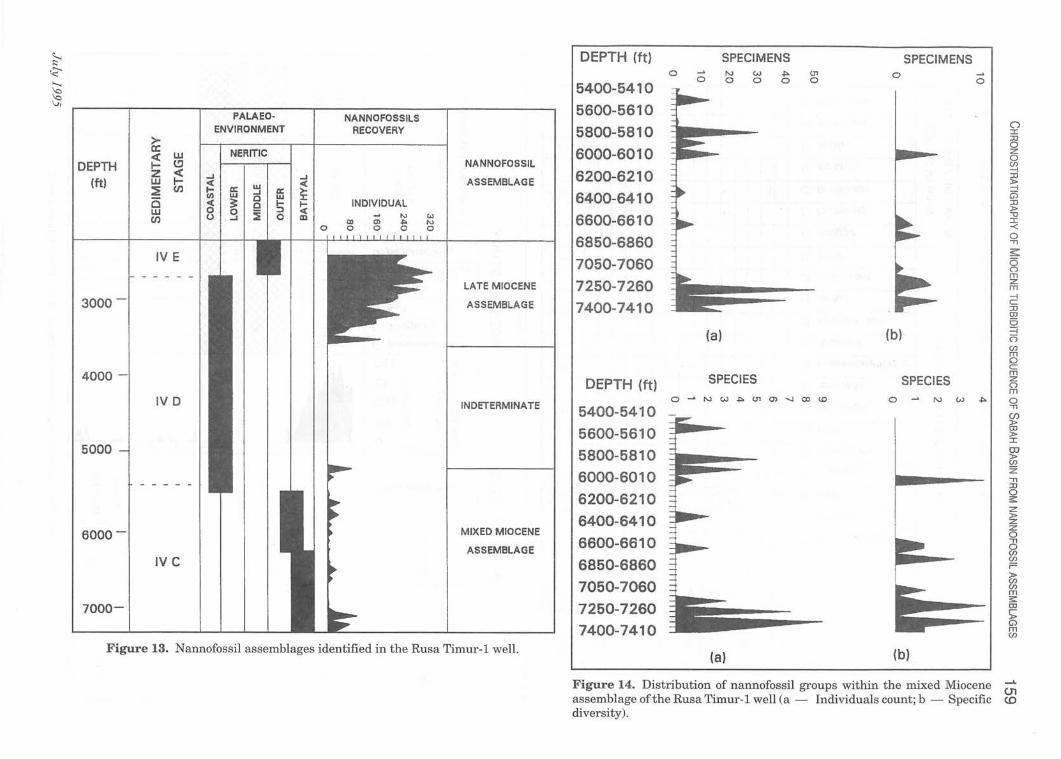
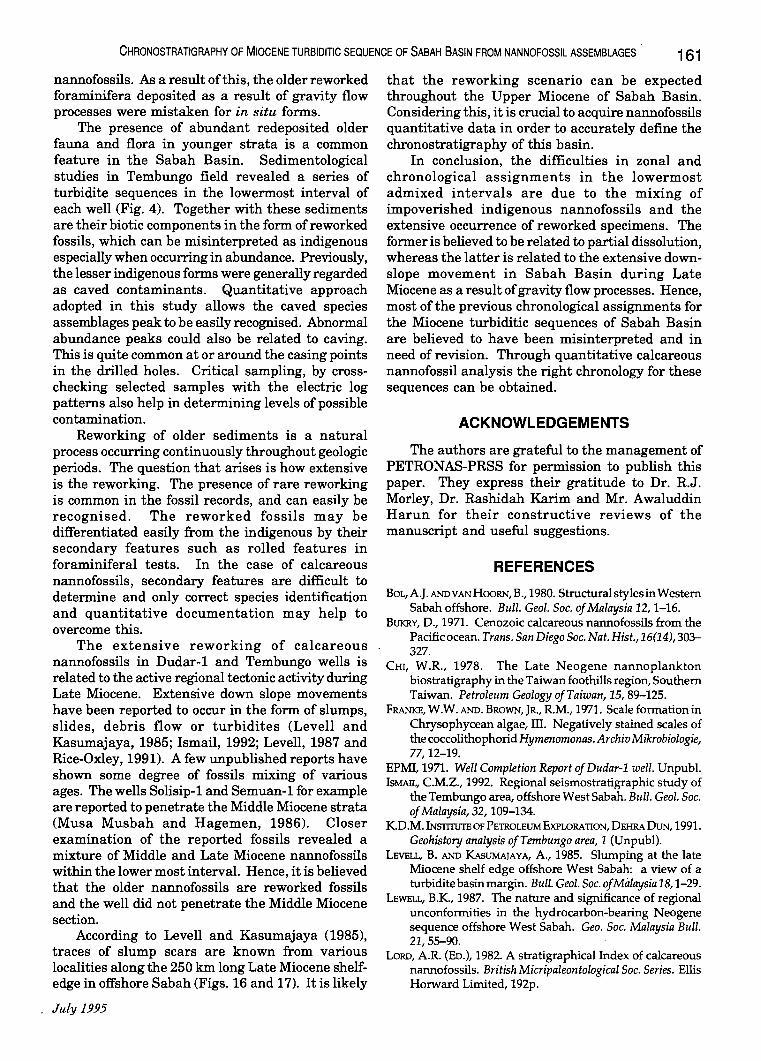
C) Rusa Timur-1 The Rusa Timur-l was drilled by British Gas
Malaysia in 1990. The well has been reported to penetrate the substage IV A of Middle Miocene age through an integrated biostratigraphical analysis, involving mainly foraminifera and calcareous nannofossils (Fig. 15).
In general, the calcareous nannofossils recovery is good (Fig. 13). They are more abundant in the upper section of the well from 1,420'-3,510' but they are comparatively scarce in the lowermost interval, from 5,500'-7,450'. This lower interval is separated from the upper interval by an interval without nannofossils recovery.
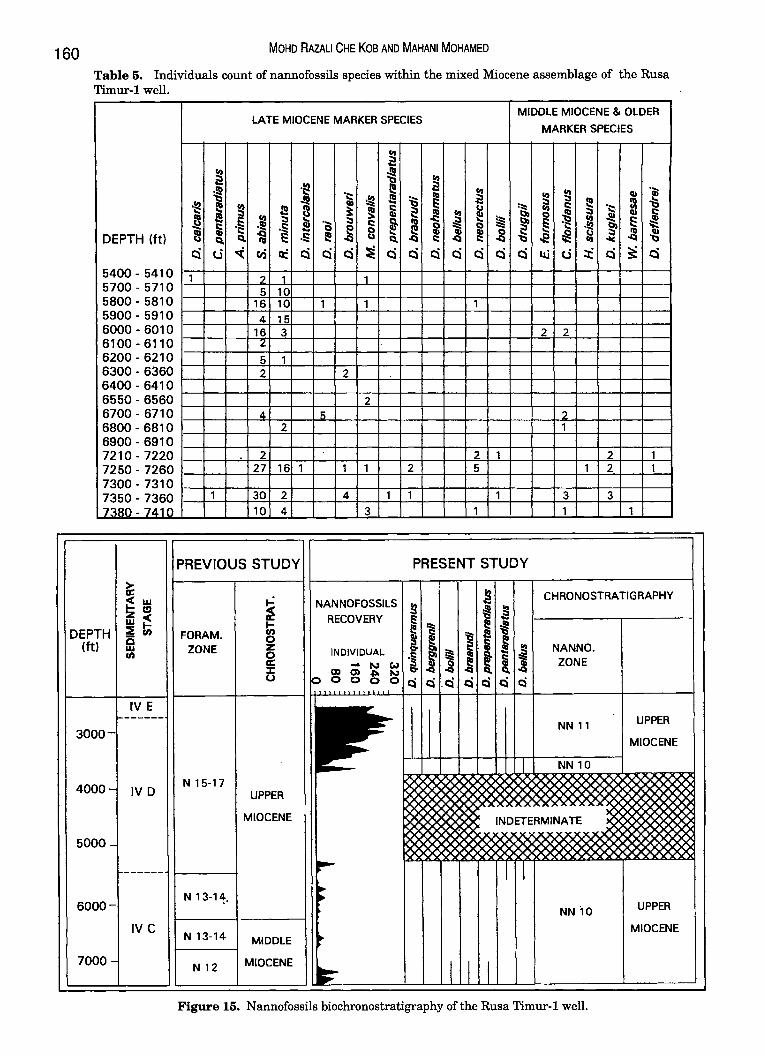
The upper fossiliferous interVal, is dominated by Late Miocene species. This interval is assigned to NN 11 zone by the dominance of Discoaster quinqueramus. Other Late Miocene forms present are Discoaster berggrenii, Discoaster pentaradiatus, Sphenolithus abies and Discoaster brouweri (Table 5). Besides the Late Miocene species, the Middle Miocene species, Cyclicargolithus floridanus is also present, but rare.
The lower interval is characterised by comparatively rare nannofossils, which are again dominated by a Late Miocene assemblage (Fig. 14). Late Miocene species present are Discoaster neorectus, Mynilitha convalis, Discoaster bollii, Discoaster intercalaris, Discoaster prepentaradiatus, Discoaster calcaris, Discoaster braarudi and
Tetralithoides symmeonidesii. Older nannofossil species are also present. These include Cyclicargolithus floridanus and Discoaster kugleri. Considering the higher specific diversity and
·individual frequency of the components of the Late Miocene assemblage, this interval is assigned to zone NN 10.
DISCUSSION AND CONCLUSION
There are two obvious nannofossil assemblages in the Upper Miocene of the studied wells; the 'unmixed' and the mixed Miocene assemblage. The unmixed assemblage that is found within the upper section of Upper Miocene sequence, reflects the true indigenous nannofossils content of the Upper Miocene with mInImUm contaminations. Accordingly, the chronostratigraphic interpretation of the upper section of Upper Miocene can be done without much difficulty. However, for the mixed lower sections, a reasonable chronostratigraphic interpretation is only possible with the aid of quantitative data. This is due to the presence of high amounts of reworked nannofossil specimens together with an impoverished indigenous assemblage.
The impoverishment of indigenous calcareous nannofossils in the lower sections of the Upper Miocene in the studied well is thought to be related to partial dissolution. By nature, the sea water in the neritic or bathyal environments is rich in calcareous nannoplankton and the underlying sediments can be expected to contain them abundantly. These have been proven from the study of nannofossil distributions in the modem environment and on a Late Quaternary section of Sabah margin, where samples from a bathyal environment yielded an enormous amount of indigenous nannofossils (Mohd Razali Che Kob and Basir Jasin, 1994; Mohd Razali Che Kob, 1993 a and b). However, in the studied sections the lowermost bathyal interval yielded a very small number of indigenous nannofossils. The specimens observed often exhibited incomplete morphologies and have suffered varying degrees of dissolution. According to Bukry (1971), dissolution takes place during the time lapse between death in surface water and the time of final burial below the sea floor. This phenomenon is more severe in other calcareous microfossil groups such as planktic foraminifera because they do not possess any organic celluloid shields as in nannofossils. In most cases, the in situ calcareous foraminiferal specimens are almost completely dissolved. This was observed in the Tembungo area, where there were few Late Miocene foraminifera preserved in the lowermost interval? but had significant amounts of
Geol. Soc. MalaYJia, Bulletin 57
:::.. DEPTH (ft) SPECIMENS SPECIMENS .§-- 0 ~ N W .po (J1 0 0 0 0 0 0 0 ....... 5400-5410 ~ 'vr 5600-5610 PALAEO- NANNOFOSSILS
0 ENVIRONMENT RECOVERY 5800-5810 :r: >- ;rJ
0 (t: NERITIC 6000-6010 z < w 0
DEPTH I- CJ NANNOFOSSIL C/l -l Z ~ ....J ....J 6200-6210 ;rJ
(ftl w « « ASSEMBLAGE > w -l ~ CJ'J I- a:: ....J a:: ~ 6400-6410 Q en w C w 0 «
== c l- I- INDIVIDUAL ;rJ > W 0 0 ~
::l « -u CJ'J U -' 0 III ~ '" (oJ 6600-6610 :r: Q) (J) .p. '" 0 0 0 0 0 -<
6850-6860 0
" IV E s:
7050-7060 6 (")
- - - - - m LATE MIOCENE 7250-7260 z
m -l
3000 ASSEMBl.AGE 7400-7410 c ;rJ OJ 6
(a) (b) =i 0 C/l m 0 c
4000 SPECIES m
DEPTH (ft) SPECIES z (") m
IVD o ~ N W .po (J"1 O>-...J CD CD 0 ~ N W .po 0 INDETERMINA TE 5400-5410 " - (J) >
5600-5610 OJ > :r:
5000 5800-5810 OJ > C/l
6000-6010 z " - - - - - ;rJ
6200-6210 0 ;;: z > 6400-6410 z z
6000- MIXED MIOCENE 0 6600-6610 " ASSEMBLAGE 0
C/l
IVC 6850-6860 C/l j=
> 7050-7060
C/l C/l m ;;:
7000- 7250-7260 OJ
~
7400-7410 Gl m C/l
Figure 13. Nannofossil assemblages identified in the Rusa Timur-l well. (a) (b)
Figure 14. Distribution of nannofossil groups within the mixed Miocene ...... 01
assemblage ofthe Rusa Timur-l well (a - Individuals count; b - Specific (0
diversity).
160 MOHO RAZALI CHE KOB AND MAHANI MOHAMED
Table 5. Individuals count of nannofossils species within the mixed Miocene assemblage of the Rusa Timur-1 well.
LATE MIOCENE MARKER SPECIES MIDDLE MIOCENE & OLDER
MARKER SPECIES
!S .... ~ • !!!
~ .!Q "t:i
.!!! ~ '; ~
j !S ~ ~ II) .~ "t:i .!Q .IS ~ ~ ~
.~ ~ ~ ....
:ii "t:i ~ .IS 1; i t.I .~ :g ',.. ~ ~
:::i ~ c: ~ S .§ In :::i :so ... e :;:: ~ .~ ..!! e .S! ' .. :::i e @" I: § .... i . ~ ·Iii ! Q e Q ~ Q :::::: ~ g» ...: ~ Ci ~
II) II) .8 ~ u ~ ~ DEPTH (ttl Cl. IS .~ I! oCI Cl. .a c: oCI c: "t:i .e .,.;; II) ..-: Q (j ~ CI:i a: Q cS Q ~ Q Q Q Q Q Q Q ~ (j :t Q ~ Q
5400 - 5410 1 2 1 1 5700 - 5710 5 10 5800 - 5810 16 10 1 1 1 I
5900 - 5910 4 15 6000 - 6010 16 3 2 2 6100 - 6110 "L
6200 - 6210 5 1 6300 - 6360 2 2 6400 - 6410 6550 - 6560 2 6700 - 6710 4 "
, 6800 - 6810 2 1 6900 - 6910 7210 - 7220 2 2 1 2 1 7250 - 7260 27 16 1 1 1 2 5 1 2 1
7300 - 7310 7350 - 7360 1 30 2 4 1 1 1 3 3
7380 - 7410 _ ~ 10 4 3 1 1 1
DEPTH (tt)
3000-
~ ~~ w~ ~(I)
fa (I)
IV E
4000-i IV D
5000 -
6000-
IV C
7000 -
PREVIOUS STUDY
FORAM. ZONE
N 15-17
N 13-14;.
N 13-14
N 12
i I-
~
~ ::z: u
UPPER
MIOCENE
MIDDLE
MIOCENE
PRESENT STUDY
NANNOFOSSILS RECOVERY
CHRONOSTRATIGRAPHY
INDIVIDUAL .E" ~!iii Ii· ~ ~ ~ ~g:.g~(l: o Q Q .Q Q Q ci ci
1fJ-Lll.U.l..LU..LLU.l-.
NANNO. ZONE
111111111 I ::: }~::E
r ~
~
{XXXXXXxxXXXXX.
" INDETERMINATE )0
(XX xxxxxx XYYV y_)C
NN 10
IIIII
UPPER
MIOCENE
Figure 15. Nannofossils biochronostratigraphy of the Rusa Timur-1 well.
CHRONOSTRATIGRAPHY OF MIOCENE TURBIDITIC SEQUENCE OF SABAH BASIN FROM NANNOFOSSIL ASSEMBLAGES' 161
nannofossils. As a result of this, the older reworked foraminifera deposited as a result of gravity flow processes were mistaken for in situ forms.
The presence of abundant redeposited older fauna and flora in younger strata is a common feature in the Sabah Basin. Sedimentological studies in Tembungo field revealed a series of turbidite sequences in the lowermost interval of each well (Fig. 4). Together with these sediments are their biotic components in the form of reworked fossils, which can be misinterpreted as indigenous especially when occurring in abundance. Previously, the lesser indigenous forms were generally regarded as caved contaminants. Quantitative approach adopted in this study allows the caved species assemblages peak to be easily recognised. Abnormal abundance peaks could also be related to caving. This is quite common at or around the casing points in the drilled holes. Critical sampling, by crosschecking selected samples with the electric log patterns also help in determining levels of possible contamination.
Reworking of older sediments is a natural process occurring continuously throughout geologic periods. The question that arises is how extensive is the reworking. The presence of rare reworking is common in the fossil records, and can easily be recognised. The reworked fossils may be differentiated easily from the indigenous by their secondary features such as rolled features in foraminiferal tests. In the case of calcareous nannofossils, secondary features are difficult to determine and only correct species identification and quantitative documentation may help to overcome this.
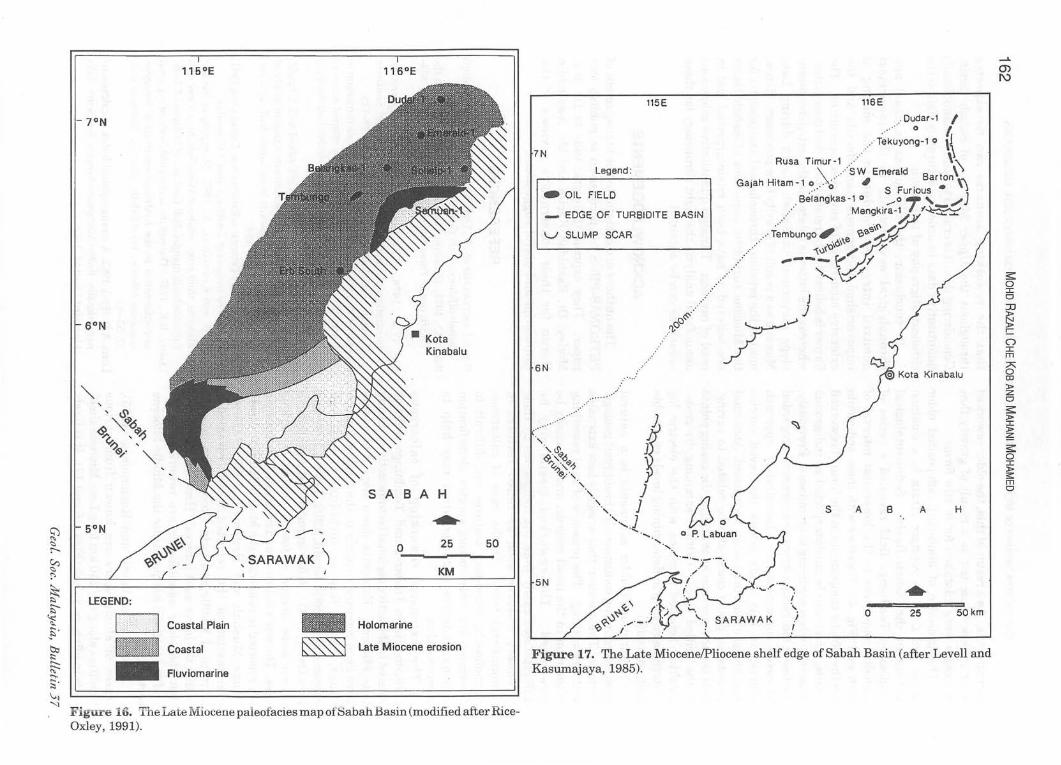
The extensive reworking of calcareous nannofossils in Dudar-l and Tembungo wells is related to the active regional tectonic activity during Late Miocene. Extensive down slope movements have been reported to occUr in the form of slumps, slides, debris flow or turbidites (Levell and Kasumajaya, 1985; Ismail, 1992; Levell, 1987 and Rice-Oxley, 1991). A few unpublished reports have shown some degree of fossils mixing of various ages. The wells Solisip-l and Semuan-l for example are reported to penetrate the Middle Miocene strata (Musa Musbah and Hagemen, 1986). Closer examination of the reported fossils revealed a mixture of Middle and Late Miocene nannofossils within the lower most interval. Hence, it is believed that the older nannofossils are reworked fossils and the well did not penetrate the Middle Miocene section.
According to Levell and Kasumajaya (1985), traces of slump scars are known from various localities along the 250 km long Late Miocene shelfedge in offshore Sabah (Figs. 16 and 17). It is likely
July 1995
that the reworking scenario can be expected throughout the Upper Miocene of Sabah Basin. Considering this, it is crucial to acquire nannofossils quantitative data in order to accurately define the chronostratigraphy of this basin.
In conclusion, the difficulties in zonal and chronological assignments in the lowermost admixed intervals are due to the mixing of impoverished indigenous nannofossils and the extensive occurrence of reworked specimens. The former is believed to be related to partial dissolution, whereas the latter is related to the extensive downslope movement in Sabah Basin during Late Miocene as a result of gravity flow processes. Hence, most of the previous chronological assignments for the Miocene turbiditic sequences of Sabah Basin are believed to have been misinterpreted and in need of revision. Through quantitative calcareous nannofossil analysis the right chronology for these sequences can be obtained.
ACKNOWLEDGEMENTS
The authors are grateful to the management of PETRONAS-PRSS for permission to publish this paper. They express their gratitude to Dr. RJ. Morley, Dr. Rashidah Karim and Mr. Awaluddin Harun for their constructive reviews of the manuscript and useful suggestions.
REFERENCES BOL,AJ. ANDVANHooRN,B., 1980. Structural styles in Western
Sabah offshore. Bull. Geol. Soc. of Malaysia 12, 1-16. BUKRY, D., 1971. Cenozoic calcareous nannofossils from the
Pacific ocean. Trans. San Diego Soc. Nat. Hist., 16(14),303-327.
CHI, W.R., 1978. The Late Neogene nannoplankton biostratigraphy in the Taiwan foothills region, Southern Taiwan. Petroleum Geology of Taiwan, 15, 89-125.
FRANKE, W.W. AND. BROWN, JR., R.M., 1971. Scale formation in Chrysophycean algae, Ill. Negatively stained scales of the coccolithophoridHymenomonas. Archiv Mikrobiologie, 77,12-19.
EPMI, 1971. Well Completion Report of Dudar-l well. Unpubl. IsMAIL, C.M.Z., 1992. Regional seismostratigraphic study of
the Tembungo area, offshore West Sabah. Bull. Geol. Soc. ofMalaysia,32,l09-134.
KD.M.INSTITUTEOF PETROLEUM EXPLORATION, DEHRA DuN, 1991. Geohistory analysis ofTembungo area, 1 (Unpubl).
LEVELL, B. AND KAsUMAJAYA, A, 1985. Slumping at the late Miocene shelf edge offshore West Sabah: a view of a turbidite basin margin. Bull. Geol. Soc. ofMillaysia 18, 1-29.
LEWELL, B.K., 1987. The nature and significance of regional unconformities in the hydrocarbon-bearing Neogene sequence offshore West Sabah. Geo. Soc. Malaysia Bull. 21,55--90.
loRD, AR. (ED.), 1982. A stratigraphical Index of calcareous nannofossils. British Micripaleontological Soc. Series. Ellis Horward Limited, 192p.
~ ;::
~ ,.,. ;;. ~ "1
SARAWAK ~
LEGEND:
Coastal Plain
Coastal - Fluviomarine
Kota Kinabalu
S A BAH
...... o 25
KM
Holomarine
late Miocene erosion
50
Figure 16. The Late Miocene paleofacles map oftlabah Basin (modified after Rice-Oxley, 1991).
115E
7N
Legend:
_ OIL FIELD
EDGE OF TURBIDITE BASIN
V SLUMP SCAR
6N
5N
116E
Dudar-l I
TekUYOn: -1 0 ~ Rusa Tim\ ur -.1 ..... S W Emerald \\
G . h H't 1 .' ~ Barton '., ala I am - ~"",o S Furious. 'l
Belangkas-1 0 ..... 07' /J Mengkira-1 ,.~
(\ /. . Tembungo' . ~9-~~~
. 6\\0 .", ~\)I'\)\ ;, T
----~ f "' ....... ty'"
r~
I \,
) ,
J )
S A B
o
A H
25 50 km
Figure 17. The Late MiocenelPliocene shelf edge of Sabah Basin (after Levell and Kasumajaya, 1985).
~ o I o ::0
~ C o I m :A: o l:D :x:z o ~ :x:I :x:~
~ o I :x:~ m o
CHRONOSTRATIGRAPHY OF MIOCENE TURBIDITIC SEQUENCE OF SABAH BASIN FROM NANNOFOSSIL ASSEMBLAGES 163
MAlmNI,E., 1971. StandardTertiaryandQuatemarycalcareous nannoplankton zonation. In: Farinacci, A. (Ed.), 2nd Conf. Planktonic Microfossils, Rome 1970, 2, 739-785.
MOllO RAzAu OlE KOB, 1993a. Late Quaternary nannofossils from offshore Sabah, Northwest Borneo. In: T. Thanasuthipitak (Ed.), Proceedings of the international symposium on biostratigraphy of mainland Southeast Asia: Facies and Paleontology, 1. II, Chiang Mai Univ., 261-281.
MOHO RAzAu CHE KOB, 1993b. Nannofossil zonation and paleoceanography interpretation of core KL 139, Sabah trough, Northwest Sabah, Proceedings of Exploration Research Seminar, PRSS, 1, 123-137.
MOHO RAzAu CHE KOB AND BASIR JASIN, 1994. Distribution of modem nannofossils across the Sabah margin and its application in environmental interpretation of a Late Quaternary section. Annual Geological Conference 1994, Geol. Soc. of Malaysia (abstract).
MU5A MU5BAH AND HAGEMEN, H., 1986. Calcareous nannofossil biostratigraphy of Neogene deposits from Sarawak and Sabah (Unpubl).
OKADA, H. AND BUI<RY, D., 1980. Supplementary modification and intrQducti.on of code numbers to the low latitude coccolith biostratigraphy zonation. In: B.U. Haq (Ed.), 1984, Nannoplankton biostratigraphy. Benchmark papers in geology, 78, 321-325.
PERCH-NIELSEN, K., 1985. Cenozoic calcareous nannofossils. In: H.M. Bolli et al. (Eds.), Plankton Stratigraphy. Cambridge Univ. Press, 427-552.
RICE-Oxi.EY, E.D., 1991. Palaeoenvironments of the Lower Miocene to Pliocene sediments in offshore NW Sabah area. Bull. Geol. Soc. of Malaysia, 28,165-194.
V AROL, 0.,1983. Proposed calcareous nannofossils zonation scheme for the Miocene to Holocene of SE Asia. Bull. Geol. Soc. of Malaysia, 16, 37-46 .
.. .. .. MlInuscript received 30 September 1994
JuLy 1995