application of aquatic insects (ephemeroptera, plecoptera ... · pdf fileskala kekayaan...
TRANSCRIPT
Tropical Life Sciences Research, 28(2), 143–162, 2017
© Penerbit Universiti Sains Malaysia, 2017. This work is licensed under the terms of the Creative Commons Attribution (CC BY) (http://creativecommons.org/licenses/by/4.0/).
Application of Aquatic Insects (Ephemeroptera, Plecoptera And Trichoptera) In Water Quality Assessment of Malaysian Headwater
Suhaila Ab Hamid* and Che Salmah Md Rawi
School of Biological Sciences, Universiti Sains Malaysia, 11800 USM Pulau Pinang. Malaysia
Published date: 31 July 2017To cite this article: Suhaila A H and Che Salmah M R. (2017). Application of aquatic insects (Ephemeroptera, Plecoptera And Trichoptera) in water quality assessment of Malaysian headwater. Tropical Life Sciences Research 28(2):143–162. https://doi.org/10.21315/tlsr2017.28.2.11To link to this article: http://doi.org/10.21315/tlsr2017.28.2.11
Abstrak: Struktur komuniti Ephemeroptera, Plecoptera dan Trichoptera (EPT) dan sensitiviti khusus genera EPT tertentu didapati dipengaruhi oleh parameter air di dalam sungai Hutan Simpan Gunung Jerai (HSGJ) di utara Semenanjung Malaysia. Skala kekayaan taksonomi EPT > 10 di semua sungai menunjukkan bahawa semua habitat sungai tidak terjejas, yang mempunyai kualiti air yang baik bersamaan dengan klasifikasi Kelas I dan Kelas II indeks kualiti air Malaysia (WQI) bagi air minuman. Kelimpahan EPT adalah sangat tinggi di Sungai Teroi (9,661 individu) tetapi kepelbagaian lebih rendah (22 genera) daripada Sungai Tupah yang sangat pelbagai (28 genera) tetapi lebih rendah (4,263 individu). Keanekaragaman yang paling rendah dan sederhana telah dicatatkan dari Sungai Batu Hampar (25 genera). Baetis spp. Dan Thalerosphyrus spp., Neoperla spp. dan Cheumatopsyche spp. adalah genera yang paling biasa dijumpai. Klasifikasi untuk semua sungai yang menggunakan Indeks Kekayaan taxa EPT dan WQI memberikan kategori kualiti air yang berlainan. WQI mengklasifikasikan sungai Tupah dan Batu Hampar ke Kelas II dan Teroi River (Kelas I) adalah dua kelas di atas klasifikasi Indeks Kesejahteraan EPT.
Kata kunci: Ephemeroptera, Plecoptera, Trichoptera, Indeks Kualiti Air, Indeks EPT
Abstract: The Ephemeroptera, Plecoptera and Trichoptera (EPT) community structure and the specific sensitivity of certain EPT genera were found to be influenced by water parameters in the rivers of Gunung Jerai Forest Reserve (GJFR) in the north of peninsular Malaysia. The scores of EPT taxa richness of >10 in all rivers indicated all rivers’ habitats were non-impacted, having good water quality coinciding with Class I and Class II of Malaysian water quality index (WQI) classification of potable water. The abundance of EPT was very high in Teroi River (9,661 individuals) but diversity was lower (22 genera) than Tupah River which was highly diverse (28 genera) but lower in abundance (4,263 individuals). The lowest abundance and moderate diversity was recorded from Batu Hampar River (25 genera). Baetis spp. and Thalerosphyrus spp., Neoperla spp. and Cheumatopsyche spp. were the most common genera found. Classification for all rivers using EPT taxa Richness Index and WQI gave different category of water quality, respectively. The WQI classified Tupah
*Corresponding author: [email protected]
Suhaila Ab Hamid and Che Salmah Md Rawi
144
and Batu Hampar rivers into Class II and Teroi River (Class I) was two classes above the classification of the EPT taxa Richness Index.
Keywords: Ephemeroptera, Plecoptera, Trichoptera, Water Quality Index, EPT Taxa Richness Index.
INTRODUCTION
In Asian inland aquatic ecosystem, various factors has threatened biodiversity which are related to human activities (Yule & Yong 2004; Gopal 2005; Dudgeon 2000; 2008). Being a nation with the highest consumption of water, freshwater resources in Malaysia especially streams and rivers became the ultimate importance to the country development by contributing up to 98% of the overall water consumption (DOE 2002). Unfortunately, few studies conducted in northern region of Peninsular Malaysia showed that many rivers were contaminated with pesticides, industrial wastes and heavy metals (DOE 2003; Al Shami et al. 2010; Salman et al. 2010). More research towards understanding the ecological and biological responses of rivers to pollution and development of assessment methods are urgently needed to protect these ecosystems (Yap 2005; Azrina et al. 2006; Che Salmah et al. 2007).
Most of the studies on benthic macroinvertebrates in relation to water quality evaluation have included analyses on community of Ephemeroptera, Plecoptera and Trichoptera (EPT) (Rosenberg & Resh 1993; Suhaila et al. 2011; Suhaila et al. 2014; Suhaila & Che Salmah 2014; Suhaila et al. 2016). EPT are very much intolerable to any presence of pollutants in the water bodies and thus EPT are crucial biological indicators in determining water quality of the river. In many instances, active anthropogenic activities nearby the river can have an effect on abundance and diversity of EPT (Wan Mohd Hafezul et al. 2016). Among the EPT, Plecoptera (stonefly) is the most sensitive to changes in water quality. Their low motility (Lazaridou-Dimitriadou 2002) and high heterogeneity suggests inevitable reactions towards changes in water quality from some members (Hellawell 1986). The presence of EPT species denotes that parameters in the habitat is within the tolerance limit of the species.Apart from Plecoptera, Trichoptera larvae and Ephemeroptera (mayflies) nymphs are also good bioindicators of the freshwater quality and ecological changes because most of the genera are only able to survive in rivers or streams with a good quality of water (Chapman 1996; Azrina et al. 2006; Suhaila et al 2014; Suhaila & Che Salmah 2014) and their distributions are strongly dictated by their tolerance to a set of environmental factors (Dudgeon 1984).
Communities of EPT are usually dominant in headwater rivers and the evaluation of water quality using these three insects orders are decent enough and satisfactorily accurate (Bonada et al. 2006; Suhaila et al. 2011, 2014). Therefore, this study was conducted to assess the quality of water through EPT assemblages in respective rivers and compared them with the conventional chemical classification of water quality exercised by the Malaysian Department of Environment.
EPT in Water Quality Assessment
145
MATERIALS AND METHODS
Study Area
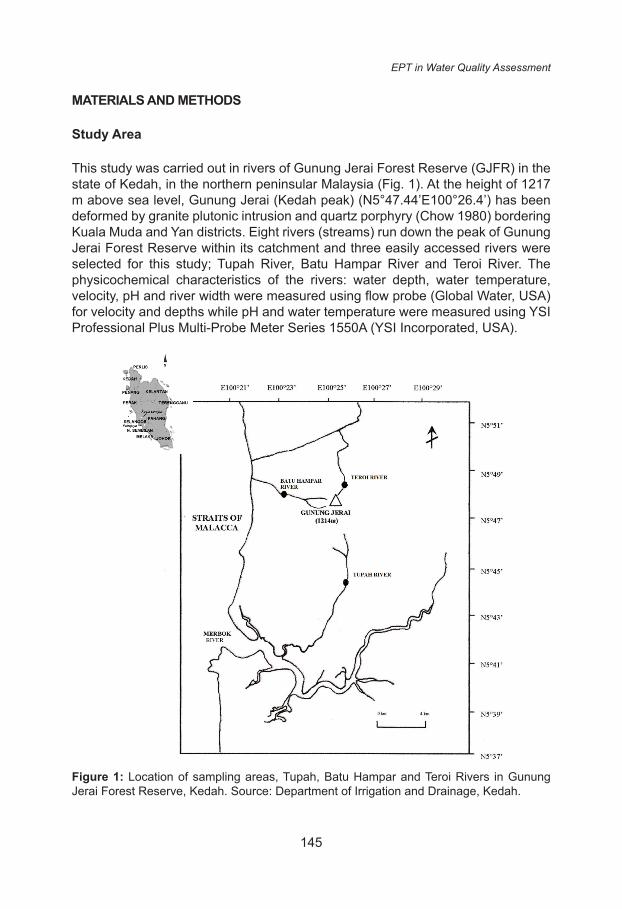
This study was carried out in rivers of Gunung Jerai Forest Reserve (GJFR) in the state of Kedah, in the northern peninsular Malaysia (Fig. 1). At the height of 1217 m above sea level, Gunung Jerai (Kedah peak) (N5°47.44’E100°26.4’) has been deformed by granite plutonic intrusion and quartz porphyry (Chow 1980) bordering Kuala Muda and Yan districts. Eight rivers (streams) run down the peak of Gunung Jerai Forest Reserve within its catchment and three easily accessed rivers were selected for this study; Tupah River, Batu Hampar River and Teroi River. The physicochemical characteristics of the rivers: water depth, water temperature, velocity, pH and river width were measured using flow probe (Global Water, USA) for velocity and depths while pH and water temperature were measured using YSI Professional Plus Multi-Probe Meter Series 1550A (YSI Incorporated, USA).
Figure 1: Location of sampling areas, Tupah, Batu Hampar and Teroi Rivers in Gunung Jerai Forest Reserve, Kedah. Source: Department of Irrigation and Drainage, Kedah.
Suhaila Ab Hamid and Che Salmah Md Rawi
146
Tupah river
This second order river is located in Kuala Muda district. The 5.6 km long, 0.32±0.045 m of mean depth with mean width of 4.14±0.277 meter river entres Merbok River, which flows into the Straits of Malacca. The fast flowing Tupah River (0.56±0.157 m/s) has a yearly mean water temperature ranged from 22.8 to 25.7ºC while the water pH ranging from 5.03 to 6.66. Tupah River composes of low land dipterocarp forest at 100–200 m above sea level. The substrates are predominantly cobble and gravel (55%), and the other 45% of river sediment is made up of boulder. This open canopy, clear water river is highly frequented by the locals during weekends and school holidays for various recreational activities. The sampling activities were done in this river at N5°45.008’ E100°26.526’.
Batu Hampar river
The Batu Hampar River is located in Yan district. This 7.4 km long second order river flows through a populated village and fruit orchards in a low land dipterocarp forest at 300 m a.s.l. A moderately wide (4.73±0.375 m mean width) with 0.34±0.06 m mean depth river also entres the Straits of Malacca. The water flow is relatively fast (0.65±0.125 m/s) while pH of water ranges from 5.64 to 6.63. The annual mean water temperature ranges from 23.2 to 25.2ºC. In the Batu Hampar River, the substrates such as cobbles and gravels were highly embedded (approximately 60%) into the bottom of the river. The locals visit this place during dry season, when the water flow is slower. The Batu Hampar River was developed by the Kedah state-government as a recreational park. Sampling activities for this study took place at N5°46.668’ E100°23.835’.
Teroi river
This first order river is located high up on the Gunung Jerai at 1214 m in Gurun district. A shallow river (0.17±0.068 m mean depth) originated on Gunung Jerai peak has a mean width of 4.03±0.726 m. The water velocity of 1.22±0.123 m/s is the fastest among the three rivers because it flows over a steep slope. The water is acidic with pH values range from 4.06 to 6.21. The annual water temperature was between 19.1°C and 22.0°C. The Teroi River was partly shaded by tree canopies and flows through a hilly dipterocarp forest. Due to the resin of the Agathis alba trees that grow along the river bank, the colour of the water turns brownish. The sampling point was determined at N5°48.328’ E100°25.913’.
Sampling Of EPT Immatures
Immatures of EPT were sampled from Tupah, Batu Hampar and Teroi Rivers, using a modified kick sampling technique of Merritt et al. (2008) beginning September 2007 until August 2008. A thorough descriptions of the sampling procedure
EPT in Water Quality Assessment
147
can be accessed elsewhere (Suhaila & Che Salmah 2011). Twenty samples of aquatic insects was collected randomly at each river every consecutive months. The content of each sample or net was transferred into a transparent plastic bag, sealed, and sorted in the laboratory. Based on a preliminary sampling, 20 D-pond net samples collected more than 75% of the total insect taxa from each habitat. This was sufficient to represent EPT population (Radwell & Brown, 2007) that matched Elliot’s (1973) estimate of the population density for benthic study with a standard error of approximately 20%.
EPT nymphs and larvae were sorted visually and immersed in universal bottles containing 75% ethyl alcohol (ETOH). They were identified to respective genera under a dissecting microscope, Olympus CX41 (Olympus, Tokyo, Japan) using keys provided by Kenneth and Bill (1993), Morse et al. (1994), Wiggins (1996), Dudgeon (1999) and Yule and Yong (2004). The identifications of plecopterans were confirmed by Dr Ignec Sivec (Slovenian Museum of Natural History) and Professor Yeon Jae Bae from Korea University, Seoul, Korea verified the identifications of Ephemeroptera and Trichoptera.
Water Samples Analysis
Five water samples (each) were collected from each river into a 500 mL polyethylene bottle monthly alongside the collections of the EPT. The bottles were kept in an ice chest and transported to the laboratory and preserved at 4°C until analysed. Ammonia-nitrogen (NH3-N) including other five water parameters; biochemical oxygen demand (BOD3), chemical oxygen demand (COD), total suspended solids (TSS), pH and dissolved oxygen (DO) were analysed. Dissolved oxygen (DO) content in the water and temperature were measured in situ using a YSI Model 550A (YSI Inc., Ohio, USA) oxygen meter while the water pH was measured with an electronic pH meter (HACH CO., Loveland, USA). The COD, TSS and NH3-N in the water were estimated in the laboratory using a standard kit of DR/890 HACH Calorimeter.
For measuring BOD3, water samples were confined at room temperature in the dark for 3 days. Before that, reading of DO was taken using the YSI Pro_BOD Probe (YSI Incorporated, USA) on the first day and another reading measured 3 days later after incubation. The difference between the first reading on the first day (DO1) and the second reading on the third day of incubation (DO3), was the amount of BOD3 in the water expressed in milligrams per liter.
Water Quality Index Calculation
According to Malaysian Department of Environment (DOE 2002), to calculate the Water Quality Index (WQI) the means values of DO, BOD3, COD, pH, NH3-N and TSS were converted to sub-indices (SIs) (Appendix 1) using the best-fit equation and aggregated to compute the WQI according to the following equation:
Suhaila Ab Hamid and Che Salmah Md Rawi
148
WQI = 0.22 × SIDO + 0.19 × SIBOD + 0.16 × SICOD + 0.15 × SIAN + 0.16 × SISS + 0.12 × SIpH
where SI is the sub-index of each parameter.
Statistical Analyses
Differences in mean monthly abundance of EPT in the three rivers were analysed using the Kruskal Wallis test at p=0.05 for non-normally distributed data (Kolgomorov-Smirnov test, p<0.05) using the SPSS software ver. 18. The total numbers of EPT taxa (genera) represented the EPT taxa Richness Index (Lenat 1993; Lenat & Penrose 1996) in each river. The relationship of the EPT taxa Richness Index with the WQI was assessed by Spearman’s Rho correlation and Regression analysis. The Canonical Correspondence Analysis (CCA) of CANOCO program version 4.0, investigated the influence of water quality parameters on the distribution and abundance of EPT taxa in the rivers. The Monte-Carlo test was applied to test the significance of the produced canonical axes with 499 permutations at p<0.05. The biplot ordination diagram was produced using the CanoDraw for Windows 4.1.
RESULTS
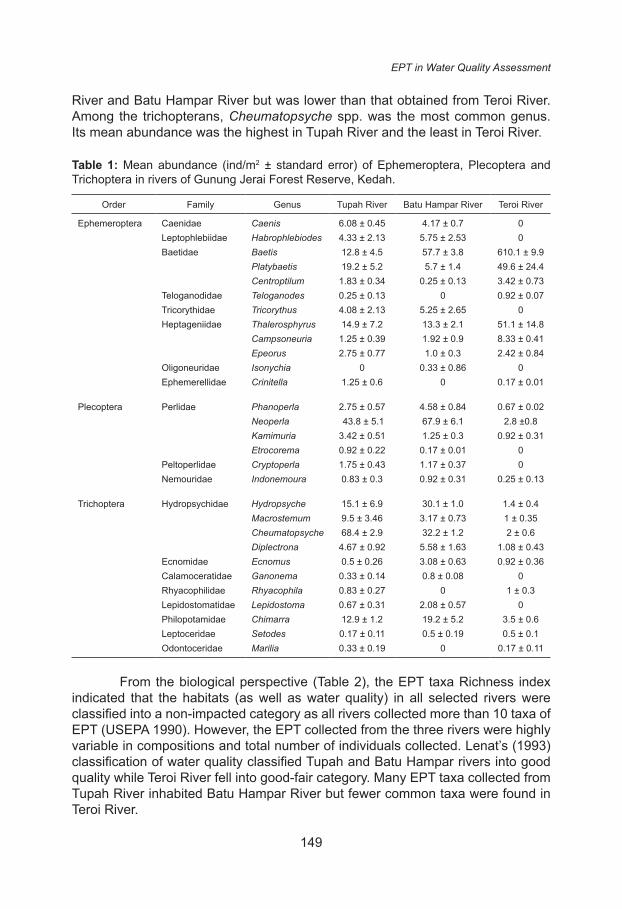
The result showed that Tupah River recorded the highest EPT taxa Richness index with 28 taxa, followed by Batu Hampar River (25) and Teroi River with 22 taxa (Table 1). The 28 genera found in all rivers were represented by varied composition patterns. Among the 12 ephemeropterans genera encountered, Baetis spp. was the most common genus with its greatest abundance occurred in Teroi River and the least in Batu Hampar River. It was followed by Platybaetis spp., which was more abundant in Teroi River but only few of them were found in Batu Hampar River. Thalerospyrus spp. was the third most common genus of Ephemeroptera. This genus had low mean abundances in both Tupah River and Batu Hampar River, much lesser than the number recorded in Teroi River.
Two Ephemeroptera genera; Caenis spp. and Habrophlebiodes spp. collected from Tupah and Batu Hampar Rivers were absent from Teroi River. Isonychia spp. was only found in Batu Hampar River. Plecopterans Etrocorema spp. and Cryptoperla spp. were not encountered in Teroi River. Two Trichoptera genera (Ganonema spp. and Lepidostoma spp.) were not collected from Teroi River and two others (Rhyacophila spp. and Marilia spp.) were not found in both Tupah and Batu Hampar River.
Six genera of Plecoptera were recorded and Neoperla spp. was the most abundant genus in the three rivers. The highest mean abundance of Neoperla spp. was found in Batu Hampar River and the least in Teroi River. It was followed by Phanoperla spp., which was also more abundant in Batu Hampar River and the fewest in Teroi River. Kamimuria spp. had higher mean abundances in both Tupah
EPT in Water Quality Assessment
149
River and Batu Hampar River but was lower than that obtained from Teroi River. Among the trichopterans, Cheumatopsyche spp. was the most common genus. Its mean abundance was the highest in Tupah River and the least in Teroi River.
Table 1: Mean abundance (ind/m2 ± standard error) of Ephemeroptera, Plecoptera and Trichoptera in rivers of Gunung Jerai Forest Reserve, Kedah.
Order Family Genus Tupah River Batu Hampar River Teroi River
Ephemeroptera Caenidae Caenis 6.08 ± 0.45 4.17 ± 0.7 0Leptophlebiidae Habrophlebiodes 4.33 ± 2.13 5.75 ± 2.53 0Baetidae Baetis 12.8 ± 4.5 57.7 ± 3.8 610.1 ± 9.9
Platybaetis 19.2 ± 5.2 5.7 ± 1.4 49.6 ± 24.4Centroptilum 1.83 ± 0.34 0.25 ± 0.13 3.42 ± 0.73
Teloganodidae Teloganodes 0.25 ± 0.13 0 0.92 ± 0.07Tricorythidae Tricorythus 4.08 ± 2.13 5.25 ± 2.65 0Heptageniidae Thalerosphyrus 14.9 ± 7.2 13.3 ± 2.1 51.1 ± 14.8
Campsoneuria 1.25 ± 0.39 1.92 ± 0.9 8.33 ± 0.41Epeorus 2.75 ± 0.77 1.0 ± 0.3 2.42 ± 0.84
Oligoneuridae Isonychia 0 0.33 ± 0.86 0Ephemerellidae Crinitella 1.25 ± 0.6 0 0.17 ± 0.01
Plecoptera Perlidae Phanoperla 2.75 ± 0.57 4.58 ± 0.84 0.67 ± 0.02Neoperla 43.8 ± 5.1 67.9 ± 6.1 2.8 ±0.8Kamimuria 3.42 ± 0.51 1.25 ± 0.3 0.92 ± 0.31Etrocorema 0.92 ± 0.22 0.17 ± 0.01 0
Peltoperlidae Cryptoperla 1.75 ± 0.43 1.17 ± 0.37 0Nemouridae Indonemoura 0.83 ± 0.3 0.92 ± 0.31 0.25 ± 0.13
Trichoptera Hydropsychidae Hydropsyche 15.1 ± 6.9 30.1 ± 1.0 1.4 ± 0.4Macrostemum 9.5 ± 3.46 3.17 ± 0.73 1 ± 0.35Cheumatopsyche 68.4 ± 2.9 32.2 ± 1.2 2 ± 0.6Diplectrona 4.67 ± 0.92 5.58 ± 1.63 1.08 ± 0.43
Ecnomidae Ecnomus 0.5 ± 0.26 3.08 ± 0.63 0.92 ± 0.36Calamoceratidae Ganonema 0.33 ± 0.14 0.8 ± 0.08 0Rhyacophilidae Rhyacophila 0.83 ± 0.27 0 1 ± 0.3Lepidostomatidae Lepidostoma 0.67 ± 0.31 2.08 ± 0.57 0Philopotamidae Chimarra 12.9 ± 1.2 19.2 ± 5.2 3.5 ± 0.6Leptoceridae Setodes 0.17 ± 0.11 0.5 ± 0.19 0.5 ± 0.1Odontoceridae Marilia 0.33 ± 0.19 0 0.17 ± 0.11
From the biological perspective (Table 2), the EPT taxa Richness index indicated that the habitats (as well as water quality) in all selected rivers were classified into a non-impacted category as all rivers collected more than 10 taxa of EPT (USEPA 1990). However, the EPT collected from the three rivers were highly variable in compositions and total number of individuals collected. Lenat’s (1993) classification of water quality classified Tupah and Batu Hampar rivers into good quality while Teroi River fell into good-fair category. Many EPT taxa collected from Tupah River inhabited Batu Hampar River but fewer common taxa were found in Teroi River.
Suhaila Ab Hamid and Che Salmah Md Rawi
150
Table 2: Biological indices based on composition and abundance of EPT immature and water quality evaluation in selected rivers of Gunung Jerai Forest Reserve, Kedah.
River EPT taxa richness index Water quality assessment
Tupah 28 Non-impacted
Batu Hampar 25 Non-impacted
Teroi 22 Non-impacted
Composition of EPT communities were much higher in Batu Hampar River (H’=2.29) followed by Tupah River (H’=2.15) then Teroi River (H’=0.77) (Table 3). A similar pattern was shown by scores of Simpson Diversity Index (1-D). Batu Hampar River (1-D=0.85) and the Tupah River (1-D=0.81) scored high but low in Teroi River (1-D=0.32). Species richness for the Menhinick Index (R) was low at all rivers, ranging from 0.43 to 0.19. Based on these values, Tupah River provided the most suitable habitats for the EPT community compared to the other two rivers.
Table 3: Evaluation of EPT abundance and diversity using Shannon-Wiener Index (H’), Simpson’s Index (1-D) and Menhinick Index (R), Pielou Evenness Index (E) for Tupah, Batu Hampar and Teroi rivers, Kedah.
River Shannon-Wiener Index (H’)
Simpson’s Index (1-D)
Menhinick Index (R)
Pielou Index (E)
Tupah 2.153 0.811 0.427 0.646Batu Hampar 2.294 0.853 0.432 0.713Teroi 0.765 0.323 0.193 0.260
The EPT distribution based on Pielou Evenness Index was more uniform in Batu Hampar (E = 0.71) and Tupah rivers (E = 0.65), least evenly distributed in Teroi River (E = 0.26). The Kruskal-Wallis test revealed there was a significant difference between indices with the rivers (Shannon-Wiener index, χ2 = 48.765, P = 0.00; Simpson’s index, χ2 = 31.919, P = 0.00; Pielou index, χ2 = 72.504, P = 0.00; Menhinick index, χ2 = 11.075, P = 0.00).
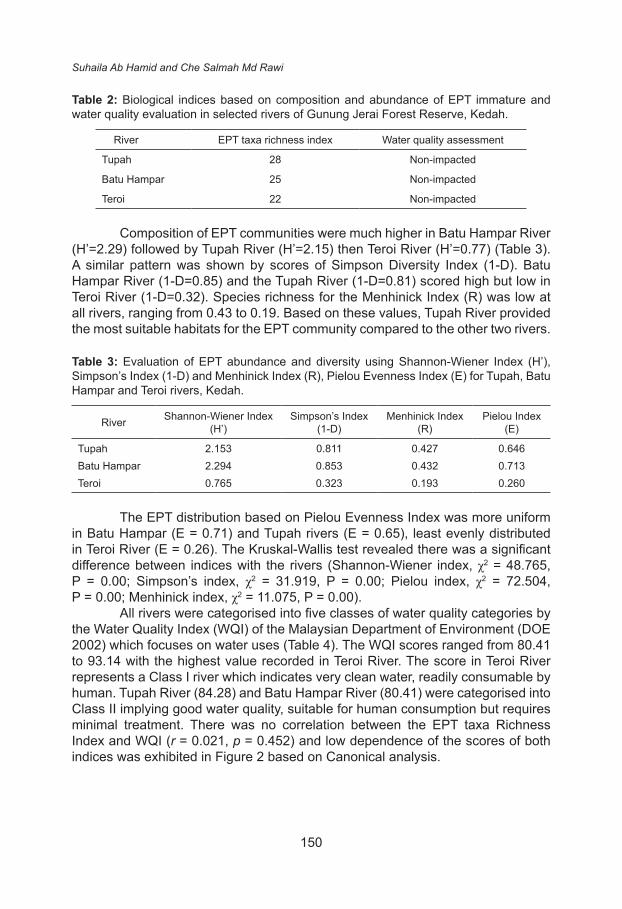
All rivers were categorised into five classes of water quality categories by the Water Quality Index (WQI) of the Malaysian Department of Environment (DOE 2002) which focuses on water uses (Table 4). The WQI scores ranged from 80.41 to 93.14 with the highest value recorded in Teroi River. The score in Teroi River represents a Class I river which indicates very clean water, readily consumable by human. Tupah River (84.28) and Batu Hampar River (80.41) were categorised into Class II implying good water quality, suitable for human consumption but requires minimal treatment. There was no correlation between the EPT taxa Richness Index and WQI (r = 0.021, p = 0.452) and low dependence of the scores of both indices was exhibited in Figure 2 based on Canonical analysis.
EPT in Water Quality Assessment
151
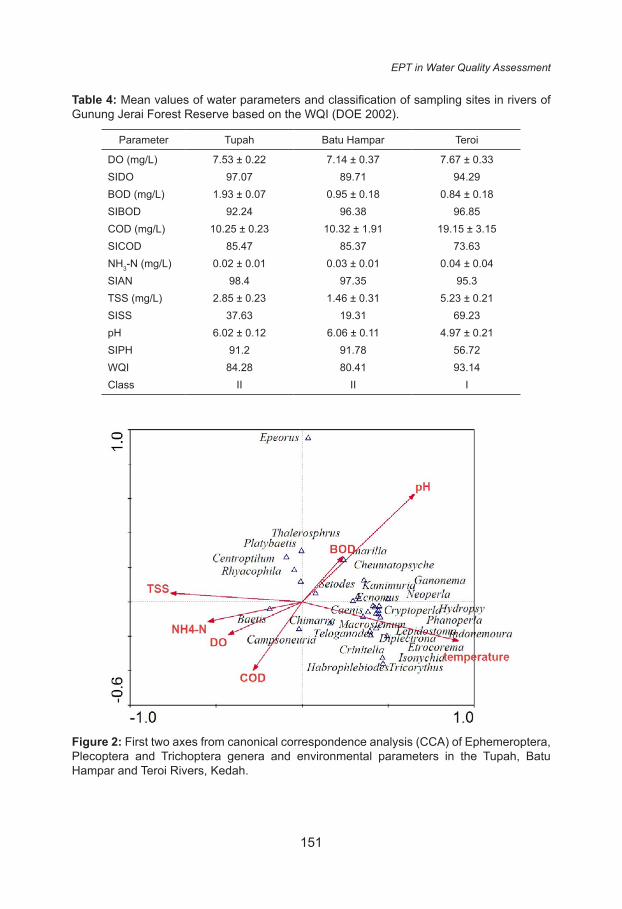
Table 4: Mean values of water parameters and classification of sampling sites in rivers of Gunung Jerai Forest Reserve based on the WQI (DOE 2002).
Parameter Tupah Batu Hampar Teroi
DO (mg/L) 7.53 ± 0.22 7.14 ± 0.37 7.67 ± 0.33SIDO 97.07 89.71 94.29BOD (mg/L) 1.93 ± 0.07 0.95 ± 0.18 0.84 ± 0.18SIBOD 92.24 96.38 96.85COD (mg/L) 10.25 ± 0.23 10.32 ± 1.91 19.15 ± 3.15SICOD 85.47 85.37 73.63NH3-N (mg/L) 0.02 ± 0.01 0.03 ± 0.01 0.04 ± 0.04SIAN 98.4 97.35 95.3TSS (mg/L) 2.85 ± 0.23 1.46 ± 0.31 5.23 ± 0.21SISS 37.63 19.31 69.23pH 6.02 ± 0.12 6.06 ± 0.11 4.97 ± 0.21SIPH 91.2 91.78 56.72WQI 84.28 80.41 93.14Class II II I
Figure 2: First two axes from canonical correspondence analysis (CCA) of Ephemeroptera, Plecoptera and Trichoptera genera and environmental parameters in the Tupah, Batu Hampar and Teroi Rivers, Kedah.
Suhaila Ab Hamid and Che Salmah Md Rawi
152
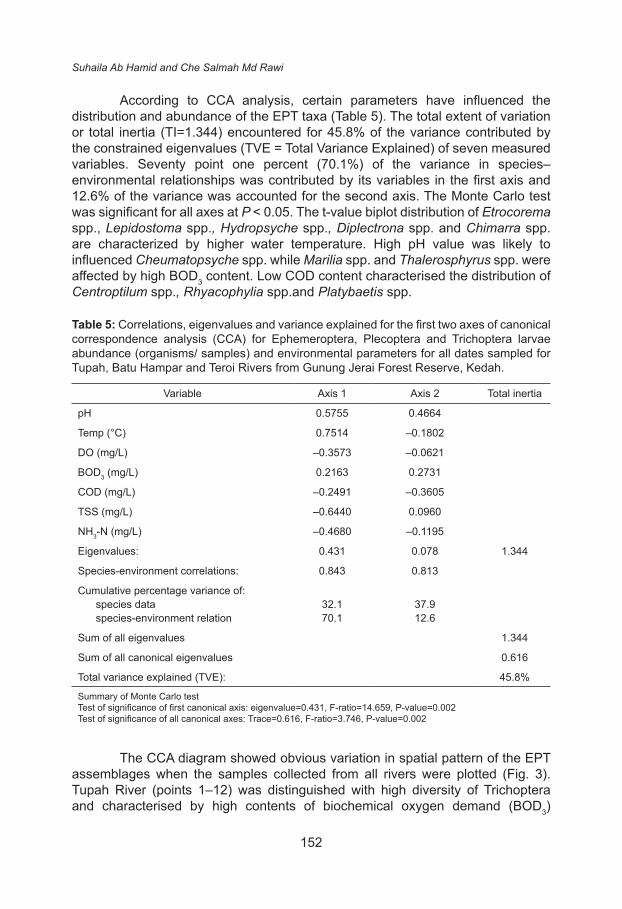
According to CCA analysis, certain parameters have influenced the distribution and abundance of the EPT taxa (Table 5). The total extent of variation or total inertia (TI=1.344) encountered for 45.8% of the variance contributed by the constrained eigenvalues (TVE = Total Variance Explained) of seven measured variables. Seventy point one percent (70.1%) of the variance in species–environmental relationships was contributed by its variables in the first axis and 12.6% of the variance was accounted for the second axis. The Monte Carlo test was significant for all axes at P < 0.05. The t-value biplot distribution of Etrocorema spp., Lepidostoma spp., Hydropsyche spp., Diplectrona spp. and Chimarra spp. are characterized by higher water temperature. High pH value was likely to influenced Cheumatopsyche spp. while Marilia spp. and Thalerosphyrus spp. were affected by high BOD3 content. Low COD content characterised the distribution of Centroptilum spp., Rhyacophylia spp.and Platybaetis spp.
Table 5: Correlations, eigenvalues and variance explained for the first two axes of canonical correspondence analysis (CCA) for Ephemeroptera, Plecoptera and Trichoptera larvae abundance (organisms/ samples) and environmental parameters for all dates sampled for Tupah, Batu Hampar and Teroi Rivers from Gunung Jerai Forest Reserve, Kedah.
Variable Axis 1 Axis 2 Total inertia
pH 0.5755 0.4664
Temp (°C) 0.7514 –0.1802
DO (mg/L) –0.3573 –0.0621
BOD3 (mg/L) 0.2163 0.2731
COD (mg/L) –0.2491 –0.3605
TSS (mg/L) –0.6440 0.0960
NH3-N (mg/L) –0.4680 –0.1195
Eigenvalues: 0.431 0.078 1.344
Species-environment correlations: 0.843 0.813
Cumulative percentage variance of:species data 32.1 37.9species-environment relation 70.1 12.6
Sum of all eigenvalues 1.344
Sum of all canonical eigenvalues 0.616
Total variance explained (TVE): 45.8%
Summary of Monte Carlo test Test of significance of first canonical axis: eigenvalue=0.431, F-ratio=14.659, P-value=0.002Test of significance of all canonical axes: Trace=0.616, F-ratio=3.746, P-value=0.002
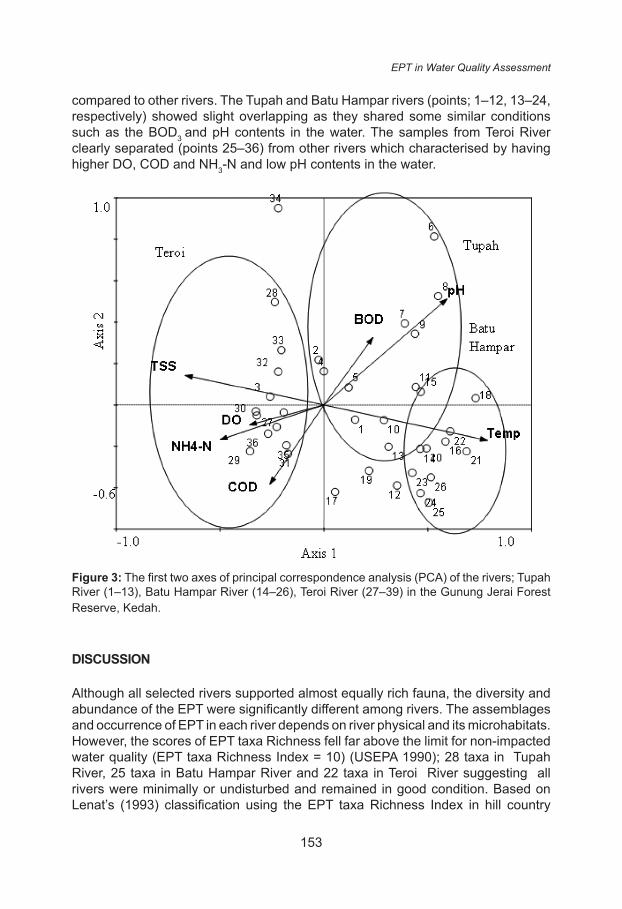
The CCA diagram showed obvious variation in spatial pattern of the EPT assemblages when the samples collected from all rivers were plotted (Fig. 3). Tupah River (points 1–12) was distinguished with high diversity of Trichoptera and characterised by high contents of biochemical oxygen demand (BOD3)
EPT in Water Quality Assessment
153
compared to other rivers. The Tupah and Batu Hampar rivers (points; 1–12, 13–24, respectively) showed slight overlapping as they shared some similar conditions such as the BOD3 and pH contents in the water. The samples from Teroi River clearly separated (points 25–36) from other rivers which characterised by having higher DO, COD and NH3-N and low pH contents in the water.
Figure 3: The first two axes of principal correspondence analysis (PCA) of the rivers; Tupah River (1–13), Batu Hampar River (14–26), Teroi River (27–39) in the Gunung Jerai Forest Reserve, Kedah.
DISCUSSION
Although all selected rivers supported almost equally rich fauna, the diversity and abundance of the EPT were significantly different among rivers. The assemblages and occurrence of EPT in each river depends on river physical and its microhabitats. However, the scores of EPT taxa Richness fell far above the limit for non-impacted water quality (EPT taxa Richness Index = 10) (USEPA 1990); 28 taxa in Tupah River, 25 taxa in Batu Hampar River and 22 taxa in Teroi River suggesting all rivers were minimally or undisturbed and remained in good condition. Based on Lenat’s (1993) classification using the EPT taxa Richness Index in hill country
Suhaila Ab Hamid and Che Salmah Md Rawi
154
streams, the water quality in Tupah and Batu Hampar rivers were in good condition (EPT = 24–31) while in Teroi River the water was in Good-Fair category (EPT = 16–23). Classification of water quality using the EPT taxa Richness Index in this study is considered satisfactory because according to Lenat (1993), the EPT reach their maximum development in the headwaters and consists of families that are restricted or belong to clean running water. Moreover the values of this index are sensitive and changes following the change in river water quality (Dudgeon 1996). EPT is important to be use in upstream rivers as their abundance and diversity was useful as reference for interpreting biological index. Furthermore, EPT species have limited levels of tolerance to any changes in the river water and this action can be used in detecting environmental perturbations. In contrary, the scores of measured chemical water parameters (WQI of the Malaysian Department of Environment 2002) showed that Teroi River had excellent water quality of Class I (93.14) and Tupah as well as Batu Hampar rivers were categorised into Class II (84.28 and 80.41, respectively) of good water quality. The WQI classified Tupah and Batu Hampar rivers into similar category but Teroi River was two classes above the classification of the EPT taxa Richness Index assuming the river categories represented identical quality of water.
Having shown that the WQI classified Teroi River as having excellent water quality (Class I). The composite value of six water quality parameters used in calculation of the WQI indicated the least disturbed environment in Teroi River although the water was acidic. Typically, the benthic communities in Class I (pristine) river respond only to inert pollutants (Ogbeibu & Victor 1989). Presently, river degradation causes marked reduction in faunal composition. Atrophic influence is one of the factors affecting composition of aquatic insects (Rosenberg & Resh, 1993). In disturbed rivers, a decrease of sensitive taxa and an increase of tolerant taxa are expected. The biological integrity of Teroi River was relatively unimpacted and the EPT populations were generally in its best condition as represented by its relatively high EPT taxa Richness Index. However, the EPT taxa Richness Index score in Teroi River was lower than in Tupah and Batu Hampar rivers possibly related to low pH of the water in Teroi River which was less suitable to some of the EPT genera. Nevertheless, categorisation of river class (water quality) based on single parameter by the National Interim Water Quality Standards (DOE 2002) assigns the river with such water pH (4.06 to 6.21) into Class III, similar to the EPT taxa Richness Index categorisation of the river (Good-Fair). In this case the EPT taxa Richness Index is very sensitive in detecting the quality of the water compared to the WQI although only one of WQI’s parameter falls in the range of poorer quality.
For biological organisms, the increasing acidity of water obviously affected in decreasing of organic matter decomposition (Burton et al. 1985) and a decrease in macroinvertebrate’s diversity (Okland & Okland 1986, Winterbourn & Collier 1987, Suhaila & Che Salmah 2014). Changes in macroinvertebrate assemblages that changed the predator-prey relationships are coincided with the acidification of the water (Bendell & Macnicol, 1987; Eriksson et al. 1980) especially the Ephemeroptera that survive well in an acidic environment (Dangles & Guerold
EPT in Water Quality Assessment
155
2000). Similarly, ephemeropterans Baetidae and Heptageniidae proliferated in Teroi River but the diversity of EPT in this river was lower compared to two other rivers.
In this study, Baetis spp. and Platybaetis spp. (Ephemeroptera) showed high tolerance to wide pH range, from acidic to neutral (4.90 to 7.0). Based on the CCA biplot, the most abundant taxa in Teroi River were Baetis spp. and Platybaetis spp. and indicated preference to low pH water. Gerhadt et al. (2005) stated that mayflies are able to survive in acidic water with pH as low as 4.5. According to Rosemond et al. (1992), in Great Smoky Mountains National Park, Tennesse, USA, the ephemeropteran Ameletus lineatus Traver (family Siphonoluridae) was found more abundant in a more acidic water (pH 4.5 to 6.4) compared to other species. Nevertheless, Baetis spp. is present in high abundances in many rivers due to its active oviposition, which in turn depends largely on the availability of egg deposition sites (Elliott 1972; Bengtsson 1988). Peckarsky et al. (2000) noticed an increase in egg deposition by B.bicaudatus while working in a high-altitude river and advocated that this is the result of increased number of rock substrates protruding from the water surface. Although bedrock formed the substrate of Teroi River, high abundance of Baetis spp. implied that this river had rock surfaces suitability as oviposition sites for this species.
Increasing pH values (neutral) which were recorded from Tupah and Batu Hampar rivers negatively correlated with plecopterans such as Neoperla spp. and Cryptoperla spp. and Cheumatopsyche spp. (Trichoptera). Thus, the absence of caenids, leptophlebiids and oligoneurids in Teroi River implicated that these genera were not able to withstand acidic water. Other ephemeropterans in Teroi River such as Thalerosphyrus spp., Campsoneuria spp., Epeorus spp., Baetis spp., Platybaetis spp., Centroptilum spp., Tricorythus spp., Teloganodes spp. and Crinitella spp. which were also found in other rivers, tolerated wide range of water pH.
The contents of COD and NH3-N were relatively low in all rivers. Although slightly higher values of these parameters were recorded in Teroi River, this level did not exceed the Class II limit of the Malaysian WQI thus their influence on EPT diversity seemed negligible. Among the three rivers, Teroi River had a higher NH3-N content in the water which probably caused by animals’ excreta especially from the large population of monkeys (long-tailed and pig-tailed macaques) found in the river’ surroundings. Only trichopterans Hydropsyche spp. and Macrostemum spp. negatively correlated with NH3-N content and they were well represented in Batu Hampar River. Tupah and Batu Hampar Rivers had low NH3-N contents showing that both rivers are having good water quality.
Kamimuria spp. and Neoperla spp. from family Perlidae breath through external gills on their thoraxes and abdomens. The gills are located along the body, effectuating this family dependence on high dissolved oxygen in the water to respire thus influences distribution of Kamimuria spp. in rivers as observed in this study. On the other hand, the amount of BOD in the water charcterized the distribution of Phanoperla spp. (Plecoptera) and Cheumatopsyche spp. (Trichoptera). The water body with high levels of organic matters relatively has
Suhaila Ab Hamid and Che Salmah Md Rawi
156
higher content of BOD (Thani & Phalaraksh 2008). The highest BOD3 content (1.93 mg/L) was recorded in Tupah River because besides forest debris, other organic matters could be introduced by high number of visitors in the area. However, the values recorded in Tupah River did not exceed the upper limit of Class II of WQI of Malaysia (DOE 2002).
Furthermore, Tupah and Batu Hampar rivers had lower TSS content compared to Teroi River which implicates the water column in these rivers had less suspended particles. Clean clear water may have positive effects on food availability as sunlight penetration can increase photosynthesis process in algae and macrophytes. This appropriate condition favours the EPT community resulting more diverse taxa.
The status of water quality in all rivers from the WQI and EPT taxa Richness Index classifications were further supported by the results of the canonical corresponding analysis (CCA) which compared the physico-chemical data with the diversity of EPT. The three rivers were classified into two groups. The first group which includes Tupah and Batu Hampar Rivers, has a good quality of water. Teroi River made the second group with excellent water quality (WQI) but it has lesser EPT taxa. The separation of rivers following the distribution of EPT taxa in this study correlated strongly with the quality of water of the WQI. They both separated the rivers based on shared water quality. This is obvious when the WQI classified the water quality in Teroi River into Class I while the EPT taxa Richness Index assigned it into good-fair category which is equivalent or more or less similar to Class III of the WQI. It is best to note that the WQI classification focuses on quality of water using values of physico-chemical water parameters strictly for human uses and completely ignores the tolerances of aquatic organisms towards its selected parameters.
CONCLUSION
The EPT taxa Richness Index is sensitive to environmental impairment as EPT taxa are potentially sensitive to changes (especially increasing disturbances) in various headwater water parameters. Therefore using the EPT taxa Richness Index is a relatively accurate biological parameter to detect aquatic disturbances although more investigation is required to further improve the application of the index. The survival of EPTs depends strongly on the good ranges of the river physico-chemical environment that indirectly indicates healthy river status, hence increases reliability of water quality assessment especially in pristine environments. This study indicated that the EPT taxa Richness Index is more effective than the WQI in classifying the river water quality in GJFR.
EPT in Water Quality Assessment
157
ACKNOWLEDGEMENT
We thank the School of Biological Sciences, USM, for providing various facilities to carry out this study. We appreciate many individuals from the Laboratory of Aquatic Entomology (USM) who tirelessly helping us both in the field and in the laboratory. This study was supported by the Fundamental Research Grant Scheme (203/PBIOL/6711412), Ministry of Higher Education (MOHE), Malaysia.
REFERENCES
Al-Shami S A, Che Salmah M R, Siti Azizah M and Abu Hassan A. (2010). The influence of routine agricultural activities on the quality of water in a tropical rice field ecosystem. Applied Ecology and Environmental Research 8: 11–18. https://doi.org/10.15666/aeer/0801_011018
Azrina M Z, Yap C K, Abdul Rahim I, Ismail A and Tan S G. (2006). Anthropogenic impacts on the distribution and biodiversity of benthic macroinvertebrates and water quality of the Langat River, Peninsular Malaysia. Ecotoxicology Environmental Safety 64: 337–347. https://doi.org/10.1016/j.ecoenv.2005.04.003
Bendell B E and Macnicol D K. (1987). Fish predation, lake acidity and the composition of aquatic insect assemblages. Hydrobiologia 150: 193-202. https://doi.org/10.1007/BF00008703
Bengtsson J. (1988). Autecological studies on Baetis rhodani (Pict.) (Ephemeroptera). Archive Hydrology 111: 615–623.
Bispo P C, Froehlich C G and Oliveira L G. (2002). Stonefly (Plecoptera) fauna of streams in a mountainous area of Central Brazil: abiotic factors and nymph density. Revista Brasileira de Zoologia 19: 325–334. https://doi.org/10.1590/S0101-81752002000500026
Bispo P C and Oliveira L G. (2007). Diversity and structure of Ephemeroptera, Plecoptera and Trichoptera (Insecta) assemblages from riffles in mountain streams of Central Brazil. Revista Brasileira de Zoologia 24: 283–293. https://doi.org/10.1590/S0101-81752007000200004
Bonada N, Prat N, Resh V H and Statzner B. (2006). Developments in Aquatic Insect Biomonitoring: A comparative analysis of recent approaches. Annual Review Entomology 51: 495–523. https://doi.org/10.1146/annurev.ento.51.110104.151124
Boyd C E. (1990). Water quality in ponds for aquaculture. Alabama: Birmingham Publishing Company.
Burton T M, Stanford R M and Allan J W. (1985). Acidification effects on stream biota and organic matter processing. Canadian Journal of Fish and Aquatic Science 42: 669–675. https://doi.org/10.1139/f85-086
Chapman D. (1996). Water quality assessments. New York: Chapman and Hall. https://doi.org/10.4324/NOE0419216001
Che Salmah M R, Abu Hassan A and Jongkar G. (2007). Diversity of Ephemeroptera, Plecoptera and Trichoptera in various tributaries of Temenggor Catchment, Perak, Malaysia. Wetland Science 5: 223–231.
Chow K T. (1980). Some geochemical studies of the metaquartzites of the Jerai Formation, Kedah. Geological Society of Malaysia Bulletin 13: 57–62.
Suhaila Ab Hamid and Che Salmah Md Rawi
158
Dangles O J and Guerold F A. (2000). Structural and functional responses of benthic macroinvertebrates to acid precipitation in two forested headwater atreams (Vosges Mountains, northeastern France). Hydrobiologia 418: 25–31. https://doi.org/10.1023/A:1003805902634
Department of Environment (DOE). (2002). Malaysia Environmental Quality Report 2001. Kuala Lumpur: Department of Environment, Ministry of Science, Technology and Environment Malaysia.
Department of Environment (DOE) (2003). The study of pollution prevention and water quality improvement of Sungai Tebrau and Sungai Segget. Kuala Lumpur, Department of Environment, Ministry of Science, Technology and Environment Malaysia.
Dudgeon D. (1984). Longitudinal and temporal changes in functional organization of the macroinvertebrate communities in the Tsuen River, Hong Kong. Hydrobiologia 111: 207–317. https://doi.org/10.1007/BF00007201
Dudgeon D. (1996). The life history, secondary production and microdistribution of Ephemera spp. (Ephemroptera: Ephemeridae) in a tropical forest stream. Fundamental and Applied Limnology 135: 473–483.
Dudgeon D. (1999). Tropical Asian Streams: Zoobenthos, Ecology and Conservation. Hong Kong: Hong Kong University Press.
Dudgeon D. (2000). Riverine biodiversity in Asia: A challenge for conservation biology. Hydrobiologia 418: 1–13. https://doi.org/10.1023/A:1003998519910
Dudgeon D. (2008). Tropical stream ecology. California: Elsevier Inc. Elliott JM. (1972) Effect of temperature on the time of hatching in Baetis rhodani
(Ephemeroptera: Baetidae). Oecologia 9: 47–51. https://doi.org/10.1007/BF00345242
Elliott J M. (1973). Some methods for the statistical analysis of samples of benthic invertebrates. Freshwater Biological Association Scientific Publication.
Eriksson M O, Henrikson G L, Nilsson B I, Nyman G, Oscarson H C, Stenson A E and Larsson K. (1980). Predator-prey relations important for the biotic changes in acidified lakes. Ambio 9: 248–259.
Gerhad A, Jassens de Bisthoven L and Soares A M V M. (2005). Effects of acid mine drainage and acidity on the activity of Choroterpes picteti (Ephemeroptera: Leptophlebiidae). Archieve Environmental Contamination and Toxicology 48: 450–458. https://doi.org/10.1007/s00244-003-0222-2
Gopal B. (2005). Does inland aquatic biodiversity have a future in Asian developing countries?. Hydrobiologia 542: 69–75. https://doi.org/10.1007/s10750-004-5736-8
Hellawell J M. (1986). Biological Indicators of Freshwater Pollution and Environmental Management. New York: Elsevier Applied Science. https://doi.org/10.1007/978-94-009-4315-5
Kenneth W S and Bill P S. (1993). Nymphs of North America Stonefly genera (Plecoptera). Denton: University of North Texas Press,
Lazaridou-Dimitriadou M. (2002). Seasonal variation of the water quality of rivers and streams of eastern Mediterranean. Web Ecology 3: 20–32. https://doi.org/10.5194/we-3-20-2002
Lenat D R. (1993). A biotic index for the southeastern United States: deviation and list of tolerence values with criteria for assigning water quality ratings. Journal of North American Benthological Society 12: 279–290. https://doi.org/10.2307/1467463
Lenat D R and Penrose D L. (1996). History of the EPT taxa richness metric. Bulletin North American Benthological Society 12: 279–290. https://doi.org/10.2307/1467463
EPT in Water Quality Assessment
159
Merritt R W, Cummins K W and Berg M B. (2008). An introduction to the aquatic insects of North America. Fourth Edition. Iowa: Kendall/Hunt Publishing Company.
Morse J C, Yang L and Tian L. (1994). Aquatic insects of China useful for monitoring water quality. Nanjing, China: Hehai University Press.
Ogbeibu A E and Victor R. (1989). The effects of road and bridge construction on the bankroot macroinvertebrates of a southern Nigerian stream. Environmental Pollution 56: 85–100. https://doi.org/10.1016/0269-7491(89)90168-1
Okland J and Okland K A. (1986). The effects of acid deposition on benthic animals in lakes and streams. Experentia 42: 471–486. https://doi.org/10.1007/BF01946685
Peckarsky B L, Taylor B W and Caudill C C. (2000). Hydrologic and behavioral constraints on oviposition of stream insects: implications for adult dispersa. Oecologia 125: 186-200. https://doi.org/10.1007/s004420000446
Radwell A J and Brown V A. (2007). Benthic meiofauna assemblages structure of headwater streams: density and distribution of taxa relative to substrate size. Aquatic Ecology 42: 405–414. https://doi.org/10.1007/s10452-007-9108-0
Rosenberg D M and Resh V H. (1993). Freshwater Biomonitoring and Benthic Macroinvertebrates. Boston, Kluwer Academic Publishers.
Rosemond A D, Reice S R, Elwood J W and Mulholland P J. (1992). The effects of stream acidity on benthic invertebrate communities in the south-eastern United States. Freshwater Biology 27: 193–209. https://doi.org/10.1111/j.1365-2427.1992.tb00533.x
Salman A S, Che Salmah M R, Siti Azizah M N, Abu Hassan A and Arshad A. (2010). Morphological deformities in Chironomus spp. (Diptera: Chironomidae) larvae as a tool for impact assessment of anthropogenic and environmental stresses on three Rivers in the Juru River System, Penang, Malaysia. Environmental Entomology 39: 210–222. https://doi.org/10.1603/EN09109
Suhaila A H and Che Salmah M R. (2011). Influence of substrate-embeddedness and canopy cover on the abundance and diversity of Ephemeroptera, Plecoptera and Trichoptera (EPT) in recreational rivers. Aquatic Insects 33: 281-292.
Suhaila A H and Che Salmah M R. (2014). Ecology of Ephemeroptera, Plecoptera and Trichoptera (Insecta) in rivers of Gunung Jerai Forest Reserve: Diversity and distribution of functional feeding groups. Life Science Tropical Research 25(1): 61–73.
Suhaila A H, Che Salmah M R and Nurul Huda A. (2014). Seasonal abundance and diversity of aquatic insects in rivers from Gunung Jerai Forest Reserve, Malaysia. Sains Malaysiana 43(5): 667–674.
Suhaila A H, Mohd Fakhrullah Salafusalam M A and Nur Aida H. (2016). Role of Ephemeroptera, Plecoptera and Trichoptera (Insecta) functional feeding groups in leaf decomposition in tropical river. Journal of Biodiversity and Environmental Sciences 9(1): 204–213.
Thani I and Phalaraksh C. (2008). A preliminary study of aquatic insect diversity and water quality of Mekong River, Thailand. KKU Science Journal 36: 95-106.
USEPA. (1990). National sewage sludge survey: Availability of information and data, and anticipated impacts on proposed regulations. Federal Register 55: 47210–47283.
Wan Mohd Hafezul W A G, Che Salmah M R, Suhaila A H and Salman A S. (2016). Efficiency of different sampling gears for aquatic macroinvertebrates collections in Malaysian streams. Tropical Life Sciences Research 27(1): 115–134.
Wiggins G B. (1996). Larvae of the North American Caddisfly Genera (Trichoptera). Second Edition. Toronto: University of Toronto Press.

Suhaila Ab Hamid and Che Salmah Md Rawi
160
Winterbourn M J and Collier K J. (1987). Distribution of benthic invertebrates in acid, brown water streams in the South Island of New Zealand. Hydrobiologia 153: 277–286. https://doi.org/10.1007/BF00007214
Yap S Y. (2005). A comparison of the macro-invertebrate communities in two Malaysian streams. Journal of Aquatic Science 20: 13–26. https://doi.org/10.4314/jas.v20i1.20034
Yule C M and Yong H S. (2004). Freshwater invertebrates of the Malaysian region. Kuala Lumpur: Academy of Science Malaysia.
EPT in Water Quality Assessment
161
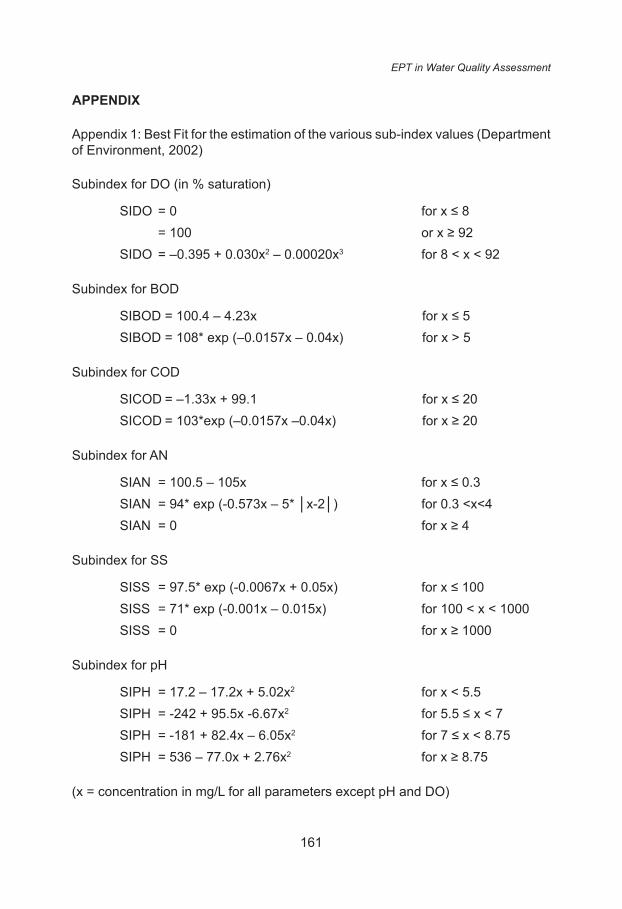
APPENDIX
Appendix 1: Best Fit for the estimation of the various sub-index values (Department of Environment, 2002)
Subindex for DO (in % saturation)
SIDO = 0 for x ≤ 8= 100 or x ≥ 92
SIDO = –0.395 + 0.030x2 – 0.00020x3 for 8 < x < 92
Subindex for BOD
SIBOD = 100.4 – 4.23x for x ≤ 5SIBOD = 108* exp (–0.0157x – 0.04x) for x > 5
Subindex for COD
SICOD = –1.33x + 99.1 for x ≤ 20SICOD = 103*exp (–0.0157x –0.04x) for x ≥ 20
Subindex for AN
SIAN = 100.5 – 105x for x ≤ 0.3SIAN = 94* exp (-0.573x – 5* │x-2│) for 0.3 <x<4SIAN = 0 for x ≥ 4
Subindex for SS
SISS = 97.5* exp (-0.0067x + 0.05x) for x ≤ 100SISS = 71* exp (-0.001x – 0.015x) for 100 < x < 1000SISS = 0 for x ≥ 1000
Subindex for pH
SIPH = 17.2 – 17.2x + 5.02x2 for x < 5.5SIPH = -242 + 95.5x -6.67x2 for 5.5 ≤ x < 7SIPH = -181 + 82.4x – 6.05x2 for 7 ≤ x < 8.75SIPH = 536 – 77.0x + 2.76x2 for x ≥ 8.75
(x = concentration in mg/L for all parameters except pH and DO)

Suhaila Ab Hamid and Che Salmah Md Rawi
162
Aggregate the calculation according to the following equation:
WQI = 0.22 x SIDO + 0.19 x SIBOD + 0.16 x SICOD + 0.15 x SIAN + 0.16 x SISS + 0.12 x SIPH
Where SI is the subindex of each parameter. Based on the WQI values, the water quality is categorized.