abf malaysia bond index fund - malaysiastock.biz name abf malaysia bond index fund (“fund”) ......
TRANSCRIPT

Annual Report for
31 December 2016
ABF Malaysia Bond Index Fund
ABF Malaysia Bond Index Fund
ABF Malaysia Bond Index Fund
Annual Report
31 December 2016

ABF Malaysia Bond Index Fund
TRUST DIRECTORY
Manager
AmFunds Management Berhad
9th & 10
th Floor, Bangunan AmBank Group
55 Jalan Raja Chulan
50200 Kuala Lumpur
Board of Directors
Pushparani a/p Moothathamby
Mustafa Mohd Nor
Tai Terk Lin
Datin Maznah Mahbob
Sum Leng Kuang
Investment Committee
Sum Leng Kuang
Tai Terk Lin
Mustafa Mohd Nor
Zainal Abidin Mohd Kassim
Datin Maznah Mahbob
Trustee
HSBC (Malaysia) Trustee Berhad
Auditors and Reporting Accountants
Ernst & Young
Taxation Adviser
Deloitte Tax Services Sdn Bhd
ABF Malaysia Bond Index Fund
CORPORATE DIRECTORY
AmFunds Management Berhad
Registered Office
22nd
Floor, Bangunan AmBank Group
55, Jalan Raja Chulan, 50200 Kuala Lumpur
Tel:03-2036 2633 Fax: 03-2032 1914
Head Office
9th & 10
th Floor, Bangunan AmBank Group
55, Jalan Raja Chulan, 50200 Kuala Lumpur
Tel:03-2036 2888 Fax: 03-2031 5210
Secretary
Koh Suet Peng (MAICSA 7019861)
Hafidzah Binti Zakaria (MAICSA 7052802)
22nd
Floor, Bangunan AmBank Group
55, Jalan Raja Chulan, 50200 Kuala Lumpur
HSBC (Malaysia) Trustee Berhad
Business/Registered Office/Head Office
Fund Services, Bangunan HSBC, 13th Floor, South Tower
No.2, Leboh Ampang, 50100 Kuala Lumpur
Tel: 03-2075 7800 Fax: 03-2026 1273
ABF Malaysia Bond Index Fund
CONTENTS
1 Manager’s Report
21 Additional Information
31 Independent Auditor’s Report to the Unitholders
35 Statement of Financial Position
36 Statement of Comprehensive Income
37 Statement of Changes in Equity
38 Statement of Cash Flows
39 Notes to the Financial Statements
59 Statement by the Manager
60 Trustee’s Report
61 Directory
1
MANAGER’S REPORT
Dear Unitholders,
We are pleased to present you the Manager’s report and the audited accounts of ABF Malaysia Bond
Index Fund (“Fund”) for the financial year ended 31 December 2016.
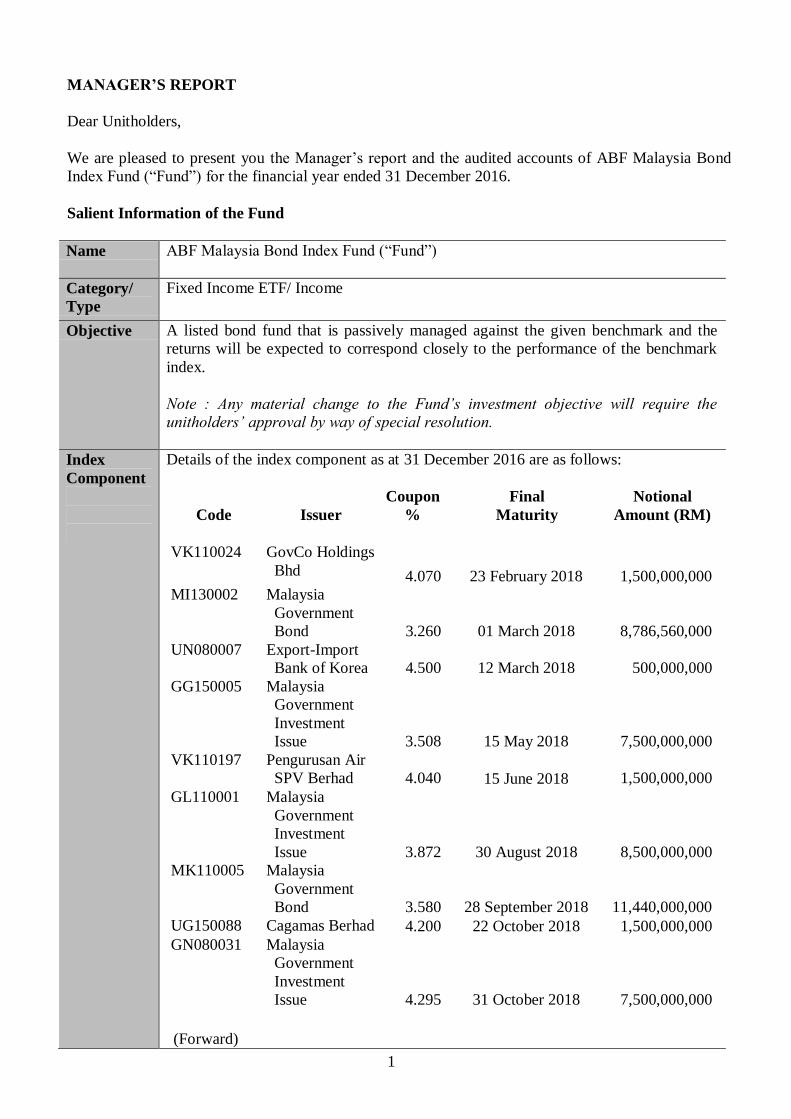
Salient Information of the Fund
Name ABF Malaysia Bond Index Fund (“Fund”)
Category/
Type
Fixed Income ETF/ Income
Objective A listed bond fund that is passively managed against the given benchmark and the
returns will be expected to correspond closely to the performance of the benchmark
index.
Note : Any material change to the Fund’s investment objective will require the
unitholders’ approval by way of special resolution.
Index
Component
Details of the index component as at 31 December 2016 are as follows:
Code Issuer
Coupon
%
Final
Maturity
Notional
Amount (RM)
VK110024 GovCo Holdings
Bhd 4.070 23 February 2018
1,500,000,000
MI130002 Malaysia
Government
Bond 3.260 01 March 2018
8,786,560,000
UN080007 Export-Import
Bank of Korea 4.500 12 March 2018 500,000,000
GG150005 Malaysia
Government
Investment
Issue
3.508 15 May 2018
7,500,000,000
VK110197 Pengurusan Air
SPV Berhad
4.040 15 June 2018
1,500,000,000
GL110001 Malaysia
Government
Investment
Issue
3.872 30 August 2018
8,500,000,000
MK110005 Malaysia
Government
Bond
3.580 28 September 2018
11,440,000,000
UG150088 Cagamas Berhad 4.200 22 October 2018 1,500,000,000
GN080031 Malaysia
Government
Investment
Issue
4.295
31 October 2018
7,500,000,000
(Forward)
2
Code
Issuer
Coupon
%
Final
Maturity
Notional
Amount (RM)
UI130109 Cagamas Berhad 3.900 16 November 2018 800,000,000
GJ130055 Malaysia
Government
Investment
Issue 3.399 30 November 2018
4,000,000,000
UG160018 Cagamas Berhad 4.100 04 February 2019 1,120,000,000
VI140030 Pengurusan Air
SPV Berhad 4.160 07 February 2019
1,000,000,000
VI140036 Prasarana
Malaysia Bhd 4.080 12 March 2019
1,500,000,000
MH150005 Malaysia
Government
Bond 3.759 15 March 2019
7,177,897,000
GJ130070 Malaysia
Government
Investment
Issue 3.558 30 April 2019
10,000,000,000
MS04003H Malaysia
Government
Bond 5.734 30 July 2019
7,315,545,000
GO090001 Malaysia
Government
Investment
Issue 3.910 13 August 2019
6,000,000,000
GL120021 Malaysia
Government
Investment
Issue 3.704 30 September 2019
8,000,000,000
UG160121 Cagamas Berhad 3.750 18 October 2019 580,000,000
MJ140004 Malaysia
Government
Bond 3.654 31 October 2019
11,800,000,000
MO090002 Malaysia
Government
Bond 4.378 29 November 2019
17,119,000,000
ML120006 Malaysia
Government
Bond 3.492 31 March 2020
11,000,000,000
VI150052 Danga Capital
Bhd 4.100 09 April 2020 2,000,000,000
GH160004 Malaysia
Government
Investment
Issue 3.226 15 April 2020
3,500,000,000
(Forward)
3
Code
Issuer
Coupon
%
Final
Maturity
Notional
Amount (RM)
GO090061 Malaysia
Government
Investment
Issue 4.492 30 April 2020
3,500,000,000
GL120098 Malaysia
Government
Investment
Issue 3.576 15 May 2020
11,000,000,000
GN100021 Malaysia
Government
Investment
Issue 4.284 15 Jun 2020
5,500,000,000
MK130006
Malaysia Government
Bond 3.889 31 July 2020
7,973,060,000
GJ150002
Malaysia
Government
Investment Issue 3.799 27 August 2020
10,000,000,000
VI150192
Pengurusan Air
SPV Berhad 4.280 28 September 2020
700,000,000
MJ150003
Malaysia
Government Bond 3.659 15 October 2020
11,742,134,000
VJ140355
Pengurusan Air
SPV Berhad 4.100 5 November 2020
500,000,000
GN100060
Malaysia
Government
Investment Issue 3.998 30 November 2020
3,000,000,000
VN110023
GovCo Holdings
Bhd 4.450 23 February 2021
1,500,000,000
GL130069
Malaysia
Government
Investment Issue 3.716 23 March 2021
9,500,000,000
GN110025
Malaysia
Government
Investment Issue 4.170 30 April 2021
12,500,000,000
MO110001 Malaysia
Government Bond 4.160 15 July 2021
13,500,000,000
GJ160002
Malaysia
Government
Investment Issue 3.743 26 August 2021
7,000,000,000
VK140222
Bank Pembangunan
Malaysia Berhad 4.190 10 September 2021
700,000,000
VI160277
Lembaga
Pembiayaan
Perumahan Sektor
Awam 3.600 21 September 2021
600,000,000
ML140003
Malaysia
Government Bond 4.048 30 September 2021
11,700,000,000
(Forward)
4
Code
Issuer
Coupon
%
Final
Maturity
Notional
Amount (RM)
MJ160004 Malaysia
Government Bond 3.620 30 November 2021
7,000,000,000
VN120202
Perbadanan Tabung
Pendidikan Tinggi
Nasional 3.850 15 June 2022
2,500,000,000
GL150001
Malaysia
Government
Investment Issue 4.194 15 July 2022
10,000,000,000
MO120001 Malaysia
Government Bond 3.418 15 August 2022
10,500,000,000
ML150002
Malaysia
Government Bond 3.795 30 September 2022
11,000,000,000
VK150210
Rantau Abang
Capital Bhd 4.570 19 October 2022
1,500,000,000
GO120037
Malaysia
Government
Investment Issue 3.699 15 November 2022
8,500,000,000
VN120393
Turus Pesawat Sdn
Bhd 3.740 18 November 2022
500,000,000
VN130068
Turus Pesawat Sdn
Bhd 3.770 3 February 2023
500,000,000
MN130003
Malaysia
Government Bond 3.480 15 March 2023
11,420,000,000
GL160001
Malaysia
Government
Investment Issue 4.390 7 July 2023
10,500,000,000
DS081080
Khazanah Nasional
Berhad 0 14 August 2023
2,000,000,000
ML160001
Malaysia
Government Bond 3.800 17 August 2023
10,000,000,000
VK160278
Lembaga
Pembiayaan
Perumahan Sektor
Awam 3.830 21 September 2023
700,000,000
VN130259 Cagamas Berhad 4.300 27 October 2023 645,000,000
GO130033
Malaysia
Government
Investment Issue 3.493 31 October 2023
4,000,000,000
VN140090
Perbadanan Tabung
Pendidikan Tinggi
Nasional 4.670 28 March 2024
1,800,000,000
GO130071
Malaysia
Government
Investment Issue 4.444 22 May 2024
12,500,000,000
MO140001
Malaysia
Government Bond 4.181 15 July 2024
11,020,000,000
VN140223
Bank Pembangunan
Malaysia Berhad 4.380 12 September 2024
500,000,000
(Forward)
5
Code Issuer
Coupon
% Final Maturity
Notional
Amount (RM)
VP120394
Turus Pesawat Sdn
Bhd 3.930 19 November 2024
500,000,000
VN150103 Jambatan Kedua
Sdn Bhd 4.300 28 May 2025 1,300,000,000
MY050003
Malaysia
Government Bond 4.837 15 July 2025
3,000,000,000
MO150001 Malaysia
Government Bond 3.955 15 September 2025
13,672,200,000
VN150193 Pengurusan Air
SPV Berhad 4.63 26 September 2025
860,000,000
GO150004 Malaysia
Government
Investment Issue 3.990 15 October 2025
10,500,000,000
VN160022 Danga Capital Bhd 4.600 23 February 2026 1,500,000,000
MS110003 Malaysia
Government Bond 4.392 15 April 2026
10,574,330,000
VN160231 Perbadanan Tabung
Pendidikan Tinggi
Nasional 4.200 27 July 2026
1,000,000,000
VN160235 Jambatan Kedua
Sdn Bhd 4.200 28 July 2026
1,000,000,000
VS110260 Prasarana Malaysia
Bhd 4.350 04 August 2026
1,200,000,000
MX060002 Malaysia
Government Bond 4.709 15 September 2026
3,110,000,000
VN160279 Lembaga
Pembiayaan
Perumahan Sektor
Awam 4.050 21 September 2026
700,000,000
GO160003 Malaysia
Government
Investment Issue 4.070 30 September 2026
10,500,000,000
VN160330 Bank Pembangunan
Malaysia Berhad 4.500 04 November 2026
850,000,000
MO160003 Malaysia
Government Bond 3.900 30 November 2026
9,000,000,000
MS120002 Malaysia
Government Bond 3.892 15 March 2027
5,500,000,000
MX070003 Malaysia
Government Bond 3.502 31 May 2027
6,000,000,000
GS120059 Malaysia
Government
Investment Issue 3.899 15 June 2027
5,000,000,000
VS120395 Turus Pesawat Sdn
Bhd 4.120 19 November 2027
750,000,000
MS130005 Malaysia
Government Bond 3.733 15 June 2028
5,000,000,000
(Forward)
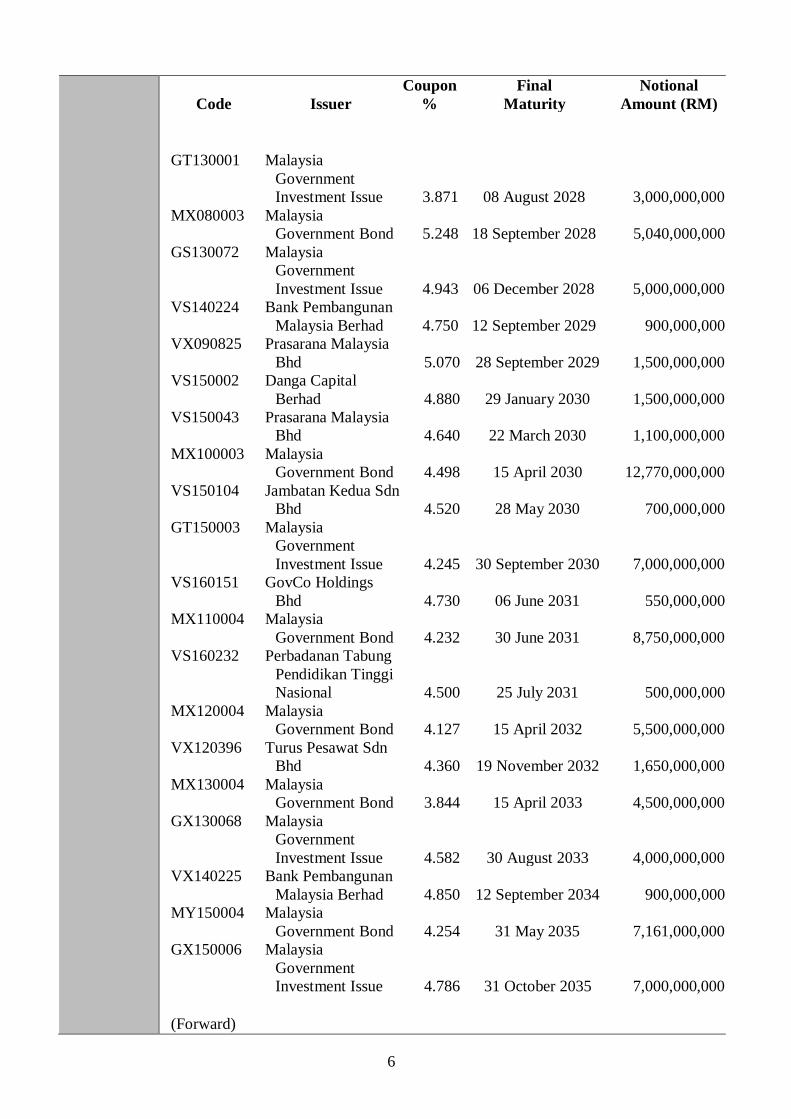
6
Code Issuer
Coupon
%
Final
Maturity
Notional
Amount (RM)
GT130001 Malaysia
Government
Investment Issue 3.871 08 August 2028
3,000,000,000
MX080003 Malaysia
Government Bond 5.248 18 September 2028 5,040,000,000
GS130072 Malaysia
Government
Investment Issue 4.943 06 December 2028
5,000,000,000
VS140224 Bank Pembangunan
Malaysia Berhad 4.750 12 September 2029
900,000,000
VX090825 Prasarana Malaysia
Bhd 5.070 28 September 2029
1,500,000,000
VS150002 Danga Capital
Berhad 4.880 29 January 2030
1,500,000,000
VS150043 Prasarana Malaysia
Bhd 4.640 22 March 2030
1,100,000,000
MX100003 Malaysia
Government Bond 4.498 15 April 2030
12,770,000,000
VS150104 Jambatan Kedua Sdn
Bhd 4.520 28 May 2030
700,000,000
GT150003 Malaysia
Government
Investment Issue 4.245 30 September 2030
7,000,000,000
VS160151 GovCo Holdings
Bhd 4.730 06 June 2031
550,000,000
MX110004 Malaysia
Government Bond 4.232 30 June 2031
8,750,000,000
VS160232 Perbadanan Tabung
Pendidikan Tinggi
Nasional 4.500 25 July 2031
500,000,000
MX120004 Malaysia
Government Bond 4.127 15 April 2032
5,500,000,000
VX120396 Turus Pesawat Sdn
Bhd 4.360 19 November 2032
1,650,000,000
MX130004 Malaysia
Government Bond 3.844 15 April 2033
4,500,000,000
GX130068 Malaysia
Government
Investment Issue 4.582 30 August 2033
4,000,000,000
VX140225 Bank Pembangunan
Malaysia Berhad 4.850 12 September 2034
900,000,000
MY150004 Malaysia
Government Bond 4.254 31 May 2035
7,161,000,000
GX150006 Malaysia
Government
Investment Issue 4.786 31 October 2035
7,000,000,000
(Forward)
7
Code Issuer
Coupon
%
Final
Maturity
Notional
Amount (RM)
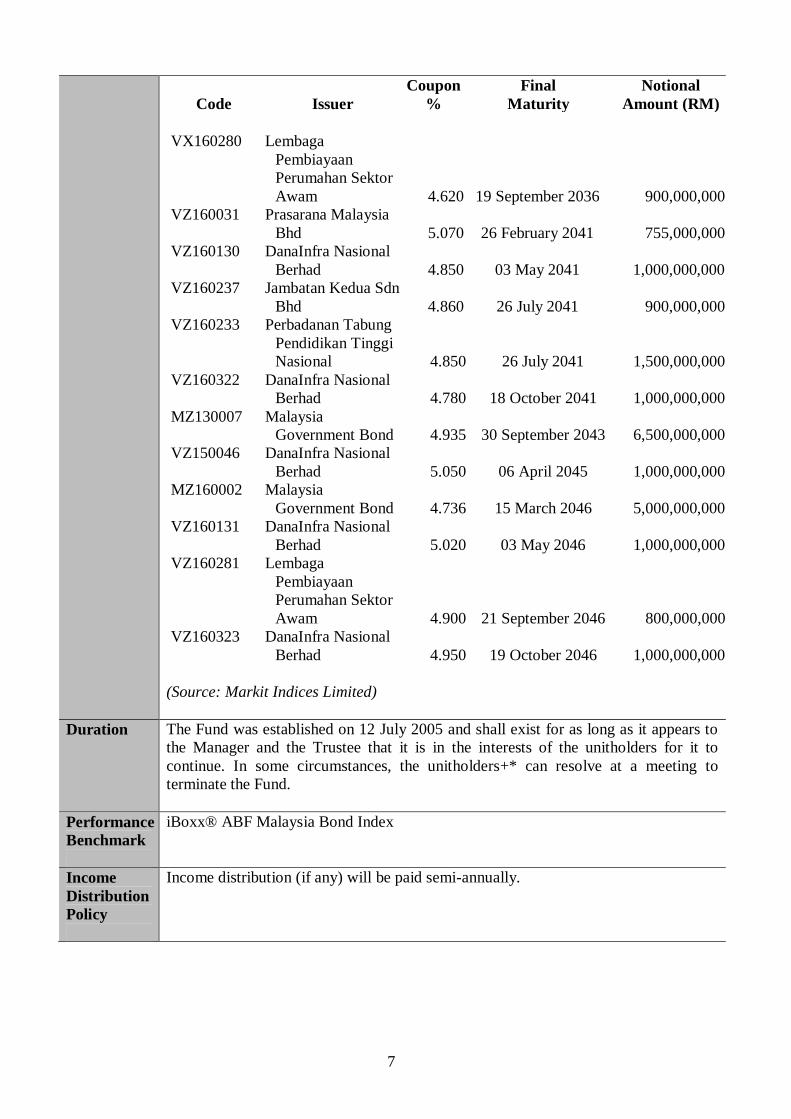
VX160280 Lembaga
Pembiayaan
Perumahan Sektor
Awam 4.620 19 September 2036
900,000,000
VZ160031 Prasarana Malaysia
Bhd 5.070 26 February 2041
755,000,000
VZ160130 DanaInfra Nasional
Berhad 4.850 03 May 2041
1,000,000,000
VZ160237 Jambatan Kedua Sdn
Bhd 4.860 26 July 2041
900,000,000
VZ160233 Perbadanan Tabung
Pendidikan Tinggi
Nasional 4.850 26 July 2041
1,500,000,000
VZ160322 DanaInfra Nasional
Berhad 4.780 18 October 2041
1,000,000,000
MZ130007 Malaysia
Government Bond 4.935 30 September 2043
6,500,000,000
VZ150046 DanaInfra Nasional
Berhad 5.050 06 April 2045
1,000,000,000
MZ160002 Malaysia
Government Bond 4.736 15 March 2046
5,000,000,000
VZ160131 DanaInfra Nasional
Berhad 5.020 03 May 2046
1,000,000,000
VZ160281 Lembaga
Pembiayaan
Perumahan Sektor
Awam 4.900 21 September 2046
800,000,000
VZ160323 DanaInfra Nasional
Berhad 4.950 19 October 2046
1,000,000,000
(Source: Markit Indices Limited)
Duration The Fund was established on 12 July 2005 and shall exist for as long as it appears to
the Manager and the Trustee that it is in the interests of the unitholders for it to
continue. In some circumstances, the unitholders+* can resolve at a meeting to
terminate the Fund.
Performance
Benchmark
iBoxx® ABF Malaysia Bond Index
Income
Distribution
Policy
Income distribution (if any) will be paid semi-annually.
8
Breakdown
of Unit
Holdings by
Size
For the financial year under review, the size of the Fund stood at 1,320,421,800 units.
Size of holding As at
31 December 2016
As at
31 December 2015
No of
units held
Number of
unitholders
No of
units held
Number of
unitholders
Less than 100 300 7 200 5
100 – 1,000 9,900 22 7,900 17
1,001 -10,000 54,700 13 32,200 8
10,001 – 100,000 109,600 4 27,000 2
100,001 to less than
5% of issue units 55,039,430 5 6,096,630 6
5% and above of
issue units 1,265,207,870 1 654,257,870 1
Fund Performance Data
Portfolio
Composition
Details of portfolio composition of the Fund for the financial years as at 31 December
are as follows:
FY
2016
%
FY
2015
%
FY
2014
%
Corporate bonds - 0.76 1.48
Malaysian Government Securities 95.16 90.57 78.21
Quasi-Government bonds 4.41 6.46 20.77
Cash and others 0.43 2.21 (0.46)
Total 100.00 100.00 100.00
Note: The abovementioned percentages are calculated based on total net asset value.
Performance
Details
Performance details of the Fund for the for the financial years ended 31 December are
as follows:
FY
2016
FY
2015
FY
2014
Net asset value (RM) 1,442,324,912* 1,341,876,193 685,894,438
Units in circulation 1,320,421,800* 1,265,421,800 660,421,800
Net asset value per unit (RM) 1.0923* 1.0604 1.0386
Highest net asset value per unit
(RM)
1.1224* 1.0655 1.0841
Lowest net asset value per unit
(RM)
1.0599* 1.0323 1.0355
Closing quoted price (RM/unit) 1.1100* 1.0520 1.0350
(Forward)
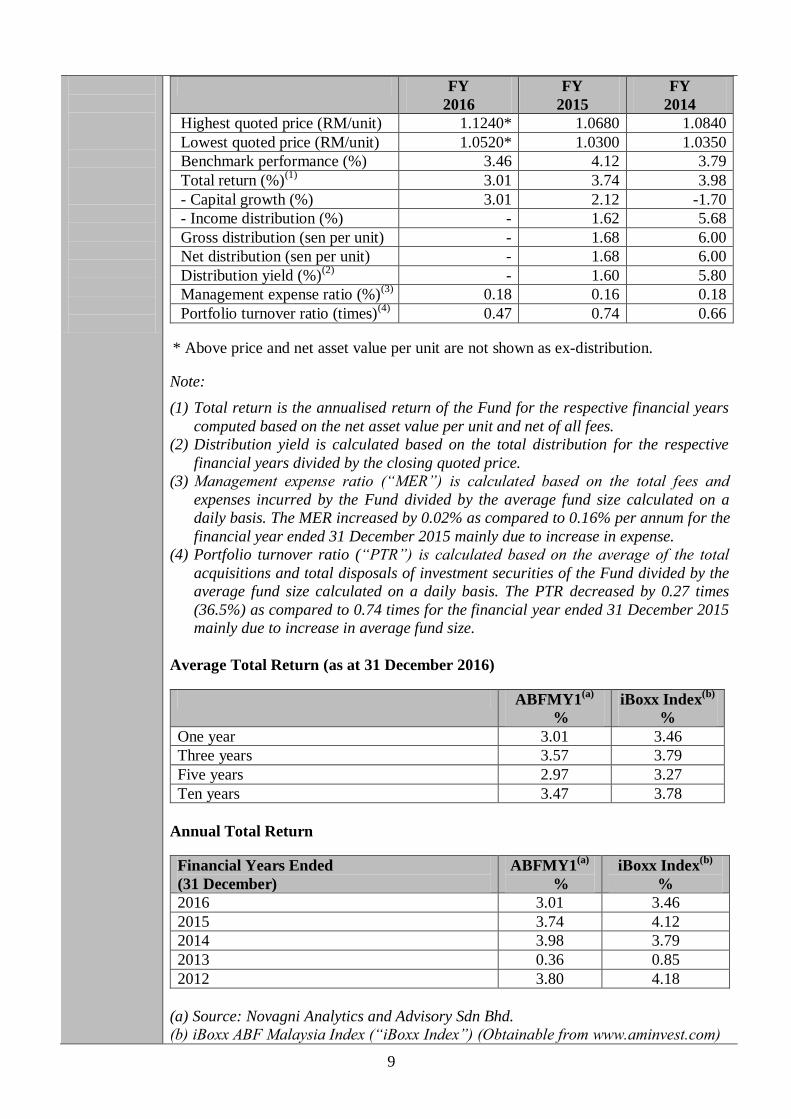
9
FY
2016
FY
2015
FY
2014
Highest quoted price (RM/unit) 1.1240* 1.0680 1.0840
Lowest quoted price (RM/unit) 1.0520* 1.0300 1.0350
Benchmark performance (%) 3.46 4.12 3.79
Total return (%)(1)
3.01 3.74 3.98
- Capital growth (%) 3.01 2.12 -1.70
- Income distribution (%) - 1.62 5.68
Gross distribution (sen per unit) - 1.68 6.00
Net distribution (sen per unit) - 1.68 6.00
Distribution yield (%)(2)
- 1.60 5.80
Management expense ratio (%)(3)
0.18 0.16 0.18
Portfolio turnover ratio (times)(4)
0.47 0.74 0.66
* Above price and net asset value per unit are not shown as ex-distribution.
Note:
(1) Total return is the annualised return of the Fund for the respective financial years
computed based on the net asset value per unit and net of all fees.
(2) Distribution yield is calculated based on the total distribution for the respective
financial years divided by the closing quoted price.
(3) Management expense ratio (“MER”) is calculated based on the total fees and
expenses incurred by the Fund divided by the average fund size calculated on a
daily basis. The MER increased by 0.02% as compared to 0.16% per annum for the
financial year ended 31 December 2015 mainly due to increase in expense.
(4) Portfolio turnover ratio (“PTR”) is calculated based on the average of the total
acquisitions and total disposals of investment securities of the Fund divided by the
average fund size calculated on a daily basis. The PTR decreased by 0.27 times
(36.5%) as compared to 0.74 times for the financial year ended 31 December 2015
mainly due to increase in average fund size.
Average Total Return (as at 31 December 2016)
ABFMY1(a)
%
iBoxx Index(b)
%
One year 3.01 3.46
Three years 3.57 3.79
Five years 2.97 3.27
Ten years 3.47 3.78
Annual Total Return
Financial Years Ended
(31 December)
ABFMY1(a)
%
iBoxx Index(b)
%
2016 3.01 3.46
2015 3.74 4.12
2014 3.98 3.79
2013 0.36 0.85
2012 3.80 4.18
(a) Source: Novagni Analytics and Advisory Sdn Bhd.
(b) iBoxx ABF Malaysia Index (“iBoxx Index”) (Obtainable from www.aminvest.com)
10
The Fund performance is calculated based on the net asset value per unit of the Fund.
Average total return of the Fund and its benchmark for a period is computed based on
the absolute return for that period annualised over one year.
Note: Past performance is not necessarily indicative of future performance and
that unit prices and investment returns may go down, as well as up.
Fund
Performance
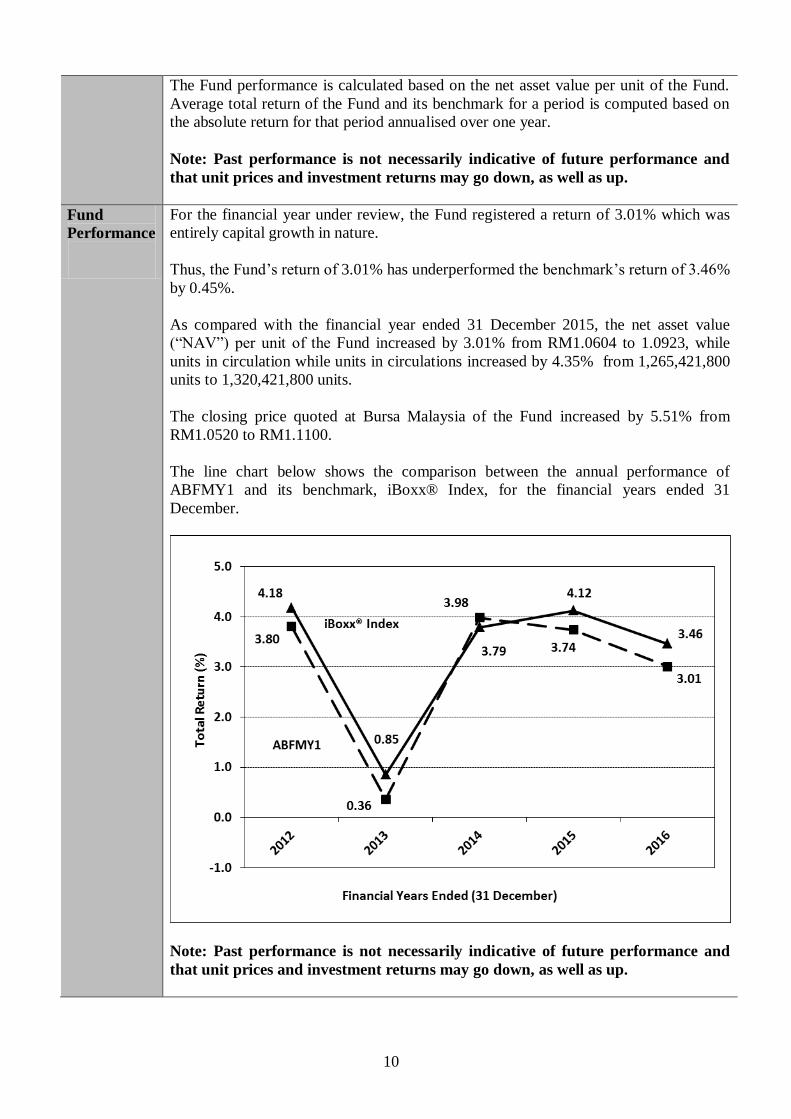
For the financial year under review, the Fund registered a return of 3.01% which was
entirely capital growth in nature.
Thus, the Fund’s return of 3.01% has underperformed the benchmark’s return of 3.46%
by 0.45%.
As compared with the financial year ended 31 December 2015, the net asset value
(“NAV”) per unit of the Fund increased by 3.01% from RM1.0604 to 1.0923, while
units in circulation while units in circulations increased by 4.35% from 1,265,421,800
units to 1,320,421,800 units.
The closing price quoted at Bursa Malaysia of the Fund increased by 5.51% from
RM1.0520 to RM1.1100.
The line chart below shows the comparison between the annual performance of
ABFMY1 and its benchmark, iBoxx® Index, for the financial years ended 31
December.
Note: Past performance is not necessarily indicative of future performance and
that unit prices and investment returns may go down, as well as up.
11
Has the Fund
achieved its
objective?
For the financial year under review, the Fund has met its objective i.e passively
managed against the given benchmark.
Strategies
and Policies
Employed
For the financial year under review, the Fund used a passive strategy whereby the
Manager aims, by way of representative sampling, to achieve a return on the Fund
Assets that closely tracks the returns of the benchmark index.
Portfolio
Structure
This table below is the asset allocation of the Fund for the financial years under review.
As at
31-12-2016
%
As at
31-12-2015
%
Changes
%
Corporate bonds - 0.76 -0.76
Malaysian Government Securities 95.16 90.57 4.59
Quasi-Government bonds 4.41 6.46 -2.05
Cash and others 0.43 2.21 -1.78
Total 100.00 100.00
There has been no significant change to the asset allocation since the last reporting
period.
Distribution/
unit splits
There was no income distribution and unit split declared for the financial year under
review.
State of
Affairs of
the Fund
There has been neither significant change to the state of affairs of the Fund nor any
circumstances that materially affect any interests of the unit holders during the
financial year under review.
Rebates
and Soft
Commission
It is our policy to pay all rebates to the Fund. Soft commission received from
brokers/dealers are retained by the Manager only if the goods and services provided are
of demonstrable benefit to unitholders of the Fund.
During the financial year under review, the Manager had received on behalf of the
Fund, soft commissions in the form of fundamental database, financial wire services,
technical analysis software and stock quotation system incidental to investment
management of the Fund. These soft commissions received by the Manager are deem
to be beneficial to the unitholders of the Fund.
Market
Review
Bank Negara Malaysia (“BNM”) kept the Overnight Policy Rate at 3.25% as widely
expected in the first Monetary Policy Committee (“MPC”) meeting of the year.
However, the policymaker surprised the market by cutting the Statutory Reserve
Requirement (“SRR”) by 50 bps to 3.50% at the same meeting as an attempt to ease
liquidity conditions and ensure that financial markets continue to function in an orderly
manner. During the month, global crude oil price continue to trend lower and dipped
below USD30 per barrel (“bbl”) at one point in time and this led to PM Najib
announcing the need to recalibrate the Budget for 2016 given that the Budget was
announced in October last year with an oil price assumption of USD48/bbl. The
recalibrated budget was subsequently announced on 28 January 2016 and largely
continues to demonstrate the commitment of the Malaysian government to maintain
12
fiscal discipline despite the lower oil revenue.
The key takeaways from the recalibrated Budget are as follows:
2016 Gross Domestic Product (“GDP”) growth revise to 4.0 – 4.5% (from 4.0 –
5.0% previously)
Budget based on oil price assumption of USD30-35/bbl
Budget deficit target remains unchanged and maintained at 3.1% of GDP
Operating expenditure to cut by RM4.0b by cutting grants to Government
Linked Companies (“GLCs”) and reducing wastage
Reduction in Employee’s provident Fund (“EPF”) contribution by 3%
Lastly, Moody’s revised Malaysia’s sovereign rating outlook from A3/Positive to
A3/Stable, bringing its view largely in line with the two other major rating agencies
(both at A-/Stable). This is largely to reflect the current external headwinds in the form
of prolonged weakness seen in global crude oil price which will negatively impact the
government’s revenue. Nevertheless, Moody’s highlighted that they continue to view
prior measures taken by the government (such as removal of fuel subsidies and
successful implementation of Goods and Services Tax (“GST”)) to address its fiscal
position as credit positive as it demonstrates the government’s fiscal commitment.
The Malaysian Government Securities (“MGS”) market was fairly active in January as
investors build up positions for the year with total of RM43.3b being traded. Generally,
market sentiment was bullish despite crude oil price dipping below USD30/bbl and
buying interest was seen from both local and offshore investors. As a result, the MGS
yield curve bullish flattened during the month in tandem with the huge rally in
USDMYR which closed at 4.15 at end January 2016 from 4.29 in end December 2015.
In the primary market, three tenders were offered: (1) RM4.0b new issue of Malaysian
Government Investment Issue (“MGII”) 07/23, which drew strong bid-to-cover
(“BTC”) ratio of 2.68x with an average yield of 4.39%; (2) RM3b MGS 03/19
reopening, which drew healthy BTC ratio of 2.058x with an average yield of 3.271%
and; (3) RM2b Government Investment Issue (“GII”) 10/35 reopening, which
registered a decent BTC of 1.915x at an average yield of 4.647%. With these three
tenders, the year-to-date (“YTD”) MGS/GII issuance stood at RM9.0b at as end
January 2016.
During the month of February, Malaysia reported that 4Q2015 GDP grew by 4.5% thus
bringing overall GDP growth for the year to 5.0% and handily beating consensus
forecast of 4.1% for 4Q2015 and 4.8% for 2015. As expected, the outperformance
continued to be led by the resilience in Malaysia’s private consumption growth and a
rebound in exports especially the manufacturing sector. Meanwhile, Malaysia’s
Consumer Price Index (“CPI”) climbed to 3.5% Year-over-year (“YoY”) in Jan 16
(Dec 15: 2.7%). On a Month-over-month (“MoM”) basis, the index contracted by 0.3%
indicating an easing in domestic price pressure on the back of moderating domestic
demand. On the job front, Malaysia's unemployment rate continues to inch higher,
rising to 3.3% in December from 3.2% in the previous month and 3.0% a year ago. The
number of unemployed people climbed to 478,100 in December from 453,300 in
November 432,100 a year ago. The labor force participation rate came in at 67.8%, up
from 67.7% in November. On the commodities front, crude oil price has been
averaging around USD30 to USD35 per barrel as concerns of an oversupplied market
remains. Mirroring the volatility in oil prices, Malaysia’s Ringgit has also been trading
around a tight range of around USD/MYR of RM4.10 to RM4.25. Finally, Fitch
Ratings is keeping Malaysia’s rating at A- with Stable outlook as external liquidity
13
position deteriorated due to large capital outflows and loss of forex reserves.
Nevertheless, Fitch Ratings also mentioned that Malaysia’s liquidity, (as measured by
Fitch’s broader external liquidity metric) still remains above the “A” median.
Despite a shorter trading month, trading in the MGS/GII market was brisk with a total
of RM67.0b value recorded. After the bullish sentiment in January where we saw
active buying by both local and foreign funds, some of the investors probably took
some profit in February especially in the short to mid end of the curve. Overall, the
yields on the 3-year, 5-year, 7-year, 10-year, 15-year, 20-year and 30-year close at
3.30%, 3.58%, 3.72%, 3.95%, 4.25%, 4.45% and 4.75% respectively. In the primary
market, only two tenders were offered: (1) RM4.0b new issue of MGS 08/23, which
drew the lowest BTC ratio of the year at 2.85x with an average yield of 3.80% and; (2)
RM3.5b new issue of GII 08/21, which registered a very strong BTC of 2.85x at an
average yield of 3.743%.
In the month of March BNM kept the OPR (“Overnight Policy Rate”) unchanged at
3.25% as expected and also left the SRR ratio at 3.50% in the second MPC meeting of
the year. The tone of the MPC statement remained broadly similar to the previous MPC
statement as BNM continues to highlight global growth vulnerability to “downside
risks arising from prevailing fragilities that are both cyclical and structural, excessive
leverage, the sharp declines in commodity prices and the rising geopolitical risks.”
BNM released its Annual Report for 2015, highlighting its expectations of slower
domestic growth, which is projected to grow by 4.0 – 4.5% in 2016 primarily driven by
domestic demand and sustained mainly through private consumption. Meanwhile,
inflation is expected to range between 2.5 – 3.5% in 2016. Separately, it was also the
first time BNM released information on the composition of foreign holdings in
MGS/GII and the breakdown is as follows:
Asset Managers: 44%
Central Banks / Governments: 29%
Pension Funds: 13%
Banks:10%
Insurance Companies: 2%
Nominees / Custodians: 1%
Others: 1%
Lastly, S&P affirmed Malaysia’s A-/Stable rating premised on its expectations that the
1 Malaysia Development Berhad (“1MDB”) issues and the upcoming change in BNM
leadership will not diminish the effectiveness of policymaking either in the executive
branch or at the central bank. S&P also believes the government has taken sufficient
offsetting measures to compensate for lost hydrocarbon-related fiscal revenue. In
addition, the country's strong external position and fairly diverse economy can absorb
some weakness in the oil and gas sector.
In March, the MGS yield curve continued its bullish flattening stance as investor
sentiment improved drastically following Fed Chair Janet Yellen’s guidance of a more
cautious and gradual approach to interest rate hike cycle. This coupled with the
stabilization of global commodity prices led the recovery seen in the USD/MYR which
closed at 3.90 at the end of the month. Against the more positive backdrop, trading
volume jumped higher with a total of RM76.6b traded compared to RM67.0b in the
previous month. Overall, the yields on the 3-year, 5-year, 7-year, 10-year, 15-year, 20-
year and 30-year close at 3.22%, 3.45%, 3.67%, 3.82%, 4.15%, 4.37% and 4.69%
14
respectively. In the primary market, there were three tenders: (1) RM2.5b new issue of
MGS 03/46, which drew strong BTC ratio of 2.596x with an average yield of 4.736%;
(2) RM4b new issue of GII 9/26, which a registered a very strong BTC ratio of 3.2x
with an average yield of 4.07%; and (3) RM2.5b re-opening of MGS 06/31, which
garnered BTC ratio of 2.37x with an average yield of 4.20%.
In the month of April, Malaysia released its February exports number, which
rebounded 6.7% YoY. The increase was generally driven by electrical and electronics
(E&E”) sector as well as increase in palm oil and palm-based and timber and timber
based products. On the inflation front, Malaysia’s CPI for March came in much weaker
than expected at 2.6% YoY against consensus expectations of 3.4%. The drop was due
to lower transport cost as RON95 petrol price was reduced by 15 sen to RM1.60 per
litre in March 2016 from RM1.75 in February. Meanwhile, BNM said that the
reduction of the SRR by 50 basis points on 1 February 2016 has had its desired impact
on the banking system’s interbank rates. The base rate of commercial banks, on
average, remained relatively stable at 3.89% in March (February: 3.88%). On the
consumer sentiment front, 1Q16 Consumer Sentiment Index (“CSI”) has rebounded to
72.9 points after plunging for six consecutive quarters. Recall that the index had hit its
all-time lows in the past two quarters, falling to 63.8 in 4Q15. In April, BNM’s
international reserves continue to climb steadily and were last seen at USD97b as at
end-March 2016. More pertinently, foreign holdings in Malaysian bonds of RM226.6b
as at end March has broken the previous record set in November 2014. Strengthening
crude oil prices and foreign fund inflows in both the bond as well as equities market
has help turned the Ringgit into Asia’s best-performing currency, confounding some
analyst’s expectation. The Ringgit has surged around 10% as at end April, the most in
43 years.
In April, the MGS yield curve bearish flattened with most of the selling occurring
towards the last week of the month. Trading volume dipped to RM71.6b compared to
RM76.6b in the previous month. Overall, the yields on the 3-year, 5-year, 7-year, 10-
year, 15-year, 20-year and 30-year close at 3.30% (March: 3.22%), 3.54% (March:
3.45%), 3.75% (March: 3.67%), 3.94% (March: 3.82%), 4.17% (March: 4.15%),
4.32% (March: 4.37%) and 4.67% (March: 4.69%) respectively. In the primary market,
there were three tenders: (1) RM3.5b re-opening of GII 07/23, which drew BTC ratio
of 2.686x with an average yield of 3.932%; (2) RM2.5b re-opening of MGS 05/35,
which a registered a fairly lackluster BTC ratio of 1.986x with an average yield of
4.24%; and (3) RM3.0b re-opening of MGS 08/23, which garnered BTC ratio of
2.044x with an average yield of 3.80%.
In May, BNM kept the OPR and SRR ratio unchanged at 3.25% and 3.50%
respectively as widely expected in Datuk Muhammad Ibrahim’s inaugural MPC
meeting as BNM Governor. The tone of the MPC statement was largely neutral with
the stance broadly similar to the previous MPC statements. BNM also reiterated its
expectations for the domestic economy to expand by 4.0 – 4.5% in 2016 while inflation
is expected to trend lower for the remaining parts of the year from the average CPI of
3.4% in the first quarter of 2016 (“1Q16”). This followed the release of Malaysia’s
1Q16 GDP data which grew at a slower pace of 4.2% YoY, on the back of weakness in
exports and soft private investment growth while on a quarter to quarter basis, the
domestic economy grew 1.0%, compared to 1.5% previously.
The MGS market saw some sell-off following the release of US Fed Federal Open
Market Committee (“FOMC”) April meeting minutes which indicated that members
are looking at potentially raising interest rate in its June FOMC meeting while Fed
15
Chair Janet Yellen signaled in a speech that that a rate increase would be appropriate in
the coming months if the US economy and labour market continue to strengthen. The
hawkish tone by the Fed sent MGS yields higher across all tenures, resulting in the
shift upward in the MGS yield curve. Trading volume for the month fell to RM69.2b
from RM71.6b in the previous month. Overall, the yields on the 3-year, 5-year, 7-year,
10-year, 15-year, 20-year and 30-year close at 3.30%, 3.56%, 3.84%, 3.92%, 4.21%,
4.35% and 4.71% respectively. In the primary market, there were three tenders: (1)
RM2.5b 15-year reopening of MGS 09/30, which drew healthy BTC ratio of 2.621
times with an average yield of 4.417%; (2) RM4.0b 10.5-year new issue of MGS 11/26
garnered BTC ratio of 2.193 times at average yield of 3.90%; and (3) RM4.0b 5.5-year
new issue of MGS 11/21 drew a weak BTC ratio of 1.42 times at average yield of
3.62%.
During the month of June, Malaysia reported a positive growth in exports of 1.6% YoY
for the month of April 2016, while imports contracted by 2.3%, thus leaving a positive
trade balance of RM9.1b. Main contributors to exports came from the E&E sector
which showed an encouraging growth of 2.1% versus 0.5% in the preceding month. On
the inflation front, May’s CPI eases marginally to 2.0% YoY matching market
expectations. Since the implementation of GST in April 2015, the initial price shock
has faded while the current record low pump prices continue to keep inflationary
pressure in check. Meanwhile, Malaysia’s unemployment rate continued to inch up in
April. At 3.6%, the unemployment figure is at the highest since 2010. Finally,
Malaysia’s Ringgit appreciated versus USD by 2.9% from RM4.15 to RM4.03 at as
end June. The Ringgit has been volatile in June primarily due to two key events, the
FOMC meeting as well as the UK Referendum on Brexit.
In contrast to the month of May, the MGS curve bull-flattened as trading volume for
the month of June soared to RM106.2b from RM69.2b in the previous month. The
strong rally was probably contributed by two significant events during the month: (1) a
weak May NFP figure which delayed the much anticipated Fed rate hike in the June
FOMC meeting and (2) Brexit which triggered fears of global economic slowdown. As
both events were bond positive, it’s not a surprised that yields fell across the curve.
Overall, 3-year, 5-year, 7-year, 10-year, 15-year, 20-year and 30-year close at 3.17%,
3.32%, 3.59%, 3.73%, 4.08%, 4.29% and 4.62% respectively. In the primary market,
there were two tenders: (1) RM3.5b 10-year reopening of GII 09/26, which drew
healthy bid-to-cover (“BTC”) ratio of 2.308 times with an average yield of 4.049%;
and (2) RM2.5b 30-year reopening of MGS 03/46 which garnered BTC ratio of 2.369
times at average yield of 4.613%.
In July, BNM cut the OPR by 25bps to 3.00% at its 13 July 2016 meeting. The market
was surprised with consensus expectation that the policy rate would be left unchanged.
BNM sees that it has policy room for easing due to subdued inflation, and has also
revised down the 2016 inflation expectation to 2-3% from 2.5-3.5% previously. The
rate cut is aimed at supporting domestic growth, given that the financial sector is not
expected to be destabilized by the lower policy rate. Malaysia’s inflation came in
significantly below expectations at 1.6% YoY for June 2016 mainly due to transport
prices which contracted -8.5%YoY that is weighted 13.7% of the CPI.
Subsequent to the unexpected OPR cut, the MGS market rallied across the curve even
as trading volume for the month of July dropped from June’s year to date high of
RM106.2b to RM80.8b. The stellar performance over the past two months was not
unexpected as not only has the U.S. Federal Reserve Bank held back the anticipated
rate hike back in June but global central banks including Malaysia seems to on the
16
dovish path ever since the U.S. Federal Reserve Bank meeting as well as the event of
Brexit. Overall, 3-year, 5-year, 7-year, 10-year, 15-year, 20-year and 30-year close at
2.99%, 3.17%, 3.38%, 3.59%, 3.92%, 4.21% (Jun: 4.29%) and 4.53% respectively. In
the primary market, there were two tenders: (1) RM2.5b 15-year reopening of MGS
06/31, which drew healthy BTC ratio of 2.222 times with an average yield of 3.856%;
and (2) RM3.5b 5-year reopening of GII 08/21 which garnered BTC ratio of 2.454
times at average yield of 3.401%.
During the month of August, Malaysia exports bounced back into gain of 3.4% y-o-y
in June after falling by -0.9% in May and compared with +1.6% in April. Meanwhile,
the foreign exchange reserves increased marginally by USD0.1b to USD97.3b as at 29
July 2016. The current account surplus in the balance of payments narrowed to
MYR1.9bn in 2Q 2016, after recording a surplus of MYR5.0bn in 1Q and compared
with a surplus of MYR8.1bn in 2Q 2015. This was attributed to a smaller surplus in the
merchandise trade account and a larger deficit in the income transfers. Meanwhile, the
financial account registered a higher net inflow of MYR9.5bn in 2Q, compared with an
inflow of MYR5.8bn in the previous quarter. The improvement was mainly due to a
rebound in net inflow on other investments and a larger net inflow of direct
investments. On the other hand, the slowdown in the Malaysian economy continued
with real GDP growing at a slower pace of 4.0% YoY in 2Q 2016, from +4.2% in 1Q
and +4.5% in 4Q 2016. The overall growth was dragged lower by a cutback in
inventories and subdued exports. CPI rose just at 1.1% in July 2016, as opposed to
1.6% in the prior month and against consensus of 1.2%. The low CPI rate has
prompted some market players to anticipate BNM to revise the OPR downward at the
next policy meeting.
The rallies in the Malaysian sovereign bonds/sukuk continued in August, following
BNM’s OPR cut by 25 bps to 3.0%. Some of the gains were pared after the BNM
governor stated that there were no plans for a series of rate cuts. Depressed global
yields and divided Fed officials as highlighted in the U.S. July FOMC minutes led to
sell-down of USD and strengthening of MYR. Yields of the local government bonds
shifted down across the board due to global yield hunting. Oil strength during the
month wherein the Brent crude oil closed above USD50.00 per barrel since 4 July 2016
also contributed to the local bond market rallies. On 17 August 2016, there was an
announcement that GII will be eligible for inclusion in the JP Morgan Emerging
Market (“JPM EM”) suite of indices i.e. Government Bond Index – Emerging Market
(“GBI-EM”) Global Diversified and GBI-EM Diversified. This sparked a significant
rally for the GII, particularly GII 7/23 and GII 9/26.The spread between the MGS and
GII has compressed significantly pre and post the announcement. The 7 year GII-MGS
spread has compressed from 14 bps to the current 4-5bps whereas the 10 year GII-
MGS has compressed from 19 bps to the current 5 bps. However, toward the end of the
month, several Fed officials made hawkish statement about raising fed rates possibly as
early as in September. Janet Yellen, The Fed Chair also remarked at the Monetary
Policy Meeting at Jackson Hole, Wyoming that the case for the rate hike has
strengthened, but she did not specify the timing of the rate hike as it will be data
dependent. This had caused the local market government bonds to weaken as traders
were seen trimming down their positions.
Overall, 3-year, 5-year, 7-year, 10-year, 15-year, 20-year and 30-year close at 2.895%,
3.19%, 3.465%, 3.60%, 3.915%, 4.13% and 4.45% respectively. In the primary market,
there were three tenders: (1) RM3.0b 7-year reopening of MGS 8/23 with BTC ratio of
1.577 times with average yield of 3.483 (2) RM3.0b 15-year reopening of MGII 09/30,
which drew strong BTC ratio of 2.493 times with an average yield of 4.160%. Demand
17
predominantly came from local banks, Islamic real money, life and pension funds that
are heavy cash-in-hand; and (3) RM3.0b 10-year reopening of MGS 11/26 which
garnered weak BTC ratio of 1.752 times at average yield of 3.563%.
Malaysia’s Purchasing Manager’s Index (“PMI”) reading rose to 48.6 in September
from 47.4 in August 2016. This marked the highest reading in eight months.
Nevertheless, it was still the eighteenth consecutive month of contraction as indicated
by the sub 50 reading. On the inflation front, headline inflation reading for August
rebounded to 1.5% versus consensus expectation of 1.3%. Main drivers were non-food
items particularly cultural services which saw inflation surging from 1.0% in July to
6.1% YoY in August. Finally, the banking sector’s loan growth moderated for the
twelfth consecutive month to 4.2% YoY in August from 5.1% YoY in July. Notably,
this is the lowest level in at least 13 years, as lending activities continue to face
headwinds from a slowing economy, tepid deposit growth and rising loan impairments.
Global markets revisited the prospect of a rate hike again as the FOMC met over two
days starting 20 Sep 2016. As expected, volatility spiked in the run-up to the meeting
as yields rose across the board globally as well as in Malaysia. The less than hawkish
decision post FOMC was well anticipated by the market and hence saw a reversal in
bond yields. Likewise, Malaysian Government bonds also saw yields declined in
response to the Fed’s decision and ended the month in a slight flattening of the curve.
Overall, 3-year, 5-year, 7-year, 10-year, 15-year, 20-year and 30-year close at 2.94%,
3.22%, 3.44%, 3.54%, 3.92%, 4.15% and 4.47% respectively. In the primary market,
there were two tenders: (1) RM3.0b 5-year Re-opening of MGS 11/21, which drew a
weak BTC ratio of 1.670 times with an average yield of 3.256%; and (2) RM2.0b 20-
year Re-opening of GII 10/35 which garnered BTC ratio of 2.890 times at average
yield of 4.226%.
In October, Malaysia reported its foreign exchange reserves rose by USD0.2bn to
USD97.7bn as at 30 September 2016, from USD97.5bn registered at end-August and
compared to USD95.3bn at end-December 2015. On the inflation front, the headline
inflation rate remained stable in September, as the easing in cost of food and beverages
was mitigated by the smaller magnitude of decline in cost of transport. The core
inflation rate inched lower in September. Growth of the broader money supply, M3,
slowed to 2.2% year-on-year (y-o-y) in September, from +2.4% in August, due to a
decline in external operations and a slowdown in demand for funds by the private and
public sector. Meanwhile, loan growth was stable at 4.2% y-o-y in September,
unchanged from the previous month but lower compared with +5.6 in July, as the
deceleration in growth of household loans were mitigated by the marginal increase in
business loans.
Malaysian bond markets yields rose across the board in October, especially on the
longer end of the curve. There is a sharp steepening of the curve during the month,
following the significant sell-off in the global bond market and also sharp depreciation
of MYR against the USD. As an illustration of the steepening of the curve, the 20-year
MGS yields rose approx. 20 bps compared to the prior month. The sell-off was as a
result of growing expectation of Fed rate hike in December. In addition, the sell-off
was also sparked by major central banks such as Bank of Japan, Bank of England and
European Central Bank questioning the efficacy of unconventional monetary policies
and at times, rumored to taper their asset purchase programs. Overall, 3-year, 5-year, 7-
year, 10-year, 15-year, 20-year and 30-year close at 3.03%, 3.33%, 3.55%, 3.64%,
4.05%, 4.335% and 4.58% respectively. In the primary market, there were three
tenders: (1) RM3.5b New 5-year GII 4/20, which drew a weak bid-to-cover (BTC)
18
ratio of 2.066 times with an average yield of 3.200%; (2) RM3.0b 10-year Re-opening
of GII 9/26, which drew a weak BTC ratio of 2.023 times with an average yield of
3.813%; and (3) RM2.0b 20-year MGS 5/35 which garnered BTC ratio of 2.154 times
at average yield of 4.295%.
Malaysia’s foreign exchange reserves rose by USD0.5bn to USD98.3bn as at 15
November 2016, from USD97.8bn registered at end-October 2016 and compared to
USD95.3bn at end-December 2015. CPI for Oct 2016 came in marginally lower at
1.4% YoY compared to Sep 2016’s reading on 1.5% YoY. 3Q GDP was 4.3% YoY,
higher than consensus expectations of 4.0% YoY (2Q: 4.0%, 1Q: 4.2%). GDP growth
was boosted by higher consumer spending which grew 6.4% YoY, supported by wage
and employment growth. Private investment eased slightly to 4.7% from 5.6% in 2Q,
attributed to a decline in spending on machinery and equipment. Government spending
also slowed to 3.1% from 6.5% in 2Q, on the back of lower spending on supply and
services. BNM left its OPR unchanged at 3.00%, as expected by the market given the
significant degree of financial market volatility following Donald Trump's presidential
victory. Compared to September, BNM slightly upgraded its view on global growth in
2017, but retained its assessment that the domestic economy remains on track to
expand as projected in 2016 and 2017. Malaysian bond markets yields rose across the
board, especially on the shorter end of the curve. The sharp increase in MGS yields
was in line with the significant sell-off in the global bond market as well as the sharp
depreciation of MYR against the USD. As an illustration of the bear flattening of the
curve, the 3-year MGS yield rose approx. 83 bps whilst the 20-year MGS yield rose
approx. 50 bps compared to the prior month. The sell-off was as a result of increasing
global bond yields world-wide following the surprise electoral victory of Donald
Trump, the UST 10-year yield rose from 1.83% to 2.37% during the month. Market
expectation is for the Trump administration to embark on a very fiscally aggressive
policy of tax cuts and increased infrastructure spending which will lead to higher
inflation.
Overall, 3-year, 5-year, 7-year, 10-year, 15-year, 20-year and 30-year close at 3.92%,
4.04%, 4.18%, 4.36%, 4.76%, 4.83% and 4.87% respectively. In the primary market,
there were two tenders: (1) RM3.0 billion 7-year Re-opening of GII 7/23, which drew a
BTC ratio of 2.21 times with an average yield of 4.094%; and (2) RM2.0 billion 10-
year Re-opening of GII 11/26, which drew a BTC ratio of 2.65 times with an average
yield of 4.465%.
Malaysia’s manufacturing PMI continue to remain below the 50-level mark coming in
unchanged at 47.1 in December. This was the twenty first consecutive months of
contraction. On the trade front, exports were below expectations, recording a
contraction of 8.6% YoY in October (September: -3.0%). Consensus expectations were
for a contraction of -5.6%. Imports meanwhile also fell by 6.6% YoY (September: -
0.1%) driven by broad-based declines in capital imports (-2.0%), intermediate imports
(-8.9%), and consumption imports (-8.0%). Nevertheless, trade surplus continues to be
positive at RM9.76b (September: RM7.56b). Indicative of the huge foreign outflows in
the month of November, Malaysia’s foreign reserves fell USD1.4b to USD96.4b. This
was the lowest reserve level since March 2016. The current level of reserves is
sufficient to cover 1.2 times of short-term external debt and 8.3 months of retained
imports. During the month, BNM announced several measures to enhance onshore
foreign exchange liquidity effective 5 December 2016. The measures include the
liberalization and deregulation of the onshore MYR hedging market, streamlining
treatment for investment in foreign currency assets and incentives and treatment of
export proceeds. These pre-emptive measures were implemented to stabilise the ringgit
19
and support financial stability amid further broad strengthening of the USD. Finally,
the banking sector’s loan growth showed signs of bottoming. For the month of
November, growth accelerated to 5.3% YoY (October: 4.5%) and a robust 0.9% MoM,
resulting in YTD annualised loan growth improving to 4.7% (10M2016: 4.0%). The
main driver of loan growth was in working capital loans (+1.6% MoM vs average
MoM run rate of +0.3%). In terms of consumer loans, residential property loan growth
remained stable at 9.5% YoY while automobile loans remain mired in negative
territory at -0.8% YoY.
The November sell-off which emanated from Donald Trump’s winning election bid
took a breather in the month of December as investors digested the implications of
Trump’s policies. With most investors away on holidays, the Malaysian Government
bonds saw some recovery in the yield curve amidst thin volumes. Overall, 3-year, 5-
year, 7-year, 10-year, 15-year, 20-year and 30-year close at 3.55%, 3.67%, 4.13%,
4.21%, 4.66%, 4.65% and 4.58% respectively. In the primary market, there was just
one auction, the RM1.5b 20-year Re-opening of GII 10/35 which garnered BTC ratio
of 3.750 times at average yield of 4.811%. The final auction of the year brought gross
MGS/GII issuance to a total of RM86b. BNM also announced the 2017 government
bonds auction calendar which consist of a total of 32 offerings (2016: 29) made up of
16 MGS (2016: 15) and 16 GII (2016: 14) auctions. The schedule was skewed towards
longer tenures of 15-30y, given the significant redemption schedule in the period 2017
- 2021.
Market
Outlook
Post the US Federal Open Market Committee (“FOMC”) December rate hike, investors
are still digesting the potential implications of a more hawkish FOMC, but more
pertinently, the larger impact of President Trump’s economic policies. Until there is
greater clarity on what President Trump and his team will do, the volatilities in regional
and global markets will likely continue.
Nevertheless, in spite of the challenging global outlook, Malaysia’s economy continues
to display resilience, as shown by a higher than expected 3Q2016 Year-over-year
(“YoY”) Gross Domestic Product (“GDP”) growth of 4.3% which is a reversal from
five quarters of decelerating growth. Moving forward, private consumption is expected
to continue to underpin 2017’s GDP projected growth of 4.3% (Source: World Bank).
In particular, key infrastructure projects such as the ongoing RAPID, Pan Borneo
Highway, KVMRT2, LRT3 and the newly announced East Coast Rail Link will likely
provide positive spin-off effect to the economy.
With Bank Negara Malaysia (“BNM”) having implemented a pre-emptive OPR
(“Overnight Policy Rate”) cut back in July 2016 and given the encouraging 3Q2016
GDP growth, BNM will likely retain its neutral bias espoused in the recent Monetary
Policy Committee (“MPC”) November meeting. While BNM still have room to
implement future OPR cuts given the benign inflation rate, any future easing policy
move will likely take into account the volatile financial markets and the persistent
weakness of the Ringgit. After giving back more than half the gains acquired since
January 2016, the Malaysian Government bonds as represented by the Quantshop
Malaysian Government Securities (“MGS”) All Index closed the year with a return of
3.37%.
The record outflow of close to RM20b in November seems to have tapered in
December with bargain hunting apparent amidst thin liquidity. In fact, the partial
recovery in the MGS yield curve in December was not accompanied by a stronger
Ringgit (versus the USD). Our Ringgit closed 2016 at 4.4862, a level which has not
20
been seen since the Asian Financial Crisis in 1998 and 41.6% down against its
strongest close of 3.168 in 2011.
Given that foreign holdings of Malaysia’s domestic debt securities continue to be near
its recent record high, the prospects of a further rise in the US 10-year treasury and a
bullish USD will continue to weigh on both the Ringgit and by implication the MGS
market.
Finally, from the recently released 2017 government bond auction calendar, we
surmised the following:
The 32 offerings for 2017 is skewed towards the longer maturities (15-30Y).
There will be only 2 3Y benchmark offerings, one each for MGS and
Government Investment Issue (“GII”). Hence, the front end of the yield curve
will likely be well supported with a steepening of the MGS curve expected in
2017.
There will be heavy maturities in the month of February and March in the
1H2017 (RM22.3b) and another RM44.5b maturing in August-November 2017.
These are the months where there will likely be more opportunities to trade.
Except for the current 3Y GII and 30Y MGS, all the existing Benchmark for
MGS and GII will be replace with new Benchmarks.
Finally, a new Benchmark, the 30Y GII will be introduced for the first time
which will complete the Sukuk curve and provide a Benchmark pricing for
corporate Sukuks in future.
Kuala Lumpur, Malaysia
AmFunds Management Berhad
14 February 2017
21
ADDITIONAL INFORMATION
Board of Directors of the Manager
The Board of Directors, of which more than one-third are independent members, exercise
ultimate control over the operations of the Manager. For the financial year ended 31 December
2016 (1 January 2016 to 31 December 2016), there were eight (8) Board of Directors meeting
held by the Manager.
Details of the Directors of the Manager are set out as below:
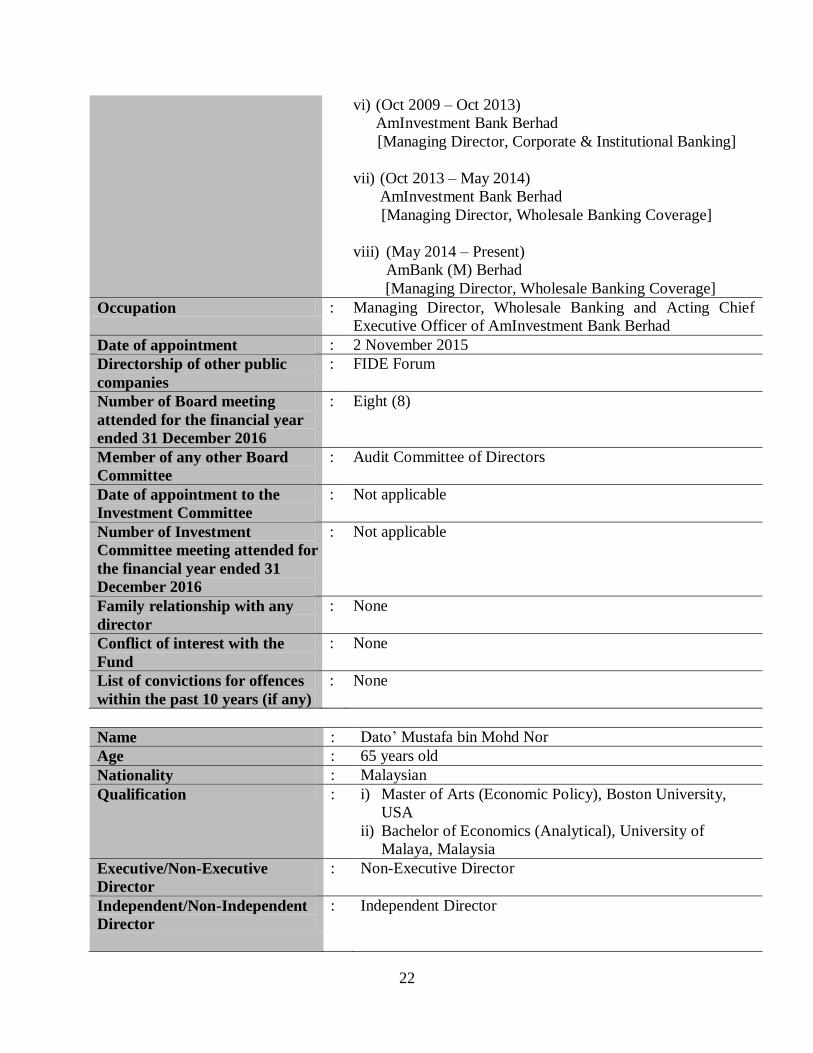
Name : Pushparani a/p A Moothathamby
Age : 58 years old
Nationality : Malaysian
Qualification : i) Fellow Member of The Chartered Association of Certified
Accountants, United Kingdom
ii) Member of the Malaysian Institute of Accountants,
Malaysia
Executive/Non-Executive
Director
: Non-Executive Director
Independent/Non-Independent
Director
: Non-Independent Director
Working Experience : i) (Dec 1983 – Apr 1986)
Sri Alam Group
[Group Accountant ]
ii) (May 1986 – Apr 1989)
Coopers & Lybrand
(now known as PricewaterhouseCoopers Malaysia)
[Consultant]
iii) (May 1989 – Dec 2004)
AmMerchant Bank Berhad
(now known as AmInvestment Bank Berhad)
[Last position held - Head of Corporate Finance]
iv) (Jan 2005 – July 2008)
AmMerchant Bank Berhad
(now known as AmInvestment Bank Berhad)
[Executive Director]
v) (July 2008 – Oct 2009)
AmInvestment Bank Berhad
[Managing Director, Relationship Banking & Regional
Business]
22
vi) (Oct 2009 – Oct 2013)
AmInvestment Bank Berhad
[Managing Director, Corporate & Institutional Banking]
vii) (Oct 2013 – May 2014)
AmInvestment Bank Berhad
[Managing Director, Wholesale Banking Coverage]
viii) (May 2014 – Present)
AmBank (M) Berhad
[Managing Director, Wholesale Banking Coverage]
Occupation : Managing Director, Wholesale Banking and Acting Chief
Executive Officer of AmInvestment Bank Berhad
Date of appointment : 2 November 2015
Directorship of other public
companies
: FIDE Forum
Number of Board meeting
attended for the financial year
ended 31 December 2016
: Eight (8)
Member of any other Board
Committee
: Audit Committee of Directors
Date of appointment to the
Investment Committee
: Not applicable
Number of Investment
Committee meeting attended for
the financial year ended 31
December 2016
: Not applicable
Family relationship with any
director
: None
Conflict of interest with the
Fund
: None
List of convictions for offences
within the past 10 years (if any)
: None
Name : Dato’ Mustafa bin Mohd Nor
Age : 65 years old
Nationality : Malaysian
Qualification : i) Master of Arts (Economic Policy), Boston University,
USA
ii) Bachelor of Economics (Analytical), University of
Malaya, Malaysia
Executive/Non-Executive
Director
: Non-Executive Director
Independent/Non-Independent
Director
: Independent Director
23
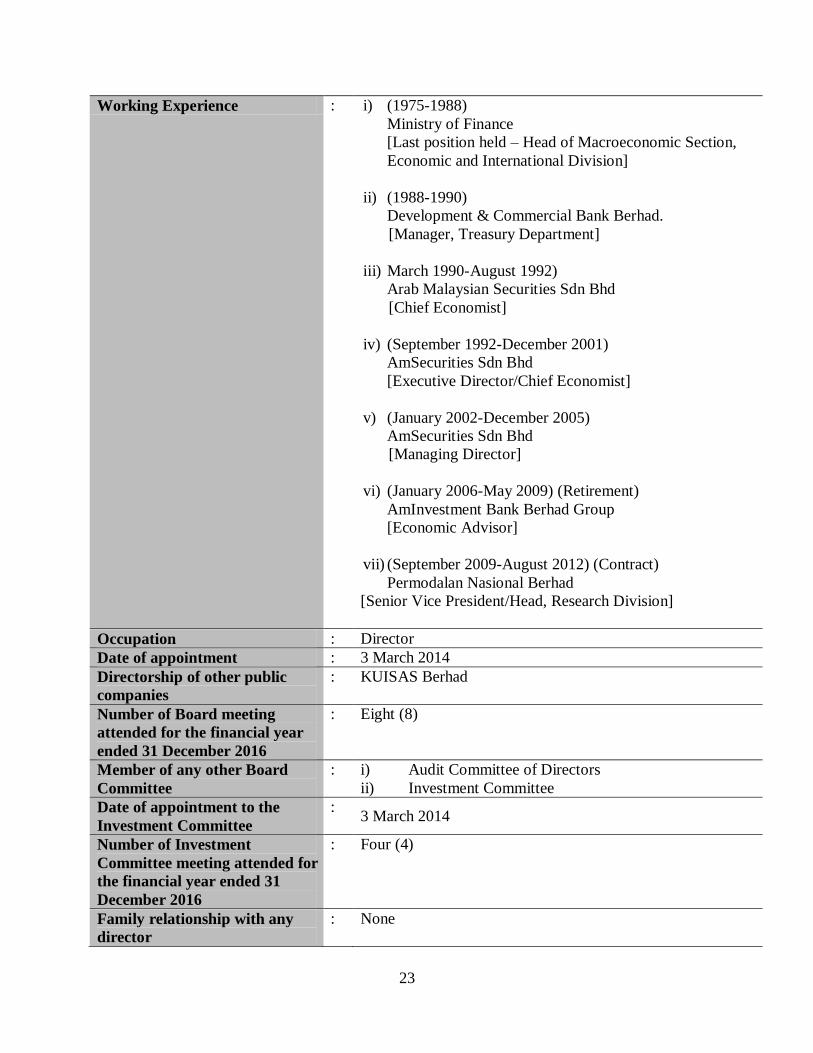
Working Experience : i) (1975-1988)
Ministry of Finance
[Last position held – Head of Macroeconomic Section,
Economic and International Division]
ii) (1988-1990)
Development & Commercial Bank Berhad.
[Manager, Treasury Department]
iii) March 1990-August 1992)
Arab Malaysian Securities Sdn Bhd
[Chief Economist]
iv) (September 1992-December 2001)
AmSecurities Sdn Bhd
[Executive Director/Chief Economist]
v) (January 2002-December 2005)
AmSecurities Sdn Bhd
[Managing Director]
vi) (January 2006-May 2009) (Retirement)
AmInvestment Bank Berhad Group
[Economic Advisor]
vii) (September 2009-August 2012) (Contract)
Permodalan Nasional Berhad
[Senior Vice President/Head, Research Division]
Occupation : Director
Date of appointment : 3 March 2014
Directorship of other public
companies
: KUISAS Berhad
Number of Board meeting
attended for the financial year
ended 31 December 2016
: Eight (8)
Member of any other Board
Committee
: i) Audit Committee of Directors
ii) Investment Committee
Date of appointment to the
Investment Committee
: 3 March 2014
Number of Investment
Committee meeting attended for
the financial year ended 31
December 2016
: Four (4)
Family relationship with any
director
: None
24
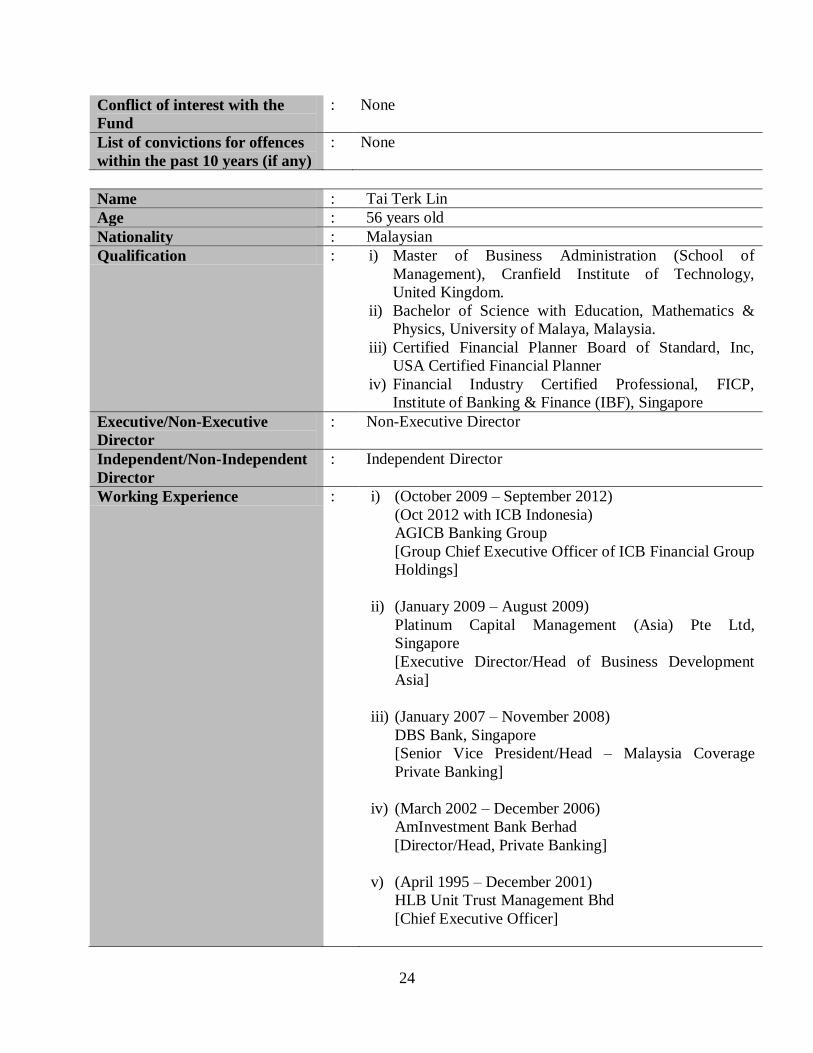
Conflict of interest with the
Fund
: None
List of convictions for offences
within the past 10 years (if any)
: None
Name : Tai Terk Lin
Age : 56 years old
Nationality : Malaysian
Qualification : i) Master of Business Administration (School of
Management), Cranfield Institute of Technology,
United Kingdom.
ii) Bachelor of Science with Education, Mathematics &
Physics, University of Malaya, Malaysia.
iii) Certified Financial Planner Board of Standard, Inc,
USA Certified Financial Planner
iv) Financial Industry Certified Professional, FICP,
Institute of Banking & Finance (IBF), Singapore
Executive/Non-Executive
Director
: Non-Executive Director
Independent/Non-Independent
Director
: Independent Director
Working Experience : i) (October 2009 – September 2012)
(Oct 2012 with ICB Indonesia)
AGICB Banking Group
[Group Chief Executive Officer of ICB Financial Group
Holdings]
ii) (January 2009 – August 2009)
Platinum Capital Management (Asia) Pte Ltd,
Singapore
[Executive Director/Head of Business Development
Asia]
iii) (January 2007 – November 2008)
DBS Bank, Singapore
[Senior Vice President/Head – Malaysia Coverage
Private Banking]
iv) (March 2002 – December 2006)
AmInvestment Bank Berhad
[Director/Head, Private Banking]
v) (April 1995 – December 2001)
HLB Unit Trust Management Bhd
[Chief Executive Officer]
25
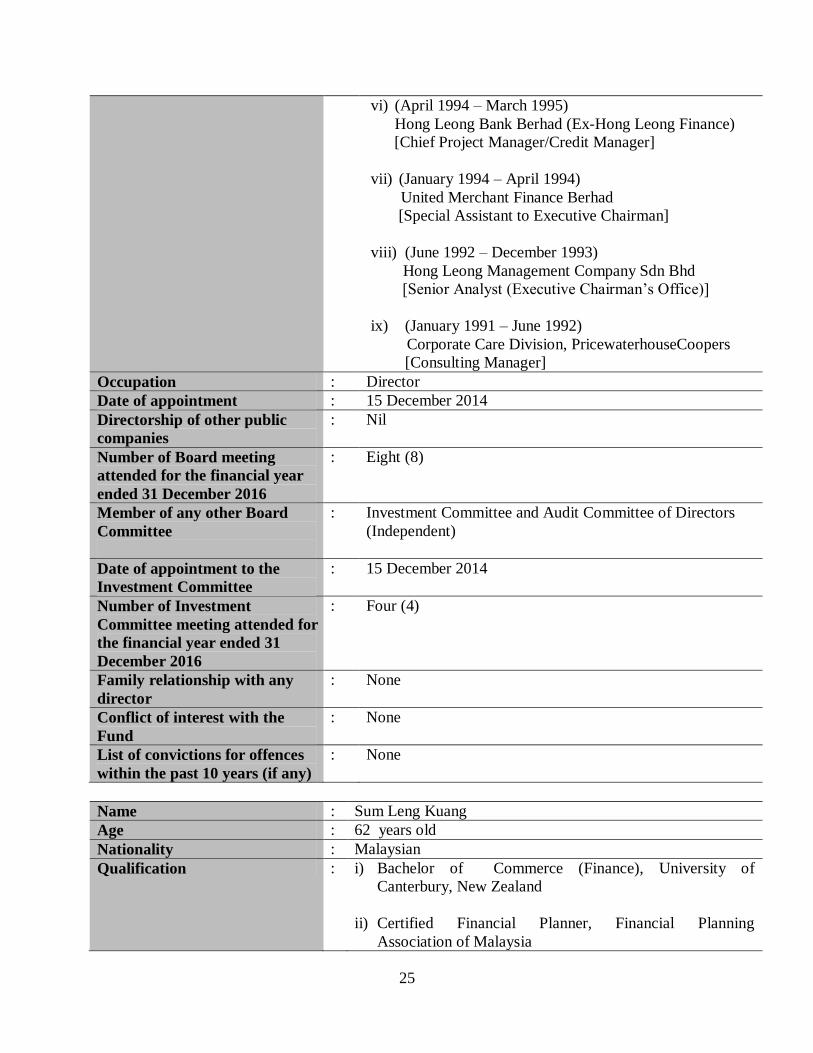
vi) (April 1994 – March 1995)
Hong Leong Bank Berhad (Ex-Hong Leong Finance)
[Chief Project Manager/Credit Manager]
vii) (January 1994 – April 1994)
United Merchant Finance Berhad
[Special Assistant to Executive Chairman]
viii) (June 1992 – December 1993)
Hong Leong Management Company Sdn Bhd
[Senior Analyst (Executive Chairman’s Office)]
ix) (January 1991 – June 1992)
Corporate Care Division, PricewaterhouseCoopers
[Consulting Manager]
Occupation : Director
Date of appointment : 15 December 2014
Directorship of other public
companies
: Nil
Number of Board meeting
attended for the financial year
ended 31 December 2016
: Eight (8)
Member of any other Board
Committee
: Investment Committee and Audit Committee of Directors
(Independent)
Date of appointment to the
Investment Committee
: 15 December 2014
Number of Investment
Committee meeting attended for
the financial year ended 31
December 2016
: Four (4)
Family relationship with any
director
: None
Conflict of interest with the
Fund
: None
List of convictions for offences
within the past 10 years (if any)
: None
Name : Sum Leng Kuang
Age : 62 years old
Nationality : Malaysian
Qualification : i) Bachelor of Commerce (Finance), University of
Canterbury, New Zealand
ii) Certified Financial Planner, Financial Planning
Association of Malaysia
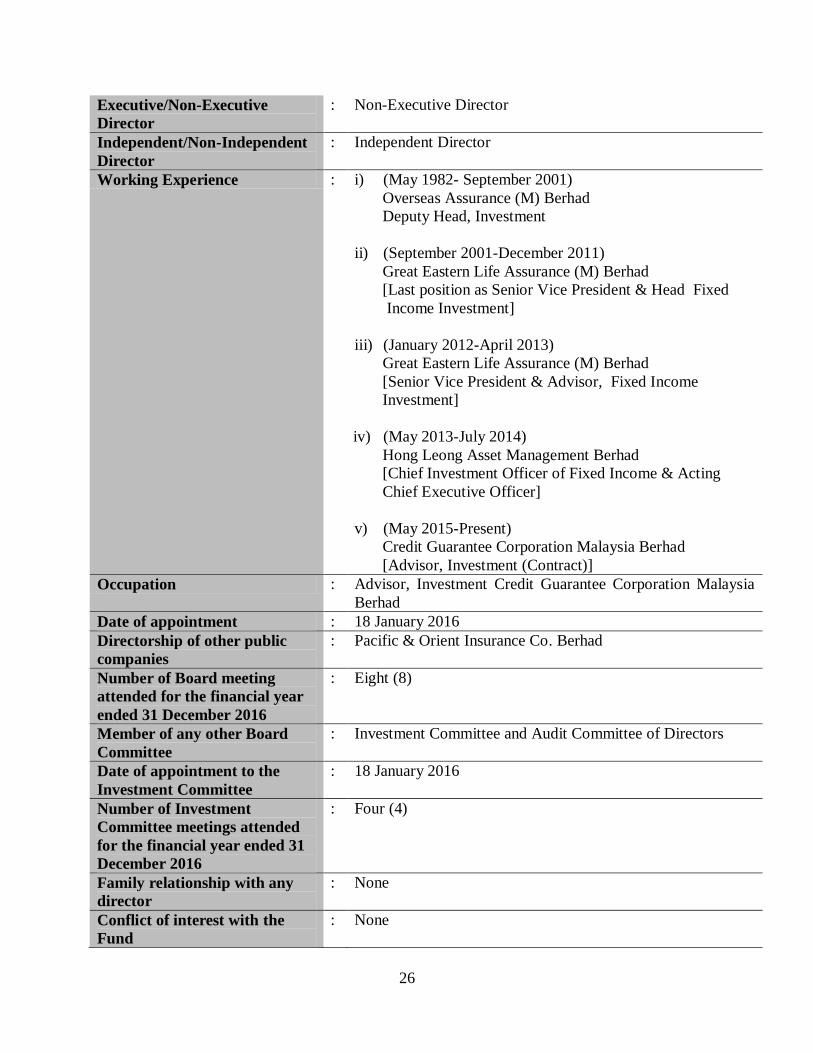
26
Executive/Non-Executive
Director
: Non-Executive Director
Independent/Non-Independent
Director
: Independent Director
Working Experience : i) (May 1982- September 2001)
Overseas Assurance (M) Berhad
Deputy Head, Investment
ii) (September 2001-December 2011)
Great Eastern Life Assurance (M) Berhad
[Last position as Senior Vice President & Head Fixed
Income Investment]
iii) (January 2012-April 2013)
Great Eastern Life Assurance (M) Berhad
[Senior Vice President & Advisor, Fixed Income
Investment]
iv) (May 2013-July 2014)
Hong Leong Asset Management Berhad
[Chief Investment Officer of Fixed Income & Acting
Chief Executive Officer]
v) (May 2015-Present)
Credit Guarantee Corporation Malaysia Berhad
[Advisor, Investment (Contract)]
Occupation : Advisor, Investment Credit Guarantee Corporation Malaysia
Berhad
Date of appointment : 18 January 2016
Directorship of other public
companies
: Pacific & Orient Insurance Co. Berhad
Number of Board meeting
attended for the financial year
ended 31 December 2016
: Eight (8)
Member of any other Board
Committee
: Investment Committee and Audit Committee of Directors
Date of appointment to the
Investment Committee
: 18 January 2016
Number of Investment
Committee meetings attended
for the financial year ended 31
December 2016
: Four (4)
Family relationship with any
director
: None
Conflict of interest with the
Fund
: None
27
List of convictions for offences
within the past 10 years (if any)
: None
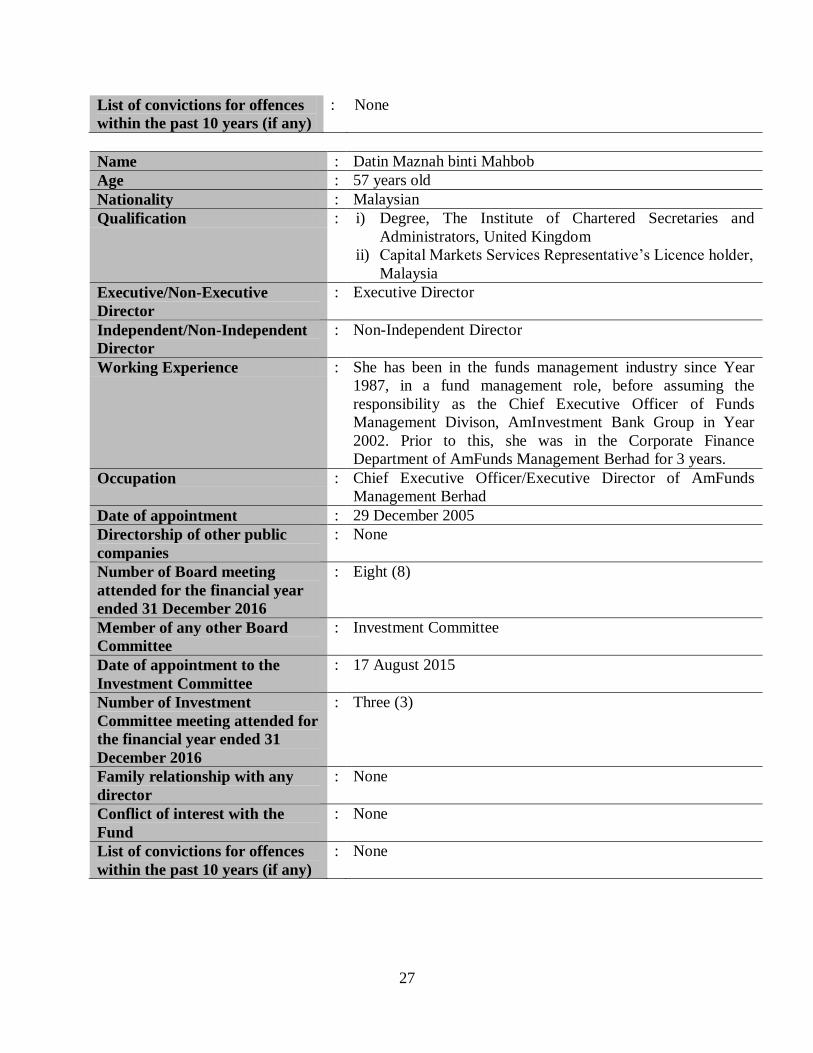
Name : Datin Maznah binti Mahbob
Age : 57 years old
Nationality : Malaysian
Qualification : i) Degree, The Institute of Chartered Secretaries and
Administrators, United Kingdom
ii) Capital Markets Services Representative’s Licence holder,
Malaysia
Executive/Non-Executive
Director
: Executive Director
Independent/Non-Independent
Director
: Non-Independent Director
Working Experience : She has been in the funds management industry since Year
1987, in a fund management role, before assuming the
responsibility as the Chief Executive Officer of Funds
Management Divison, AmInvestment Bank Group in Year
2002. Prior to this, she was in the Corporate Finance
Department of AmFunds Management Berhad for 3 years.
Occupation : Chief Executive Officer/Executive Director of AmFunds
Management Berhad
Date of appointment : 29 December 2005
Directorship of other public
companies
: None
Number of Board meeting
attended for the financial year
ended 31 December 2016
: Eight (8)
Member of any other Board
Committee
: Investment Committee
Date of appointment to the
Investment Committee
: 17 August 2015
Number of Investment
Committee meeting attended for
the financial year ended 31
December 2016
: Three (3)
Family relationship with any
director
: None
Conflict of interest with the
Fund
: None
List of convictions for offences
within the past 10 years (if any)
: None
28
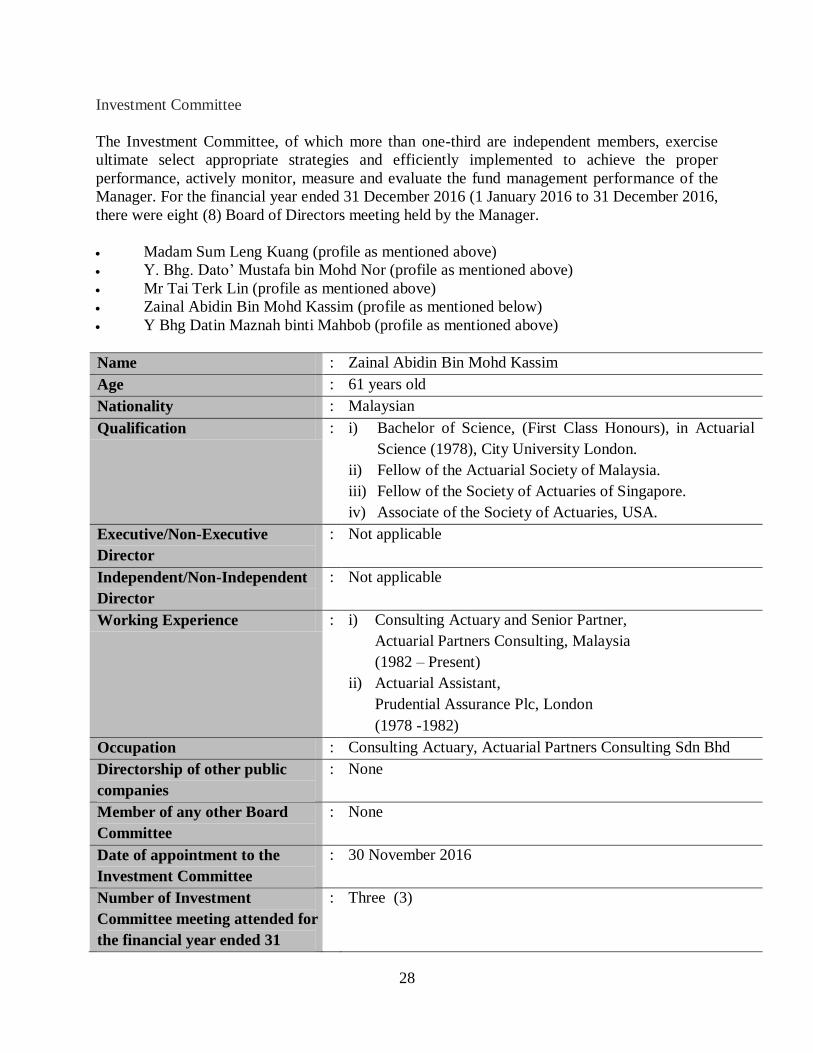
Investment Committee
The Investment Committee, of which more than one-third are independent members, exercise
ultimate select appropriate strategies and efficiently implemented to achieve the proper
performance, actively monitor, measure and evaluate the fund management performance of the
Manager. For the financial year ended 31 December 2016 (1 January 2016 to 31 December 2016,
there were eight (8) Board of Directors meeting held by the Manager.
Madam Sum Leng Kuang (profile as mentioned above)
Y. Bhg. Dato’ Mustafa bin Mohd Nor (profile as mentioned above)
Mr Tai Terk Lin (profile as mentioned above)
Zainal Abidin Bin Mohd Kassim (profile as mentioned below)
Y Bhg Datin Maznah binti Mahbob (profile as mentioned above)
Name : Zainal Abidin Bin Mohd Kassim
Age : 61 years old
Nationality : Malaysian
Qualification : i) Bachelor of Science, (First Class Honours), in Actuarial
Science (1978), City University London.
ii) Fellow of the Actuarial Society of Malaysia.
iii) Fellow of the Society of Actuaries of Singapore.
iv) Associate of the Society of Actuaries, USA.
Executive/Non-Executive
Director
: Not applicable
Independent/Non-Independent
Director
: Not applicable
Working Experience : i) Consulting Actuary and Senior Partner,
Actuarial Partners Consulting, Malaysia
(1982 – Present)
ii) Actuarial Assistant,
Prudential Assurance Plc, London
(1978 -1982)
Occupation : Consulting Actuary, Actuarial Partners Consulting Sdn Bhd
Directorship of other public
companies
: None
Member of any other Board
Committee
: None
Date of appointment to the
Investment Committee
: 30 November 2016
Number of Investment
Committee meeting attended for
the financial year ended 31
: Three (3)
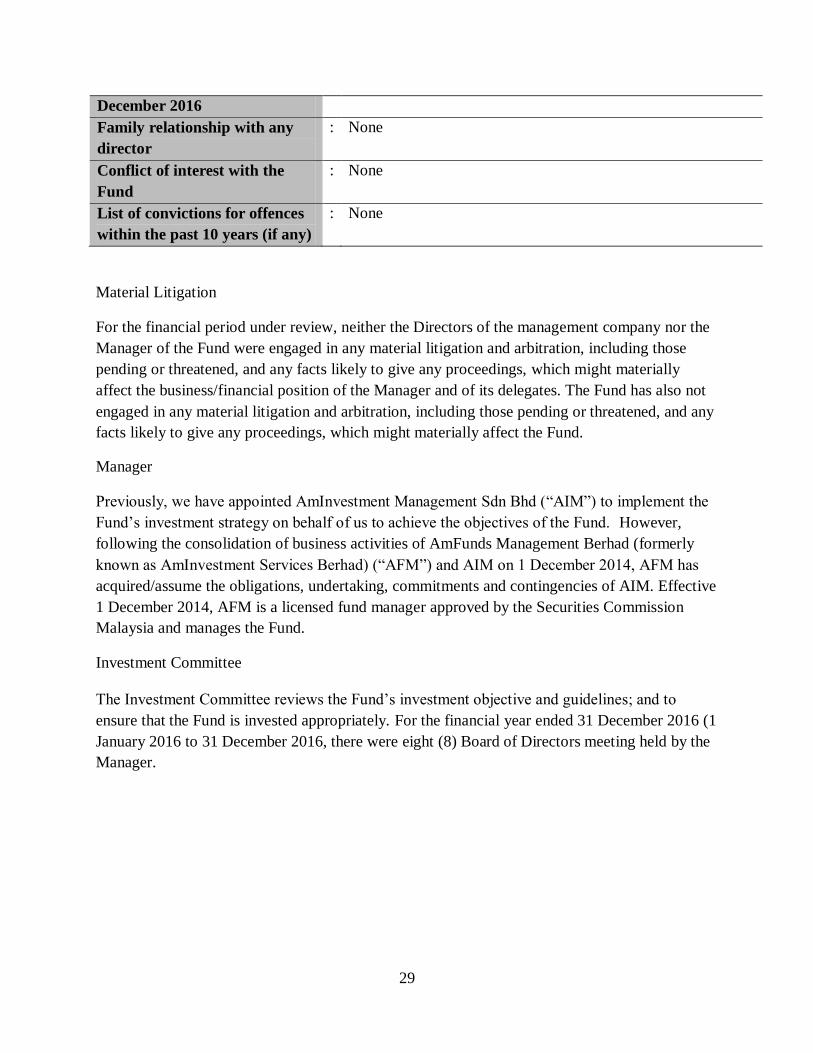
29
December 2016
Family relationship with any
director
: None
Conflict of interest with the
Fund
: None
List of convictions for offences
within the past 10 years (if any)
: None
Material Litigation
For the financial period under review, neither the Directors of the management company nor the
Manager of the Fund were engaged in any material litigation and arbitration, including those
pending or threatened, and any facts likely to give any proceedings, which might materially
affect the business/financial position of the Manager and of its delegates. The Fund has also not
engaged in any material litigation and arbitration, including those pending or threatened, and any
facts likely to give any proceedings, which might materially affect the Fund.
Manager
Previously, we have appointed AmInvestment Management Sdn Bhd (“AIM”) to implement the
Fund’s investment strategy on behalf of us to achieve the objectives of the Fund. However,
following the consolidation of business activities of AmFunds Management Berhad (formerly
known as AmInvestment Services Berhad) (“AFM”) and AIM on 1 December 2014, AFM has
acquired/assume the obligations, undertaking, commitments and contingencies of AIM. Effective
1 December 2014, AFM is a licensed fund manager approved by the Securities Commission
Malaysia and manages the Fund.
Investment Committee
The Investment Committee reviews the Fund’s investment objective and guidelines; and to
ensure that the Fund is invested appropriately. For the financial year ended 31 December 2016 (1
January 2016 to 31 December 2016, there were eight (8) Board of Directors meeting held by the
Manager.
30
Unitholders
List of the unit holders having the largest number of units:
NAME
Number of
Unit Held
Unit Held
(%)
HSBC NOMINEES (ASING) SDN BHD 1265207870 95.81872%
AMSEC NOMINEES (TEMPATAN) SDN BHD 49110100 3.71928%
AMINVESTMENT BANK BERHAD 3089330 0.23397%
DB (MALAYSIA) NOMINEE (ASING) SDN BHD 2300000 0.17419%
CITIGROUP NOMINEES (ASING) SDN BHD 400000 0.03029%
CITIGROUP NOMINEES (ASING) SDN BHD 140000 0.01060%
CIMSEC NOMINEES (TEMPATAN) SDN BHD 44100 0.00334%
HSBC NOMINEES (ASING) SDN BHD 40000 0.00303%
PUBLIC NOMINEES (TEMPATAN) SDN BHD 15000 0.00114%
TEE KAR YONG 10500 0.00080%
JAY SURIAR A/L RAJASURIAR 9600 0.00073%
MALACCA EQUITY NOMINEES (TEMPATAN) SDN
BHD 8200 0.00062%
CHEW KIAN SHEN 5000 0.00038%
FOO CHIT FONG 5000 0.00038%
MELVIN WON SOON LOONG 5000 0.00038%
WONG SOOK YEE 3600 0.00027%
JOHN MELVILLE KAYES NEWMAN 3500 0.00027%
CHA KAR HUEI 3000 0.00023%
LAU KAI CHONG 3000 0.00023%
MAYBANK NOMINEES (TEMPATAN) SDN BHD 3000 0.00023%
GRACE CHRYSTAL GOH YEE HING 2300 0.00017%
MAYBANK NOMINEES (TEMPATAN) SDN BHD 2000 0.00015%
WONG SOOK KENG 1500 0.00011%
CHONG YAM SONG 1000 0.00008%
CIMSEC NOMINEES (TEMPATAN) SDN BHD 1000 0.00008%
K.VIJAYAN A/L G.KERISNAN 1000 0.00008%
KOH AH KOW @ KOH BOON KWEE 1000 0.00008%
MAYBANK NOMINEES (TEMPATAN) SDN BHD 1000 0.00008%
MAYBANK NOMINEES (TEMPATAN) SDN BHD 1000 0.00008%
GARY CHEW KIEW SENG 700 0.00005%
Independent auditors’ report to the unitholders of
ABF Malaysia Bond Index Fund
Report on the audit of the financial statements
Opinion
Key audit matters
Basis for opinion
We conducted our audit in accordance with approved standards on auditing in Malaysia and
International Standards on Auditing. Our responsibilities under those standards are further described
in the Auditor’s Responsibilities for the Audit of the Financial Statements section of our report. We
believe that the audit evidence we have obtained is sufficient and appropriate to provide a basis for
our opinion.
Independence and other ethical responsibilities
We are independent of the Fund in accordance with the By-Laws (on Professional Ethics, Conduct
and Practice) of the Malaysian Institute of Accountants (“By-Laws”) and the International Ethics
Standards Board for Accountants’ Code of Ethics for Professional Accountants (“IESBA Code”),
and we have fulfilled our other ethical responsibilities in accordance with the By-Laws and the
IESBA Code.
Key audit matters are those matters that, in our professional judgement, were of most significance in
our audit of the financial statements of the Fund for the current year. These matters were addressed
in the context of our audit of the financial statements as a whole, and in forming our opinion thereon,
and we do not provide a separate opinion on these matters. For the matter below, our description of
how our audit addressed the matter is provided in that context.
We have audited the financial statements of ABF Malaysia Bond Index Fund (“the Fund”), which
comprise the statement of financial position as at 31 December 2016, the statement of
comprehensive income, statement of changes in equity and statement of cash flows for the financial
year then ended, and a summary of significant accounting policies and other explanatory notes, as set
out on pages 35 to 58.
In our opinion, the accompanying financial statements give a true and fair view of the financial
position of the Fund as at 31 December 2016, and of its financial performance and its cash flows for
the year then ended in accordance with Malaysian Financial Reporting Standards and International
Financial Reporting Standards.
31
Valuation and existence of investments
If based on the work we have performed, we conclude that there is a material misstatement of this
other information, we are required to report that fact. We have nothing to report in this regard.
Our response: Our audit work included, but was not restricted to, understanding the Manager’s
process and controls for the valuation of investments in order to assess compliance with relevant
accounting standards, performing walkthrough procedures and testing the operating effectiveness of
relevant controls on a sample basis. We agreed the valuation of all investments as at the year end to
an independent source of market prices. We obtained confirmation of the existence and ownership of
the investments as at the year- end directly from the Fund’s independent Trustee. The Fund’s
accounting policy on the valuation of investments is included in Note 3, and its disclosures about
investments held at the year-end are included in Note 4.
The risk: The Fund’s business is investing in a portfolio consisting of mainly Ringgit Malaysia
denominated Government and quasi-Government debt securities for investors who seek an ‘index-
based approach to investing. Accordingly, the investment portfolio of mainly Government debt
securities is a significant material item in the financial statements. The valuation of the assets held in
the investment portfolio is the key driver of the Fund’s net asset value and investment return.
Incorrect asset pricing or a failure to maintain proper legal title of assets by the Fund could have a
significant impact on portfolio valuation and, therefore, the return generated for shareholders. We
therefore identified the valuation and existence of the investment portfolio as risks that require
particular audit attention.
Independent auditors’ report to the unitholders of
Information other than the financial statements and auditors’ report thereon
Our opinion on the financial statements of the Fund does not cover the other information and we do
not express any form of assurance conclusion thereon.
In connection with our audit of the financial statements of the Fund, our responsibility is to read the
other information and, in doing so, consider whether the other information is materially inconsistent
with the financial statements of the Fund or our knowledge obtained in the audit or otherwise
appears to be materially misstated.
The Manager is responsible for the other information. The other information comprises information
in the Manager’s Report, but does not include the financial statements of the Fund and our auditors’
report thereon.
ABF Malaysia Bond Index Fund (cont’d.)
Responsibilities of the Manager and the Trustees for the financial statements
The Manager is responsible for the preparation of the financial statements of the Fund that give a
true and fair view in accordance with Malaysian Financial Reporting Standards and International
Financial Reporting Standards. The Manager is also responsible for such internal control as the
Manager determines is necessary to enable the preparation of financial statements of the Fund that
are free from material misstatement, whether due to fraud or error.
32
Our objectives are to obtain reasonable assurance about whether the financial statements of the Fund,
as a whole are free from material misstatement, whether due to fraud or error, and to issue an
auditors’ report that includes our opinion. Reasonable assurance is a high level of assurance, but is
not a guarantee that an audit conducted in accordance approved standards on auditing in Malaysia
and International Standards on Auditing will always detect a material misstatement when it exists.
Misstatements can arise from fraud or error and are considered material if, individually or in the
aggregate, they could reasonably be expected to influence the economic decisions of users taken on
the basis of these financial statements.
As part of an audit in accordance with the approved standards on auditing in Malaysia and
International Standards on Auditing, we exercise professional judgment and maintain professional
skepticism throughout the planning and performance of the audit. We also:
ABF Malaysia Bond Index Fund (cont’d.)Independent auditors’ report to the unitholders of
The Trustee is responsible for ensuring that the Manager maintains proper accounting and other
records as are necessary to enable true ad fair presentation of these financial statements.
Auditor’s responsibilities for the audit of the financial statements
Identify and assess the risks of material misstatement of the financial statements of the Fund,
whether due to fraud or error, design and perform audit procedures responsive to those risks,
and obtain audit evidence that is sufficient and appropriate to provide a basis for our opinion.
The risk of not detecting a material misstatement resulting from fraud is higher than for one
resulting from error, as fraud may involve collusion, forgery, intentional omissions,
misrepresentations, or the override of internal control.
Obtain an understanding of internal control relevant to the audit in order to design audit
procedures that are appropriate in the circumstances, but not for the purpose of expressing an
opinion on the effectiveness of the Fund’s internal control.
Evaluate the appropriateness of accounting policies used and the reasonableness of accounting
estimates and related disclosures made by the Manager.
Conclude on the appropriateness of the Manager’s use of the going concern basis of
accounting and, based on the audit evidence obtained, whether a material uncertainty exists
related to events or conditions that may cast significant doubt on the Fund’s ability to continue
as a going concern. If we conclude that a material uncertainty exists, we are required to draw
attention in our auditors’ report to the related disclosures in the financial statements or, if such
disclosures are inadequate, to modify our opinion. Our conclusions are based on the audit
evidence obtained up to the date of our auditors’ report. However, future events or conditions
may cause the Fund to cease to continue as a going concern.
In preparing the financial statements of the Fund, the Manager is responsible for assessing the Fund’s
ability to continue as a going concern, disclosing, as applicable, matters related to going concern and
using the going concern basis of accounting unless the Manager either intends to liquidate the Fund
or to cease operations, or has no realistic alternative to do so.
33
Wan Daneena Liza Bt Wan Abdul Rahman
No. 2978/03/18(J)
Chartered Accountants Chartered Accountant
Kuala Lumpur, Malaysia
14 February 2017
Independent auditors’ report to the unitholders of ABF Malaysia Bond Index Fund (cont’d.)
Evaluate the overall presentation, structure and content of the financial statements of the
Fund, including the disclosures, and whether the financial statements of the Fund represent the
underlying transactions and events in a manner that achieves fair presentation.
Other matters
We communicate with the Manager regarding, among other matters, the planned scope and timing of
the audit and significant audit findings, including any significant deficiencies in internal control that
we identify during our audit.
AF: 0039
Ernst & Young
This report is made solely to the unitholders of the Fund, as a body, and for no other purpose. We do
not assume responsibility to any other person for the content of this report.
We also provide the Manager with a statement that we have complied with relevant ethical
requirements regarding independence, and to communicate with them all relationships and other
matters that may reasonably be thought to bear on our independence, and where applicable, related
safeguards.
34
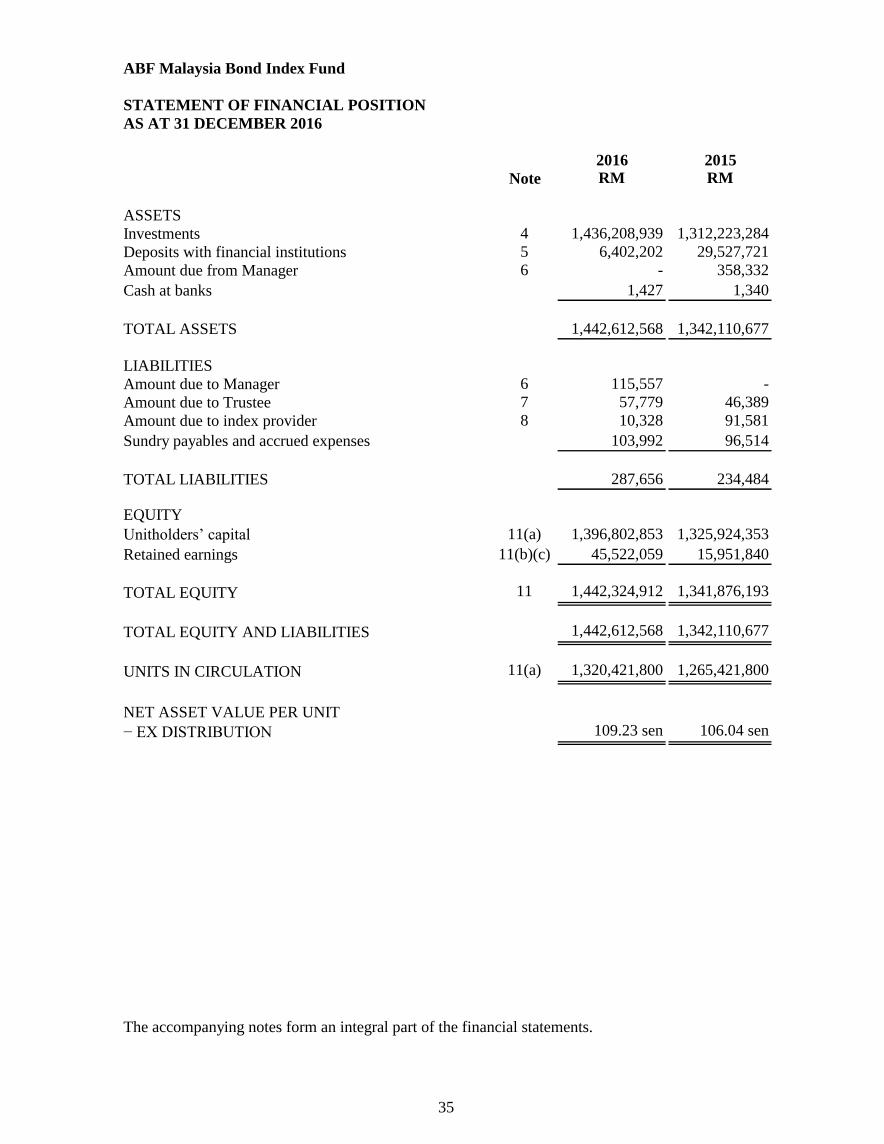
ABF Malaysia Bond Index Fund
STATEMENT OF FINANCIAL POSITION
AS AT 31 DECEMBER 2016
2016 2015
Note RM RM
ASSETS
Investments 4 1,436,208,939 1,312,223,284
Deposits with financial institutions 5 6,402,202 29,527,721
Amount due from Manager 6 - 358,332
Cash at banks 1,427 1,340
TOTAL ASSETS 1,442,612,568 1,342,110,677
LIABILITIES
Amount due to Manager 6 115,557 -
Amount due to Trustee 7 57,779 46,389
Amount due to index provider 8 10,328 91,581
Sundry payables and accrued expenses 103,992 96,514
TOTAL LIABILITIES 287,656 234,484
EQUITY
Unitholders’ capital 11(a) 1,396,802,853 1,325,924,353
Retained earnings 11(b)(c) 45,522,059 15,951,840
TOTAL EQUITY 11 1,442,324,912 1,341,876,193
TOTAL EQUITY AND LIABILITIES 1,442,612,568 1,342,110,677
UNITS IN CIRCULATION 11(a) 1,320,421,800 1,265,421,800
NET ASSET VALUE PER UNIT
− EX DISTRIBUTION 109.23 sen 106.04 sen
The accompanying notes form an integral part of the financial statements.
35
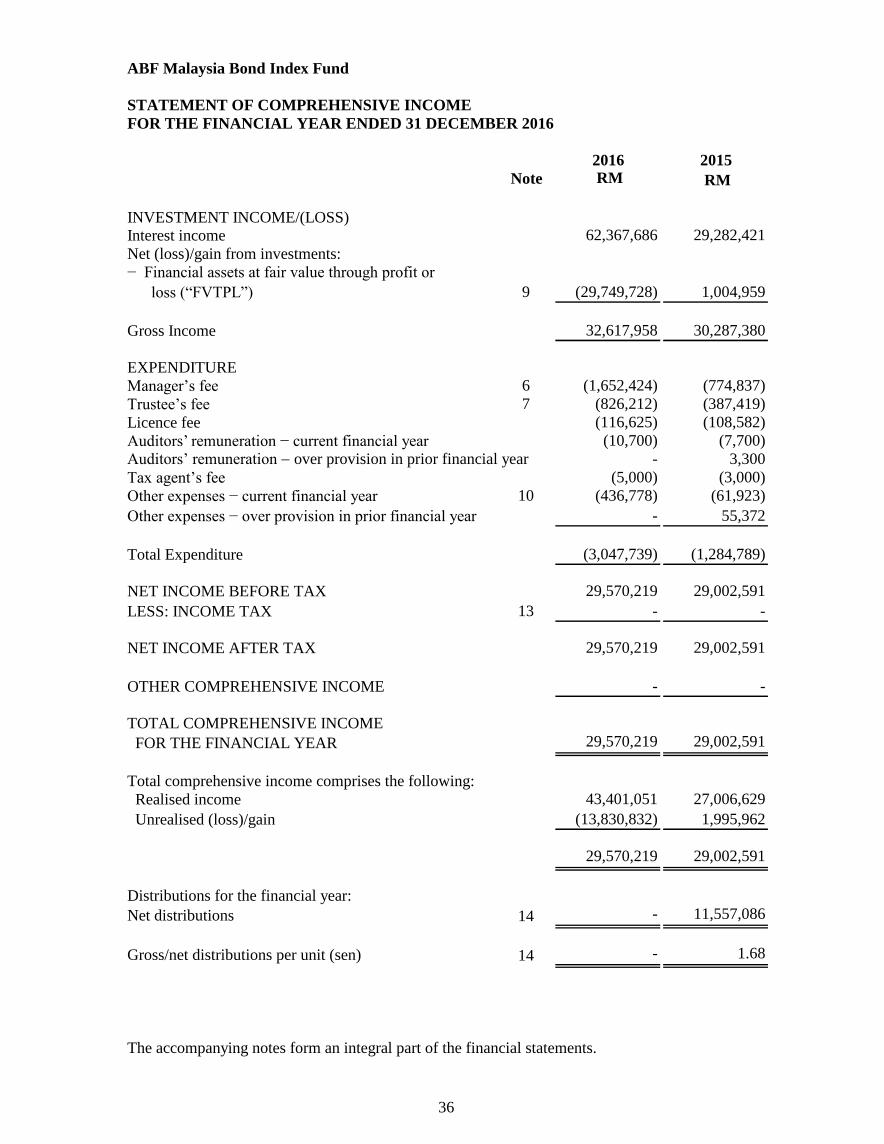
ABF Malaysia Bond Index Fund
STATEMENT OF COMPREHENSIVE INCOME
FOR THE FINANCIAL YEAR ENDED 31 DECEMBER 2016
2016 2015
Note RM RM
Interest income 62,367,686 29,282,421
Net (loss)/gain from investments:
− Financial assets at fair value through profit or
loss (“FVTPL”) 9 (29,749,728) 1,004,959
Gross Income 32,617,958 30,287,380
EXPENDITURE
Manager’s fee 6 (1,652,424) (774,837)
Trustee’s fee 7 (826,212) (387,419)
Licence fee (116,625) (108,582)
Auditors’ remuneration − current financial year (10,700) (7,700)
Auditors’ remuneration - over provision in prior financial year - 3,300
Tax agent’s fee (5,000) (3,000)
Other expenses − current financial year 10 (436,778) (61,923)
Other expenses − over provision in prior financial year - 55,372
Total Expenditure (3,047,739) (1,284,789)
NET INCOME BEFORE TAX 29,570,219 29,002,591
LESS: INCOME TAX 13 - -
NET INCOME AFTER TAX 29,570,219 29,002,591
OTHER COMPREHENSIVE INCOME - -
TOTAL COMPREHENSIVE INCOME
FOR THE FINANCIAL YEAR 29,570,219 29,002,591
Total comprehensive income comprises the following:
Realised income 43,401,051 27,006,629
Unrealised (loss)/gain (13,830,832) 1,995,962
29,570,219 29,002,591
Distributions for the financial year:
Net distributions 14 - 11,557,086
Gross/net distributions per unit (sen) 14 - 1.68
The accompanying notes form an integral part of the financial statements.
INVESTMENT INCOME/(LOSS)
36
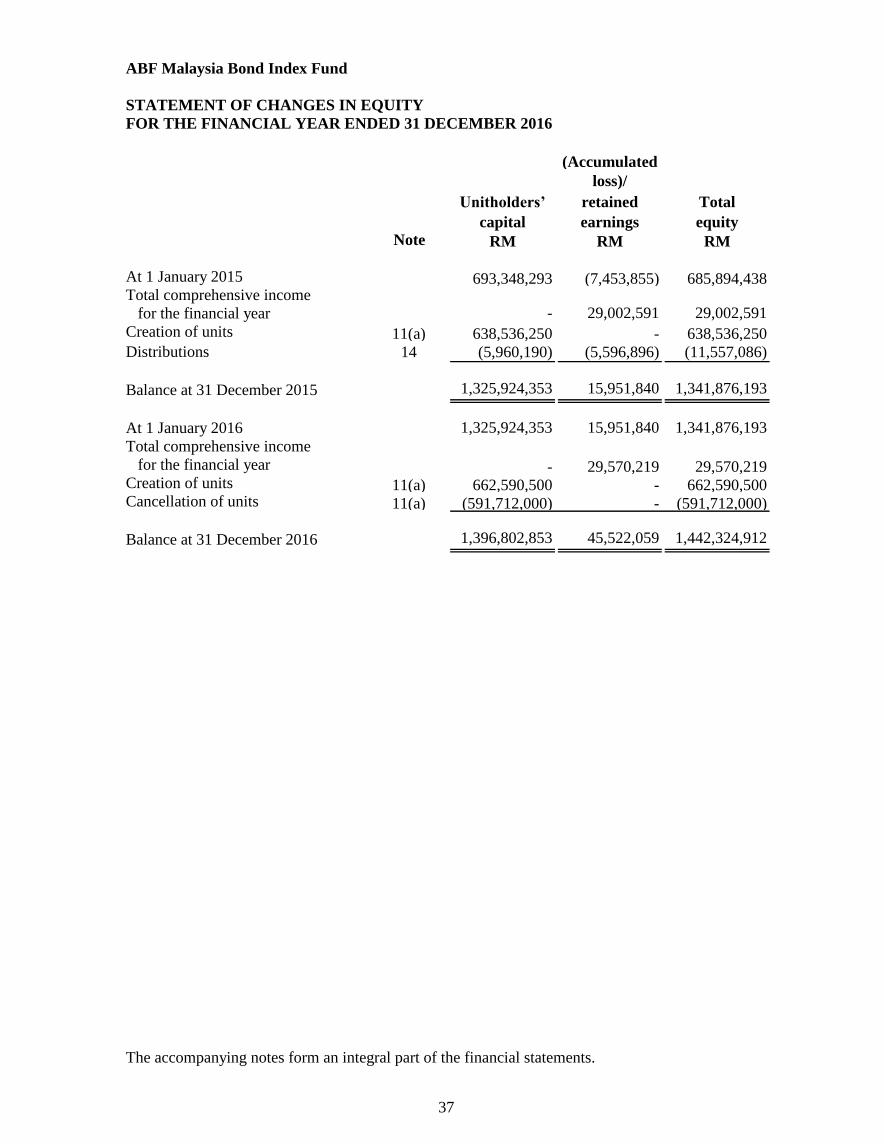
ABF Malaysia Bond Index Fund
STATEMENT OF CHANGES IN EQUITY
FOR THE FINANCIAL YEAR ENDED 31 DECEMBER 2016
(Accumulated
loss)/
Unitholders’ retained Total
capital earnings equityNote RM RM RM
At 1 January 2015 693,348,293 (7,453,855) 685,894,438Total comprehensive income
for the financial year - 29,002,591 29,002,591
Creation of units 11(a) 638,536,250 - 638,536,250Distributions 14 (5,960,190) (5,596,896) (11,557,086)
Balance at 31 December 2015 1,325,924,353 15,951,840 1,341,876,193
At 1 January 2016 1,325,924,353 15,951,840 1,341,876,193
Total comprehensive income
for the financial year - 29,570,219 29,570,219 Creation of units 11(a) 662,590,500 - 662,590,500 Cancellation of units 11(a) (591,712,000) - (591,712,000)
Balance at 31 December 2016 1,396,802,853 45,522,059 1,442,324,912
The accompanying notes form an integral part of the financial statements.
37
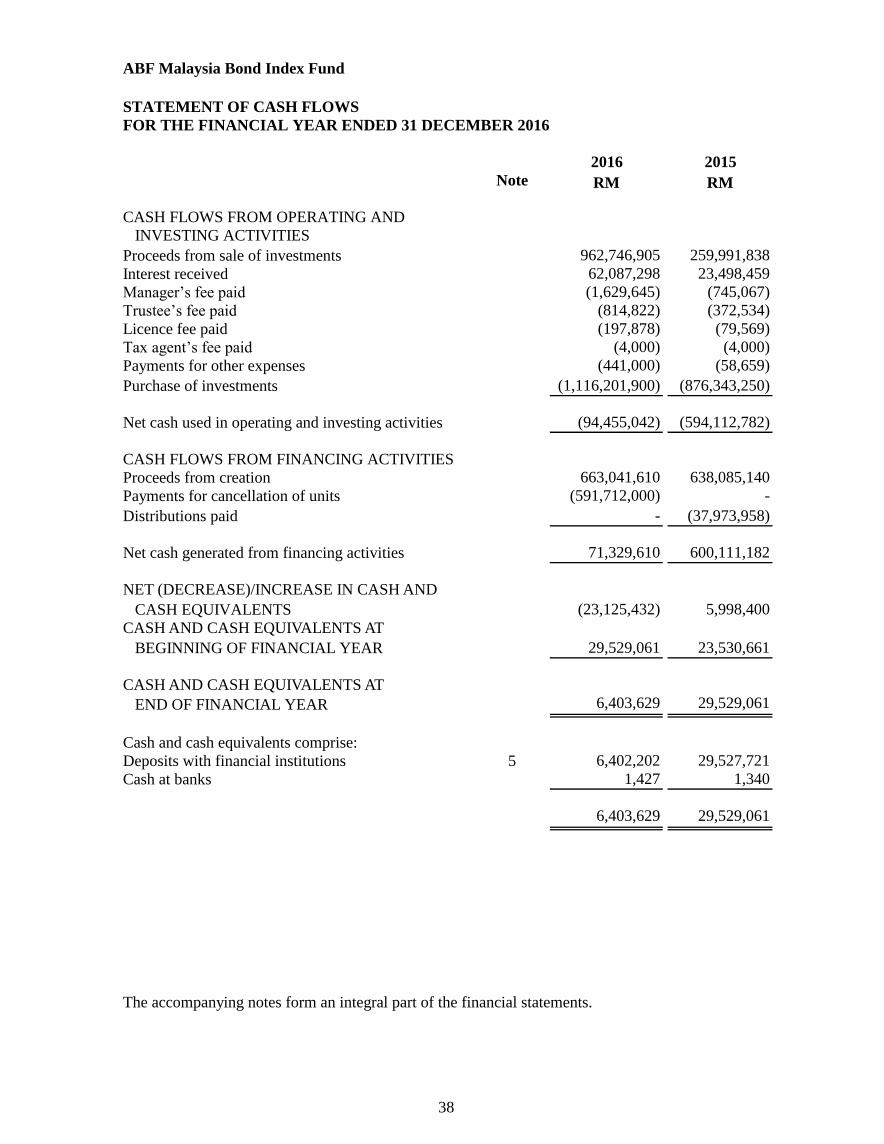
ABF Malaysia Bond Index Fund
STATEMENT OF CASH FLOWS
FOR THE FINANCIAL YEAR ENDED 31 DECEMBER 2016
2016 2015
Note RM RM
CASH FLOWS FROM OPERATING AND
INVESTING ACTIVITIES
Proceeds from sale of investments 962,746,905 259,991,838
Interest received 62,087,298 23,498,459
Manager’s fee paid (1,629,645) (745,067)
Trustee’s fee paid (814,822) (372,534)
Licence fee paid (197,878) (79,569)
Tax agent’s fee paid (4,000) (4,000)
Payments for other expenses (441,000) (58,659)
Purchase of investments (1,116,201,900) (876,343,250)
Net cash used in operating and investing activities (94,455,042) (594,112,782)
CASH FLOWS FROM FINANCING ACTIVITIES
Proceeds from creation 663,041,610 638,085,140
Payments for cancellation of units (591,712,000) -
Distributions paid - (37,973,958)
Net cash generated from financing activities 71,329,610 600,111,182
NET (DECREASE)/INCREASE IN CASH AND
CASH EQUIVALENTS (23,125,432) 5,998,400
CASH AND CASH EQUIVALENTS AT
BEGINNING OF FINANCIAL YEAR 29,529,061 23,530,661
CASH AND CASH EQUIVALENTS AT
END OF FINANCIAL YEAR 6,403,629 29,529,061
Cash and cash equivalents comprise:
Deposits with financial institutions 5 6,402,202 29,527,721
Cash at banks 1,427 1,340
6,403,629 29,529,061
The accompanying notes form an integral part of the financial statements.
38
ABF Malaysia Bond Index Fund
NOTES TO THE FINANCIAL STATEMENTS
1. GENERAL INFORMATION
2. BASIS OF PREPARATION OF FINANCIAL STATEMENTS
Standards effective during the financial year
Standards issued but not yet effective
Effective for
financial periods
beginning on or after
MFRS 9: Financial Instruments
MFRS 15: Revenue from contracts with Customers
1 January 2018
1 January 2018
The adoption of MFRS which have been effective during the financial year did not have any material
financial impact to the financial statements.
As at the date of authorisation of these financial statements, the following Standards and Amendments
have been issued by MASB but are not yet effective and have not been adopted by the Fund.
The financial statements of the Fund have been prepared in accordance with Malaysian Financial
Reporting Standards (“MFRS”) as issued by the Malaysian Accounting Standards Board (“MASB”)
and are in compliance with International Financial Reporting Standards.
ABF Malaysia Bond Index Fund (“the Fund”) was established pursuant to a Deed dated 12 July 2005
as amended by Deeds Supplemental thereto (“the Deed”), between AmFunds Management Berhad as
the Manager, HSBC (Malaysia) Trustee Berhad as the Trustee and all unitholders.
The Fund plans to adopt the above pronouncements when they become effective in the respective
financial periods. These pronouncements are expected to have no significant impact to the financial
statements of the Fund upon their initial application except as described below:
The Fund was set up with the objective for investors who seek an “index-based” approach to investing
in a portfolio of Ringgit Malaysia denominated Government and quasi-Government debt securities. As
provided in the Deeds, the “accrual period” or financial year shall end on 31 December and the units in
the Fund were first offered for sale on 13 July 2005.
The financial statements of the Fund have been prepared under the historical cost convention, unless
otherwise stated in the accounting policies.
39
MFRS 9 Financial Instruments
3. SIGNIFICANT ACCOUNTING POLICIES
Income recognition
Income tax
Functional and presentation currency
Statement of cash flows
Distribution
Income is recognised to the extent that it is probable that the economic benefits will flow to the Fund
and the income can be reliably measured. Income is measured at the fair value of consideration
received or receivable.
Current taxes are recognised in profit or loss except to the extent that the tax relates to items
recognised outside profit or loss, either in other comprehensive income or directly in equity.
Current tax assets and liabilities are measured at the amount expected to be recovered from or paid to
the tax authorities. The tax rates and tax laws used to compute the amount are those that are enacted or
substantively enacted at the reporting date.
The Fund adopts the direct method in the preparation of the statement of cash flows.
Functional currency is the currency of the primary economic environment in which the Fund operates
that most faithfully represents the economic effects of the underlying transactions. The functional
currency of the Fund is Ringgit Malaysia which reflects the currency in which the Fund competes for
funds, issues and redeems units. The Fund has also adopted Ringgit Malaysia as its presentation
currency.
Interest income on fixed income securities and short-term deposits are recognised on an accrual basis
using the effective interest method, which includes the accretion of discounts and amortisation of
premiums.
MFRS 9 reflects International Accounting Standards Board’s (“IASB”) work on the replacement of
MFRS 139 Financial Instruments: Recognition and Measurement (“MFRS 139”). MFRS 9 will be
effective for financial year beginning on or after 1 January 2018. The Fund is in the process of
quantifying the impact of the first adoption of MFRS 9.
Cash equivalents are short-term, highly liquid investments that are readily convertible to cash with
insignificant risk of changes in value.
Distributions are at the discretion of the Fund. A distribution to the Fund’s unitholders is accounted for
as a deduction from realised reserves except where distribution is sourced out of distribution/loss
equalisation which is accounted for as a deduction from/addition to unitholders’ capital. A proposed
distribution is recognised as a liability in the period in which it is approved.
40
Unitholders’ capital
Distribution/loss equalisation
Financial assets
(i) Financial assets at FVTPL
(ii) Loans and receivables
Distribution/loss equalisation represents the average distributable amount included in the creation and
cancellation prices of units. This amount is either refunded to unitholders by way of distribution and/or
adjusted accordingly when units are cancelled.
Investments are stated at fair value on a portfolio basis in accordance with the provisions of the
Deed, fair value is determined based on prices provided by the index provider, Markit Indices
Limited, plus accrued interest. Adjusted cost of investments relates to the purchase cost plus
accrued interest, adjusted for amortisation of premium and accretion of discount, if any, calculated
over the period from the date of acquisition to the date of maturity of the respective securities as
approved by the Manager and the Trustee. Unrealised gain or loss recognised in profit or loss is
not distributable in nature.
On disposal of investments, the net realised gain or loss on disposal is measured as the difference
between the net disposal proceeds and the carrying amount of the investments. The net realised
gain or loss is recognised in profit or loss.
Financial assets are recognised in the statement of financial position when, and only when, the Fund
becomes a party to the contractual provisions of the financial instrument.
When financial assets are recognised initially, they are measured at fair value, plus, in the case of
financial assets not at fair value through profit or loss, directly attributable transaction costs.
The unitholders’ capital of the Fund meets the definition of puttable instruments and is classified as
equity instruments under MFRS 132 Financial Instruments: Presentation (“MFRS 132”).
Financial assets are classified as financial assets at FVTPL if they are held for trading or are
designated as such upon initial recognition. Financial assets held for trading by the Fund include
fixed income securities acquired principally for the purpose of selling in the near term.
The Fund determines the classification of its financial assets at initial recognition, and the categories
applicable to the Fund include financial assets at fair value through profit or loss (“FVTPL”) and loans
and receivables.
Financial assets with fixed or determinable payments that are not quoted in an active market are
classified as loans and receivables.
Subsequent to initial recognition, financial assets at FVTPL are measured at fair value. Changes in
the fair value of those financial instruments are recorded in ‘Net gain or loss on financial assets at
fair value through profit or loss’. Interest earned element of such instrument is recorded separately
in ‘Interest income’.
41
Impairment of financial assets
(i) Loans and receivables carried at amortised cost
Financial liabilities
Financial liabilities are classified according to the substance of the contractual arrangements entered
into and the definitions of a financial liability.
A financial liability is derecognised when the obligation under the liability is extinguished. Gains and
losses are recognised in profit or loss when the liabilities are derecognised, and through the
amortisation process.
Financial liabilities, within the scope of MFRS 139, are recognised in the statement of financial
position when, and only when, the Fund becomes a party to the contractual provisions of the financial
instrument.
The Fund assesses at each reporting date whether there is any objective evidence that a financial asset
is impaired.
To determine whether there is objective evidence that an impairment loss on financial assets has
been incurred, the Fund considers factors such as the probability of insolvency or significant
financial difficulties of the debtor and default or significant delay in payments.
The Fund’s financial liabilities are recognised initially at fair value plus directly attributable
transaction costs and subsequently measured at amortised cost using the effective interest method.
If any such evidence exists, the amount of impairment loss is measured as the difference between
the asset’s carrying amount and the present value of estimated future cash flows discounted at the
financial asset’s original effective interest rate. The impairment loss is recognised in profit or loss.
The carrying amount of the financial asset is reduced through the use of an allowance account.
When loans and receivables become uncollectible, they are written off against the allowance
account.
If in a subsequent period, the amount of the impairment loss decreases and the decrease can be
related objectively to an event occurring after the impairment was recognised, the previously
recognised impairment loss is reversed to the extent that the carrying amount of the asset does not
exceed its amortised cost at the reversal date. The amount of reversal is recognised in profit or
loss.
Subsequent to initial recognition, loans and receivables are measured at amortised cost using the
effective interest method. Gains and losses are recognised in profit or loss when the loans and
receivables are derecognised or impaired, and through the amortisation process.
42
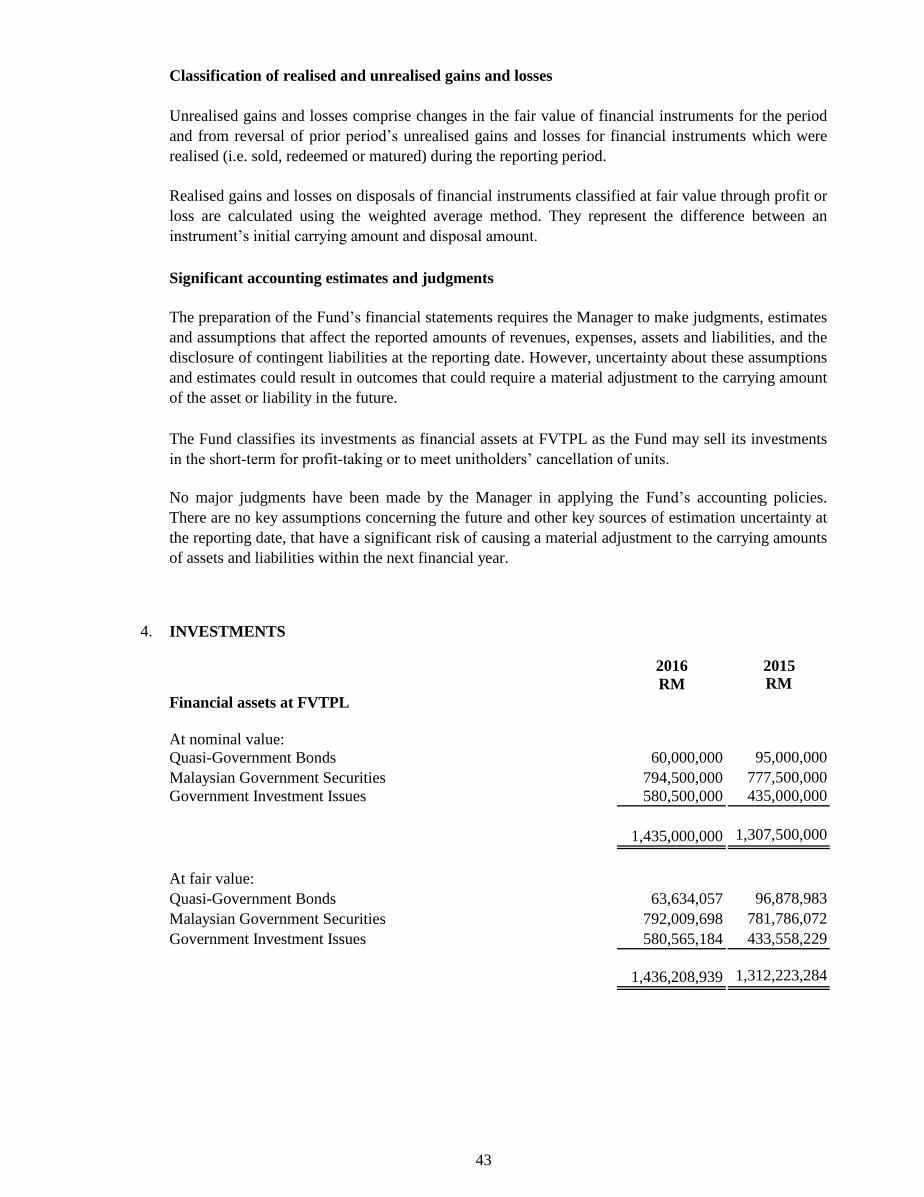
Classification of realised and unrealised gains and losses
Significant accounting estimates and judgments
4. INVESTMENTS
2016 2015
RM RM
Financial assets at FVTPL
At nominal value:
Quasi-Government Bonds 60,000,000 95,000,000
Malaysian Government Securities 794,500,000 777,500,000
Government Investment Issues 580,500,000 435,000,000
1,435,000,000 1,307,500,000
At fair value:
Quasi-Government Bonds 63,634,057 96,878,983
Malaysian Government Securities 792,009,698 781,786,072
Government Investment Issues 580,565,184 433,558,229
1,436,208,939 1,312,223,284
The Fund classifies its investments as financial assets at FVTPL as the Fund may sell its investments
in the short-term for profit-taking or to meet unitholders’ cancellation of units.
Realised gains and losses on disposals of financial instruments classified at fair value through profit or
loss are calculated using the weighted average method. They represent the difference between an
instrument’s initial carrying amount and disposal amount.
The preparation of the Fund’s financial statements requires the Manager to make judgments, estimates
and assumptions that affect the reported amounts of revenues, expenses, assets and liabilities, and the
disclosure of contingent liabilities at the reporting date. However, uncertainty about these assumptions
and estimates could result in outcomes that could require a material adjustment to the carrying amount
of the asset or liability in the future.
No major judgments have been made by the Manager in applying the Fund’s accounting policies.
There are no key assumptions concerning the future and other key sources of estimation uncertainty at
the reporting date, that have a significant risk of causing a material adjustment to the carrying amounts
of assets and liabilities within the next financial year.
Unrealised gains and losses comprise changes in the fair value of financial instruments for the period
and from reversal of prior period’s unrealised gains and losses for financial instruments which were
realised (i.e. sold, redeemed or matured) during the reporting period.
43
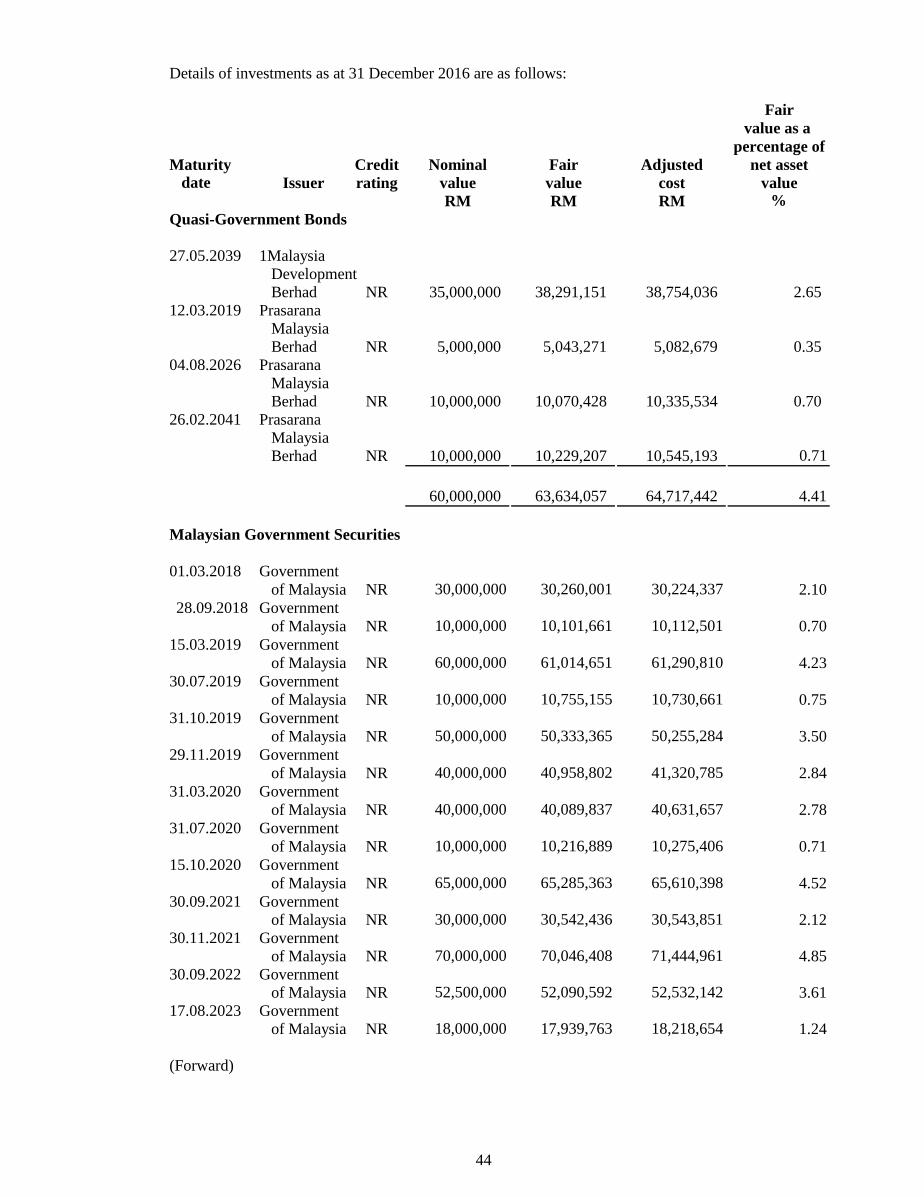
Details of investments as at 31 December 2016 are as follows:
Fair
value as a
percentage of
Maturity Credit Nominal Fair Adjusted net asset
date Issuer rating value value cost value
RM RM RM %
Quasi-Government Bonds
27.05.2039 1Malaysia
Development
Berhad NR 35,000,000 38,291,151 38,754,036 2.65
12.03.2019
Malaysia
Berhad NR 5,000,000 5,043,271 5,082,679 0.35
04.08.2026
Malaysia
Berhad NR 10,000,000 10,070,428 10,335,534 0.70
26.02.2041
Malaysia
Berhad NR 10,000,000 10,229,207 10,545,193 0.71
60,000,000 63,634,057 64,717,442 4.41
Malaysian Government Securities
01.03.2018 Government
of Malaysia NR 30,000,000 30,260,001 30,224,337 2.10
Government
of Malaysia NR 10,000,000 10,101,661 10,112,501 0.70
15.03.2019 Government
of Malaysia NR 60,000,000 61,014,651 61,290,810 4.23
30.07.2019 Government
of Malaysia NR 10,000,000 10,755,155 10,730,661 0.75
31.10.2019 Government
of Malaysia NR 50,000,000 50,333,365 50,255,284 3.50
29.11.2019 Government
of Malaysia NR 40,000,000 40,958,802 41,320,785 2.84
31.03.2020 Government
of Malaysia NR 40,000,000 40,089,837 40,631,657 2.78
31.07.2020 Government
of Malaysia NR 10,000,000 10,216,889 10,275,406 0.71
15.10.2020 Government
of Malaysia NR 65,000,000 65,285,363 65,610,398 4.52
30.09.2021 Government
of Malaysia NR 30,000,000 30,542,436 30,543,851 2.12
30.11.2021 Government
of Malaysia NR 70,000,000 70,046,408 71,444,961 4.85
30.09.2022 Government
of Malaysia NR 52,500,000 52,090,592 52,532,142 3.61
17.08.2023 Government
of Malaysia NR 18,000,000 17,939,763 18,218,654 1.24
(Forward)
28.09.2018
Prasarana
Prasarana
Prasarana
44
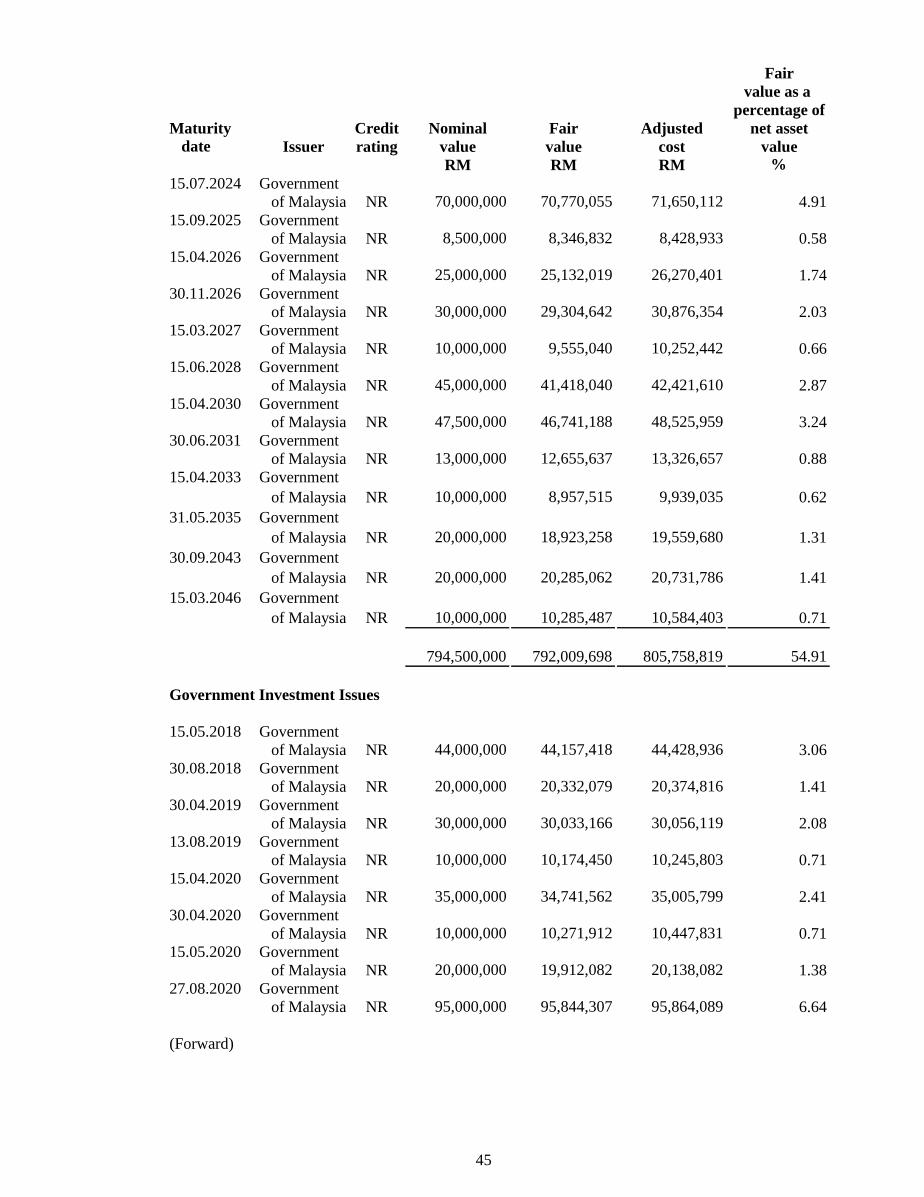
Fair
value as a
percentage of
Maturity Credit Nominal Fair Adjusted net asset
date Issuer rating value value cost value
RM RM RM %
15.07.2024 Government
of Malaysia NR 70,000,000 70,770,055 71,650,112 4.91
15.09.2025 Government
of Malaysia NR 8,500,000 8,346,832 8,428,933 0.58
15.04.2026 Government
of Malaysia NR 25,000,000 25,132,019 26,270,401 1.74
30.11.2026 Government
of Malaysia NR 30,000,000 29,304,642 30,876,354 2.03
15.03.2027 Government
of Malaysia NR 10,000,000 9,555,040 10,252,442 0.66
15.06.2028 Government
of Malaysia NR 45,000,000 41,418,040 42,421,610 2.87
15.04.2030 Government
of Malaysia NR 47,500,000 46,741,188 48,525,959 3.24
30.06.2031 Government
of Malaysia NR 13,000,000 12,655,637 13,326,657 0.88
15.04.2033 Government
of Malaysia NR 10,000,000 8,957,515 9,939,035 0.62
31.05.2035 Government
of Malaysia NR 20,000,000 18,923,258 19,559,680 1.31
30.09.2043 Government
of Malaysia NR 20,000,000 20,285,062 20,731,786 1.41
15.03.2046 Government
of Malaysia NR 10,000,000 10,285,487 10,584,403 0.71
794,500,000 792,009,698 805,758,819 54.91
Government Investment Issues
15.05.2018 Government
of Malaysia NR 44,000,000 44,157,418 44,428,936 3.06
30.08.2018 Government
of Malaysia NR 20,000,000 20,332,079 20,374,816 1.41
30.04.2019 Government
of Malaysia NR 30,000,000 30,033,166 30,056,119 2.08
13.08.2019 Government
of Malaysia NR 10,000,000 10,174,450 10,245,803 0.71
15.04.2020 Government
of Malaysia NR 35,000,000 34,741,562 35,005,799 2.41
30.04.2020 Government
of Malaysia NR 10,000,000 10,271,912 10,447,831 0.71
15.05.2020 Government
of Malaysia NR 20,000,000 19,912,082 20,138,082 1.38
27.08.2020 Government
of Malaysia NR 95,000,000 95,844,307 95,864,089 6.64
(Forward)
45
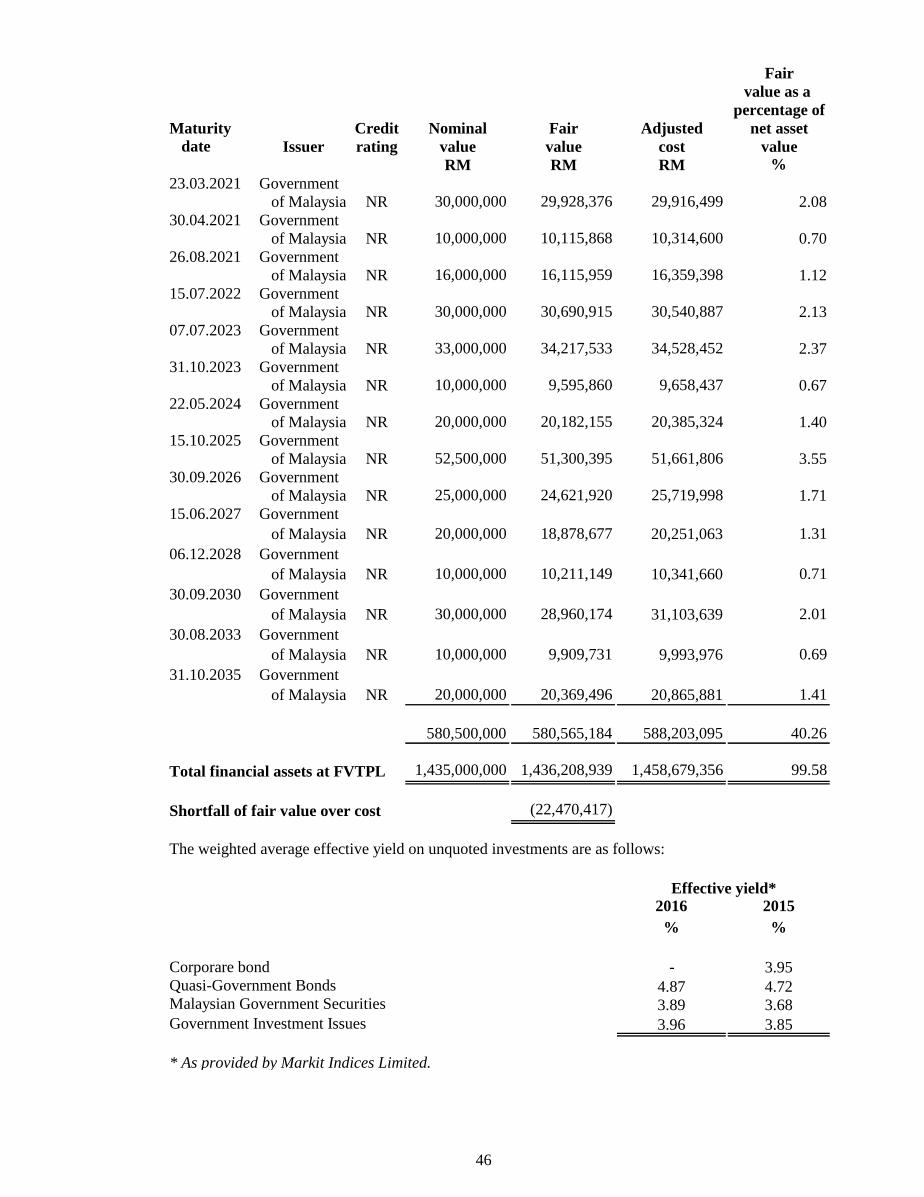
Fair
value as a
percentage of
Maturity Credit Nominal Fair Adjusted net asset
date Issuer rating value value cost value
RM RM RM %
23.03.2021 Government
of Malaysia NR 30,000,000 29,928,376 29,916,499 2.08
30.04.2021 Government
of Malaysia NR 10,000,000 10,115,868 10,314,600 0.70
26.08.2021 Government
of Malaysia NR 16,000,000 16,115,959 16,359,398 1.12
15.07.2022 Government
of Malaysia NR 30,000,000 30,690,915 30,540,887 2.13
07.07.2023 Government
of Malaysia NR 33,000,000 34,217,533 34,528,452 2.37
31.10.2023 Government
of Malaysia NR 10,000,000 9,595,860 9,658,437 0.67
22.05.2024 Government
of Malaysia NR 20,000,000 20,182,155 20,385,324 1.40
15.10.2025 Government
of Malaysia NR 52,500,000 51,300,395 51,661,806 3.55
30.09.2026 Government
of Malaysia NR 25,000,000 24,621,920 25,719,998 1.71
15.06.2027 Government
of Malaysia NR 20,000,000 18,878,677 20,251,063 1.31
06.12.2028 Government
of Malaysia NR 10,000,000 10,211,149 10,341,660 0.71
30.09.2030 Government
of Malaysia NR 30,000,000 28,960,174 31,103,639 2.01
30.08.2033 Government
of Malaysia NR 10,000,000 9,909,731 9,993,976 0.69
31.10.2035 Government
of Malaysia NR 20,000,000 20,369,496 20,865,881 1.41
580,500,000 580,565,184 588,203,095 40.26
Total financial assets at FVTPL 1,435,000,000 1,436,208,939 1,458,679,356 99.58
Shortfall of fair value over cost (22,470,417)
2016 2015
% %
Corporare bond - 3.95
4.87 4.72
3.89 3.68
3.96 3.85
* As provided by Markit Indices Limited.
Government Investment Issues
Effective yield*
Malaysian Government Securities
The weighted average effective yield on unquoted investments are as follows:
Quasi-Government Bonds
46
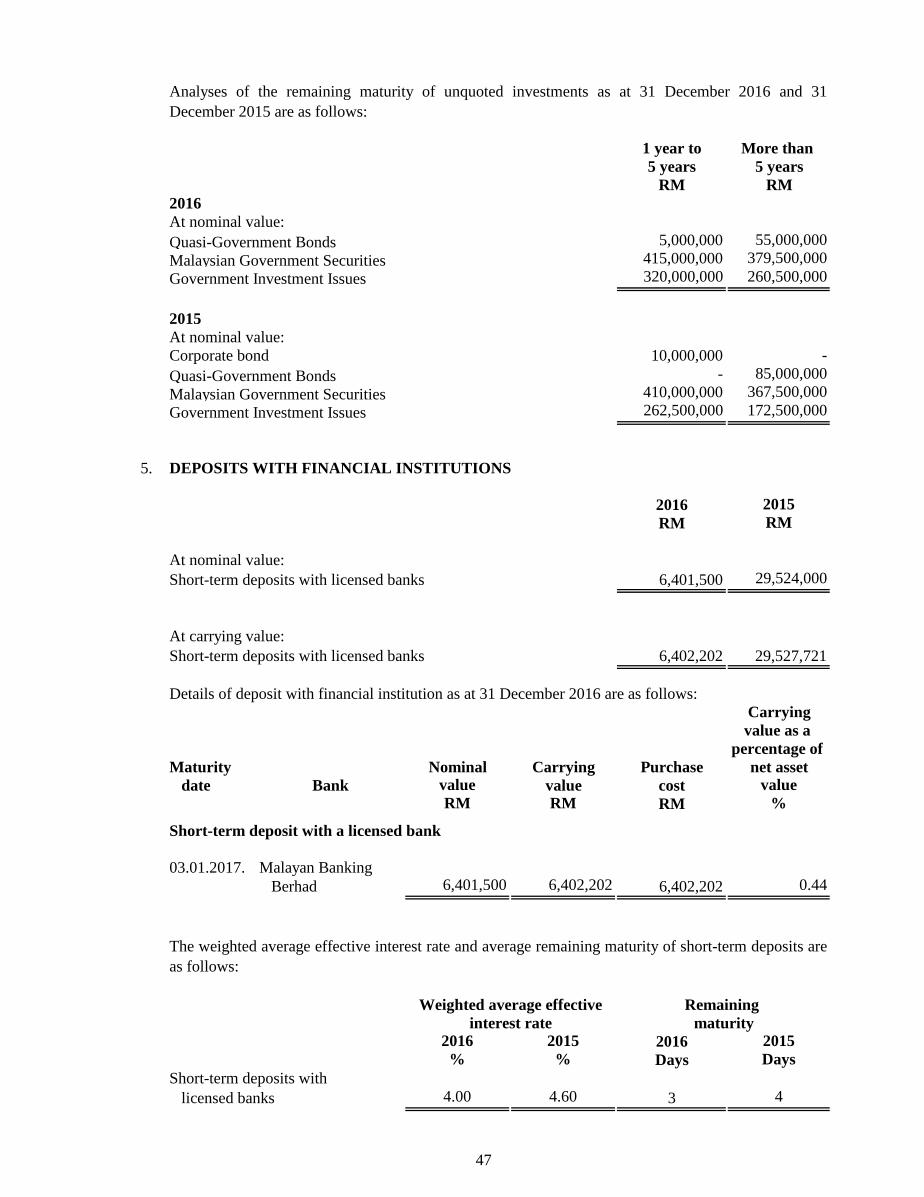
1 year to More than
5 years 5 years
RM RM
2016
At nominal value:
Quasi-Government Bonds 5,000,000 55,000,000
Malaysian Government Securities 415,000,000 379,500,000
Government Investment Issues 320,000,000 260,500,000
2015
At nominal value:
Corporate bond 10,000,000 -
Quasi-Government Bonds - 85,000,000
Malaysian Government Securities 410,000,000 367,500,000
Government Investment Issues 262,500,000 172,500,000
5. DEPOSITS WITH FINANCIAL INSTITUTIONS
2016 2015
RM RM
At nominal value:
Short-term deposits with licensed banks 6,401,500 29,524,000
At carrying value:
Short-term deposits with licensed banks 6,402,202 29,527,721
Details of deposit with financial institution as at 31 December 2016 are as follows:
Carrying
value as a
percentage of
Maturity Nominal Carrying Purchase net asset
date Bank value value cost value
RM RM RM %
Short-term deposit with a licensed bank
Malayan Banking
Berhad 6,401,500 6,402,202 6,402,202 0.44
Weighted average effective Remaining
interest rate maturity2016 2015 2016 2015
% % Days Days
Short-term deposits with
licensed banks 4.00 4.60 3 4
Analyses of the remaining maturity of unquoted investments as at 31 December 2016 and 31
December 2015 are as follows:
The weighted average effective interest rate and average remaining maturity of short-term deposits are
as follows:
03.01.2017.
47
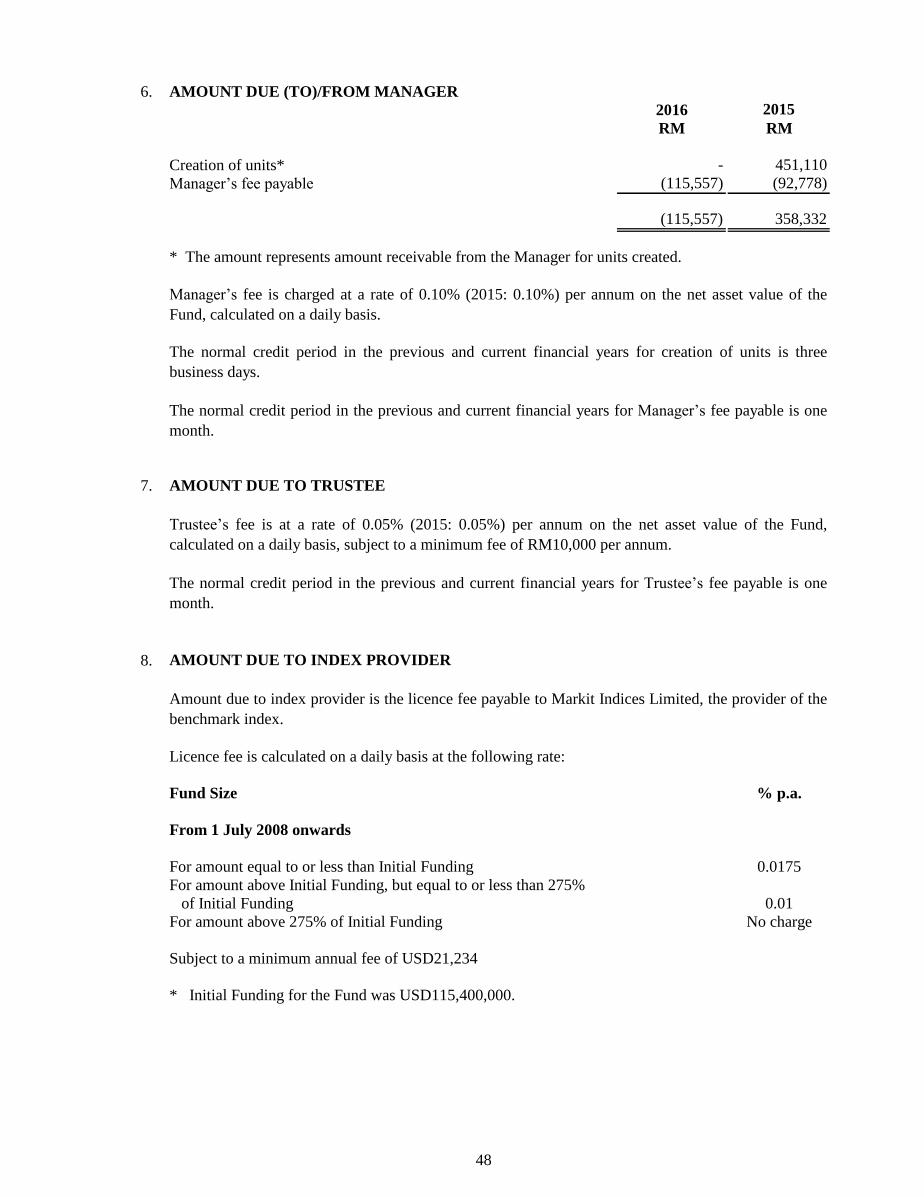
6. AMOUNT DUE (TO)/FROM MANAGER
2016 2015
RM RM
Creation of units* - 451,110
Manager’s fee payable (115,557) (92,778)
(115,557) 358,332
* The amount represents amount receivable from the Manager for units created.
7. AMOUNT DUE TO TRUSTEE
8. AMOUNT DUE TO INDEX PROVIDER
Fund Size % p.a.
From 1 July 2008 onwards
For amount equal to or less than Initial Funding 0.0175
For amount above Initial Funding, but equal to or less than 275%
of Initial Funding 0.01
For amount above 275% of Initial Funding No charge
Subject to a minimum annual fee of USD21,234
* Initial Funding for the Fund was USD115,400,000.
Trustee’s fee is at a rate of 0.05% (2015: 0.05%) per annum on the net asset value of the Fund,
calculated on a daily basis, subject to a minimum fee of RM10,000 per annum.
The normal credit period in the previous and current financial years for Trustee’s fee payable is one
month.
Amount due to index provider is the licence fee payable to Markit Indices Limited, the provider of the
benchmark index.
Manager’s fee is charged at a rate of 0.10% (2015: 0.10%) per annum on the net asset value of the
Fund, calculated on a daily basis.
The normal credit period in the previous and current financial years for Manager’s fee payable is one
month.
Licence fee is calculated on a daily basis at the following rate:
The normal credit period in the previous and current financial years for creation of units is three
business days.
48
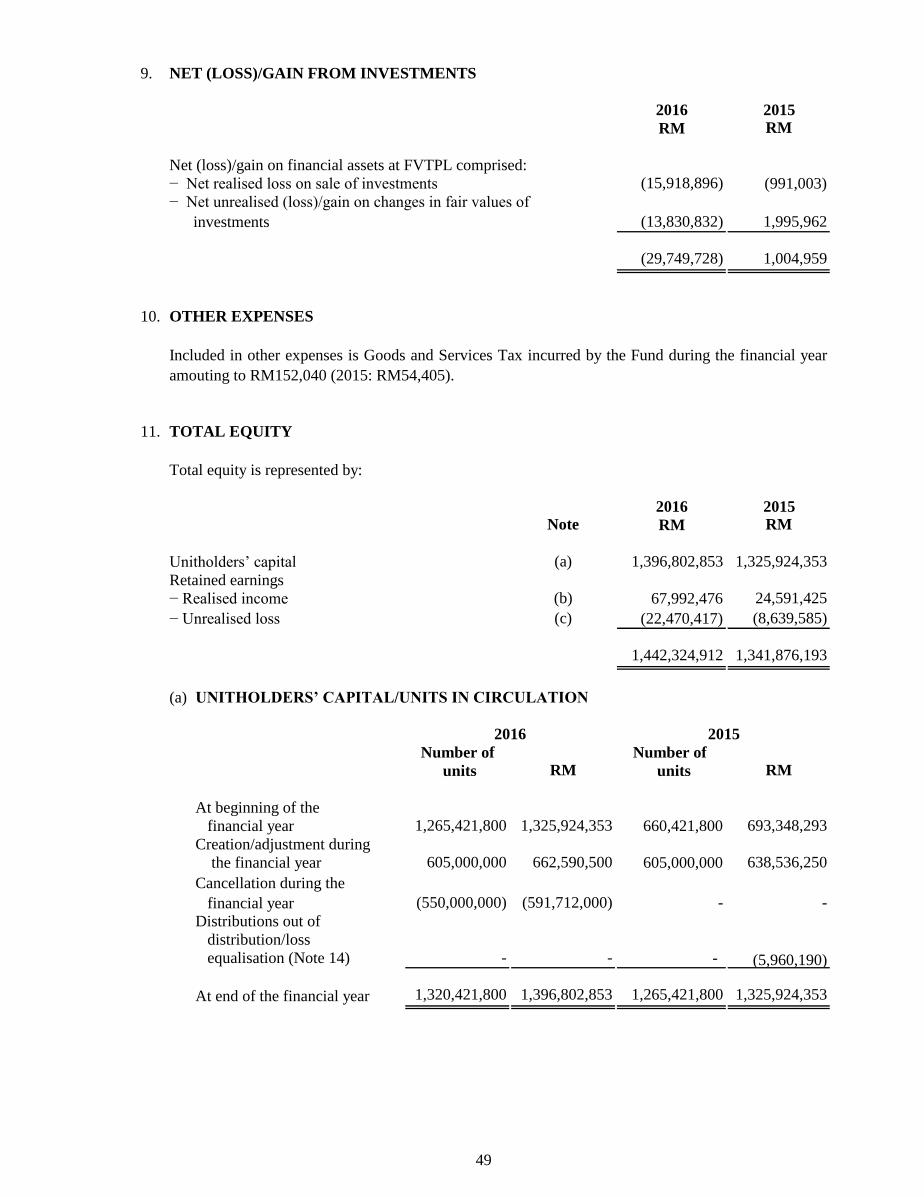
9. NET (LOSS)/GAIN FROM INVESTMENTS
2016 2015
RM RM
Net (loss)/gain on financial assets at FVTPL comprised:
− Net realised loss on sale of investments (15,918,896) (991,003)
− Net unrealised (loss)/gain on changes in fair values of
investments (13,830,832) 1,995,962
(29,749,728) 1,004,959
10. OTHER EXPENSES
11. TOTAL EQUITY
Total equity is represented by:
2016 2015Note RM RM
Unitholders’ capital (a) 1,396,802,853 1,325,924,353
Retained earnings
− Realised income (b) 67,992,476 24,591,425
− Unrealised loss (c) (22,470,417) (8,639,585)
1,442,324,912 1,341,876,193
(a) UNITHOLDERS’ CAPITAL/UNITS IN CIRCULATION
2015
Number of Number of
units RM units RM
At beginning of the
financial year 1,265,421,800 1,325,924,353 660,421,800 693,348,293
Creation/adjustment during
the financial year 605,000,000 662,590,500 605,000,000 638,536,250
Cancellation during the
financial year (550,000,000) (591,712,000) - -
Distributions out of
distribution/loss
equalisation (Note 14) - - - (5,960,190)
At end of the financial year 1,320,421,800 1,396,802,853 1,265,421,800 1,325,924,353
Included in other expenses is Goods and Services Tax incurred by the Fund during the financial year
amouting to RM152,040 (2015: RM54,405).
2016
49
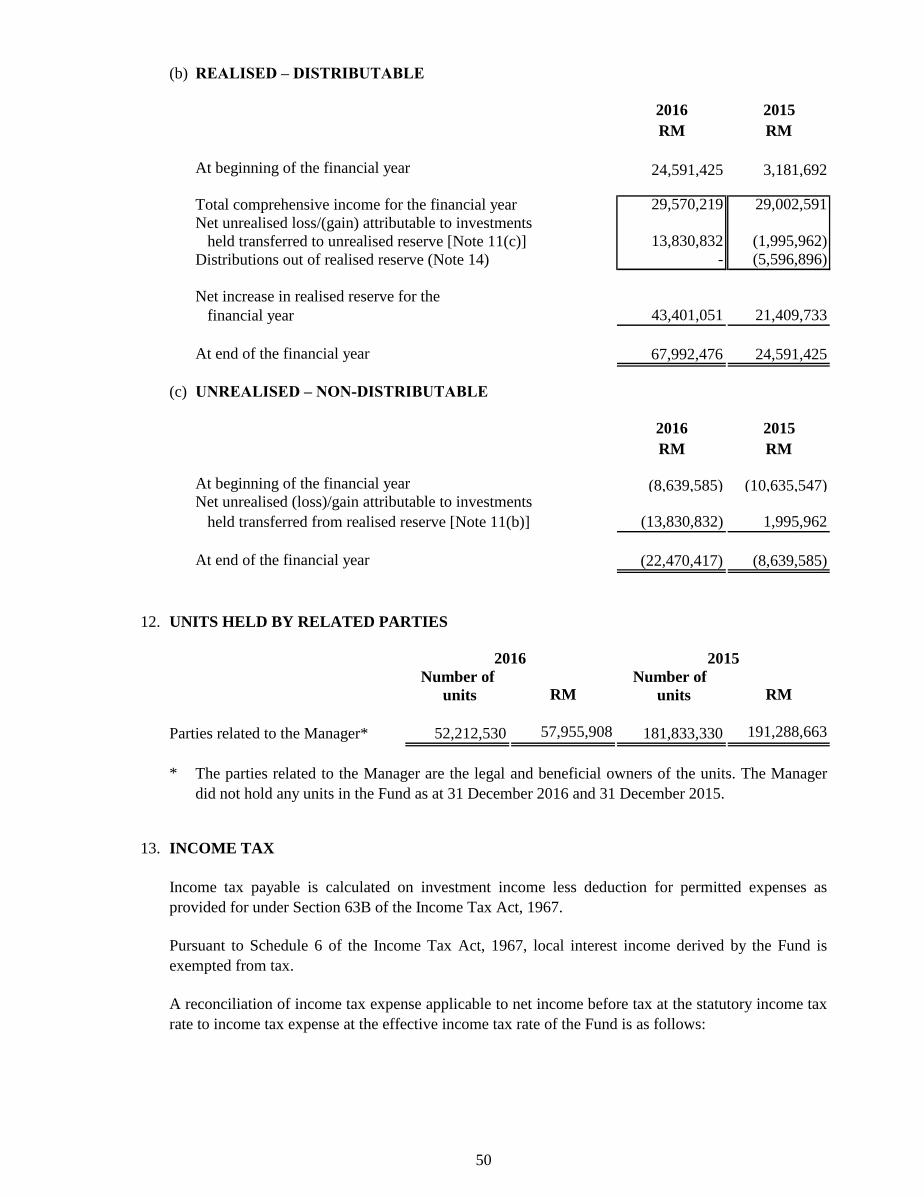
(b) REALISED – DISTRIBUTABLE
2016 2015
RM RM
At beginning of the financial year 24,591,425 3,181,692
Total comprehensive income for the financial year 29,570,219 29,002,591
Net unrealised loss/(gain) attributable to investments
held transferred to unrealised reserve [Note 11(c)] 13,830,832 (1,995,962)
Distributions out of realised reserve (Note 14) - (5,596,896)
Net increase in realised reserve for the
financial year 43,401,051 21,409,733
At end of the financial year 67,992,476 24,591,425
(c) UNREALISED – NON-DISTRIBUTABLE
2016 2015
RM RM
At beginning of the financial year (8,639,585) (10,635,547)Net unrealised (loss)/gain attributable to investments
held transferred from realised reserve [Note 11(b)] (13,830,832) 1,995,962
At end of the financial year (22,470,417) (8,639,585)
12. UNITS HELD BY RELATED PARTIES
Number of Number of
units RM units RM
Parties related to the Manager* 52,212,530 57,955,908 181,833,330 191,288,663
*
13. INCOME TAX
The parties related to the Manager are the legal and beneficial owners of the units. The Manager
did not hold any units in the Fund as at 31 December 2016 and 31 December 2015.
Pursuant to Schedule 6 of the Income Tax Act, 1967, local interest income derived by the Fund is
exempted from tax.
A reconciliation of income tax expense applicable to net income before tax at the statutory income tax
rate to income tax expense at the effective income tax rate of the Fund is as follows:
Income tax payable is calculated on investment income less deduction for permitted expenses as
provided for under Section 63B of the Income Tax Act, 1967.
2016 2015
50
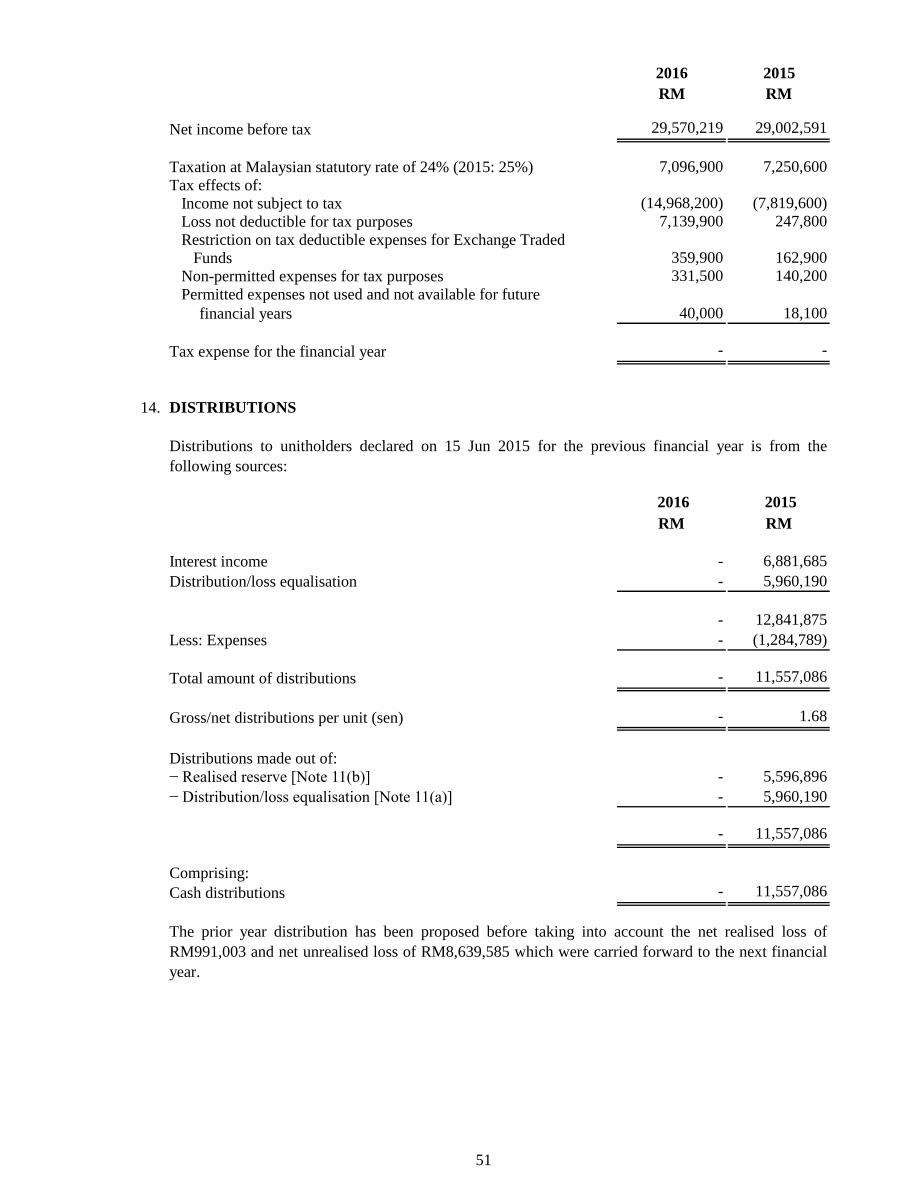
2016 2015
RM RM
Net income before tax 29,570,219 29,002,591
Taxation at Malaysian statutory rate of 24% (2015: 25%) 7,096,900 7,250,600
Tax effects of:
Income not subject to tax (14,968,200) (7,819,600)
Loss not deductible for tax purposes 7,139,900 247,800
Restriction on tax deductible expenses for Exchange Traded
Funds 359,900 162,900
Non-permitted expenses for tax purposes 331,500 140,200
Permitted expenses not used and not available for future
40,000 18,100
Tax expense for the financial year - -
14. DISTRIBUTIONS
2016 2015
RM RM
Interest income - 6,881,685
Distribution/loss equalisation - 5,960,190
- 12,841,875
Less: Expenses - (1,284,789)
Total amount of distributions - 11,557,086
Gross/net distributions per unit (sen) - 1.68
Distributions made out of:
− Realised reserve [Note 11(b)] - 5,596,896
− Distribution/loss equalisation [Note 11(a)] - 5,960,190
- 11,557,086
Comprising:
Cash distributions - 11,557,086
The prior year distribution has been proposed before taking into account the net realised loss of
RM991,003 and net unrealised loss of RM8,639,585 which were carried forward to the next financial
year.
Distributions to unitholders declared on 15 Jun 2015 for the previous financial year is from the
following sources:
financial years
51
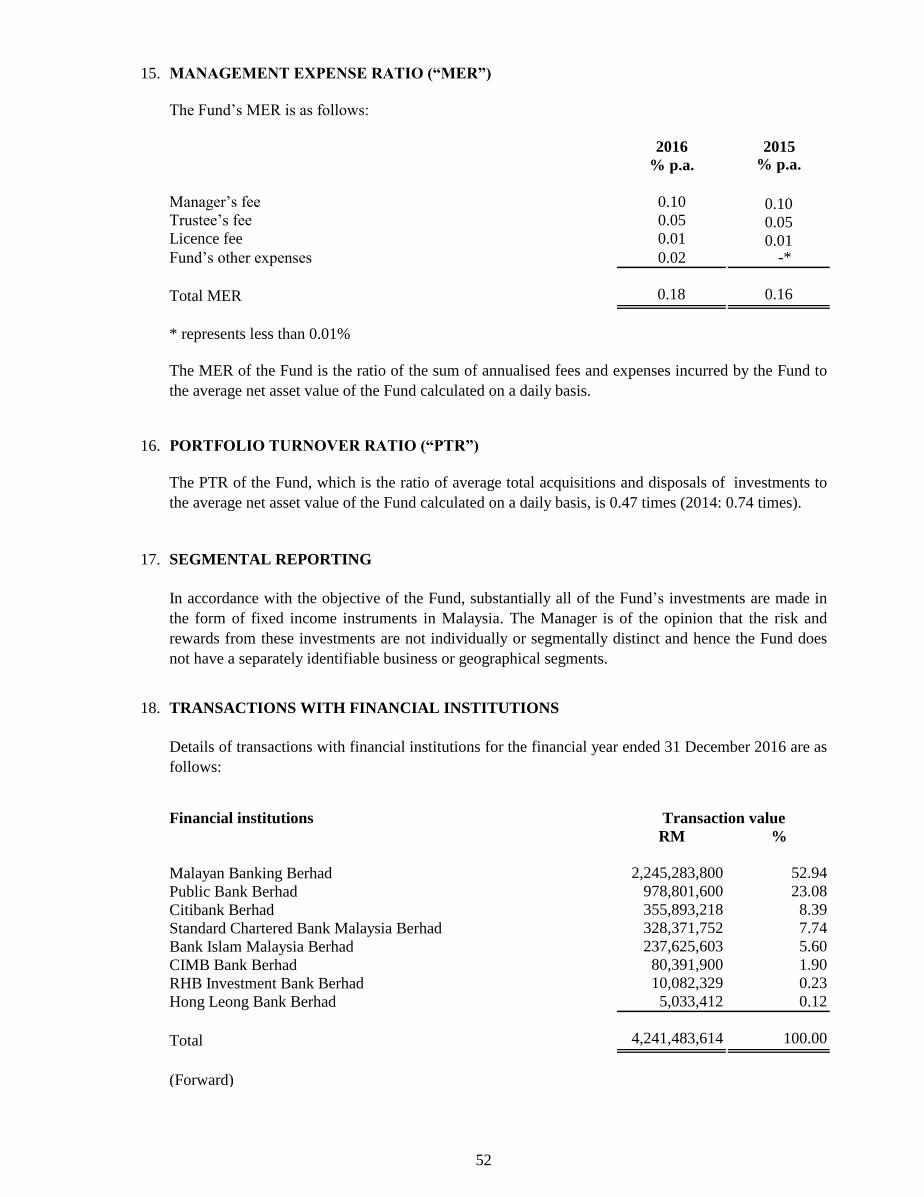
15. MANAGEMENT EXPENSE RATIO (“MER”)
2016 2015
% p.a. % p.a.
Manager’s fee 0.10 0.10Trustee’s fee 0.05 0.05Licence fee 0.01 0.01Fund’s other expenses 0.02 -*
Total MER 0.18 0.16
* represents less than 0.01%
16. PORTFOLIO TURNOVER RATIO (“PTR”)
17. SEGMENTAL REPORTING
18. TRANSACTIONS WITH FINANCIAL INSTITUTIONS
Financial institutions Transaction value
RM %
Malayan Banking Berhad 2,245,283,800 52.94
Public Bank Berhad 978,801,600 23.08
Citibank Berhad 355,893,218 8.39
Standard Chartered Bank Malaysia Berhad 328,371,752 7.74
Bank Islam Malaysia Berhad 237,625,603 5.60
CIMB Bank Berhad 80,391,900 1.90
RHB Investment Bank Berhad 10,082,329 0.23
Hong Leong Bank Berhad 5,033,412 0.12
Total 4,241,483,614 100.00
(Forward)
The MER of the Fund is the ratio of the sum of annualised fees and expenses incurred by the Fund to
the average net asset value of the Fund calculated on a daily basis.
In accordance with the objective of the Fund, substantially all of the Fund’s investments are made in
the form of fixed income instruments in Malaysia. The Manager is of the opinion that the risk and
rewards from these investments are not individually or segmentally distinct and hence the Fund does
not have a separately identifiable business or geographical segments.
The PTR of the Fund, which is the ratio of average total acquisitions and disposals of investments to
the average net asset value of the Fund calculated on a daily basis, is 0.47 times (2014: 0.74 times).
The Fund’s MER is as follows:
Details of transactions with financial institutions for the financial year ended 31 December 2016 are as
follows:
52
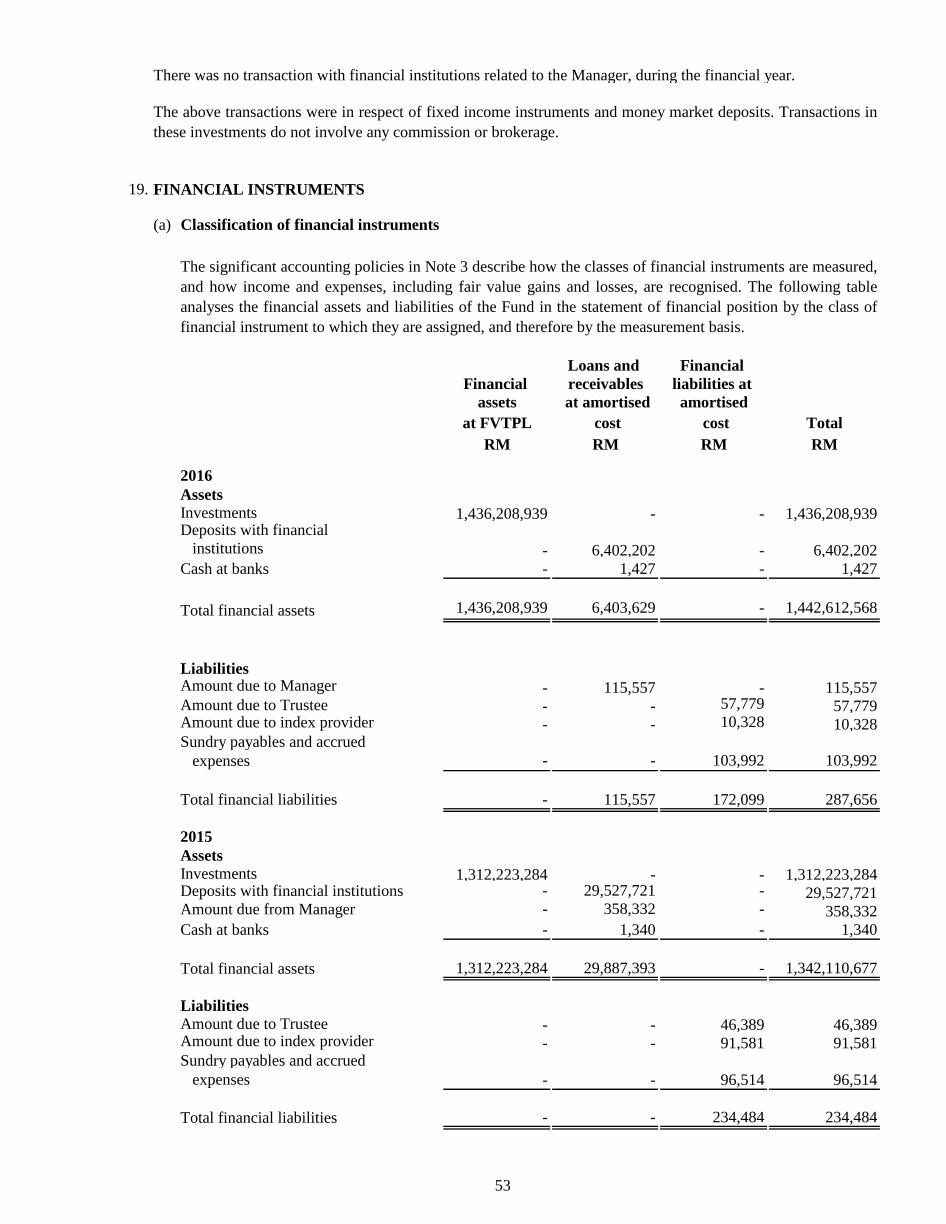
19. FINANCIAL INSTRUMENTS
(a) Classification of financial instruments
Loans and Financial
Financial receivables liabilities at
assets at amortised amortised
at FVTPL cost cost Total
RM RM RM RM
Assets
Investments 1,436,208,939 - - 1,436,208,939 Deposits with financial
institutions - 6,402,202 - 6,402,202
Cash at banks - 1,427 - 1,427
Total financial assets 1,436,208,939 6,403,629 - 1,442,612,568
LiabilitiesAmount due to Manager - 115,557 - 115,557 Amount due to Trustee - - 57,779 57,779 Amount due to index provider - - 10,328 10,328 Sundry payables and accrued
expenses - - 103,992 103,992
Total financial liabilities - 115,557 172,099 287,656
Assets
Investments 1,312,223,284 - - 1,312,223,284Deposits with financial institutions - 29,527,721 - 29,527,721Amount due from Manager - 358,332 - 358,332
Cash at banks - 1,340 - 1,340
Total financial assets 1,312,223,284 29,887,393 - 1,342,110,677
Liabilities
Amount due to Trustee - - 46,389 46,389 Amount due to index provider - - 91,581 91,581 Sundry payables and accrued
expenses - - 96,514 96,514
Total financial liabilities - - 234,484 234,484
The significant accounting policies in Note 3 describe how the classes of financial instruments are measured,
and how income and expenses, including fair value gains and losses, are recognised. The following table
analyses the financial assets and liabilities of the Fund in the statement of financial position by the class of
financial instrument to which they are assigned, and therefore by the measurement basis.
2015
The above transactions were in respect of fixed income instruments and money market deposits. Transactions in
these investments do not involve any commission or brokerage.
2016
There was no transaction with financial institutions related to the Manager, during the financial year.
53
Income, expense, gains
and losses
2016 2015
RM RM
Net (loss)/gain from financial assets at FVTPL (29,749,728) 1,004,959Income, of which derived from:
– Interest income from financial assets at FVTPL 61,914,984 28,762,187
- Interest income from loans and receivables 452,702 520,234
(b) Financial instruments that are carried at fair value
Level 1: quoted (unadjusted) prices in active markets for identical assets or liabilities;
Level 2:
Level 3:
Level 1 Level 2 Level 3 Total
RM RM RM RM
- 1,436,208,939 - 1,436,208,939
- 1,312,223,284 - 1,312,223,284
(c)
Deposits with financial institutions
Amount due from/(to) Manager
Cash at banks
Amount due to Trustee
Amount due to index provider
Sundry payables and accrued expenses
There are no financial instruments which are not carried at fair values and whose carrying amounts are not
reasonable approximation of their respective fair values.
Financial assets at FVTPL
other techniques for which all inputs which have a significant effect on the recorded fair values
are observable; either directly or indirectly; or
The Fund’s financial assets and liabilities at FVTPL are carried at fair value.
The following table shows an analysis of financial instruments recorded at fair value by the level of the fair
value hierarchy:
Financial instruments that are not carried at fair value and whose carrying amounts are reasonable
approximation of fair value
Financial assets at FVTPL
2015
The following are classes of financial instruments that are not carried at fair value and whose carrying
amounts are reasonable approximation of fair value due to their short period to maturity or short credit
period:
The Fund uses the following hierarchy for determining and disclosing the fair value of financial instruments
by valuation technique:
techniques which use inputs which have a significant effect on the recorded fair value that are
not based on observable market data.
2016
54
20. RISK MANAGEMENT POLICIES
Market risk
(i) Interest rate risk
Parallel shift in yieldcurve by: 2016 2015
RM RM
+100 bps (77,627,715) (66,321,821) -100 bps 85,643,095 72,176,902
Credit risk
(i) Credit quality of financial assets
As a % of As a % of
debt net asset
Credit rating RM securities value
2016
NR* 1,436,208,939 100.00 99.58
(Forward)
The Fund is exposed to a variety of risks that include market risk, credit risk, liquidity risk, single issuer risk,
regulatory risk, management risk and non-compliance risk.
Sensitivity of the Fund’s NAV, or theoretical value
The result below summarised the interest rates sensitivity of the Fund’s NAV due to the parallel movement
assumption of the yield curve by +100bps and -100bps respectively:
The following table analyses the Fund’s portfolio of debt securities by rating category as at 31 December
2016 and 31 December 2015:
Risk management is carried out by closely monitoring, measuring and mitigating the above said risks, careful
selection of investments coupled with stringent compliance to investment restrictions as stipulated by the Capital
Market and Services Act 2007, Securities Commission’s Guidelines on Exchange Traded Funds and the Deed as
the backbone of risk management of the Fund.
Credit risk is the risk that the counterparty to a financial instrument will cause a financial loss to the Fund by
failing to discharge an obligation. The Fund invests in fixed income instruments. As such the Fund would be
exposed to the risk of bond issuers and financial institutions defaulting on its repayment obligations which in
turn would affect the net asset value of the Fund.
Market risk is the risk that the value of a portfolio would decrease due to changes in market risk factors such as
equity prices, interest rates (yield curve), foreign exchange rates and commodity prices.
Interest rates risk will affect the value of the Fund’s investments, given the interest rates movements, which
are influenced by regional and local economic developments as well as political developments.
Domestic interest rates on deposits and placements with licensed financial institutions are determined based
on prevailing market rates.
55
As a % of As a % of
debt net asset
RM securities value
2015
AAA 10,175,375 0.78 0.76
NR* 1,302,047,909 99.22 97.03
1,312,223,284 100.00 97.79
* Non-rated
As a % of
As a % of net asset
Credit rating RM deposits value
2016
P1/MARC-1 6,402,202 100.00 0.44
2015
P1/MARC-1 29,527,721 100.00 2.20
(ii) Credit risk concentration
As a % of As a % of
debt net asset
Sector RM securities value
2016
Public Finance 1,410,866,033 98.24 97.82
Transportation 25,342,906 1.76 1.76
1,436,208,939 100.00 99.58
As a % of As a % of
debt net asset
Sector RM securities value
2015
Financial services 10,175,375 0.78 0.76
Public Finance 1,302,047,909 99.22 97.03
1,312,223,284 100.00 97.79
Concentration of risk is monitored and managed based on sectorial distribution. The table below analyses the
Fund’s portfolio of debt securities by sectorial distribution as at 31 December 2016 and 31 December 2015:
There is no geographical risk as the Fund invests only in investments in Malaysia.
For deposits with financial institutions, the Fund only makes placements with financial institutions with
sound rating. The following table presents the Fund’s portfolio of deposits by rating category as at 31
December 2016 and 31 December 2015:
Cash at banks are held for liquidity purposes and are not exposed to significant credit risk.
56
Liquidity risk
Objectives and assumptions
(i) For bonds
(a)
(b) For coupon-bearing bonds, the coupons could be paid on annual, bi-annual or quarterly basis.
Cash received from bonds are calculated as follows:
$ = cash received
R = coupon rate p.a.
F = coupon frequency
For zero coupon bonds, F = 0
At maturity: $ = Nominal
For F > 0
Before maturity: coupon payment, $ = Nominal * (R/F)
At maturity: maturity payment, $ = Nominal + (Nominal * R/F)
(ii) For money market instruments and deposits
The nominal amount and interest will be paid at maturity date. Cash received are calculated as follows:
$ = cash received
R = interest/profit rate p.a.
F = time to maturity (days)
At maturity: $ = Nominal + (Nominal*R*d/365)
0 – 1 1 – 2 2 – 3 3 – 4 4 – 5 More than
year years years years years 5 years
2016
Investments 160,041,800 256,885,240 318,734,090 190,746,740 911,154,325
Deposits
with financial
institutions - - - - -
Total assets 63,706,866 160,041,800 256,885,240 318,734,090 190,746,740 911,154,325
(Forward)
6,404,306
The following table presents the undiscounted contractual cash flows from different asset and liability classes in
the Fund:
Liquidity risk is defined as the risk of being unable to raise funds or borrowing to meet payment obligations as
they fall due. The Fund maintains sufficient level of liquid assets, after consultation with the Trustee, to meet
anticipated payments and cancellations of units by unitholders. Liquid assets comprise of deposits with licensed
financial institutions and other instruments, which are capable of being converted into cash within 5 to 7 days.
The Fund’s policy is to always maintain a prudent level of liquid assets so as to reduce liquidity risk.
For each security in the Fund, the cash flows are projected according to its asset class. Each asset class, if
any, follows the calculation method as below:
For zero-coupon bonds, the nominal amount will be returned at maturity date.
Contractual cash flows (undiscounted)
Financial assets
57,302,560
57
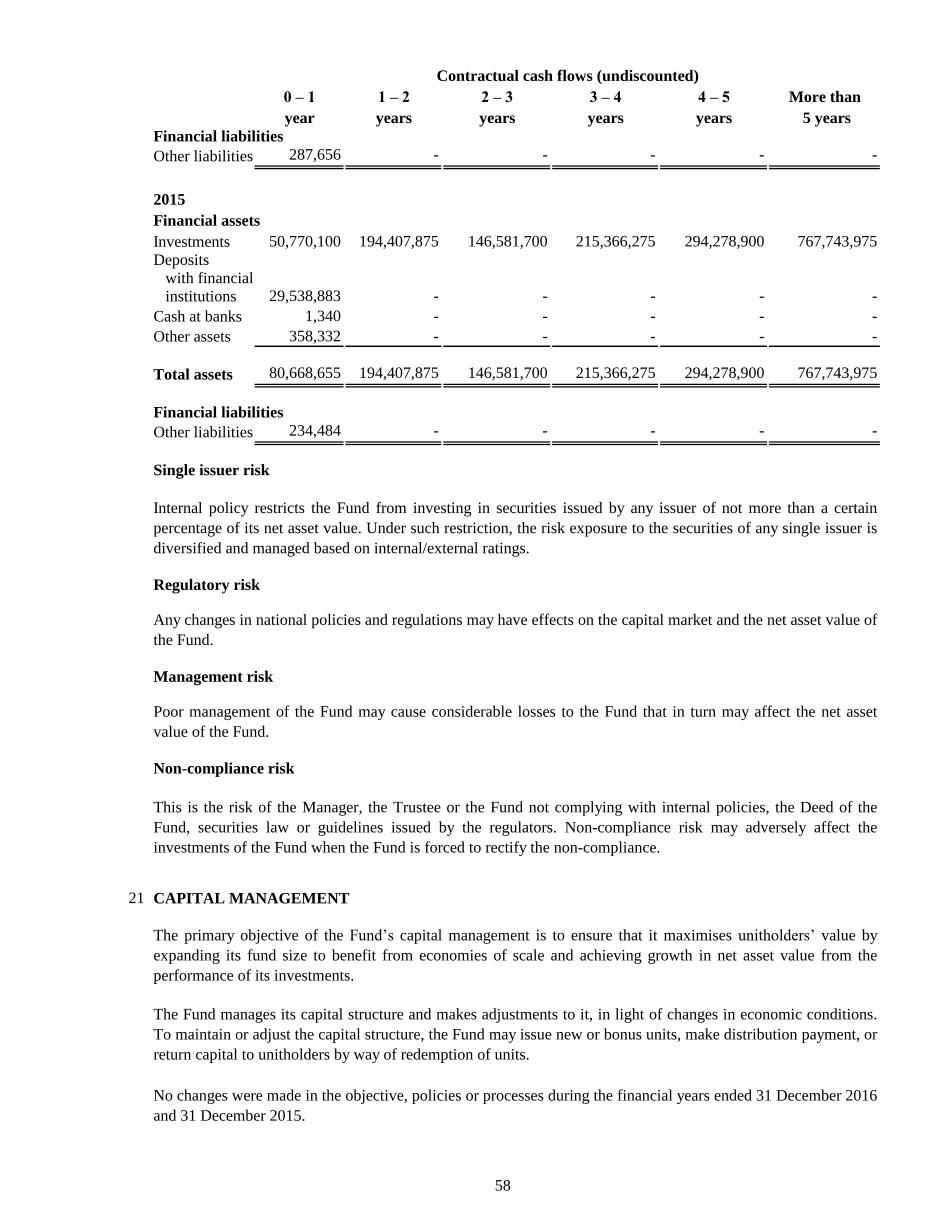
0 – 1 1 – 2 2 – 3 3 – 4 4 – 5 More than
year years years years years 5 years
Financial liabilities
Other liabilities 287,656 - - - - -
2015
Investments 50,770,100 194,407,875 146,581,700 215,366,275 294,278,900 767,743,975
Deposits
with financial
institutions 29,538,883 - - - - -
Cash at banks 1,340 - - - - -
Other assets 358,332 - - - - -
Total assets 80,668,655 194,407,875 146,581,700 215,366,275 294,278,900 767,743,975
Financial liabilities
Other liabilities 234,484 - - - - -
Single issuer risk
Regulatory risk
Management risk
Non-compliance risk
21 CAPITAL MANAGEMENT
No changes were made in the objective, policies or processes during the financial years ended 31 December 2016
and 31 December 2015.
Internal policy restricts the Fund from investing in securities issued by any issuer of not more than a certain
percentage of its net asset value. Under such restriction, the risk exposure to the securities of any single issuer is
diversified and managed based on internal/external ratings.
Any changes in national policies and regulations may have effects on the capital market and the net asset value of
the Fund.
Poor management of the Fund may cause considerable losses to the Fund that in turn may affect the net asset
value of the Fund.
This is the risk of the Manager, the Trustee or the Fund not complying with internal policies, the Deed of the
Fund, securities law or guidelines issued by the regulators. Non-compliance risk may adversely affect the
investments of the Fund when the Fund is forced to rectify the non-compliance.
The primary objective of the Fund’s capital management is to ensure that it maximises unitholders’ value by
expanding its fund size to benefit from economies of scale and achieving growth in net asset value from the
performance of its investments.
The Fund manages its capital structure and makes adjustments to it, in light of changes in economic conditions.
To maintain or adjust the capital structure, the Fund may issue new or bonus units, make distribution payment, or
return capital to unitholders by way of redemption of units.
Financial assets
Contractual cash flows (undiscounted)
58
ABF Malaysia Bond Index Fund
STATEMENT BY THE MANAGER
Kuala Lumpur, Malaysia
14 February 2017
I, DATIN MAZNAH MAHBOB, for and on behalf of the Manager, AmFunds Management
Berhad for ABF Malaysia Bond Index Fund do hereby state that in the opinion of the Manager,
the accompanying statement of financial position, statement of comprehensive income, statement of
changes in equity, statement of cash flows and the accompanying notes are drawn up in accordance
with Malaysian Financial Reporting Standards and International Financial Reporting Standards so
as to give a true and fair view of the financial position of the Fund as at 31 December 2016 and the
comprehensive income, the changes in equity and cash flows of the Fund for the financial year then
ended.
DATIN MAZNAH MAHBOB
For and on behalf of the Manager
AmFunds Management Berhad
59
60
02 February 2017
61
DIRECTORY
Head Office 9th Floor, Bangunan Ambank Group
55, Jalan Raja Chulan, 50200 Kuala Lumpur
Tel: (03) 2032 2888 Facsimile: (03) 2031 5210
Email: [email protected]
Postal Address AmFunds Management Berhad
P.O Box 13611, 50816 Kuala Lumpur
Related Institutional Unit Trust Agent
AmBank (M) Berhad Head Office
Company No. 8515-D 31st Floor, Menara AmBank
No. 8 Jalan Yap Kwan Seng, 50450 Kuala Lumpur
AmInvestment Bank Berhad Head Office
Company No. 23742-V 22nd
Floor, Bangunan AmBank Group
55 Jalan Raja Chulan, 50200 Kuala Lumpur
For more details on the list of IUTAs, please contact the Manager.
For enquiries about this or any of the other Funds offered by AmFunds Management Berhad
Please call 2032 2888 between 8.45 a.m. to 5.45 a.m. (Monday to Thursday),
Friday (8.45 a.m. to 5.00 p.m.)

Semi-Annual Report28 February 2015
03 2132 2888 | aminvest.com | [email protected]
AmFunds Management Berhad (155432-A)