a rapid and non-destructive technique in determining the ... · § m = difference between maximum...
TRANSCRIPT
Jurnal Kejuruteraan 30(1) 2018: 93-101https://doi.org/10.17576/jkukm-2018-30(1)
A Rapid and Non-Destructive Technique in Determining The Ripeness of Oil Palm Fresh Fruit Bunch (FFB)
(Teknik Cepat dan Tidak Merosakkan dalam Menentukan Kematangan Tandan Buah Sawit Segar (FBB))
Zuhaira Mohd Zulkifli, Fazida Hanim Hashim, Thinal Raj, Aqilah Baseri Huddin Faculty of Engineering & Built Environment, Universiti Kebangsaan Malaysia, Malaysia
ABSTRACT
Oil palm industry is one of the main industries in Malaysia that contributes to the country’s gross domestic product (GDP). In the oil palm industrial sector, methods of planting, detection and assessment are very important to produce high quality palm oil. Currently, the ripeness of oil palm fresh fruit bunch (FFB) is estimated using eyesight (most common), computer vision, hyperspectral imaging, light detection and ranging (LiDAR), near infrared (NIR) spectroscopy, and magnetic resonance imaging. The objective of this research is to introduce a rapid and non-destructive technique in determining and assessing the ripeness of oil palm fresh fruit bunch (FFB) by using a LiDAR scanning system. The LiDAR scanning system is used to scan three types of oil palm fruits at different level of ripeness which is under ripe, ripe, and over ripe. The reflectance intensity that bounces off the fruits are gathered and analysed to determine the different level or ripeness. Even though the intensity value is purely relative, it is proportional to the reflectance or absorption rate from the LiDAR sensor. A rapid method to determine the ripeness of palm fruits using a LiDAR sensor was proposed by calculating the reflectance percentage from 0% to 100% using the concept of linearity.
Keywords: Oil palm fresh fruit bunch (FFB); ripeness determination; LiDAR sensor; intensity value
ABSTRAK
Industri kelapa sawit adalah salah satu industri utama di Malaysia yang menyumbang kepada keluaran dalam negara kasar (KDNK). Namun, dalam sektor industri kelapa sawit, cara penanaman, penjagaan dan penilaian amatlah penting untuk menghasilkan minyak sawit yang berkualiti. Sehingga kini, tahap kematangan buah sawit boleh ditentukan dengan menggunakan visual komputer, pengimejan hyperspektral, pengesanan dan pengukuran jarak berasaskan cahaya (LiDAR), spektroskopi NIR, dan pengimejan resonans magnet dan cara paling biasa digunakan dengan menggunakan mata kasar manusia sendiri. Kajian ini bertujuan untuk memperkenalkan satu teknik cepat dan tanpa musnah dalam menentukan dan menilai tahap kematangan buah tandan sawit segar dengan menggunakan sistem penderia LiDAR. Kajian ini menggunakan sistem penderia LiDAR untuk mengimbas tiga jenis tandan buah sawit segar pada tahap kematangan yang berbeza iaitu tidak masak, masak, dan tua. Nilai keamatan daripada buah sawit yang diimbas dikumpulkan dan dianalisa untuk menentukan tahap kematangan. Walaupun nilai keamatan ini adalah relatif, namun ia adalah berkadar langsung dengan nilai pantulan ataupun penyerapan daripada penderia LiDAR yang digunakan. Satu kaedah untuk menentukan tahap kematangan buah sawit yang diimbas adalah dengan mengira nilai peratusan pantulan 0% hingga 100% daripada nilai keamatan yang diperolehi dengan menggunakan kaedah persamaan linear.
Kata kunci: Tandan buah sawit segar; pengesanan kematangan; penderia LiDAR; nilai keamatan
INTRODUCTION
The oil palm industry is one of the main industries in Malaysia that contributes to the country’s gross domestic product (GDP). Planting of oil palm in Malaysia in the beginning has been introduced by the government to eradicate poverty. In the era 1960s, the Federal Land Development of Authority (FELDA) have been exploring areas to turn into oil palm fields (Nasir, 2015).The oil palm research gives emphasis in finding a new method in the technology of planting, earnings and production of quality products based on palm oil. As the largest exporters of palm oil in the world, Malaysia certainly
has its own technology and formula to produce quality palm oil. Normally, research studies focus on ways of planting, harvesting, and palm oil care. In addition, there are also studies on palm oil for medicinal purposes (Sharif Faez et al., 2015). However, for the production of oil for medical purpose, the oil palm fruit must be carefully selected. Therefore, with these studies, researchers are focusing on ways to determine the selection of the best fruit to produce high quality products. Nowadays, there is still no efficient and effective method to determine the maturity of oil palm fruit. Among the studies conducted to determine and assess the level of maturity of oil palm fruits are using computer vision (Makky et al.,
JK Bab 12.indd 93 5/28/2018 12:20:45 PM
94
2014), hyperspectral imaging (Junkwon et al. 2009; Alfatni et al. 2014), near-infrared (NIR) spectroscopy (Silalahi et al. 2016), fluorescence sensing (Hafiz et al. 2011, 2012), laser imaging (Shiddiq et al. 2017), capacitive sensing( Aziz et al. 2012), inductive sensing by (Harun et al. 2013, 2014; Misron et al. 2014). The imagery technique using computer vision relies on the fruit colours, which may have some constraints especially if the visual is taken during different times of the day and under different intensities light. On the other hand, white light or NIR spectroscopy instrumets are huge and heavy thus only suitable for close range detection in oil palm mills. Besides that, capacite and inductive sensing is not suitable for in situ assement since it requires the whole bunch to be placed in the instrument. Therefore, up to this day, farmers are still relying on eyesight to determine fruit ripeness. Among the most common technique is by observing color and quantity fallen ripe palm fruitlets under the tree. The standard for classifying the ripness has been extghablished by Thailand department of agriculture (Junkwon et al. 2009), Indonesian oil palm research institute (IOPRI 1997) and Malaysian palm oil board (MPOB 2003). The standrads states that, if there are more than 10 palm fruitlets under a tree, it indicates that the bunch is ready to be harvested.
Light detection and ranging (LiDAR) is non destructive sensing used in myriad of applications such as remote sensing (Burton et al. 2011; Boudreault et al. 2015), precision agriculture (Zhu et al. 2011; Fieber et al. 2013), autonomus driving (Choi et al. 2013) and archeology (Golden et al. 2016). However, the usage of LiDAR in oil palm industry for the purpose of fruit ripeness detection can be considered as a new teachnique that deserves much attention. A LiDAR sensor can observe far-ranged objects (as far as 100 meters depending on the sensor) and is not dependable on external light, for example, the sun. This makes the LiDAR sensor a promising solution as compared to other techniques in determining oil palm ripeness. The main scope of this study is test and verify that the intensity values from LiDAR sensors can distinguish the level of maturity of fresh palm fruit bunches under review. The LiDAR sensor used in this study is LiDAR Lite v2 (Lewis R.A 2012) that produces a laser light with an NIR wavelength of 905 nm. In addition to the oil palm fresh fruit bunches that are tested in the laboratory, experiments were also conducted in an oil palm field during the day. However, this study does not distinguish the materials or fruits other than fruits and leaves in an oil palm plantation.
INTENSITY FROM LIDAR SENSOR
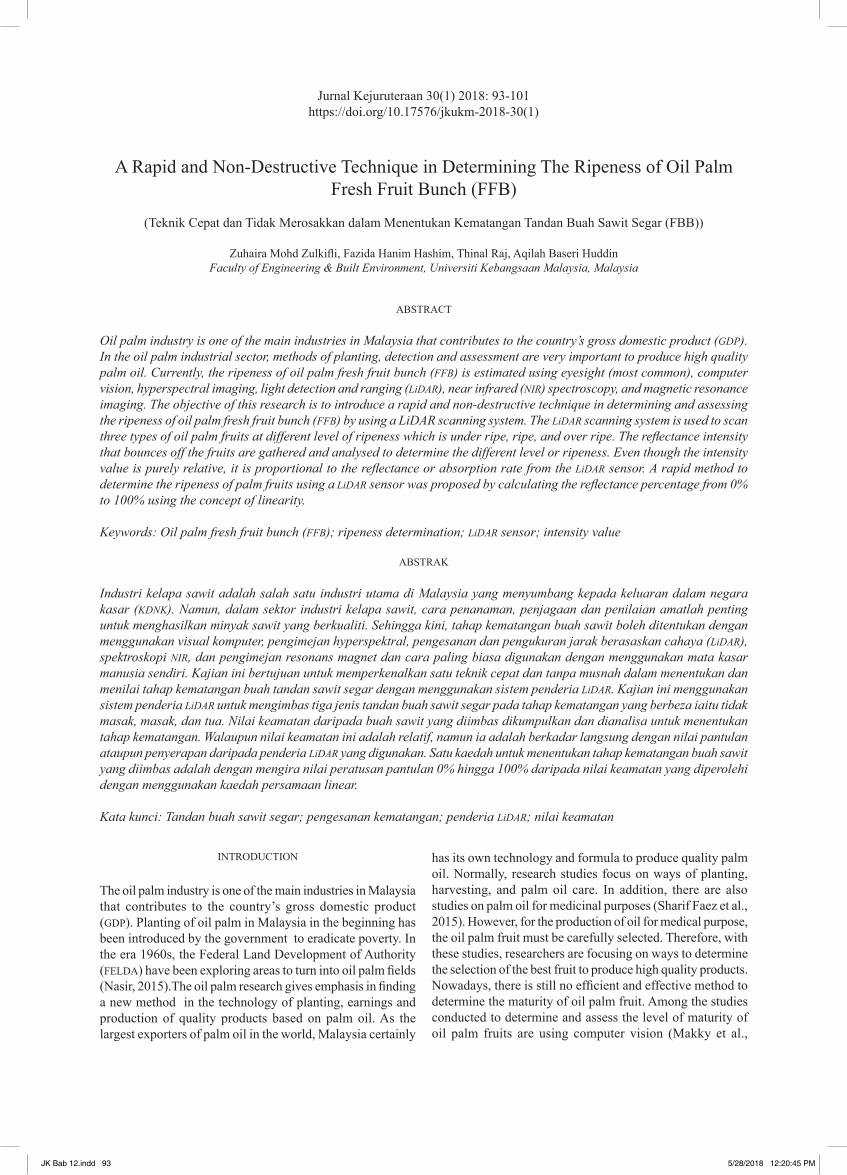
Figure 1 shows the LiDAR scanning system developed in this study. It consists of a LiDAR Lite V2 sensor, an Arduino UNO-based controller board, a Lithium ion battery pack, and an installed freeware called Processing to process the 3D point cloud information. MATLAB is later used to integrate the 3D point cloud data and the intensity data gathered from the LiDAR scanning system.
FIGURe 1. The LiDAR scanning system prototype
LIDAR LITE V2
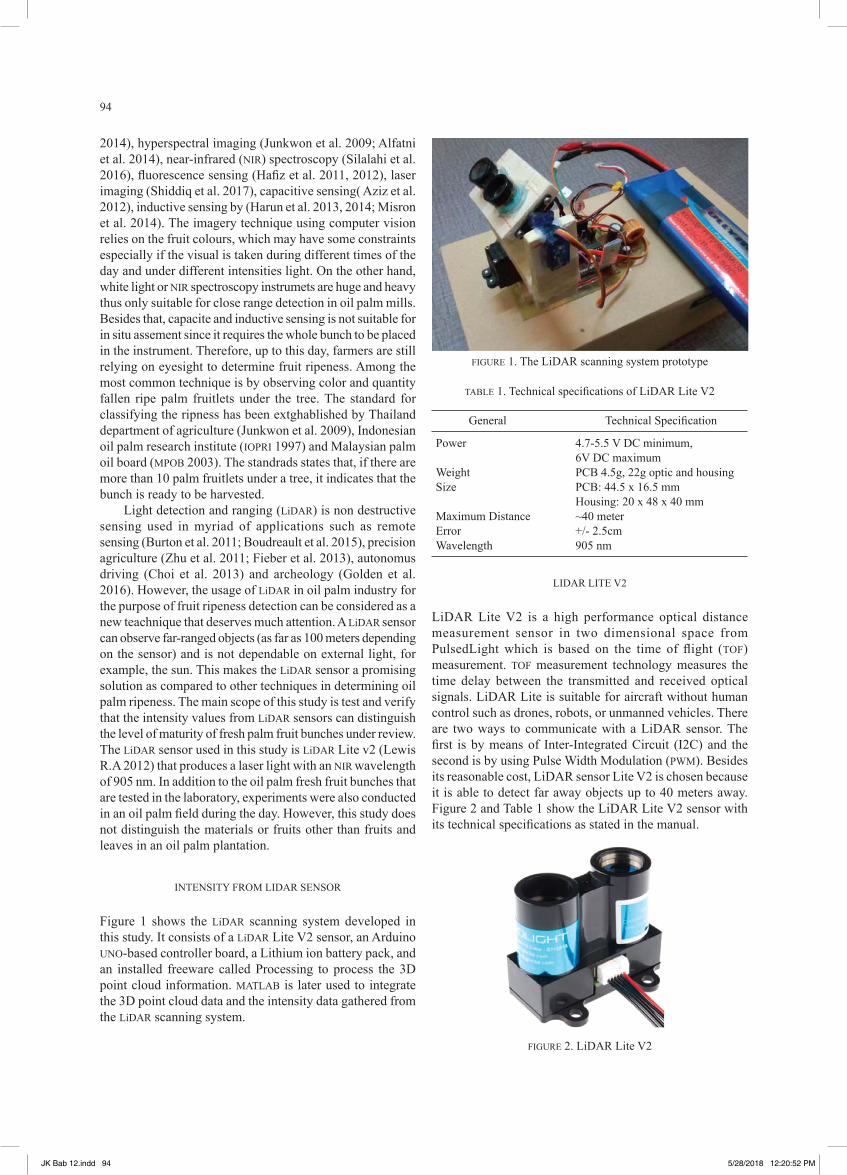
LiDAR Lite V2 is a high performance optical distance measurement sensor in two dimensional space from PulsedLight which is based on the time of flight (TOF) measurement. TOF measurement technology measures the time delay between the transmitted and received optical signals. LiDAR Lite is suitable for aircraft without human control such as drones, robots, or unmanned vehicles. There are two ways to communicate with a LiDAR sensor. The first is by means of Inter-Integrated Circuit (I2C) and the second is by using Pulse Width Modulation (PWM). Besides its reasonable cost, LiDAR sensor Lite V2 is chosen because it is able to detect far away objects up to 40 meters away. Figure 2 and Table 1 show the LiDAR Lite V2 sensor with its technical specifications as stated in the manual.
TABLE 1. Technical specifications of LiDAR Lite V2
General Technical Specification
Power 4.7-5.5 V DC minimum, 6V DC maximumWeight PCB 4.5g, 22g optic and housingSize PCB: 44.5 x 16.5 mm Housing: 20 x 48 x 40 mmMaximum Distance ~40 metererror +/- 2.5cmWavelength 905 nm
FIGURe 2. LiDAR Lite V2
JK Bab 12.indd 94 5/28/2018 12:20:52 PM
95
ARDUINO UNO
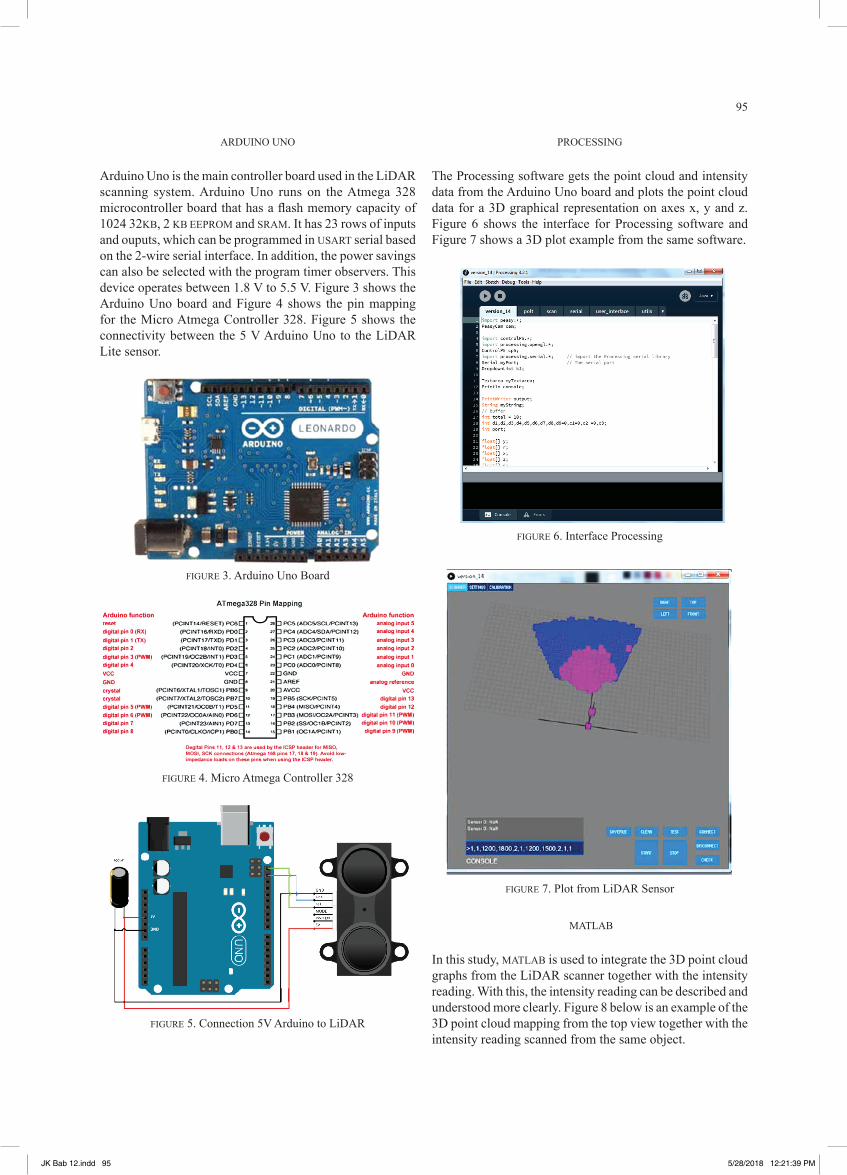
Arduino Uno is the main controller board used in the LiDAR scanning system. Arduino Uno runs on the Atmega 328 microcontroller board that has a flash memory capacity of 1024 32KB, 2 KB eePROM and SRAM. It has 23 rows of inputs and ouputs, which can be programmed in USART serial based on the 2-wire serial interface. In addition, the power savings can also be selected with the program timer observers. This device operates between 1.8 V to 5.5 V. Figure 3 shows the Arduino Uno board and Figure 4 shows the pin mapping for the Micro Atmega Controller 328. Figure 5 shows the connectivity between the 5 V Arduino Uno to the LiDAR Lite sensor.
PROCeSSING
The Processing software gets the point cloud and intensity data from the Arduino Uno board and plots the point cloud data for a 3D graphical representation on axes x, y and z. Figure 6 shows the interface for Processing software and Figure 7 shows a 3D plot example from the same software.
FIGURe 3. Arduino Uno Board
FIGURe 4. Micro Atmega Controller 328
FIGURe 5. Connection 5V Arduino to LiDAR
MATLAB
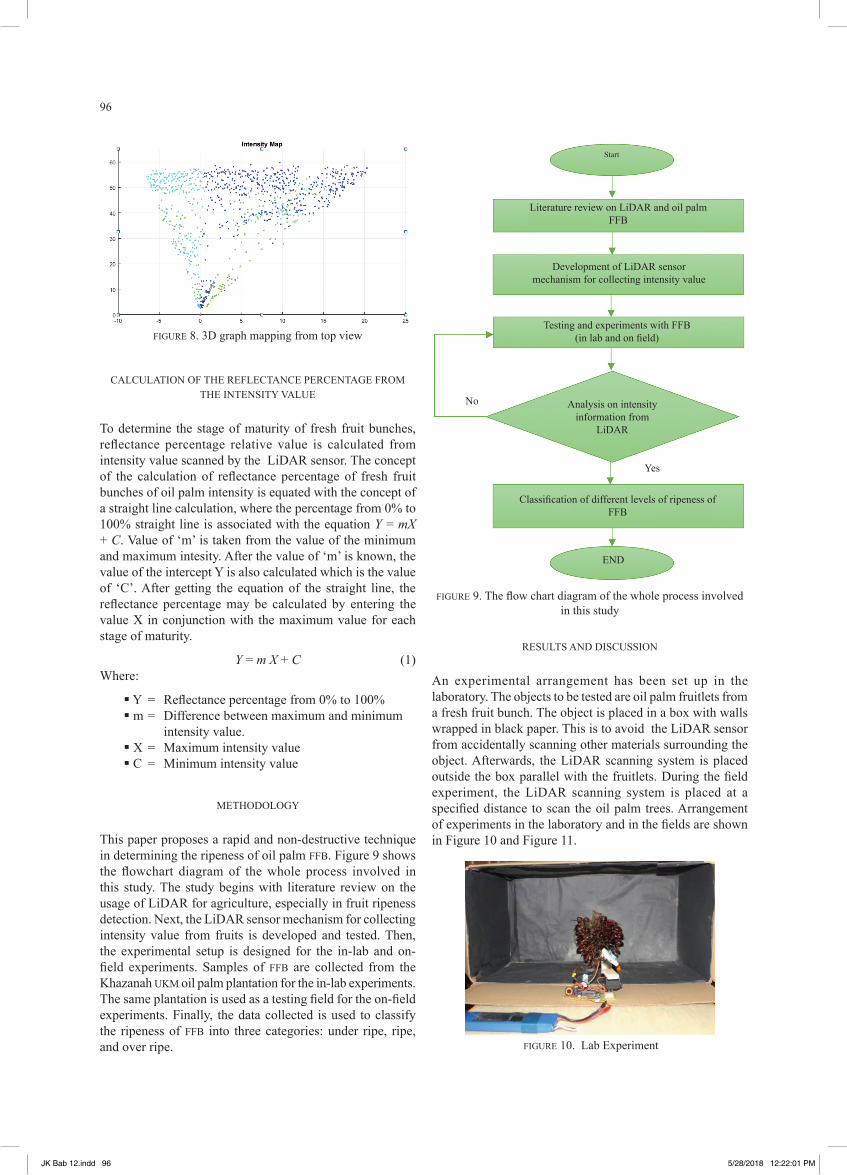
In this study, MATLAB is used to integrate the 3D point cloud graphs from the LiDAR scanner together with the intensity reading. With this, the intensity reading can be described and understood more clearly. Figure 8 below is an example of the 3D point cloud mapping from the top view together with the intensity reading scanned from the same object.
FIGURe 6. Interface Processing
FIGURe 7. Plot from LiDAR Sensor
JK Bab 12.indd 95 5/28/2018 12:21:39 PM
96
CALCULATION OF THE REFLECTANCE PERCENTAGE FROM THE INTENSITY VALUE
To determine the stage of maturity of fresh fruit bunches, reflectance percentage relative value is calculated from intensity value scanned by the LiDAR sensor. The concept of the calculation of reflectance percentage of fresh fruit bunches of oil palm intensity is equated with the concept of a straight line calculation, where the percentage from 0% to 100% straight line is associated with the equation Y = mX + C. Value of ‘m’ is taken from the value of the minimum and maximum intesity. After the value of ‘m’ is known, the value of the intercept Y is also calculated which is the value of ‘C’. After getting the equation of the straight line, the reflectance percentage may be calculated by entering the value X in conjunction with the maximum value for each stage of maturity.
Y = m X + C (1)Where:
§ Y = Reflectance percentage from 0% to 100% § m = Difference between maximum and minimum intensity value. § X = Maximum intensity value § C = Minimum intensity value
METHODOLOGY
This paper proposes a rapid and non-destructive technique in determining the ripeness of oil palm FFB. Figure 9 shows the flowchart diagram of the whole process involved in this study. The study begins with literature review on the usage of LiDAR for agriculture, especially in fruit ripeness detection. Next, the LiDAR sensor mechanism for collecting intensity value from fruits is developed and tested. Then, the experimental setup is designed for the in-lab and on-field experiments. Samples of FFB are collected from the Khazanah UKM oil palm plantation for the in-lab experiments. The same plantation is used as a testing field for the on-field experiments. Finally, the data collected is used to classify the ripeness of FFB into three categories: under ripe, ripe, and over ripe.
FIGURe 8. 3D graph mapping from top view
RESULTS AND DISCUSSION
An experimental arrangement has been set up in the laboratory. The objects to be tested are oil palm fruitlets from a fresh fruit bunch. The object is placed in a box with walls wrapped in black paper. This is to avoid the LiDAR sensor from accidentally scanning other materials surrounding the object. Afterwards, the LiDAR scanning system is placed outside the box parallel with the fruitlets. During the field experiment, the LiDAR scanning system is placed at a specified distance to scan the oil palm trees. Arrangement of experiments in the laboratory and in the fields are shown in Figure 10 and Figure 11.
FIGURe 9. The flow chart diagram of the whole process involved in this study
FIGURe 10. Lab Experiment
Start
Literature review on LiDAR and oil palm FFB
Development of LiDAR sensormechanism for collecting intensity value
Testing and experiments with FFB (in lab and on field)
Analysis on intensity information from
LiDAR
Classification of different levels of ripeness ofFFB
eND
Yes
No
JK Bab 12.indd 96 5/28/2018 12:22:01 PM
97
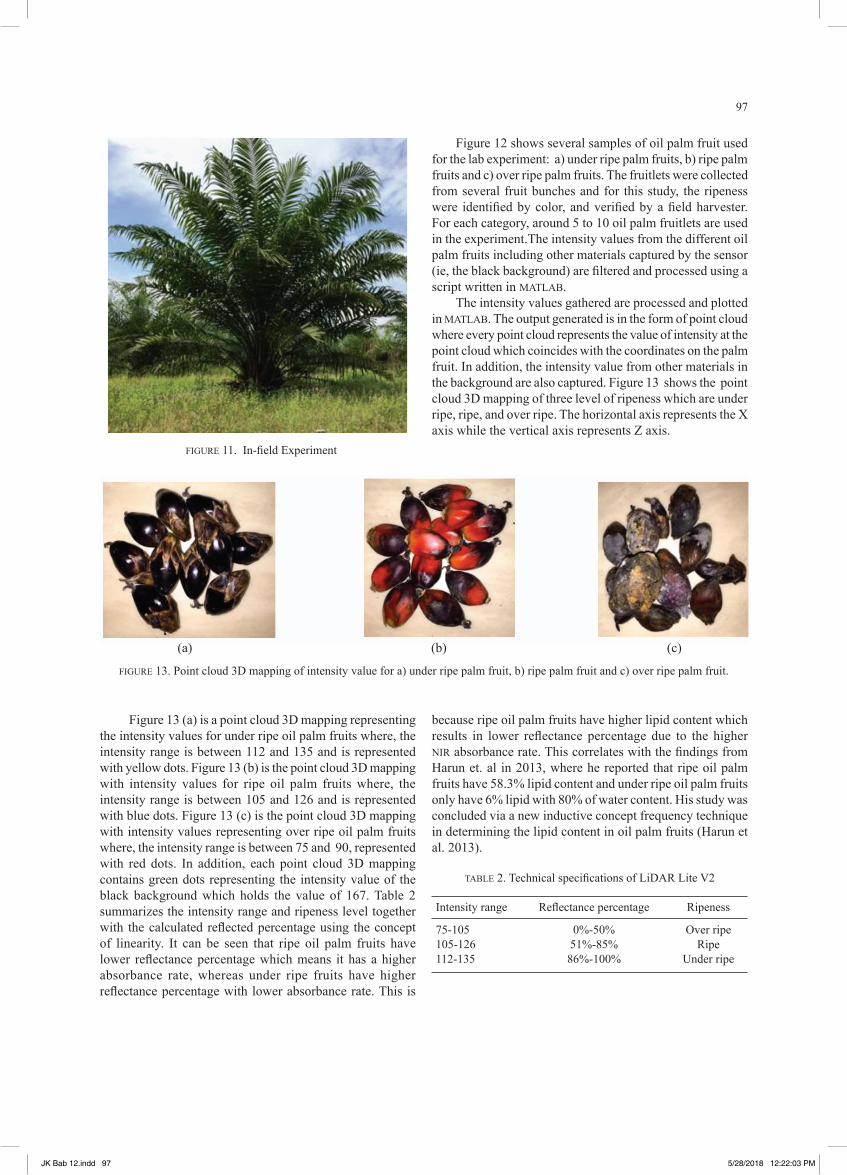
Figure 12 shows several samples of oil palm fruit used for the lab experiment: a) under ripe palm fruits, b) ripe palm fruits and c) over ripe palm fruits. The fruitlets were collected from several fruit bunches and for this study, the ripeness were identified by color, and verified by a field harvester. For each category, around 5 to 10 oil palm fruitlets are used in the experiment.The intensity values from the different oil palm fruits including other materials captured by the sensor (ie, the black background) are filtered and processed using a script written in MATLAB.
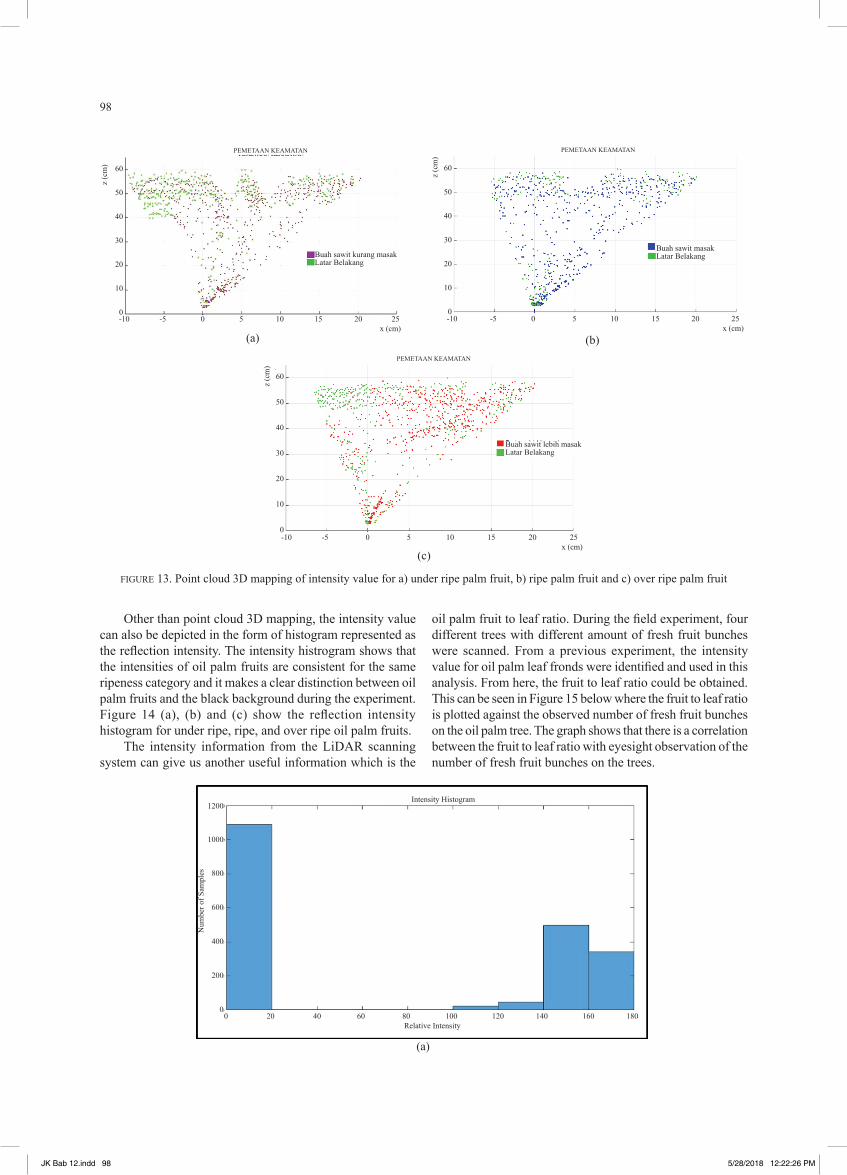
The intensity values gathered are processed and plotted in MATLAB. The output generated is in the form of point cloud where every point cloud represents the value of intensity at the point cloud which coincides with the coordinates on the palm fruit. In addition, the intensity value from other materials in the background are also captured. Figure 13 shows the point cloud 3D mapping of three level of ripeness which are under ripe, ripe, and over ripe. The horizontal axis represents the X axis while the vertical axis represents Z axis.
FIGURe 11. In-field Experiment
(a) (b) (c)
FIGURe 13. Point cloud 3D mapping of intensity value for a) under ripe palm fruit, b) ripe palm fruit and c) over ripe palm fruit.
Figure 13 (a) is a point cloud 3D mapping representing the intensity values for under ripe oil palm fruits where, the intensity range is between 112 and 135 and is represented with yellow dots. Figure 13 (b) is the point cloud 3D mapping with intensity values for ripe oil palm fruits where, the intensity range is between 105 and 126 and is represented with blue dots. Figure 13 (c) is the point cloud 3D mapping with intensity values representing over ripe oil palm fruits where, the intensity range is between 75 and 90, represented with red dots. In addition, each point cloud 3D mapping contains green dots representing the intensity value of the black background which holds the value of 167. Table 2 summarizes the intensity range and ripeness level together with the calculated reflected percentage using the concept of linearity. It can be seen that ripe oil palm fruits have lower reflectance percentage which means it has a higher absorbance rate, whereas under ripe fruits have higher reflectance percentage with lower absorbance rate. This is
because ripe oil palm fruits have higher lipid content which results in lower reflectance percentage due to the higher NIR absorbance rate. This correlates with the findings from Harun et. al in 2013, where he reported that ripe oil palm fruits have 58.3% lipid content and under ripe oil palm fruits only have 6% lipid with 80% of water content. His study was concluded via a new inductive concept frequency technique in determining the lipid content in oil palm fruits (Harun et al. 2013).
TABLE 2. Technical specifications of LiDAR Lite V2
Intensity range Reflectance percentage Ripeness
75-105 0%-50% Over ripe 105-126 51%-85% Ripe 112-135 86%-100% Under ripe
JK Bab 12.indd 97 5/28/2018 12:22:03 PM
98
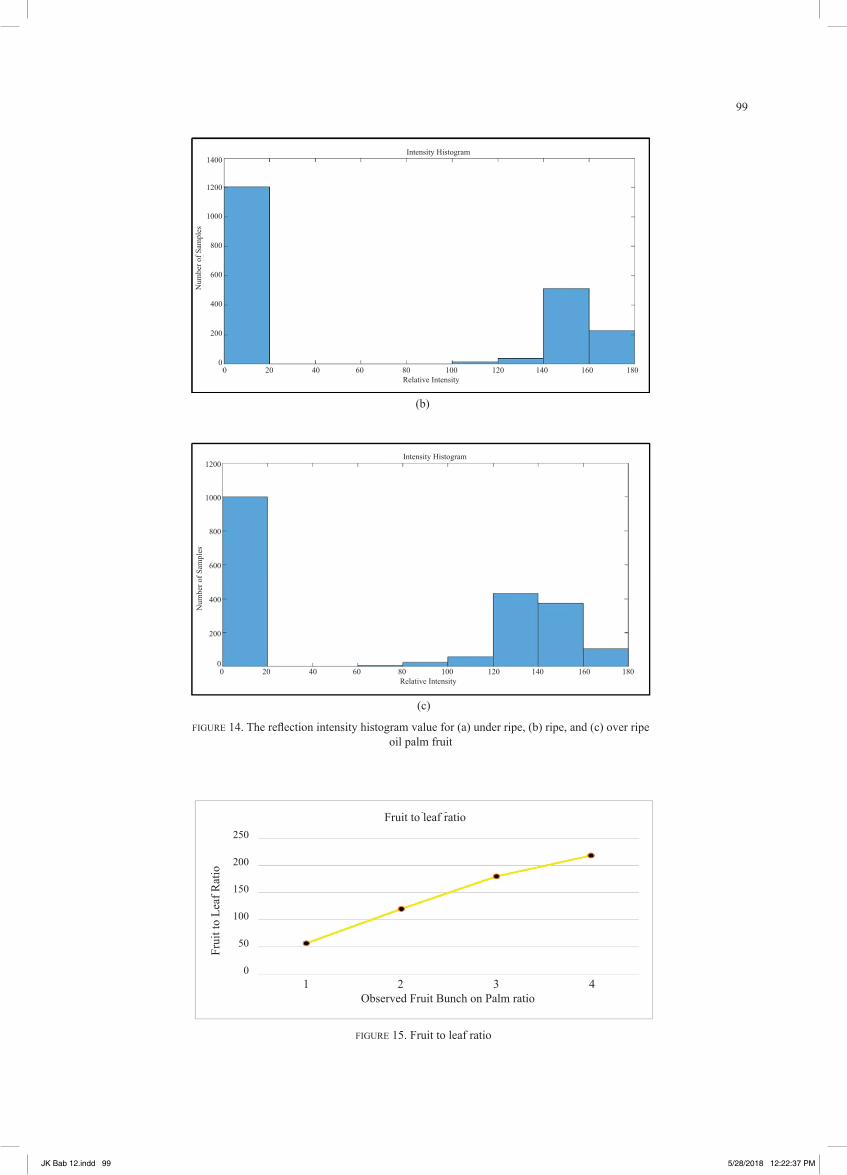
Other than point cloud 3D mapping, the intensity value can also be depicted in the form of histogram represented as the reflection intensity. The intensity histrogram shows that the intensities of oil palm fruits are consistent for the same ripeness category and it makes a clear distinction between oil palm fruits and the black background during the experiment. Figure 14 (a), (b) and (c) show the reflection intensity histogram for under ripe, ripe, and over ripe oil palm fruits.
The intensity information from the LiDAR scanning system can give us another useful information which is the
(a) (b)
(c)
FIGURe 13. Point cloud 3D mapping of intensity value for a) under ripe palm fruit, b) ripe palm fruit and c) over ripe palm fruit
(a)
oil palm fruit to leaf ratio. During the field experiment, four different trees with different amount of fresh fruit bunches were scanned. From a previous experiment, the intensity value for oil palm leaf fronds were identified and used in this analysis. From here, the fruit to leaf ratio could be obtained. This can be seen in Figure 15 below where the fruit to leaf ratio is plotted against the observed number of fresh fruit bunches on the oil palm tree. The graph shows that there is a correlation between the fruit to leaf ratio with eyesight observation of the number of fresh fruit bunches on the trees.
PeMeTAAN KeAMATAN
60
50
40
30
20
10
0
z (c
m)
-10 -5 0 5 10 15 20 25 x (cm)
Buah sawit kurang masakLatar Belakang
PeMeTAAN KeAMATAN
60
50
40
30
20
10
0
z (c
m)
-10 -5 0 5 10 15 20 25 x (cm)
Buah sawit masakLatar Belakang
Buah sawit lebih masakLatar Belakang
PeMeTAAN KeAMATAN
60
50
40
30
20
10
0
z (c
m)
-10 -5 0 5 10 15 20 25 x (cm)
Intensity Histogram1200
1000
800
600
400
200
0
Num
ber o
f Sam
ples
0 20 40 60 80 100 120 140 160 180Relative Intensity
JK Bab 12.indd 98 5/28/2018 12:22:26 PM
99
(b)
(c)
FIGURe 14. The reflection intensity histogram value for (a) under ripe, (b) ripe, and (c) over ripe oil palm fruit
FIGURe 15. Fruit to leaf ratio
Intensity Histogram1400
1200
1000
800
600
400
200
0
Num
ber o
f Sam
ples
0 20 40 60 80 100 120 140 160 180Relative Intensity
Intensity Histogram1200
1000
800
600
400
200
0
Num
ber o
f Sam
ples
0 20 40 60 80 100 120 140 160 180Relative Intensity
250
200
150
100
50
0
Frui
t to
Leaf
Rat
io
1 2 3 4Observed Fruit Bunch on Palm ratio
Fruit to leaf ratio
JK Bab 12.indd 99 5/28/2018 12:22:37 PM
100
CONCLUSION
A rapid and non-destructive technique in determining the ripeness of oil palm FFB using a scanning system utilizing LiDAR sensor has successfully been proposed. Three ripeness levels were identified: under ripe, ripe, and over ripe, and were successfully classified using the point cloud with intensity information, both in the lab and verified in the field. The intensity corresponds to the reflectance of the 905 nm IR wavelength, which correlates to the lipid content in oil palm fruits. This serves as a preliminary work in combining ranging and materials mapping for oil palm FFB harvesting.
ReFeReNCeS
Aziz, A.A., Ismail, A.H., Ahmad, R.B., Isa, C.M.N.C., Farook, R.S.M., Husin, Z., Ezanuddin, A.A.M. & Shakaff, A.M. 2014. Design of A Capacitive Sensor for Oil Palm Fresh Fruit Bunch Maturity Grading, International Conference on Electronic Design, 443-445.
Bensaeed, O.M., Shariff, A.M., Mahmud, A.B., Shafri, H. & Alfatni, M. 2014. Oil palm fruit grading using a hyperspectral device and machine learning algorithm. IOP Conference Series: Earth and Environmental Science 20(1): 012017.
Boudreault, L. É., Bechmann, A., Tarvainen, L., Klemedtsson, L., Shendryk, I. & Dellwik, E. 2015. A LiDAR method of canopy structure retrieval for wind modeling of heterogeneous forests. Agricultural and Forest Meteorology 201: 86-97.
Burton, D., Dunlap, D. B., Wood, L. J. & Flaig, P. P. 2011. Lidar Intensity as a remote sensor of rock properties. Journal of Sedimentary Research 81(5): 339-347.
Choi, J., Ulbrich, S., Lichte, B. & Maurer, M. 2013. Multi-Target Tracking using a 3D-Lidar sensor for autonomous vehicles. Ieee Conference on Intelligent Transportation Systems, Proceedings, ITSC (Itsc): 881-886.
Fieber, K. D., Davenport, I. J., Ferryman, J. M., Gurney, R. J., Walker, J. P. & Hacker, J. M. 2013. Analysis of full-waveform LiDAR data for classification of an orange orchard scene. ISPRS Journal of Photogrammetry and Remote Sensing 82: 63-82.
Golden, C., Murtha, T., Cook, B., Shaffer, D. S., Schroder, W., Hermitt, E. J., Omar, A. F. & Scherer, A. K. 2016. Reanalyzing environmental lidar data for archaeology: Mesoamerican applications and implications. Journal of Archaeological Science: Reports 9: 293-308.
IOPRI, 1997. Palm Oil and Palm Oil Mill Waste Management (Pengolahan kelapa sawit dan pengelolaan limbah pabrik kelapa sawit). Team of Standardization for Palm Oil Processing (Tim standarisasi pengolahan kelapa sawit). Indonesian Oil Palm Research Institute (IOPRI). Revised-4/S-1/PIRBUN/1997. Directorate General of estates (Direktorat jendral perkebunan). Indonesia.
Harun, N. H., Misron, N., Sidek, R. M., Aris, I., Ahmad D., Wakiwaka, H. & Tashiro, K. 2013. Investigations on
a novel inductive concept frequency technique for the grading of oil palm fresh fruit bunches. Sensors 13(2): 2254-2266.
Harun, N. H., Misron, N., Sidek, R. M., Aris, I., Wakiwaka, H. & Tashiro, K 2014. Dual resonant frequencies. effects on an induction-based oil palm fruit. Sensor 14(11): 21923-21940.
Hafiz, M. 2011. Ripeness Detection Of Oil Palm Fresh Fruit Bunches Using Fluorescence Sensor. Masters thesis, Universiti Putra Malaysia.
Hazir, M.H.M., Shariff, A.R.M., Amiruddin, M.D., Ramli, A.R. & Saripan, M.I. 2012. Oil palm bunch ripeness classification using fluorescence technique. Journal of Food Engineering 113(4): 534-540.
Junkwon, P, Takigawa, T., Okamoto H., Hasegawa, H., Koike, M., Sakai, K., Siruntawineti, J., Chaeychomsri, W., Vanavichit, A., Tittinuchanon, A. & Bahalayodhin, B. 2009. Potential application of color and hyperspectral images for estimation of weight and ripeness of oil palm (elaeis guineensis Jacq. var. tenera). Agriculture Information Research 18(2): 72-81.
Junkwon, P., Takigawa, T., Okamoto H., Hasegawa, H., Koike, M., Sakai, K., Siruntawineti, J., Chaeychomsri, W., Vanavichit, A., Tittinuchanon, A. & Bahalayodhin, B. 2009. Hyperspectral imaging for nondestructive determination of internal qualities for oil palm (elaeis guineensis Jacq . var . tenera). Agriculture Information Research 18(3): 130-141.
Lewis, R.H., 2012. Optical sensor device, US Patent, US8125620 B2.
Makky, M., Soni, P. & Salokhe, V. M. 2014. Automatic Non-destructive Quality inspection system for oil palm fruits. International Agrophysics 28(3): 319-329.
Misron, N., Harun, N.H., Lee, Y. K., Sidek, R. M., Aris, I., Wakiwaka, H. & Tashiro, K. 2014. Improvement in sensitivity of an inductive oil palm fruit. Sensors 14: 2431-2448.
MPOB, 2003. Oil Palm Grading Manual, second edition. Malaysian Palm Oil Board (MPOB), Malaysia.
Nasir, I. S. M., Rani, N. A. & Choy, E. A. 2015. Faktor pemilihan minyak sawit dalam kalangan pengguna: Kajian empirikal di Putrajaya, Malaysia. Geografia-Malaysian Journal of Society and Space 11(8): 66-77.
Sharif, F., Hamid, M., Ismail, A. & Adam, Z. 2015. Antihyperglycemic activity of oil palm elaeis guineensis fruit extract on streptozotocin-induced diabetic rats. Jurnal Sains Kesihatan Malaysia 13(2): 37-43.
Shiddiq, M., Fitmawati, Anjasmara, R., Sari, N. & Hefniati. 2017. Ripeness detection simulation of oil palm fruit bunches using laser-based imaging system. AIP Conference Proceedings 1801(1): 050003.
Silalahi, D. D., Reaño, C. E., Lansigan, F. P., Panopio, R. G., Bantayan, N. C., Davrieux, F., Caliman, J. P., Yuan, Y. Y. & Sudarno. 2016. Near infrared spectroscopy: a rapid and non-destructive technique to assess the ripeness of oil palm (elaeis guineensis Jacq.) fresh fruit. Journal of
JK Bab 12.indd 100 5/28/2018 12:22:38 PM
101
Near Infrared Spectroscopy 24(2): 179-190.Zhu, B., Gong, W., Shi, S. & Song, S. 2011. A multi-
wavelength canopy LiDAR for vegetation monitoring: System implementation and laboratory-based tests. Procedia Environmental Sciences 10(PART C): 2775-2782.
Zuhaira Mohd Zulkifli, Fazida Hanim Hashim, Thinal Raj, Aqilah Baseri Huddin Centre for Integrated Systems engineering and Advanced Technologies (INTeGRA)Faculty of Engineering & Built Environment,Universiti Kebangsaan Malaysia, Malaysia
*Corresponding author; email: [email protected]
Received date : 12th December 2017Accepted date : 13th February 2018In Press date : 1st April 2018Published date : 30th April 2018
JK Bab 12.indd 101 5/28/2018 12:22:38 PM