vot 74248 photocatalytic oxidation of gas phase … · sem/edx, spektrofotometer uv-vis dan...
TRANSCRIPT
VOT 74248
PHOTOCATALYTIC OXIDATION OF GAS PHASE VOLATILE ORGANIC
COMPOUNDS (VOCS) USING NANOSTRUCTURE TITANIUM DIOXIDE
BASED MATERIALS
(PENGOKSIDAAN PEMANGKINAN FOTO BAGI SEBATIAN ORGANIK
MERUAP BERFASA GAS (VOCS) MENGGUNAKAN TITANIUM DIOKSIDA
BERSTRUKTUR NANO)
MOHD YUSUF OTHMAN
WAN AZELEE WAN ABU BAKAR
KHAIDAWATI SAIYUDI
RESEARCH VOTE NO:
74248
Jabatan Kimia
Fakulti Sains
Universiti Teknologi Malaysia
2007

PHOTOCATALYTIC OXIDATION OF GAS PHASE VOLATILE ORGANIC COMPOUNDS (VOCS) USING NANOSTRUCTURE TITANIUM DIOXIDE
BASED MATERIALS
(Keywords: Photocatalyic, degradation, photoactivity, catalyst) Various atomic ratios of metal doped TiO2 were prepared using Mn2+, Fe2+, Fe3+, Cu2+, Zn2+, Cu2+ co-doped with Fe3+ and Zn2+ co-doped with Fe3+. Photocatalytic degradation of CH2Cl2, CHCl3 and CCl4 using various atomic ratios of metal doped TiO2 showed the existence of optimum dopant ratio, which indicates the dependency of photoactivity of doped TiO2 on dopant concentration. Besides, dopants can affect the photoactivity of doped TiO2 by acting as hole/electron traps or as recombination centres. Using doped catalysts such as Fe2+/TiO2, Fe3+/TiO2, Cu2+/TiO2, Zn2+/TiO2, Cu2+/Fe3+/TiO2 and Zn2+/Fe3+/TiO2 gave higher degradation of VOCs than pure TiO2. However, adding of Mn2+ was detrimental to the process. The rate of degradation of the studied chlorinated hydrocarbons follows the order: CHCl3 > CH2Cl2 > CCl4. This indicates different VOCs will have different levels of degradation although same catalyst was used in the photocatalytic degradation experiment. In photocatalytic degaradation of CHCl3 and CCl4 mixtures, low concentration of CHCl3 and CCl4 mixtures shows higher degradation than CCl4. The Cl∙ radicals do not attack C-Cl bond s in CCl4, therefore, Cl∙ radicals formed during the illumination of UV lamp may contribute to the degradation of CHCl3. Consequently, more CHCl3 was degraded. Possible model for photocatalytic degradation of VOCs were proposed, utilizing data from fragments analysis using GC-MS. SEM/EDX, UV-Vis and ellipsometer were used to characterize the structural and optical properties of thin films. Addition of dopants shifted the absorption edge of TiO2 and this indicated the changes of band gap energy. The film thickness for all catalyst samples is between 227-251 nm and within the acceptable range of thin films (<1000 nm).

PENGOKSIDAAN PEMANGKINAN FOTO BAGI SEBATIAN ORGANIK
MERUAP BERFASA GAS (VOCS) MENGGUNAKAN TITANIUM DIOKSIDA
BERSTRUKTUR NANO
(Kata kunci: Pemangkinan foto, pengdegradasian, aktiviti foto, mangkin)
TiO2 dop dengan pelbagai nisbah logam ion telah disediakan dengan menggunakan
Mn2+, Fe2+, Fe3+, Cu2+, Zn2+, Cu2+ ko-dop Fe3+ dan Zn2+ ko-dop Fe3+. Mangkin foto
degradasi CH2Cl2, CHCl3 dan CCl4 dengan menggunkan TiO2 dop dengan pelbagai
nisbah logam ion menunjukkan kewujudan satu nilai optimum bahan pendop terhadap
TiO2. nilai ini menunjukkan bahawa aktiviti mangkin foto TiO2 bergantung kepada
kepekatan bahan pendop. Bahan pendop mempengaruhi aktiviti pemangkin foto TiO2
dengan bertindak sebagai perangkap e-/h+ atau sebagai pusat pengabungan.
Penggunaan TiO2 dop dengan logam seperti Fe2+/TiO2, Fe3+/TiO2, Cu2+/TiO2,
Zn2+/TiO2, Cu2+/Fe3+/TiO2 dan Zn2+/Fe3+/TiO2 memberikan degradasi VOCs yang
lebih tinggi daripada TiO2 tanpa bahan pendop. Manakala penambahan Mn2+
memberikan kesan yang negatif. Pendegradasina VOCs mengikut kadar: CHCl3 >
CH2Cl2 > CCl4. Ini menunjukkan VOCs yang berbeza akan memberikan degradasi
yang berbeza walaupun mangkin yang sama digunakan. Dalam mangkin foto degradasi
campuran CHCl3 dan CCl4, campuran berkepkatan rendah menunjukkan degradasi
yang lebih tinggi daripada degradasi CCl4. Ini disebabkan oleh radikal Cl∙ tidak
menyerang ikatn C-Cl dalam CCl4, dengan itu, radikal Cl∙ yang terbentuk dalam
penyinaran UV akan meyerang CHCl3. Akibatnya, lebih banyak CHCl3
didegradasikan. Dengan menggunakn maklumat yang diperolehi daripada GC-MS,
model bagi pendegradasian VOCs boleh dicadangkan. SEM/EDX, Spektrofotometer
UV-Vis dan ellipsometer telah digunakan untuk mencirikan saput tipis. Penambahan
bahan pendop mengubah penyerapan TiO2 ke kawasan nampak dan ini menunjukkan
perubahan tenaga lubang jalur. Ketebalan saput tipis adalah di antara 227-251 nm dan
ini adalah dalam lingkungan ketebalan saput tipis (< 1000 nm).

Benefits Report Guidelines A. Purpose The purpose of the Benefits Report is to allow the IRPA Panels and their supporting experts to assess the benefits derived from IRPA-funded research projects. B. Information Required The Project Leader is required to provide information on the results of the research project, specifically in the following areas: • Direct outputs of the project;
• Organisational outcomes of the project; and
• Sectoral/national impacts of the project.
C. Responsibility The Benefits Report should be completed by the Project Leader of the IRPA-funded project. D. Timing The Benefits Report is to be completed within three months of notification by the IRPA Secretariat. Only IRPA-funded projects identified by MPKSN are subject to this review. Generally, the Secretariat will notify Project Leaders of selected projects within 18 months of project completion. E. Submission Procedure One copy of this report is to be mailed to :
IRPA Secretariat Ministry of Science, Technology and the Environment 14th, Floor, Wisma Sime Darby Jalan Raja Laut 55662 Kuala Lumpur

Benefit Report 1. Description of the Project
A. Project identification
1. Project number : 03-02-06-0127 EA001 (vot 74248)
Project title : Photocatalytic Oxidation of Gas Phase Volatile Organic Compounds
2. (VOCs) Using Nanostructure Titanium Dioxide Based Materials
3. Project leader : P.M. Dr. Mohd Yusuf Othman
B. Type of research Indicate the type of research of the project (Please see definitions in the Guidelines for completing the Application Form)
Scientific research (fundamental research)
Technology development (applied research)
Product/process development (design and engineering)
Social/policy research
C. Objectives of the project 1. Socio-economic objectives
Which socio-economic objectives are adressed by the project? (Please indentify the sector, SEO Category and SEO Group under which the project falls. Refer to the Malaysian R&D Classification System brochure for the SEO Group code) Sector : Manufacturing and Construction
SEO Category : Manufacturing (S20600)
SEO Group and Code : Industrial Chemicals and Related Products (S20607)
2. Fields of research
Which are the two main FOR Categories, FOR Groups, and FOR Areas of your project? (Please refer to the Malaysia R&D Classification System brochure for the FOR Group Code)
a. Primary field of research
FOR Category : Applied Sciences and Technologies
FOR Group and Code : Manufacturing and Process Technologies and Engineering (F10602)
FOR Area : Material Processing Technology
b. Secondary field of research
FOR Category : Engineering Science
FOR Group and Code : Chemical Engineering (F10702)
FOR Area : Catalyst Chemicals
√
May-96 Benefits Report

D. Project duration
What was the duration of the project?
36 Months
E. Project manpower
How many man-months did the project involve? 72 Man-months
F. Project costs
What were the total project expenses of the project? RM 196,500.00
G. Project funding
Which were the funding sources for the project? Funding sources Total Allocation (RM) IRPA RM 196,500.00

ll. Direct Outputs of the Project
A. Technical contribution of the project 1. What was the achieved direct output of the project :
For scientific (fundamental) research projects?
Algorithm
Structure
Data
Other, please specify : ______________________________________________
For technology development (applied research) projects :
Method/technique
Demonstrator/prototype
Other, please specify : _______________________________________________
For product/process development (design and engineering) projects:
Product/component
Process
Software
Other, please specify : _______________________________________________
2. How would you characterise the quality of this output?
Significant breakthrough
Major improvement
Minor improvement √
√
√
√

B. Contribution of the project to knowledge 1. How has the output of the project been documented?
Detailed project report
Product/process specification documents
Other, please specify : _______________________________________________
2. Did the project create an intellectual property stock?
Patent obtained
Patent pending
Patent application will be filed
Copyright
3. What publications are available?
Articles (s) in scientific publications How Many: 1
Papers(s) delivered at conferences/seminars How Many: 5
Book
Other, please specify : _______________________________________________
4. How significant are citations of the results?
Citations in national publications How Many: ________________
Citations in international publications How Many: ________________
None yet
Not known
√
√
√
√

lll. Organisational Outcomes of the Project
A. Contribution of the project to expertise development 1. How did the project contribute to expertise?
PhD degrees How Many: ________________
MSc degrees How Many: 5 students
Research staff with new specialty How Many: ________________
Other, please specify: ________________________________________________
2. How significant is this expertise?
One of the key areas of priority for Malaysia
An important area, but not a priority one
B. Economic contribution of the project? 1. How has the economic contribution of the project materialised?
Sales of manufactured product/equipment
Royalties from licensing
Cost savings
Time savings
Other, please specify : _______________________________________________
2. How important is this economic contribution ?
High economic contribution Value: RM________________
Medium economic contribution Value: RM 100,000.00
Low economic contribution Value: RM________________
√
√
√
√

3. When has this economic contribution materialised?
Already materialised
Within months of project completion
Within three years of project completion
Expected in three years or more
Unknown
C Infrastructural contribution of the project
1. What infrastructural contribution has the project had?
New equipment Value: RM __________________
New/improved facility Investment : RM __________________
New information networks
Other, please specify: ____________________________________________
2. How significant is this infrastructural contribution for the organisation?
Not significant/does not leverage other projects
Moderately significant
Very significant/significantly leverages other projects
D. Contribution of the project to the organisation’s reputation
1. How has the project contributed to increasing the reputation of the organisation
Recognition as a Centre of Excellence
National award
International award
Demand for advisory services
Invitations to give speeches on conferences
Visits from other organisations
Other, please specify: ______________________________________________
√
√
√
√

2. How important is the project’s contribution to the organisation’s reputation ?
Not significant
Moderately significant
Very significant
√

1V. National Impacts of the Project
A. Contribution of the project to organisational linkages
1. Which kinds of linkages did the project create?
Domestic industry linkages
International industry linkages
Linkages with domestic research institutions, universities
Linkages with international research institutions, universities
2. What is the nature of the linkages?
Staff exchanges
Inter-organisational project team
Research contract with a commercial client
Informal consultation
Other, please specify: ________________________________________________
B. Social-economic contribution of the project
1. Who are the direct customer/beneficiaries of the project output?
Customers/beneficiaries: Number: ________________________________ ________________________________
________________________________ ________________________________
________________________________ ________________________________
2. How has/will the socio-economic contribution of the project materialised ?
Improvements in health
Improvements in safety
Improvements in the environment
Improvements in energy consumption/supply
Improvements in international relations
Other, please specify: ________________________________________________
√
√
√

3. How important is this socio-economic contribution?
High social contribution
Medium social contribution
Low social contribution
4. When has/will this social contribution materialised?
Already materialised
Within three years of project completion
Expected in three years or more
Unknown
Date: 4 July 2007 Signature:
√
√
UTM/RMC/F/0024 (1998)
Lampiran 20
UNIVERSITI TEKNOLOGI MALAYSIA
BORANG PENGESAHAN LAPORAN AKHIR PENYELIDIKAN
TAJUK PROJEK: PHOTOCATALYTIC OXIDATION OF GAS PHASE VOLATILE
ORGANIC COMPOUNDS (VOCS) USING NANOSTRUCTURE
TITANIUM DIOXIDE BASED MATERIALS
Saya MOHD YUSUF OTHMAN (HURUF BESAR)
Mengaku membenarkan Laporan Akhir Penyelidikan ini disimpan di Perpustakaan Universiti Teknologi Malaysia dengan syarat-syarat kegunaan seperti berikut :
1. Laporan Akhir Penyelidikan ini adalah hakmilik Universiti Teknologi Malaysia.
2. Perpustakaan Universiti Teknologi Malaysia dibenarkan membuat salinan untuk tujuan rujukan sahaja.
3. Perpustakaan dibenarkan membuat penjualan salinan Laporan Akhir
Penyelidikan ini bagi kategori TIDAK TERHAD.
4. * Sila tandakan ( / )
SULIT (Mengandungi maklumat yang berdarjah keselamatan atau Kepentingan Malaysia seperti yang termaktub di dalam AKTA RAHSIA RASMI 1972). TERHAD (Mengandungi maklumat TERHAD yang telah ditentukan oleh Organisasi/badan di mana penyelidikan dijalankan). TIDAK TERHAD TANDATANGAN KETUA PENYELIDIK
Nama & Cop Ketua Penyelidik Tarikh : _________________
√
CATATAN : * Jika Laporan Akhir Penyelidikan ini SULIT atau TERHAD, sila lampirkan surat daripada pihak berkuasa/organisasi berkenaan dengan menyatakan sekali sebab dan tempoh laporan ini perlu dikelaskan sebagai SULIT dan TERHAD.

End of Project Report Guidelines A. Purpose The purpose of the End of Project is to allow the IRPA Panels and their supporting group of experts to assess the results of research projects and the technology transfer actions to be taken. B. Information Required The following Information is required in the End of Project Report : • Project summary for the Annual MPKSN Report;
• Extent of achievement of the original project objectives;
• Technology transfer and commercialisation approach;
• Benefits of the project, particularly project outputs and organisational outcomes; and
• Assessment of the project team, research approach, project schedule and project
costs.
C. Responsibility The End of Project Report should be completed by the Project Leader of the IRPA-funded project. D. Timing The End of Project Report should be submitted within three months of the completion of the research project. E. Submission Procedure One copy of the End of Project is to be mailed to :
IRPA Secretariat Ministry of Science, Technology and the Environment 14th Floor, Wisma Sime Darby Jalan Raja Laut 55662 Kuala Lumpur
End of Project Report
A. Project number : 03-02-06-0127 EA001 (vot 74248)
Project title: Photocatalytic Oxidation of Gas Phase Volatile Organic Compounds
(VOCs) Using Nanostructure Titanium Dioxide Based Materials
Project leader: P.M. Dr. Mohd Yusuf Othman
Tel: 07-5534126 Fax: 07-5566162
B. Summary for the MPKSN Report (for publication in the Annual MPKSN Report, please summarise
the project objectives, significant results achieved, research approach and team structure)
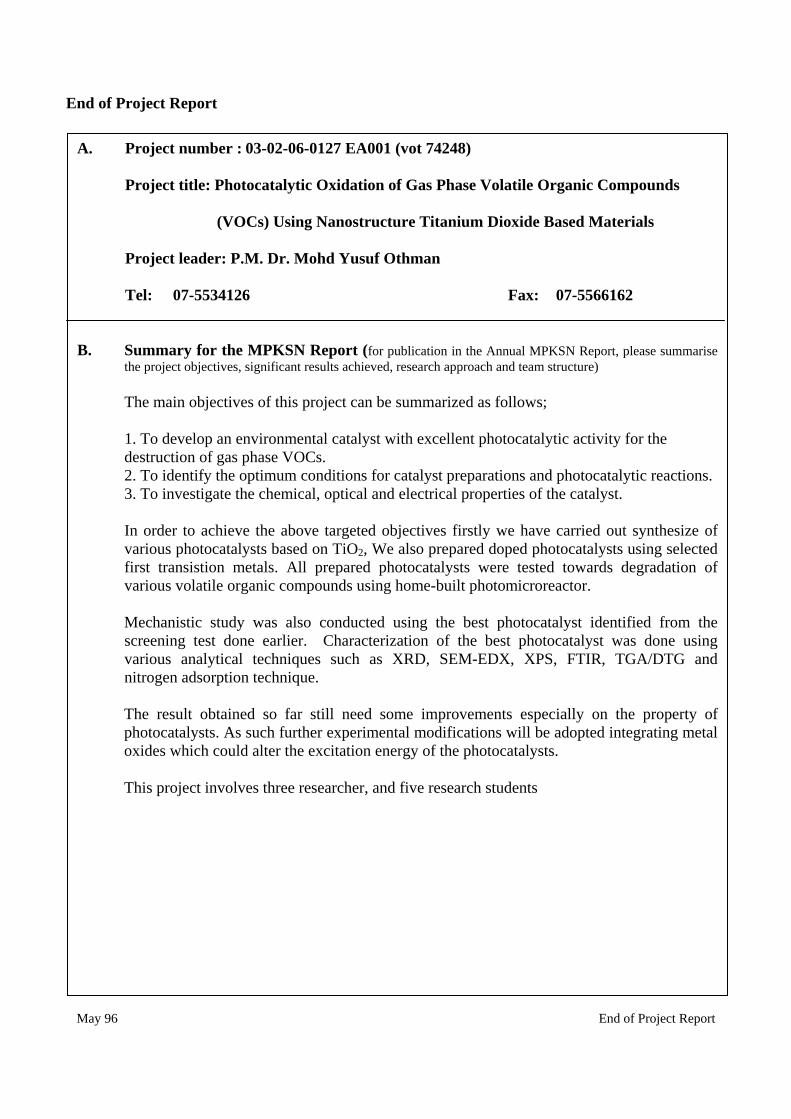
The main objectives of this project can be summarized as follows; 1. To develop an environmental catalyst with excellent photocatalytic activity for the destruction of gas phase VOCs. 2. To identify the optimum conditions for catalyst preparations and photocatalytic reactions.
3. To investigate the chemical, optical and electrical properties of the catalyst. In order to achieve the above targeted objectives firstly we have carried out synthesize of
various photocatalysts based on TiO2, We also prepared doped photocatalysts using selected first transistion metals. All prepared photocatalysts were tested towards degradation of various volatile organic compounds using home-built photomicroreactor.
Mechanistic study was also conducted using the best photocatalyst identified from the screening test done earlier. Characterization of the best photocatalyst was done using various analytical techniques such as XRD, SEM-EDX, XPS, FTIR, TGA/DTG and nitrogen adsorption technique. The result obtained so far still need some improvements especially on the property of photocatalysts. As such further experimental modifications will be adopted integrating metal oxides which could alter the excitation energy of the photocatalysts. This project involves three researcher, and five research students
May 96 End of Project Report

C. Objectives achievement
• Original project objectives (Please state the specific project objectives as described in Section ll of the Application Form)
1. To develop an environmental catalyst with excellent photocatalytic activity for the destruction of gas phase VOCs. 2. To identify the optimum conditions for catalyst preparations and photocatalytic reactions. 3. To investigate the chemical, optical and electrical properties of the catalyst. • Objectives Achieved (Please state the extent to which the project objectives were achieved) 1. To develop an environmental catalyst with excellent photocatalytic activity for the destruction of gas phase VOCs. 2. To identify the optimum conditions for catalyst preparations and photocatalytic reactions. 3. To investigate the chemical, optical and electrical properties of the catalyst. • Objectives not achieved (Please identify the objectives that were not achieved and give reasons)
D. Technology Transfer/Commercialisation Approach (Please describe the approach planned to transfer/commercialise the results of the project) The findings of this research will help in solving air pollution problem caused by VOCs emitted from industries and household materials or furniture. The best catalyst can be coated on glass or tiles, which are the major building materials.

E. Benefits of the Project (Please identify the actual benefits arising from the project as defined in Section lll of the Application Form. For examples of outputs, organisational outcomes and sectoral/national impacts, please refer to Section lll of the Guidelines for the Application of R&D Funding under IRPA)
• Outputs of the project and potential beneficiaries (Please describe as specifically as possible
the outputs achieved and provide an assessment of their significance to users) • A supported titanium dioxide base catalyst with improved technology, knowledge and
skills relevant to catalysis • An understanding of the chemical, physical, optical and electrical properties of
nanostructure • Papers in scientific and engineering journals covering environmental catalysis, air
pollution control and surface science • Organisational Outcomes (Please describe as specifically as possible the organisational benefits
arising from the project and provide an assessment of their significance) 1. Expertise development: 5 MSc students 2. Economic contribution: Royalties from licensing 3. Infrastructural contribution: Demand for advisory services 4. Industrial problems solving • National Impacts (If known at this point in time, please describes specifically as possible the potential
sectoral/national benefits arising from the project and provide an assessment of their significance) 1. Organisation linkages – domestic industry linkage and linkages with other universities or research institution. 2. Socio-economic contribution – improvement in health, safety and environment.

F. Assessment of project structure
• Project Team (Please provide an assessment of how the project team performed and highlight any significant departures from plan in either structure or actual man-days utilised)
• This project was conducted within given time frame. • This project also involved 3 researchers and 5 master students. • Collaborations (Please describe the nature of collaborations with other research organisations and/or
industry)
G. Assessment of Research Approach (Please highlight the main steps actually performed and indicate any major departure from the planned approach or any major difficulty encountered) This research approached undertaken in this project was according to original research methodology.
H. Assessment of the Project Schedule (Please make any relevant comment regarding the actual duration
of the project and highlight any significant variation from plan) The project conducted according to initial project schedule.

I. Assessment of Project Costs (Please comment on the appropriateness of the original budget and highlight any major departure from the planned budget)
The overall costs of the project actually spend was 137,840.21. This is 70.15 % the original approved budget.
J. Additional Project Funding Obtained (In case of involvement of other funding sources, please indicate the source and total funding provided)
__
K. Other Remarks (Please include any other comment which you feel is relevant for the evaluation of this
project) __
Date : 4 July 2007 Signature :

UTM/RMC/F/0014 (1998)
UNIVERSITI TEKNOLOGI MALAYSIA Research Management Centre
PRELIMINARY IP SCREENING & TECHNOLOGY ASSESSMENT FORM
(To be completed by Project Leader submission of Final Report to RMC or whenever IP protection arrangement is required) 1. PROJECT TITLE IDENTIFICATION :
Photocatalytic Oxidation of Gas Phase Volatile Organic Compounds (VOCs) Using Nanostructure
Titanium Dioxide Based Materials Vote No:
2. PROJECT LEADER :
Name : MOHD YUSUF OTHMAN
Address : Department of Chemistry, Faculty of Science, Universiti Teknologi Malaysia,
81310 Skudai, Johor Darul Takzim.
Tel : 07-5534126 Fax : 07-5566162 e-mail : [email protected]
3. DIRECT OUTPUT OF PROJECT (Please tick where applicable)
4. INTELLECTUAL PROPERTY (Please tick where applicable) Not patentable Technology protected by patents
Patent search required Patent pending
Patent search completed and clean Monograph available
Invention remains confidential Inventor technology champion
No publications pending Inventor team player
No prior claims to the technology Industrial partner identified
Secientific Research Applied Research Product/Process Development Algorithm Method/Technique Component Structure Demonstration / Process Prototype Data Software
Other, please specify Other, please specify Other, please specify ___________________ __________________ ___________________________ ___________________ __________________ ___________________________ ___________________ __________________ ___________________________
Product /
√
√ √
√
74248
Lampiran 13
1

UTM/RMC/F/0014 (1998)
2
c) BALANCE RM : 47,245.29 7. TECHNICAL DESCRIPTION AND PERSPECTIVE
Please tick an executive summary of the new technology product, process, etc., describing how it works. Include brief analysis that compares it with competitive technology and signals the one that it may replace. Identify potential technology user group and the strategic means for exploitation. a) Technology Description
Some modification of photocatalytic techniques werw carried out. More investigations might to be
done for the betterment of products.
b) Market Potential
Not yet. The obtained products still need improvement before they could be commercialized.
Signature of Projet Leader :- Date : 4 July 2008
b) TOTAL SPENDING RM : 196,500.00
a) APPROVED FUNDING RM : 149,254.71
6. STATEMENT OF ACCOUNT
4. Gas Regulator 3. Digital Mass Flowmeter
2. High vacuum glass piping system
5. LIST OF EQUIPMENT BOUGHT USING THIS VOT
1. Note book and printer

3
c) Commercialisation Strategies
Improvement of products still need to be done
8. RESEARCH PERFORMANCE EVALUATION
a) FACULTY RESEARCH COORDINATOR Research Status ( ) ( ) ( ) ( ) ( ) ( ) Spending ( ) ( ) ( ) ( ) ( ) ( ) Overall Status ( ) ( ) ( ) ( ) ( ) ( ) Excellent Very Good Good Satisfactory Fair Weak
Comment/Recommendations : _____________________________________________________________________________
_____________________________________________________________________________
_____________________________________________________________________________
_____________________________________________________________________________
_____________________________________________________________________________
_____________________________________________________________________________
………………………………………… Name : ………………………………………
Signature and stamp of Date : ……………………………………… JKPP Chairman
UTM/RMC/F/0014 (1998)

RE
4
b) RMC EVALUATION
Research Status ( ) ( ) ( ) ( ) ( ) ( ) Spending ( ) ( ) ( ) ( ) ( ) ( ) Overall Status ( ) ( ) ( ) ( ) ( ) ( ) Excellent Very Good Good Satisfactory Fair Weak
Comments :- _____________________________________________________________________________
_____________________________________________________________________________
_____________________________________________________________________________
_____________________________________________________________________________
_____________________________________________________________________________
_____________________________________________________________________________ Recommendations :
Needs further research
Patent application recommended
Market without patent
No tangible product. Report to be filed as reference
……………………………………….. Name : ……………………………………………
Signature and Stamp of Dean / Date : …………………………………………… Deputy Dean Research Management Centre
UTM/RMC/F/0014 (1998)

1
CHAPTER 1
INTRODUCTION
1.1 Heterogeneous Photocatalytic Oxidation
Photocatlytic oxidation (PCO) is an attractive technology for the remediation of
organic pollutants. It is economical, simple and can be easily implemented. The process
harnesses radiant energy from natural or artificial light sources with heterogeneous
catalyst to degrade the organic pollutants into their mineral components (Hoffmann,
1995; Mills, 1993; Fox, 1993). PCO has a promising application for the degradation of
VOCs in process air stream (Hester, 1995). PCO can readily mineralize simple organic
molecules into CO2 and H2O at ambient conditions using molecular oxygen as the
primary oxidant, but complex pollutants are often more difficult to degrade with
undesirable intermediates and by-products formed. In addition, the rate of decomposition
is usually slow (Djeghri, 1980).
1.2 Titanium Dioxide as Photocatalyst
Heterogeneous photocatalysis using TiO2 has several attractions: (a) TiO2 is
relatively inexpensive, (b) it dispenses with the use of other coadjutant reagents, (c) it
shows efficient destruction of toxic contaminants, (d) it operates at ambient temperature
and pressure and (e) the reaction products are usually CO2 and H2O, or HCl, in the case
of chlorinated organic compounds (Alberici, 1997) (f) able to utilize visible and / or
near-UV light (g) biologically and chemically inert (h) photostable (i.e not liable to
photoanodic corrosion for example) (Mills, 1997).
Most of the current wide interest in using TiO2 in catalytic studies stems from the
highly reactive radicals (•OH and •O2-) formed when irradiated together with handling
facilities (Monneyron, 2003). It can be seen that TiO2 exists in two main
crystallographic forms, anatase and rutile. For anatase, the bandgap energy is 3.23 eV

2
while the bandgap energy for rutile is 3.02 eV (Litter, 1999, Mills, 1997). It is no
surprise that different samples of TiO2 exhibit different photocatalytic activities towards
the same organic substrate under otherwise identical reaction conditions. Such
differences can be qualitatively attributed to differences in morphology, crystal phase,
specific surface area, particle aggregate size and surface density of OH groups in the
TiO2 samples (Mills, 1997). For the degradation of organic compounds, the pure TiO2
anatase exhibited the best catalytic efficiency, while pure rutile was the poorer catalyst.
The recombination rate of e− and h+ in rutile is very highdue to its relatively low
dielectric constants compare to anatase. The conduction band level of anatase is
sufficiently negative for the reduction of oxygen, whereas for rutile is close to the
oxygen reduction potential thus retarded the reduction of oxygen (Braun, 1993).
1.4 Effect of Metal Ions (Mn+)
Knowledge of the effects of impurities on the pigment properties is essential in
order to be able to improve the photocatalytic properties by doping transition metal
elements (Karvinen, 2003). On the other hand, doping of TiO2 produces crystal defects
and surface modifications, which alter the photocatalytical properties of TiO2 (Malati,
1984). Cr3+/TiO2 co-deposited with RuO2 and Pt had been used as photocatalyst for
water decomposition (Bogarello, 1982). The facts indicate that introducing two or more
proper metals onto nanocrystalline TiO2 particles will improve the photocatalytic effect
of TiO2. Co-doping rare earth metal and transition metal ions onto the nanocrystalline
TiO2 may achieve the same effect as the noble and transition metal ions were
codeposited onto TiO2 (Yang, 2002).
Degradation of a certain organic molecule will depend not only on its chemical
properties, such as its capacity for chemisorption and reacting with photogenerated
radicals, but on the catalyst properties and affinity for the molecule and its degradation
intermediates. For instance, catalysts showing a very high degradation activity for
certain species may be inactive for others or its intermediates (Arana, 2001). The effect
of metal ion doping is strongly depends on the factors such as the dopant concentration,
the particle size of the nanocrystalline TiO2, the distribution of the dopants and so on

3
(Yang, 2002). The high degree of recombination between photogenerated electrons and
holes is a major limiting factor controlling the photocatalytic efficiency (He, 2003). In
this case, the deposited metal on the surface of TiO2 can act as a sink for photoinduced
charge carrier, promoting interfacial charge-transfer process. This migration of
generated electrons to metal particle, on the one hand, can increase the lifetime of the
holes and suppress the electron-hole recombination, beneficial to the photocatalytic
oxidation of organic pollutants (Dionysiou, 2000; Hirano, 1997). The addition of metal
ions Mn+ can also trap electrons (or holes) at the semiconductor surface (Eq. 1.1 and 1.2).
The energy level for Mn+/M(n-1)+ lies below the conduction band edge (Ecb
and the energy level for Mn+/M(n+1)+ lies above the valence band (Evb). The uses of
partially field d orbital of first row transition metal ions as dopants or co-catalyst
resulted in an increased rate of formation of •OH (Eq. 1.4, Eq. 1.5). This is due to the
electrons in valence band of TiO2 can be transferred to the energy level of metal ions.
Consequently, the lifetime of h+ can be prolonged and more •OH will be formed.
When dopants are added into TiO2, the bulk and surface properties and the
photoactivity are strongly dependent on the method used for photocatalyst preparation.
The dominant parameters include the character and concentration of the dopant and the
thermal treatment (Palmisano, 1994). In highest concentrations the dissolved metal ions
have detrimental effect on the rate of organic substrate removal, which was attributed to
hν oxidation of reduced metals by •OH or photogenerated holes, proceeding in
competition with Eq. 1.4 and 1.5 (Butler, 1993).

4
1.5 Kinetics Study
Owing to the complex mechanism of reactions, it is difficult to develop a model
for the dependence of the photocatalytic degradation rate on the experimental parameters
for the whole treatment time. Thus, kinetic modelling of the photocatalytic process is
usually restricted to the analysis of the initial rate of potocatalytic degradation. This can
be obtained from the initial slope and the initial VOCs’ concentration in an experiment
in which the variation of the VOCs concentration is measured as a function of time. The
extrapolation of the photocatalytic degradation rate to time = 0 avoids the possible
interference from by-products. The initial photocatalytic degradation rate (r0) is observed
to be a function of the initial VOCs’ concentration (C0). A linear plot of reciprocal initial
rate (r0-1) versus reciprocal initial concentration (C0
-1) is often obtained, that gives k as
the L-H rate constant and K as the Langmuir adsorption constant of the VOCs in the
photocatalytic degradation reaction (Kim, 2002).
The inherent uncertain nature (due to the presence of chain reactions and chain
termination) of photochemical processes makes the evaluation of reaction kinetics rather
complicated, thus requiring extensive and methodical studies in this area (Feiyen, 2002).
In this study, kinetics and possible pathways for the photocatalytic degradation of
chloroform, carbon tetrachloride and dichloromethane were being studied.
1.6 Photocatalytic Degradation Mechanism
In the last decade, the mechanism of heterogeneous photocatalysis has been
investigated by many researchers. According to Fu, Zeltner and Anderson, a
photocatalytic reaction proceeds on the surface of semiconductors via several steps: (1)
production of electron-hole pairs by irradiating the semiconductor by light whose energy
is higher than the band gap energy of the semiconductor (E.q 1.3); (2) separation of the
photogenerated electrons and holes due to trapping by species that are adsorbed on the
semiconductor; (3) redox reaction between the trapped electrons and holes and the
adsorbates present on the surface; (4) desorption of the products and reconstruction of
surface (Fu, 1996).
Oxidative pathway can be performed by direct hole attack or mediated by •OH
radicals, in their free or adsorbed form. The oxidative pathway leads, in many cases, to
5
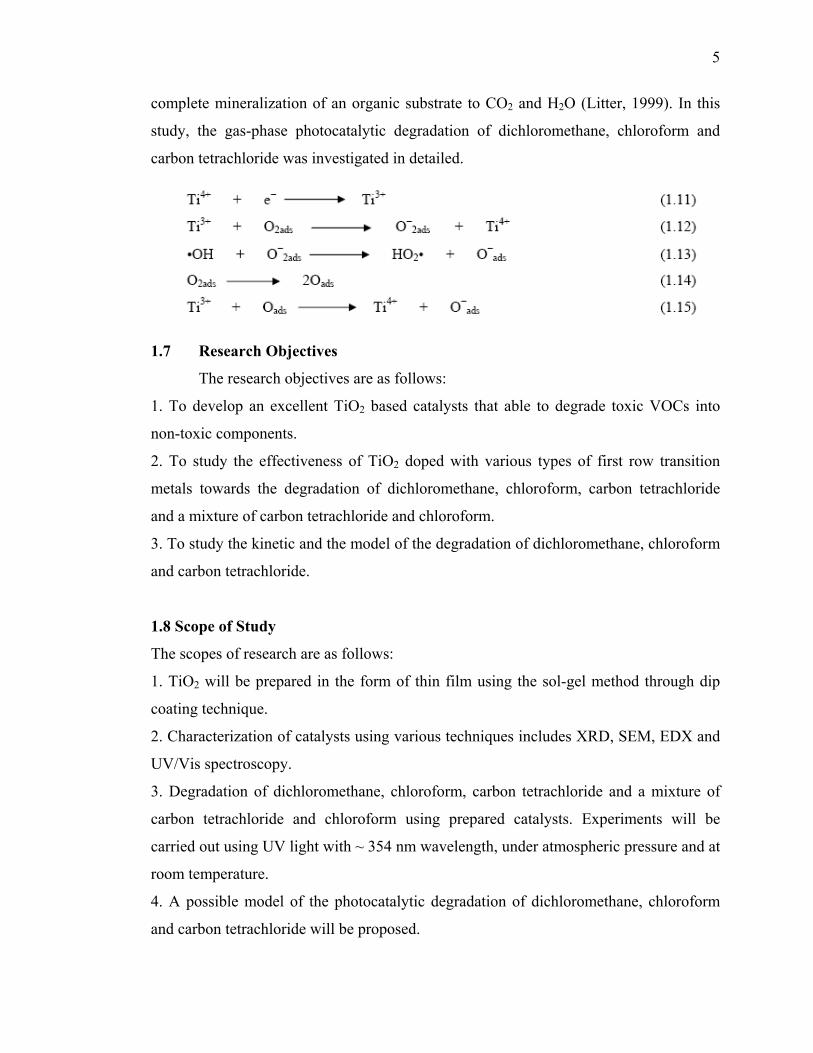
complete mineralization of an organic substrate to CO2 and H2O (Litter, 1999). In this
study, the gas-phase photocatalytic degradation of dichloromethane, chloroform and
carbon tetrachloride was investigated in detailed.
1.7 Research Objectives
The research objectives are as follows:
1. To develop an excellent TiO2 based catalysts that able to degrade toxic VOCs into
non-toxic components.
2. To study the effectiveness of TiO2 doped with various types of first row transition
metals towards the degradation of dichloromethane, chloroform, carbon tetrachloride
and a mixture of carbon tetrachloride and chloroform.
3. To study the kinetic and the model of the degradation of dichloromethane, chloroform
and carbon tetrachloride.
1.8 Scope of Study
The scopes of research are as follows:
1. TiO2 will be prepared in the form of thin film using the sol-gel method through dip
coating technique.
2. Characterization of catalysts using various techniques includes XRD, SEM, EDX and
UV/Vis spectroscopy.
3. Degradation of dichloromethane, chloroform, carbon tetrachloride and a mixture of
carbon tetrachloride and chloroform using prepared catalysts. Experiments will be
carried out using UV light with ~ 354 nm wavelength, under atmospheric pressure and at
room temperature.
4. A possible model of the photocatalytic degradation of dichloromethane, chloroform
and carbon tetrachloride will be proposed.

6
CHAPTER 3
EXPERIMENTAL
3.0 Catalysts Preparation
3.1 Preparation of TiO2 Sol-Gel
The precursor solution for TiO2 sol for coatings was prepared using a
modification of the sol-gel method reported by Kato (Kato, 1994). 6 g Polyethylene
glycol (2000) was dissolved in 600 mL ethanol in a volumetric flask (1000 mL). The
solution was then stirred continuously until the polyethylene glycol was fully dissolved.
85.2 g titanium tetraisopropoxide, 31.8 g diethanolamine and 5.4 mL deionized water
were added to the solution. The mixture was then stirred continuously using a magnetic
stirrer in order to achieve a stable, transparent and homogeneous sol-gel. The sol-gel was
then used to prepare doped and undoped TiO2 thin films.
3.2 Preparation of TiO2 Thin film
Hollow pyrex glass cylinders were used as the support substrates. The hollow
pyrex glass cylinders were cleaned with acetone, followed by ethanol and finally oven
dried prior to dip-withdrawal process. The TiO2 thin films were prepared manually by
the dip-withdraw method. 135 mL sol-gel was added into a beaker (200 mL). The
hollow glass cylinder was then dipped into the sol-gel and left for a minute in the sol
before extraction. The thin film was dried at ambient temperature in a desiccator for 10
minutes before repeating the process. The complete dip-withdraw cycle was repeated 5
times. The dipping and withdrawing processes must be constant in order to ensure the
formation of a homogeneous thin film on the support. The thin film was then dried in the
oven at 80°C for 1 hour. Finally, the thin film was calcined in the furnace with an
elevated temperature of 2°C/min up to 500°C and kept at this temperature for 1 hour.
3.2.3 Preparation of Catalysts with Dopants
3.2.4 To determine the weight of Ti4+ in the sol-gel, a clean container was weighted
before 10 mL sol-gel was poured into it. This was followed by the calcination of

7
the solgel in a furnace with an elevated temperature of 2°C/min up to 500°C and
maintained for 1 hour. After it was cooled to room temperature, it was weighted
once again. The calcination and weighing processes were repeated until no
differences in weights were observed. The measured weight was the weight of
Ti4+ in the sol-gel. This Ti4+ weight will be used in the determination of the ratio
of TiO2 against dopants weight. In the preparation of catalyst with dopants, the
metal salt was weighted into a 200 mL beaker based on the required amount and
dissolved with 135 mL sol-gel. The mixture was stirred till homogeneous.
Further procedures in the preparation of thin film catalysts with dopants were
similar to those used in preparing undoped TiO2. All the solutions were
transparent. Coloured solutions were caused by the presence of metal ions. For
instance, the solution which was green in colour was caused by the presence of
Fe2+ ions. Meanwhile, the solution which was chocolate in colour was caused by
the presence of Mn2+ ions.
3.3 Photocatalytic Measurements
3.3.1 Calibration
The calibration process was carried out using vacuum pump and calibration glass
container with exactly 1000 mL. The samples used were dichloromethane, chloroform
and carbon tetrachloride. Before calibration was conducted, the glass container must be
vacuumed for a few minutes prior to use. This was important to ensure that all gases and
pollutants that might be present in the glass container was eliminated. Then, a certain
amount of sample was injected into the glass container through the septum. One of the
taps of the container was then opened and kept open until the “hissing” sound
disappeared to ensure that the pressure inside the container was equivalent to the
ambient pressure. The sample was left to evaporate for a few minutes. A 50 μL sample
was injected out from the container and analyzed using GC-FID. The resulting peak area
was recorded. This process was repeated for a different sample volume. A calibration
graph of peak area versus concentration was drawn.

8
3.3.2 Photocatalytic Degradation Testing
All photocatalytic degradation experiments of dichloromethane, chloroform and
carbon tetrachloride were conducted in a home built fixed bed annulus glass reactor with
exactly 1000 mL. The reactor is equipped with an electromagnetic pump to circulate the
sample, a glass compartment to place the catalyst and UV light and a septum for
injection of sample into the reactor. The UV radiation that was used in the photocatalytic
degradation experiments was provided by a light source from a 6 W black lamp (Toshiba
Litec Co.). The wavelength is ~ 354 nm. Reactor effluent was collected using a
Hamilton gastight syringe and analyzed every 10 minutes for 90 minutes using GC-FID.
All experiments were carried out under room temperature (28-30°C).
The gas chromatographic apparatus used in conjunction with the photocatalytic
degradation study was a Shimadzu GC-14A gas chromatograph which was coupled with
a Shimadzu chromatopac 4A. The GC was equipped with a 2.0 m of 15 % carbowax on
Csorb WNAW 80-100 GLT Mesh packed column and a flame ionization detector (FID).
The carrier gas was helium at pressure of 2.75 Kg/cm2. Gases used in the flame were air
and hydrogen at pressure of 0.5 Kg/cm2. The detection, column and injection
temperatures were 200°C, 95°C and 150°C respectively. The remaining samples were
analyzed every 10 minutes for 90 minutes using GC. The concentration of VOC (ppm)
was measured by integrating the peak area.
3.4 Mechanistic Study
3.4.1 Kinetic Study
The procedures followed in conducting the kinetics study were similar to those in
the photocatalytic degradation experiments. The experiments were conducted at ambient
temperature and pressure. The photoreactor was vacuumed prior to use. Total
illumination time of each photocatalytic degradation process was 10 minutes. Each
sample was analyzed at 2 minutes intervals using GC-FID. Six different concentrations
(0.2 μL, 0.4 μL, 0.5 μL, 0.6 μL, 0.8 μL and 1.0 μL) of each sample were degraded
individually. The kinetics study of dichloromethane, chloroform and carbon
tetrachloride was carried out using undoped TiO2, Fe2+, Fe3+, Mn2+, Cu2+, Zn2+-doped
9
TiO2, Cu2+/ Fe3+/TiO2 and Zn2+/Fe3+/TiO2. A graph of reciprocal initial rate (1/r0) versus
reciprocal initial concentration (1/C0) that gives k as the L-H rate constant and K as the
Langmuir adsorption constant of the VOCs in the photocaalytic degradation reaction
was drawn.
3.4.2 Determination of Model for the Photocatalytic Degradation of VOCs
Gas chromatography-mass spectrometry (GC-MS) is a combination of two
techniques to form a single method of analyzing mixtures of chemicals. The gas
chromatography separates the components of a mixture while the mass spectroscopy
characterizes each of the components individually. As the individual compounds elute
from the GC column, they enter the ionization chamber in the mass spectroscopy. In the
ionization chamber, sample molecules are subjected to bombardment by a stream of
high-energy electrons, converting some of the molecules to ions. The ions with a
particular mass to charge ratio (m/z) are detected by a device which is able to count the
number of ions which strike it. The detector’s output is amplified and fed to a recorder.
The trace from the recorder is a mass spectrum which is a graph of the number of
particles detected as a function of mass to charge ratio. Since most fragments have a
charge of +1, therefore, the m/z usually represents the molecular weight of the fragment
(Gudzinowicz, 1976).
In this study, A Hewlett-Packard Systems 5890 Series II GC and 5989 A MS
were used to analyze fragments that may form during the photocatalytic degradation of
the VOCs. The GC-MS is equipped with a 25 m crosslinked methyl siloxane capillary
column. Standard addition method was used to predict the reaction model for the
photocatalytic degradation of the VOCs. The isothermal temperatures of the oven,
injection port and detector were 200°C, 250°C and 250°C respectively.
The procedure used in predicting possible reaction model for the VOCs
photocatalytic degradation is similar to those used in the photocatalytic degradation
experiments. The experiments were conducted at ambient temperature and pressure. The
photoreactor was vacuumed prior to use. The total illumination time for each
photocatalytic degradation process was 90 minutes.

10
3.5 Catalysts Characterization
3.5.1 Ellipsometer
In this research, a single wavelength (632.8 nm) Gaerther Scientific Corporation
ellipsometer model L116S was used to measure the thickness and refractive index of
thin films. The data obtained from the ellipsometer measurements were processed using
the software for ellipsometric analysis. Catalysts coated on glass plates were used as
samples. The thickness of thin films was used to calculate the optical band gap values
for the thin films.
3.5.2 UV-Vis Spectroscopy (Band Gap Measurements)
The optical band gap, Eg of thin films can be determined using the spectra of
measured absorption coefficient, α of the thin films. The α near the absorption edge was
derived from the measured transmittance (T) and reflectance (R) factors of the thin
films. The α can be obtained by using the following relationship:
where d is the thickness of thin film. The calculation to obtain α value was
shown in Appendix A. The transmittance and reflectance data were obtained from the
optical spectra recorded using a UV-Vis-NIR Shimadzu UV-3101PC Spectrophotometer
in the wavelength range of 300-800 nm (Appendix B and C). The optical band gap, Eg
values for all catalyst samples were determined by plotting (αhν)1/2 versus the equivalent
energy at the wavelength, λ. h is planck constant while ν is frequency. The resulting
diagram was called Tauc’s Plot. The respective band gaps were obtained by
extrapolation of the Tauc plot dataset to (αhν)1/2 = 0.
3.5.3 Scanning Electron Microscopy (SEM) / Electron Dispersive X-ray Analysis
(EDX)
In this study the surface morphology of the catalysts was characterized using
SEM, but by selecting only the best catalyst (Zn2+ co-doped Fe3+/TiO2) for
characterization. The samples were gold-coated to ensure conductivity. They were then

11
placed on an aluminium sample stub using double sided carbon tape as adhesive and
coated with gold in a Bio Rad SEM coating system using a gold sputterer at 10-1 Mbar.
The current flow during the coating process was 30 mA. Then, the gold-coated
sample was placed in a specimen chamber under vacuum (5 bar) and the SEM analysis
was conducted using a Philip XL40 microscope interfaced with a PC through Philip XL
with version 5.01 software. The sample was bombarded using an electron gun with a
tungsten filament under 30 kV resolution. A Philips graphic video recorder model GP-
850 recorded an image with a 5k magnification. The EDX, model Ametek, USA, version
3.32 XL, is linked to the SEM and uses X-ray to identify trace amounts of elements on
the surface of the scanned test specimen. In this study, all doped and undoped TiO2 thin
films were characterized using EDX. All data obtained from EDX were analyzed based
on the emission lines of the elements recorded on the diffractogram. These lines were
then referred to the Periodic Table from Link X-ray Analytical Systems for elemental
identification.
CHAPTER 4
RESULTS AND DISCUSSION
4.1 Retention Time from GC Analysis and Photolysis of Dichloromethane,
Chloroform and Carbon Tetrachloride
Individual gas sample was injected into the reactor and left to vaporize. The gas
sample was then injected into the GC-FID, and sharp peak was found. The retention time
for dichloromethane, chloroform and carbon tetrachloride were 1.358, 1.743 and 1.063
minutes respectively. (Refer Table 4.1)
Table 4.1: Retention times from GC analysis for dichloromethane, chloroform and
carbon tetrachloride.
12
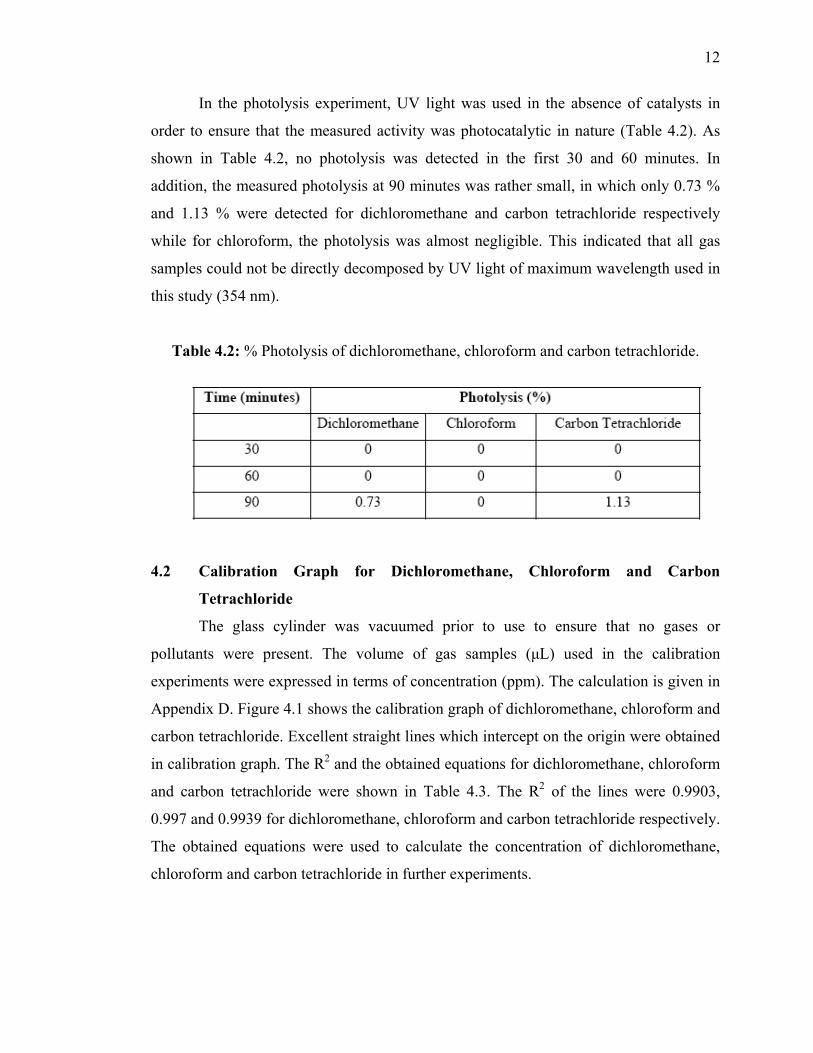
In the photolysis experiment, UV light was used in the absence of catalysts in
order to ensure that the measured activity was photocatalytic in nature (Table 4.2). As
shown in Table 4.2, no photolysis was detected in the first 30 and 60 minutes. In
addition, the measured photolysis at 90 minutes was rather small, in which only 0.73 %
and 1.13 % were detected for dichloromethane and carbon tetrachloride respectively
while for chloroform, the photolysis was almost negligible. This indicated that all gas
samples could not be directly decomposed by UV light of maximum wavelength used in
this study (354 nm).
Table 4.2: % Photolysis of dichloromethane, chloroform and carbon tetrachloride.
4.2 Calibration Graph for Dichloromethane, Chloroform and Carbon
Tetrachloride
The glass cylinder was vacuumed prior to use to ensure that no gases or
pollutants were present. The volume of gas samples (μL) used in the calibration
experiments were expressed in terms of concentration (ppm). The calculation is given in
Appendix D. Figure 4.1 shows the calibration graph of dichloromethane, chloroform and
carbon tetrachloride. Excellent straight lines which intercept on the origin were obtained
in calibration graph. The R2 and the obtained equations for dichloromethane, chloroform
and carbon tetrachloride were shown in Table 4.3. The R2 of the lines were 0.9903,
0.997 and 0.9939 for dichloromethane, chloroform and carbon tetrachloride respectively.
The obtained equations were used to calculate the concentration of dichloromethane,
chloroform and carbon tetrachloride in further experiments.

13
Figure 4.1: Calibration graph of peak area versus concentration for dichloromethane,
chloroform and carbon tetrachloride.
Table 4.3: R2 and the equation for dichloromethane, chloroform and carbon
tetrachloride.
4.3 Optimum Dopant Ratios
In photocatalytic degradation experiments, TiO2 doped with various metal ions
ratios were used as catalysts. It was interesting to note that when the photocatalytic
degradation experiments were conducted, a trend appeared in that only catalysts with
optimum dopant ratios resulted in appreciable degradation. It can be further observed
that the concentration of sample decreased with increasing of degradation time. Value of
% degradation at any particular time can be calculated using the following formula:
whereby, [sample]0 : Initial concentration of sample
14
[sample]t : Concentration of sample at particular time
Five dopant ratios were prepared when Fe2+ and Mn2+ were used as dopant in the
photocatalytic degradation of dichloromethane, which ranged from 1:0.0003 to 1: 0.01
dopant ratios. However, only 3 dopant ratios were prepared for the Fe3+-doped TiO2,
Cu2+-doped TiO2, Zn2+-doped TiO2, Zn2+ co-doped Fe3+/TiO2 and Cu2+ co-doped
Fe3+/TiO2. All photocatalytic degradation processes were conducted for 90 minutes.
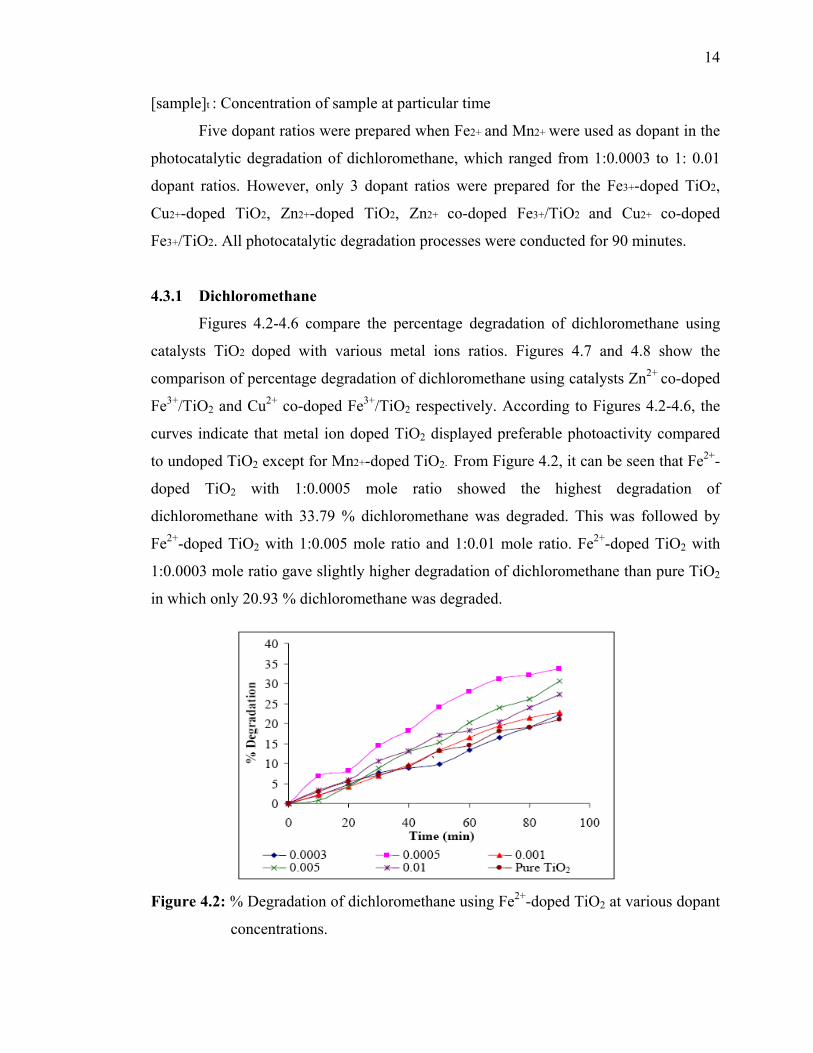
4.3.1 Dichloromethane
Figures 4.2-4.6 compare the percentage degradation of dichloromethane using
catalysts TiO2 doped with various metal ions ratios. Figures 4.7 and 4.8 show the
comparison of percentage degradation of dichloromethane using catalysts Zn2+ co-doped
Fe3+/TiO2 and Cu2+ co-doped Fe3+/TiO2 respectively. According to Figures 4.2-4.6, the
curves indicate that metal ion doped TiO2 displayed preferable photoactivity compared
to undoped TiO2 except for Mn2+-doped TiO2. From Figure 4.2, it can be seen that Fe2+-
doped TiO2 with 1:0.0005 mole ratio showed the highest degradation of
dichloromethane with 33.79 % dichloromethane was degraded. This was followed by
Fe2+-doped TiO2 with 1:0.005 mole ratio and 1:0.01 mole ratio. Fe2+-doped TiO2 with
1:0.0003 mole ratio gave slightly higher degradation of dichloromethane than pure TiO2
in which only 20.93 % dichloromethane was degraded.
Figure 4.2: % Degradation of dichloromethane using Fe2+-doped TiO2 at various dopant
concentrations.
15
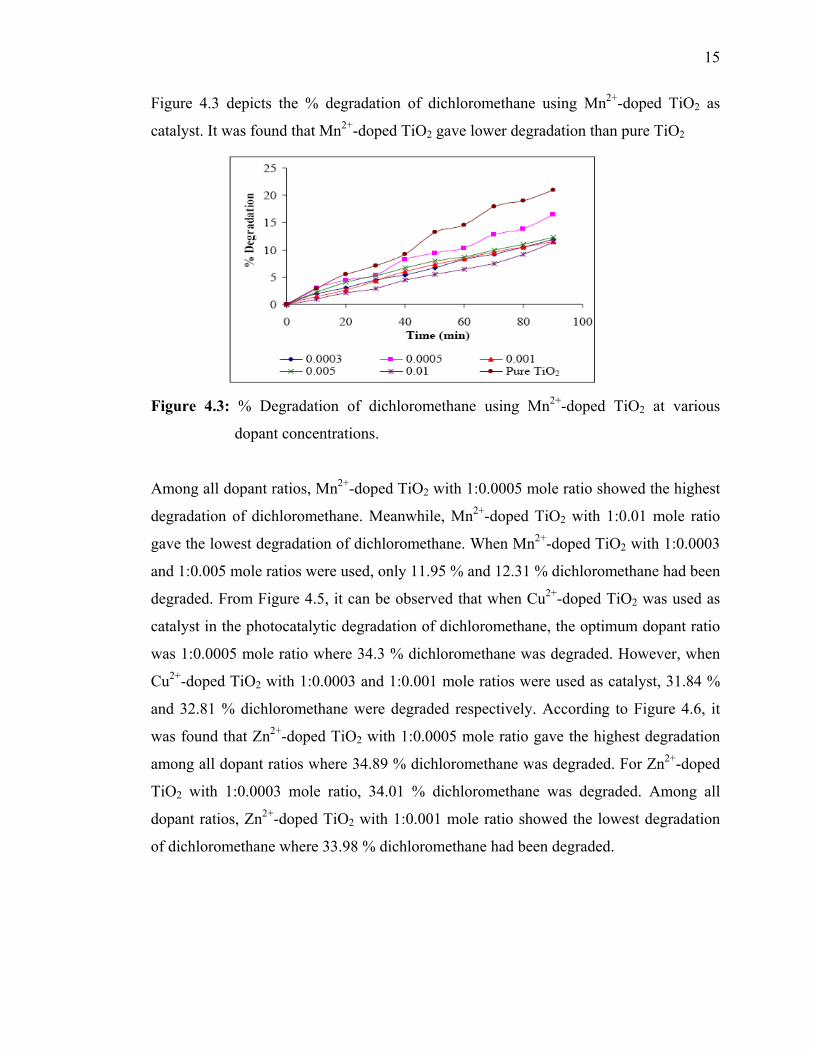
Figure 4.3 depicts the % degradation of dichloromethane using Mn2+-doped TiO2 as
catalyst. It was found that Mn2+-doped TiO2 gave lower degradation than pure TiO2
Figure 4.3: % Degradation of dichloromethane using Mn2+-doped TiO2 at various
dopant concentrations.
Among all dopant ratios, Mn2+-doped TiO2 with 1:0.0005 mole ratio showed the highest
degradation of dichloromethane. Meanwhile, Mn2+-doped TiO2 with 1:0.01 mole ratio
gave the lowest degradation of dichloromethane. When Mn2+-doped TiO2 with 1:0.0003
and 1:0.005 mole ratios were used, only 11.95 % and 12.31 % dichloromethane had been
degraded. From Figure 4.5, it can be observed that when Cu2+-doped TiO2 was used as
catalyst in the photocatalytic degradation of dichloromethane, the optimum dopant ratio
was 1:0.0005 mole ratio where 34.3 % dichloromethane was degraded. However, when
Cu2+-doped TiO2 with 1:0.0003 and 1:0.001 mole ratios were used as catalyst, 31.84 %
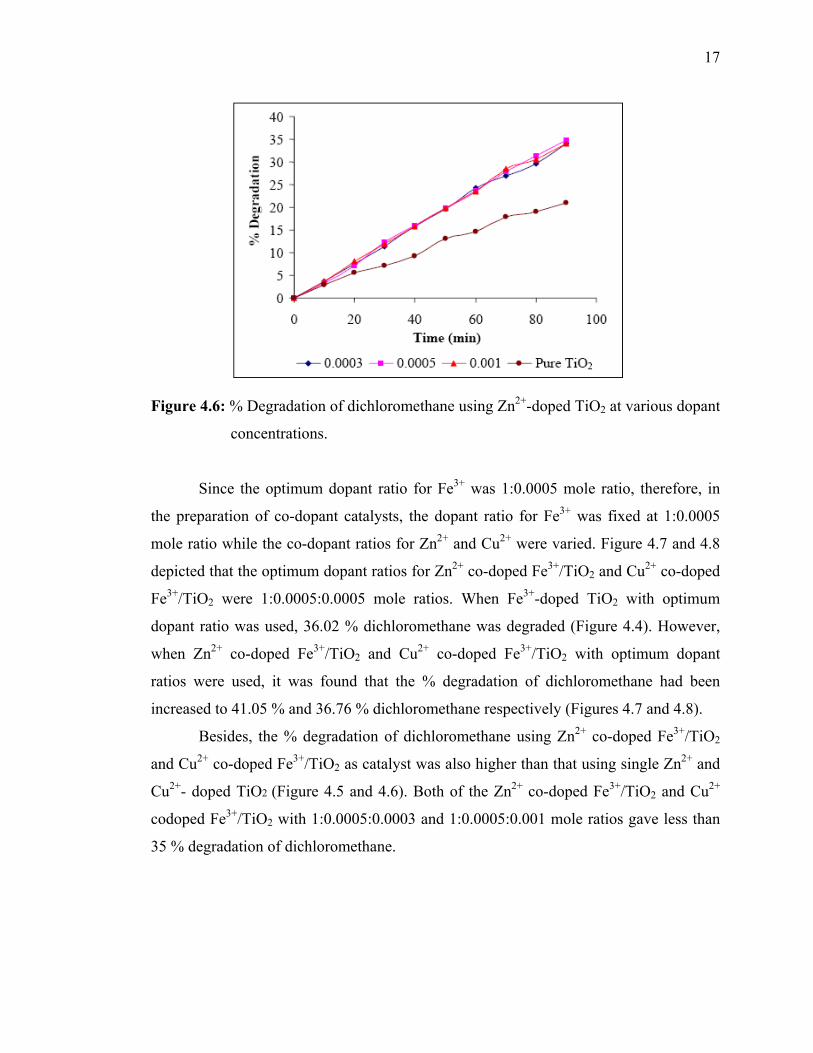
and 32.81 % dichloromethane were degraded respectively. According to Figure 4.6, it
was found that Zn2+-doped TiO2 with 1:0.0005 mole ratio gave the highest degradation
among all dopant ratios where 34.89 % dichloromethane was degraded. For Zn2+-doped
TiO2 with 1:0.0003 mole ratio, 34.01 % dichloromethane was degraded. Among all
dopant ratios, Zn2+-doped TiO2 with 1:0.001 mole ratio showed the lowest degradation
of dichloromethane where 33.98 % dichloromethane had been degraded.

16
Figure 4.4: % Degradation of dichloromethane using Fe3+-doped TiO2 at various
dopants
Figure 4.5: % Degradation of dichloromethane using Cu2+-doped TiO2 at various dopant
concentrations.
17
Figure 4.6: % Degradation of dichloromethane using Zn2+-doped TiO2 at various dopant
concentrations.
Since the optimum dopant ratio for Fe3+ was 1:0.0005 mole ratio, therefore, in
the preparation of co-dopant catalysts, the dopant ratio for Fe3+ was fixed at 1:0.0005
mole ratio while the co-dopant ratios for Zn2+ and Cu2+ were varied. Figure 4.7 and 4.8
depicted that the optimum dopant ratios for Zn2+ co-doped Fe3+/TiO2 and Cu2+ co-doped
Fe3+/TiO2 were 1:0.0005:0.0005 mole ratios. When Fe3+-doped TiO2 with optimum
dopant ratio was used, 36.02 % dichloromethane was degraded (Figure 4.4). However,
when Zn2+ co-doped Fe3+/TiO2 and Cu2+ co-doped Fe3+/TiO2 with optimum dopant
ratios were used, it was found that the % degradation of dichloromethane had been
increased to 41.05 % and 36.76 % dichloromethane respectively (Figures 4.7 and 4.8).
Besides, the % degradation of dichloromethane using Zn2+ co-doped Fe3+/TiO2
and Cu2+ co-doped Fe3+/TiO2 as catalyst was also higher than that using single Zn2+ and
Cu2+- doped TiO2 (Figure 4.5 and 4.6). Both of the Zn2+ co-doped Fe3+/TiO2 and Cu2+
codoped Fe3+/TiO2 with 1:0.0005:0.0003 and 1:0.0005:0.001 mole ratios gave less than
35 % degradation of dichloromethane.

18
Figure 4.7: % Degradation of dichloromethane using Zn2+ co-doped Fe3+/TiO2 at
various dopant concentrations.
Figure 4.8: % Degradation of dichloromethane using Cu2+ co-doped Fe3+/TiO2 at
various dopant concentrations.
4.3.2 Chloroform
In the determination of optimum dopant ratio in the photocatalytic degradation of
chloroform, Fe3+, Zn2+, Cu2+, Fe2+, Mn2+-doped TiO2, Zn2+ co-doped Fe3+/TiO2 and Cu2+
co-doped Fe3+/TiO2 were tested. Figures 4.9-4.13 depict the photocatalytic degradation
of chloroform using Fe2+, Mn2+, Fe3+, Zn2+ and Cu2+-doped TiO2 respectively while
Figures 4.14 and 4.15 show the photocatalytic degradation of chloroform using Zn2+
codoped Fe3+/TiO2 and Cu2+ co-doped Fe3+/TiO2.

19
It can be seen that a dopant ratio of 1:0.0005 showed higher degradation of
chloroform when Zn2+, Cu2+, Fe2+, Mn2+ and Fe3+-doped TiO2 were used. When Fe2+-
doped TiO2 was used, catalysts with dopant ratios of 1:0.0005 gave the best degradation
performance, with 34.21 % chloroform degraded, followed by the catalyst with 1:0.001
mole ratio and finally with 1:0.0003 mole ratio which showed 30.84 % and 29.8 %
degradation respectively (Figure 4.9).
Figure 4.9: % Degradation of chloroform using Fe2+-doped TiO2 at various dopant
concentrations.
Figure 4.10 shows that Mn2+-doped TiO2 with 1:0.0005 dopant ratio showed
higher degradation of chloroform than other dopant ratios. However, pure TiO2 showed
higher degradation of chloroform than Mn2+-doped TiO2. Pure TiO2 showed 23.87 %
degradation of chloroform while Mn2+-doped TiO2 with various dopant ratios used in
this study only showed less than 20 % degradation of chloroform.
Figure 4.10: % Degradation of chloroform using Mn2+-doped TiO2 at various dopant
concentrations.
20
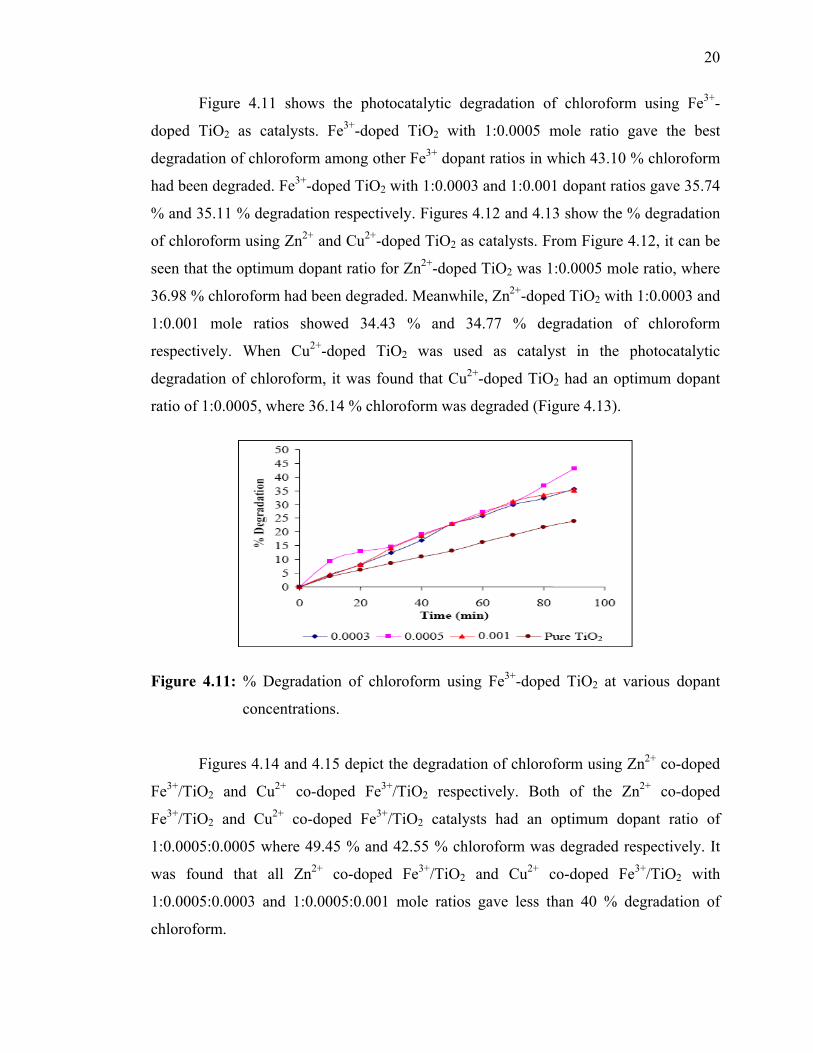
Figure 4.11 shows the photocatalytic degradation of chloroform using Fe3+-
doped TiO2 as catalysts. Fe3+-doped TiO2 with 1:0.0005 mole ratio gave the best
degradation of chloroform among other Fe3+ dopant ratios in which 43.10 % chloroform
had been degraded. Fe3+-doped TiO2 with 1:0.0003 and 1:0.001 dopant ratios gave 35.74
% and 35.11 % degradation respectively. Figures 4.12 and 4.13 show the % degradation
of chloroform using Zn2+ and Cu2+-doped TiO2 as catalysts. From Figure 4.12, it can be
seen that the optimum dopant ratio for Zn2+-doped TiO2 was 1:0.0005 mole ratio, where
36.98 % chloroform had been degraded. Meanwhile, Zn2+-doped TiO2 with 1:0.0003 and
1:0.001 mole ratios showed 34.43 % and 34.77 % degradation of chloroform
respectively. When Cu2+-doped TiO2 was used as catalyst in the photocatalytic
degradation of chloroform, it was found that Cu2+-doped TiO2 had an optimum dopant
ratio of 1:0.0005, where 36.14 % chloroform was degraded (Figure 4.13).
Figure 4.11: % Degradation of chloroform using Fe3+-doped TiO2 at various dopant
concentrations.
Figures 4.14 and 4.15 depict the degradation of chloroform using Zn2+ co-doped
Fe3+/TiO2 and Cu2+ co-doped Fe3+/TiO2 respectively. Both of the Zn2+ co-doped
Fe3+/TiO2 and Cu2+ co-doped Fe3+/TiO2 catalysts had an optimum dopant ratio of
1:0.0005:0.0005 where 49.45 % and 42.55 % chloroform was degraded respectively. It
was found that all Zn2+ co-doped Fe3+/TiO2 and Cu2+ co-doped Fe3+/TiO2 with
1:0.0005:0.0003 and 1:0.0005:0.001 mole ratios gave less than 40 % degradation of
chloroform.

21
Figure 4.12: % Degradation of chloroform using Zn2+-doped TiO2 at various dopant
concentrations.
Figure 4.13: % Degradation of chloroform using Cu2+-doped TiO2 at various dopant
concentrations.
Figure 4.14: % Degradation of chloroform using Zn2+ co-doped Fe3+/TiO2 at various
dopant concentrations.

22
Figure 4.15: % Degradation of chloroform using Cu2+ co-doped Fe3+/TiO2 at various
dopant concentrations.
4.3.3 Carbon Tetrachloride
Figures 4.16, 4.17 and 4.18 depict the photocatalytic degradation of carbon
tetrachloride using Mn2+, Fe2+ and Fe3+-doped TiO2 as catalysts. From Figure 4.16, it can
be seen that the degradation of carbon tetrachloride using pure TiO2 showed higher
degradation than Mn2+-doped TiO2. Among 1:0.0005, 1:0.0003 and 1:0.001 Mn2+ dopant
ratios, it was noted that the optimum dopant ratio for Mn2+-doped TiO2was 1:0.0005
mole ratio.

23
Figure 4.16: % Degradation of carbon tetrachloride using Mn2+-doped TiO2 at various
dopant concentrations.
Figure 4.17 shows the photocatalytic degradation of carbon tetrachloride using
Fe2+-doped TiO2 as catalyst. When Fe2+-doped TiO2 were used, the degradations of
carbon tetrachloride were lower than undoped TiO2 except Fe2+-doped TiO2 with
1:0.0005 mole ratio. From Figure 4.17, it can be seen that the optimum dopant ratio for
Fe2+-doped TiO2 was 1:0.0005 mole ratio where 20.80 % carbon tetrachloride had been
degraded. Fe2+-doped TiO2 with 1:0.0003 and 1:0.001 mole ratios only showed 13.42 %
and 12.36 % degradation of carbon tetrachloride.
Figure 4.17: % Degradation of carbon tetrachloride using Fe2+-doped TiO2 at various
dopant concentrations.
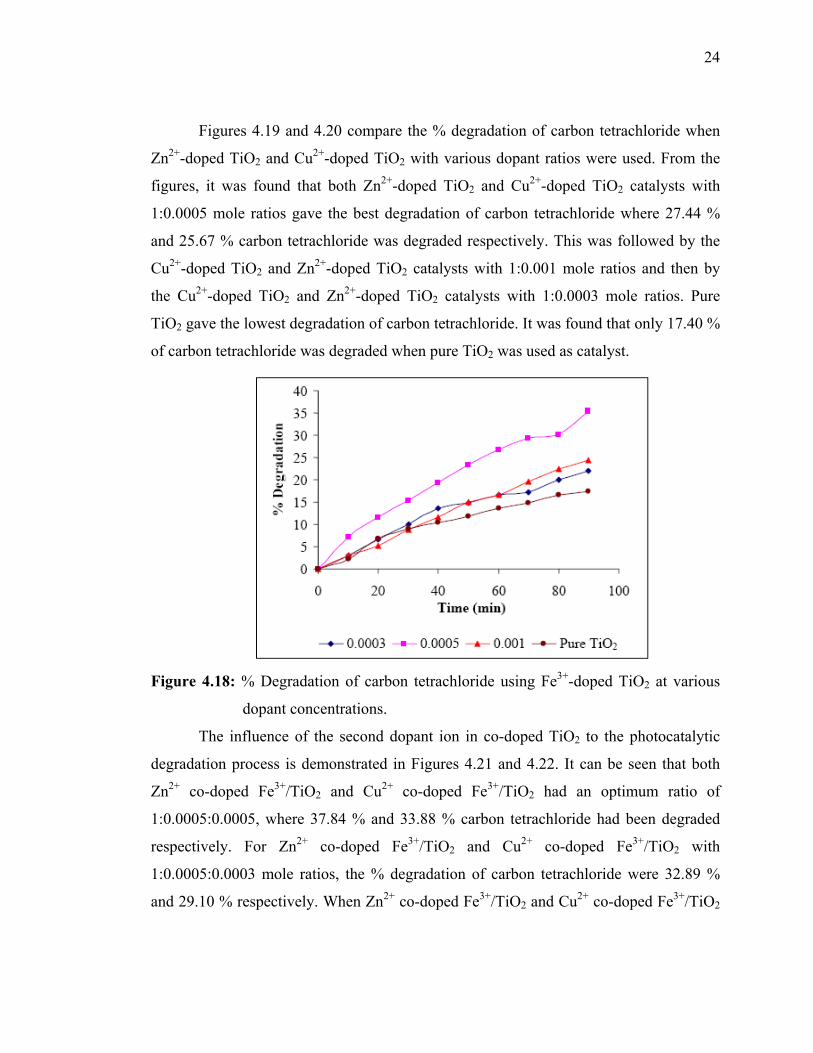
Figure 4.18 depicts the photocatalytic degradation of carbon tetrachloride using
Fe3+-doped TiO2. It can be seen from Figure 4.18 that the optimum dopant ratio for the
degradation of carbon tetrachloride was 1:0.0005 mole ratio, with 35.42 % carbon
tetrachloride degraded. This was followed by Fe3+-doped TiO2 with 1:0.001 and
1:0.0003 mole ratio and finally pure TiO2.
24
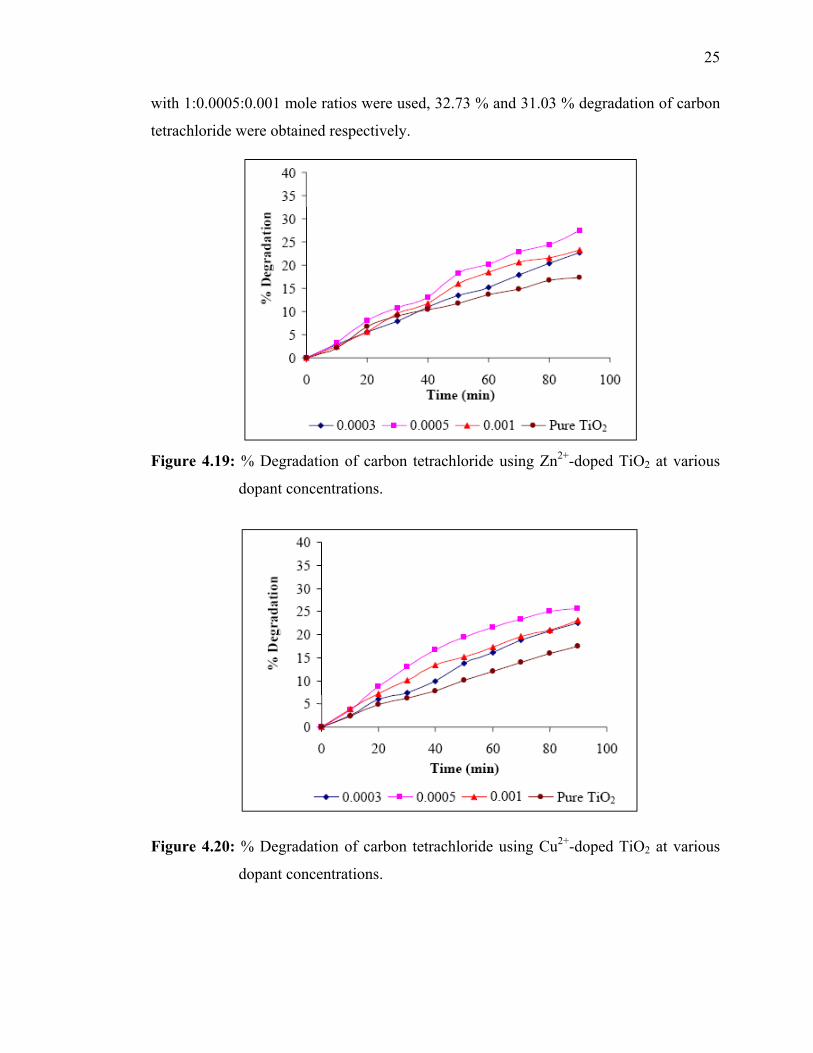
Figures 4.19 and 4.20 compare the % degradation of carbon tetrachloride when
Zn2+-doped TiO2 and Cu2+-doped TiO2 with various dopant ratios were used. From the
figures, it was found that both Zn2+-doped TiO2 and Cu2+-doped TiO2 catalysts with
1:0.0005 mole ratios gave the best degradation of carbon tetrachloride where 27.44 %
and 25.67 % carbon tetrachloride was degraded respectively. This was followed by the
Cu2+-doped TiO2 and Zn2+-doped TiO2 catalysts with 1:0.001 mole ratios and then by
the Cu2+-doped TiO2 and Zn2+-doped TiO2 catalysts with 1:0.0003 mole ratios. Pure
TiO2 gave the lowest degradation of carbon tetrachloride. It was found that only 17.40 %
of carbon tetrachloride was degraded when pure TiO2 was used as catalyst.
Figure 4.18: % Degradation of carbon tetrachloride using Fe3+-doped TiO2 at various
dopant concentrations.
The influence of the second dopant ion in co-doped TiO2 to the photocatalytic
degradation process is demonstrated in Figures 4.21 and 4.22. It can be seen that both
Zn2+ co-doped Fe3+/TiO2 and Cu2+ co-doped Fe3+/TiO2 had an optimum ratio of
1:0.0005:0.0005, where 37.84 % and 33.88 % carbon tetrachloride had been degraded
respectively. For Zn2+ co-doped Fe3+/TiO2 and Cu2+ co-doped Fe3+/TiO2 with
1:0.0005:0.0003 mole ratios, the % degradation of carbon tetrachloride were 32.89 %
and 29.10 % respectively. When Zn2+ co-doped Fe3+/TiO2 and Cu2+ co-doped Fe3+/TiO2
25
with 1:0.0005:0.001 mole ratios were used, 32.73 % and 31.03 % degradation of carbon
tetrachloride were obtained respectively.
Figure 4.19: % Degradation of carbon tetrachloride using Zn2+-doped TiO2 at various
dopant concentrations.
Figure 4.20: % Degradation of carbon tetrachloride using Cu2+-doped TiO2 at various
dopant concentrations.

26
Figure 4.21: % Degradation of carbon tetrachloride using Zn2+ co-doped Fe3+/TiO2 at
various dopant concentrations.
Figure 4.22: % Degradation of carbon tetrachloride using Cu2+ co-doped Fe3+/TiO2 at
various dopant concentrations.
In a typical photocatalytic degradation experiment, the high degree of
recombination between photogenerated holes and electrons was a major limiting factor
controlling the photocatalytic degradation efficiency. Below the optimum dopant ratio,

27
the addition of metals as dopant can promote interfacial charge transfer process through
the Equation 1.1 - 1.2. This migration of the generated electron to the metal particles can
increase the lifetime of the holes and suppress electron-hole recombination and
consequently, be beneficial for the photocatalytic degradation processes.
However, when the concentrations of dopants ion are above the optimum dopant
ratio, photocatalytic activity decreases and this can be seen in Figures 4.2 - 4.22. This
means that heavy doping may result in the dopant atoms becoming recombination
centres, thus reducing the photocatalytic efficiency. Besides, the detrimental effect of
high metal ion concentrations on the degradation rate also can be explained by several
factors. In a photocatalytic degradation process, the •OH radicals exist in the catalyst are
used to degrade the pollutants. When the concentrations of dopants ion are above the
optimum dopant ratio, the metallic species can reoxidize the reduced metal ions by •OH
radicals or h+ (Eq. 4.1-4.2), forcing the reducing amount of •OH radicals to degrade the
pollutants. The large number of metallic species will also compete with oxygen to react
with generated electrons, consequently reducing the formation of •OH through Equation
4.3 - 4.8 (Litter, 1999). In the review of heterogeneous photocatalysis done by Litter in
1999, Litter noted another reason for the deleterious effect of high concentrations of
Cu2+, Ni2+ and Fe2+ was the filter effect due to UV light absorption of the species.
4.4 Effects of Metal Ions (Mn+)
In a photocatalytic degradation process, photogenerated electrons and holes will
recombine; therefore suppressing the recombination of electron-hole pairs and
prolonging the lifetime of carriers are essential for improving the efficiency of the

28
catalyst. For this reason, various studies have been carried out to increase the lifetime of
the carriers and one such method employs transition metals as dopants.
Figure 4.23 shows the % degradation of dichloromethane using Cu2+, Zn2+, Mn2+,
Fe2+, Fe3+-doped TiO2, Zn2+ co-doped Fe3+/TiO2, Cu2+ co-doped Fe3+/TiO2 and undoped
TiO2 as catalysts. The photocatalytic degradation of dichloromethane was significantly
better with Zn2+ co-doped Fe3+/TiO2 (41.05 %) compared to other doped and pure TiO2
catalysts. This was followed by Cu2+ co-doped Fe3+/TiO2 and then Fe3+- doped TiO2. It
was found that the addition of co-dopants resulted in better degradation of
dichloromethane if compared with the addition of Zn2+ and Fe3+ or Cu2+ and Fe3+ alone.
However, the addition of Cu2+, Zn2+ and Fe3+ had increased the TiO2
photoactivity. 36.02 % of CH2Cl2 were degraded when Fe3+-doped TiO2 was used in the
photocatalytic degradation process, 34.89 % and 34.30 % dichloromethane was
degraded with Zn2+ and Cu2+-doped TiO2 respectively. Besides, Fe2+-doped TiO2 had
increased the degradation of dichloromethane if compared with pure TiO2 in which
33.79 % degradation of dichloromethane was obtained. However, addition of Mn2+
decreased the degradation of dichloromethane. When pure TiO2 was used during the
photocatalytic degradation process, only 20.93 % CH2Cl2 was degraded.
Figure 4.24 indicates the % degradation of chloroform using Cu2+, Zn2+, Mn2+,
Fe2+, Fe3+-doped TiO2, Cu2+ co-doped Fe3+/TiO2, Zn2+ co-doped Fe3+/TiO2 and undoped
TiO2 as catalysts. It shows that Cu2+, Zn2+, Fe2+, Fe3+-doped TiO2, Cu2+ co-doped
Fe3+/TiO2 and Zn2+ co-doped Fe3+/TiO2 give better degradation of chloroform than pure
TiO2. Meanwhile, Mn2+-doped TiO2 showed poor degradation in the photocatalytic
degradation of chloroform, with only 19.57 % chloroform was degraded. Zn2+ co-doped
Fe3+/TiO2 showed the best level of chloroform degradation among all doped TiO2
catalysts that were used in the photocatalytic degradation processes. From Figure 4.24, it
can be noticed that addition of Zn2+ and Fe3+ as co-dopant into TiO2 enhanced the
degradation efficiency of TiO2 from 23.87 % to 49.45 %. Fe3+-doped TiO2 catalyst gave
lower degradation of chloroform if compared with Zn2+ co-doped Fe3+/TiO2 but slightly
higher than Cu2+ co-doped Fe3+/TiO2.

29
Figure 4.23: % Degradation of dichloromethane using Cu2+, Zn2+, Mn2+, Fe2+, Fe3+-
doped TiO2, Cu2+ co-doed Fe3+/TiO2, Zn2+ co-doped Fe3+/TiO2 and
undoped TiO2 as catalysts.
Figure 4.25 depicts the % degradation of carbon tetrachloride using Cu2+, Zn2+,
Mn2+, Fe2+, Fe3+-doped TiO2, Cu2+ co-doped Fe3+/ TiO2, Zn2+ co-doped Fe3+/TiO2 and
undoped TiO2 as catalysts. Among all doped, co-doped and pure TiO2, Zn2+ co-doped
Fe3+/TiO2 showed the best photocatalytic activity where 37.84 % carbon tetrachloride
was degraded. This was followed by Fe3+-doped TiO2 and then Cu2+ co-doped
Fe3+/TiO2. Photocatalytic degradation of carbon tetrachloride using Fe2+ and Fe3+-doped
TiO2 as catalysts were slightly slower than that of chloroform, which was 20.80 % and
35.42 % respectively. The addition of Cu2+ and Zn2+ increased the degradation of carbon
tetrachloride, with 25.67 % and 27.44 % carbon tetrachloride degraded. However, pure
TiO2 showed higher photocatalytic degradation of carbon tetrachloride than using Mn2+-
doped TiO2 as catalysts.
4.4.1 Effect of Zn2+/Fe3+/TiO2
In the photocatalytic degradation process, a good dopant must be able to act as
both electron and hole trap, so that the recombination process between photogenerated

30
Figure 4.24: % Degradation of chloroform using Cu2+, Zn2+, Mn2+, Fe2+, Fe2+-doped
TiO2, Cu2+ co-doped Fe3+/TiO2, Zn2+ co-doped Fe3+/TiO2 and undoped
TiO2 as catalysts.
electrons and holes can be suppressed, thus increasing the photoactivity of the catalyst
(Eq. 1.1 and 1.2). From Figures 4.23-4.25, it can be observed that Zn2+ co-doped
Fe3+/TiO2, Fe3+-doped TiO2 and Cu2+ co-doped Fe3+/TiO2 showed better degradation of
dichloromethane, chloroform and carbon tetrachloride than Cu2+, Zn2+, Mn2+, Fe2+, Fe3+-
doped TiO2. An increase in the photocatalytic activity is observed in the case of Zn2+
codoped Fe3+/TiO2. Such an improvement implies that there is a synergistic effect in
photocatalytic activity when both Fe3+ and Zn2+ are co-doped into TiO2. The effect may
be explained by the cooperative operation of the Fe3+ and Zn2+ in trapping charge
carriers and mediating interfacial charge transfer process. Zn2+ and Fe3+ dopants in TiO2
can be randomly dispersed on the TiO2 surface in the form of their oxides (Yuan, 2002).

31
Figure 4.25: % Degradation of carbon tetrachloride using Cu2+, Zn2+, Mn2+, Fe2+, Fe3+-
doped TiO2, Cu2+ co-doped Fe3+/TiO2, Zn2+ co-doped Fe3+/TiO2 and
undoped TiO2 as catalysts.
Due to the difference in the energy band position, the dispersed oxides on the
TiO2 surface will involve some charges transfer between them and TiO2 during
illumination. The valence band of TiO2 is lower than ZnO but the conduction band of
TiO2 is higher than Fe2O3, so the photogenerated holes can move into ZnO while the
photogenerated electrons can move into Fe2O3. Since Zn2+ co-doped Fe3+/TiO2 can trap
electrons and holes, it is not surprising that its photoactivity is higher.
4.4.2 Effect of Fe3+/TiO2
The Fe3+/Fe4+ energy level lies within the band gap, however the Fe2+/Fe3+
energy level is closed to the conduction band. Therefore, Fe3+ can act as both electron
and hole traps as shown in Equation 4.9 and 4.10.

32
This process reduces the recombination rate of holes and electrons and thus
enhances the photoactivity of Fe3+. Besides, the trapped hole embodied in Fe4+ also can
oxidize the VOCs.
4.4.3 Effect of Cu2+/Fe3+/TiO2
In the photocatalytic degradation process, the usage of Cu2+ co-doped Fe3+/TiO2
as catalyst resulted in a better degradation of the studied VOCs compared to single
dopant catalysts except for Fe3+-doped TiO2. Since the valence band of TiO2 is lower
than the energy band for Fe3+/Fe4+ while the conduction band of TiO2 is higher than the
energy band for Cu2+/Cu0, therefore, Fe3+ will trap photogenerated holes to form Fe4+
while Cu2+ will trap the photogenerated electrons. (Refer Figure 1.2). As a consequence,
the recombination rate between photogenerated holes and electrons can be suppressed
and the photoactivity of Cu2+/Fe3+/TiO2 becomes higher.
4.4.4 Effect of Mn2+/TiO2
In the photocatalytic degradation of under studied VOCs, addition of Zn2+, Cu2+,
Mn2+ and Fe2+ gave lower degradation of dichloromethane, chloroform and carbon
tetrachloride than Cu2+ co-doped Fe3+/TiO2, Zn2+ co-doped Fe3+/TiO2 and Fe3+-doped
TiO2. As stated earlier, a good dopant must be able to trap photogenerated electrons and
holes. Zn2+, Cu2+, Mn2+ and Fe2+ were unable to act as electron and hole traps, so the
photoactivity was lower. An experiment on phenol degradation using Zn2+, Mn2+, Fe3+,
Co3+, Cr3+, Ce3+, Al3+, Li+ and Pt0-doped TiO2 as catalyst was conducted (Brezova,
1997). They reported that Mn2+ inhibited the degradation of phenol. Mn2+ is the most
stable oxidation state of manganese. When Mn2+ loses an electron to a hole, Mn3+ will be
created. Since the energy difference between Mn2+ and Mn3+ is small, so this electron
transfer process is not desirable. Therefore, the separation of the photogenerated electron
and hole is not effective, and as a consequence, photocatalytic degradation of under
studied VOCs was poor.

33
4.4.5 Effect of Cu2+/TiO2
The presence of transition metal ions in photocatalytic reactions was reviewed
(Litter, 1999). It was found that Cu2+ can act positively or negatively depending on the
concentration; large amounts of Cu2+ will be detrimental. The result obtained gives good
agreement with this statement since in the photocatalytic degradation of
dichloromethane, chloroform and carbon tetrachloride, the usage of Cu2+ as dopant
enhanced the photocatalytic activity although the photocatalytic activity was lower than
Cu2+ co-doped Fe3+/TiO2, Zn2+ co-doped Fe3+/ TiO2 and Fe3+-doped TiO2. Cu2+ only can
trap the electrons to form Cu+ and then Cu0 (Eq. 4.11).
However, Cu2+ is unable to trap photogenerated holes, as a result, the
degradations of dichloromethane, chloroform and carbon tetrachloride were lower than
the catalysts with dopant which can trap electrons and holes.
4.4.6 Effect of Fe2+/TiO2
According to Figure 1.2, the energy level for Fe2+/Fe3+ is closed to the
conduction band, so Fe2+ is expected to trap photogenerated holes to form Fe3+ during
the photocatalytic degradation process. Since Fe2+ is unable to trap electrons, therefore,
the photoactivity of Fe2+-doped TiO2 was lower than Cu2+ co-doped Fe3+/TiO2, Zn2+
codoped Fe3+/ TiO2 and Fe3+-doped TiO2.
4.4.7 Effect of Zn2+/TiO2
The effect of Zn2+-doped TiO2, Fe2+-doped TiO2 and Zn2+ co-doped Fe3+/TiO2 in
the degradation of phenol had been studied (Yuan, 2002). It was found that Zn2+-doped
TiO2 showed higher degradation of phenol than pure TiO2 but lower than Zn2+ co-doped
Fe3+/TiO2. However, when photocatalytic degradation of dichloromethane, chloroform
and carbon tetrachloride was conducted, it was noticed that in comparison with pure
TiO2, Zn2+ co-doped Fe3+/TiO2 and TiO2 doping with Zn2+, Zn2+-doped TiO2 can slightly

34
improve the photocatalytic degradation but the % degradation was lower than Zn2+ co-
doped Fe3+/TiO2. Zn2+ dopant in TiO2 can be randomly dispersed on the TiO2 surface in
the form of zinc oxides. These oxides which dispersed on the TiO2 surface can involve
some charges transfer between them and TiO2 during illumination due to the difference
in the energy band position. As the valence band of TiO2 is lower than that of ZnO,
therefore, the photogenerated holes can be transferred from TiO2 to ZnO. As a result,
charge separation of the photogenerated carriers can be promoted and enhanced the
photocatalytic activity of Zn2+/TiO2 (Yuan, 2002).
It can be concluded from the above observations (Figure 4.23, 4.24, 4.25) that a
dopant can give different effects to different VOCs. Zn2+ co-doped Fe3+/TiO2 seems to
be more suitable for the photocatalytic degradation of dichloromethane, chloroform and
carbon tetrachloride than other doped and undoped TiO2 in this study. Meanwhile, Mn2+-
doped TiO2 was found to be detrimental to the photocatalytic degradation of
dichloromethane, chloroform and carbon tetrachloride.
4.5 Effect of VOCs
It was found that different VOCs will have different levels of degradation
although the same catalyst was used in the photocatalytic degradation experiment. In this
study, dichloromethane, chloroform and carbon tetrachloride had been chosen for the
studies. Table 4.4 depicted the % degradation of dichloromethane, chloroform and
carbon tetrachloride when doped and undoped TiO2 were used. From Table 4.4, some
differences in the levels of degradation of chloroform, dichloromethane and carbon
tetrachloride were found. It can be seen that the rate of degradation of the studied
chlorinated hydrocarbons follows the order: CHCl3 > CH2Cl2 > CCl4. It is reported that
chloroform will show Cl• sensitized degradation when its concentration was above 500
ppm (Feiyen, 2002). Since the concentration of chloroform that was used in the
photocatalytic degradation process was more than 500 ppm, the degradation of
chloroform was expected to undergo Cl• sensitized degradation (Eq. 4.13- 4.14).

35
Dichloromethane was expected to undergo Cl• sensitized degradation since its
structure is quite similar to chloroform. However, when photocatalytic degradation
experiments using dichloromethane and chloroform were conducted, chloroform showed
higher levels of degradation than dichloromethane. This can be explained by the
different number of chlorine atoms in both dichloromethane and chloroform. Since
dichloromethane has 2 chlorine atoms in its structure, Cl• sensitized degradation was
lower than in the degradation of chloroform which has 3 chlorine atoms in its structure.
Carbon tetrachloride showed the lowest levels of degradation in this study. Carbon
tetrachloride is a stable compound, in that chlorine radicals do not attack the C-Cl bond,
hence a Cl• sensitized degradation does not happen in carbon tetrachloride.
Table 4.4: % Degradation of dichloromethane, chloroform and carbon tetrachloride
using doped and pure TiO2 at 90 minutes.

36
4.6 Photocatalytic Degradation of Chloroform / Carbon Tetrachloride Mixtures
Although photocatalytic degradation of chloroform and carbon tetrachloride had
been studied extensively, however, these studies are only limited to single contaminant
feed. In a real industrial application, chlorinated VOCs are found in mixture. Therefore,
photocatalytic degradation of chloroform and carbon tetrachloride mixtures had been
carried out in this study. Only the best catalyst (Zn2+/Fe3+/TiO2) was used in the
photocatalytic degradation of the mixture. The initial concentration of chloroform used
in the photocatalytic degradation process was 222 ppm for low and 528 ppm for high
concentration of chloroform. Meanwhile, the initial concentration of carbon tetrachloride
used in the photocatalytic degradation process was 203 ppm for low and 427 ppm for
high concentration.
Studies the effect of adding carbon tetrachloride into the chloroform
photocatalytic degradation process is shown in Figure 4.27. This figure depicts the %
degradation of carbon tetrachloride and chloroform mixture using Zn2+/Fe3+/TiO2 as
catalyst. In the photocatalytic degradation process, two observations can be made. First,
when the chloroform and carbon tetrachloride mixture was degraded, chloroform gave
higher % degradation than carbon tetrachloride. Second, when the concentration of
chloroform and carbon tetrachloride increased, the % degradation of both chloroform
and carbon tetrachloride was decreased.
For low concentration of mixture, it was noted that 50.89 % and 43.87 % of
chloroform and carbon tetrachloride were degraded respectively at 90 minutes.
However, for high concentration of mixture, only 43.85 % and 35.32 % of chloroform
and carbon tetrachloride was degraded respectively at 90 minutes. This indicates the
dependency of photocatalytic activity on the concentration of VOCs. In the
photocatalytic degradation process, the amount of chloroform and carbon tetrachloride
being degraded depends on the amount of hydroxyl radicals on the catalyst, which in
turn depends on the number of holes generated on the catalyst. With a higher
concentration of chloroform and carbon tetrachloride mixture, the generated hydroxyl
radicals are insufficient to degrade the chloroform and carbon tetrachloride. On the other

37
hand, with lower concentration of the mixture, more chloroform and carbon tetrachloride
can be degraded. Consequently, the % degradation of the mixture is higher.
According to Figure 4.27, the degradation of chloroform was higher than carbon
tetrachloride. During illumination using the UV lamp, Cl• radicals were formed since the
mixture contained chloroform and carbon tetrachloride (Eq. 4.14 and 4.15). The Cl•
radicals do not attack C-Cl bonds in carbon tetrachloride, therefore, Cl• radicals formed
during the illumination of UV lamp (Eq.4.15) may contribute to the degradation of
chloroform; consequently, more chloroform was degraded.
Figure 4.27: % Degradation of chloroform and carbon tetrachloride mixture at 90
minutes using Zn2+/Fe3+/TiO2 as catalyst.
4.7 Kinetics Study
The photocatalytic degradation rate of dichloromethane, carbon tetrachloride and
chloroform using doped and undoped TiO2 depends on the adsorbed concentration of
each gas sample. In general, the kinetics of photocatalytic degradation would follow the
Langmuir-Hinshelwood kinetics model (Kim, 2002). Besides, this model has been
shown to provide a quantitative kinetic treatment of many solid-gas reactions (Pichat,

38
2000). Since the photocatalytic degradation rates of dichloromethane, carbon
tetrachloride and chloroform involved solid-gas reactions, therefore model L-H was
suitable to be used in this study.
Figure 4.28 describes the reciprocal initial rate, 1/r0 versus reciprocal initial
concentration, 1/C0 for photocatalytic degradation of dichloromethane. The plots for the
chloroform and carbon tetrachloride are shown in Figure 4.29 and 4.30 respectively. The
rate (mole L-1min-1) was calculated for the first 10 minutes of the photoillumination
process. A linear plot of reciprocal initial rate versus reciprocal initial concentration
(Figure 4.28, 4.29, 4.30) indicates a good fitting of the L-H model to the experimental
data thus confirming the L-H nature of the photocatalytic degradation reaction. Figure
4.28 shows that the initial degradation rate resulting from Fe3+-doped TiO2 was lower
than Mn2+, Fe2+-doped TiO2 and pure TiO2. Although the initial rate of Fe3+-doped TiO2
was lower than other sample catalysts, the amount of dichloromethane degraded was
higher. This was also found to be the case in the degradation of dichloromethane using
Zn2+/Fe3+/TiO2 as catalyst. The initial rate of Zn2+/Fe3+/TiO2 was the lowest among all
sample catalysts but the yield of degradation was the highest.
Figure 4.28: 1/r0 versus 1/C0 plot for dichloromethane degradation.

39
Figure 4.29 indicates the plot of reciprocal initial rate, 1/r0 versus reciprocal
initial concentration, 1/C0 for chloroform. According to Figure 4.29, Zn2+/Fe3+/TiO2 had
the lowest initial degradation rate and this was followed by Zn2+/TiO2. Meanwhile,
Mn2+/TiO2 had the highest initial rate but the % degradation of chloroform using
Mn2+/TiO2 was the lowest.
Figure 4.30 shows the plot of reciprocal initial rate, 1/r0 versus reciprocal initial
concentration, 1/C0 for carbon tetrachloride. For carbon tetrachloride degradation, the
catalyst with the highest initial degradation rate was pure TiO2 while the catalyst with
lowest initial rate was Cu2+/Fe3+/TiO2. It was found that pure TiO2 had the highest initial
rate. However, the degradation of carbon tetrachloride using doped TiO2 was higher than
pure TiO2 except for Mn2+/TiO2. This indicates that the photocatalytic degradation
process with high initial rate does not necessary lead to high degradation of VOCs.
Figure 4.29: 1/r0 versus 1/C0 plot for chloroform degradation.
The kinetic parameters k and K were obtained from the intercept of the curve
with the x-axis and the slope respectively. Table 4.5, 4.6 and 4.7 depict the obtained
equations, the k and K values for the degradation of dichloromethane, chloroform and

40
carbon tetrachloride respectively using doped and undoped TiO2 as catalyst. By
substituting the k and K values into Equation 1.8, the relationship between r0 and C0 is
obtained.
Figure 4.30: 1/r0 versus 1/C0 plot for carbon tetrachloride degradation.
It is interesting to note that the photocatalytic degradation rate is related to k and
K values; therefore, a higher adsorption constant does not always result in a higher
reaction rate. Although it could be thought that a high rate constant leads to a rapid
reaction, the reaction rate based on the Langmuir- Hinsshelwood kinetic model (Eq. 1.8)
depends simultaneously on k and K. As an example, carbon tetrachloride degradation
using Fe3+-doped TiO2 had a higher adsorption constant than Fe2+-doped TiO2 but the
reaction rate of Fe3+-doped TiO2 was lower than carbon tetrachloride degradation using
Fe2+-doped TiO2, consequently, the multiplied products of k and K of Fe3+-doped TiO2
was higher than that of Fe2+-doped TiO2 (Table 4.7).
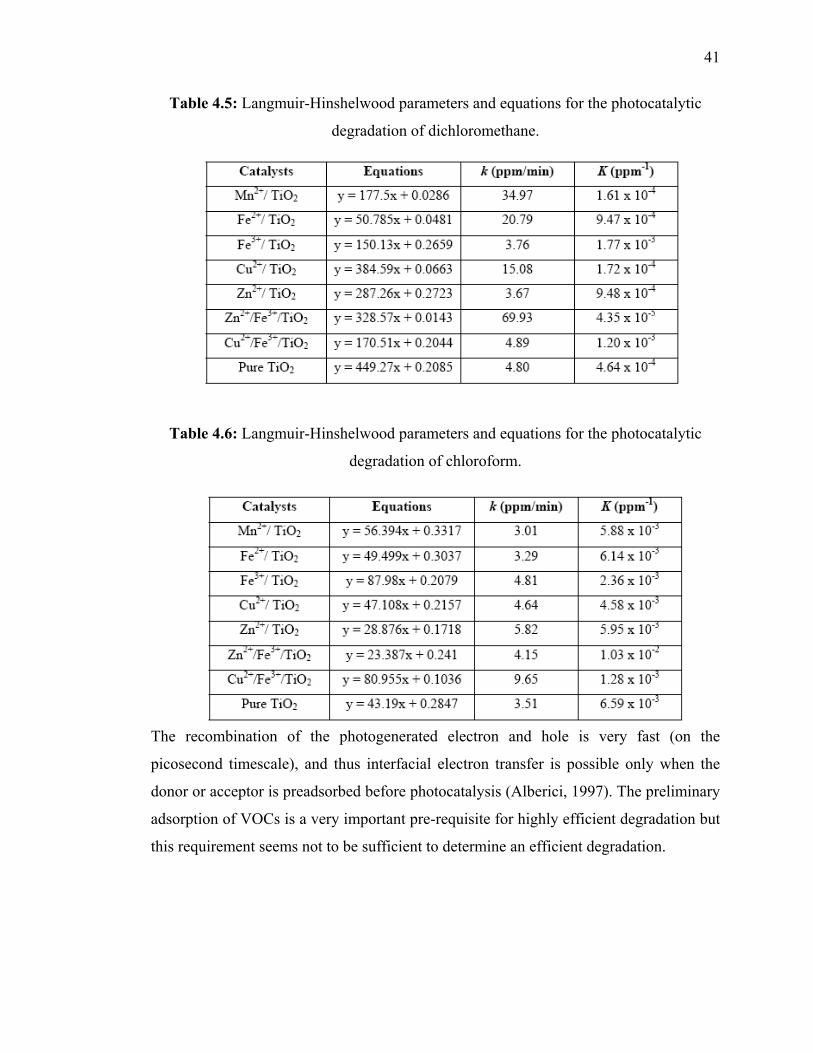
41
Table 4.5: Langmuir-Hinshelwood parameters and equations for the photocatalytic
degradation of dichloromethane.
Table 4.6: Langmuir-Hinshelwood parameters and equations for the photocatalytic
degradation of chloroform.
The recombination of the photogenerated electron and hole is very fast (on the
picosecond timescale), and thus interfacial electron transfer is possible only when the
donor or acceptor is preadsorbed before photocatalysis (Alberici, 1997). The preliminary
adsorption of VOCs is a very important pre-requisite for highly efficient degradation but
this requirement seems not to be sufficient to determine an efficient degradation.
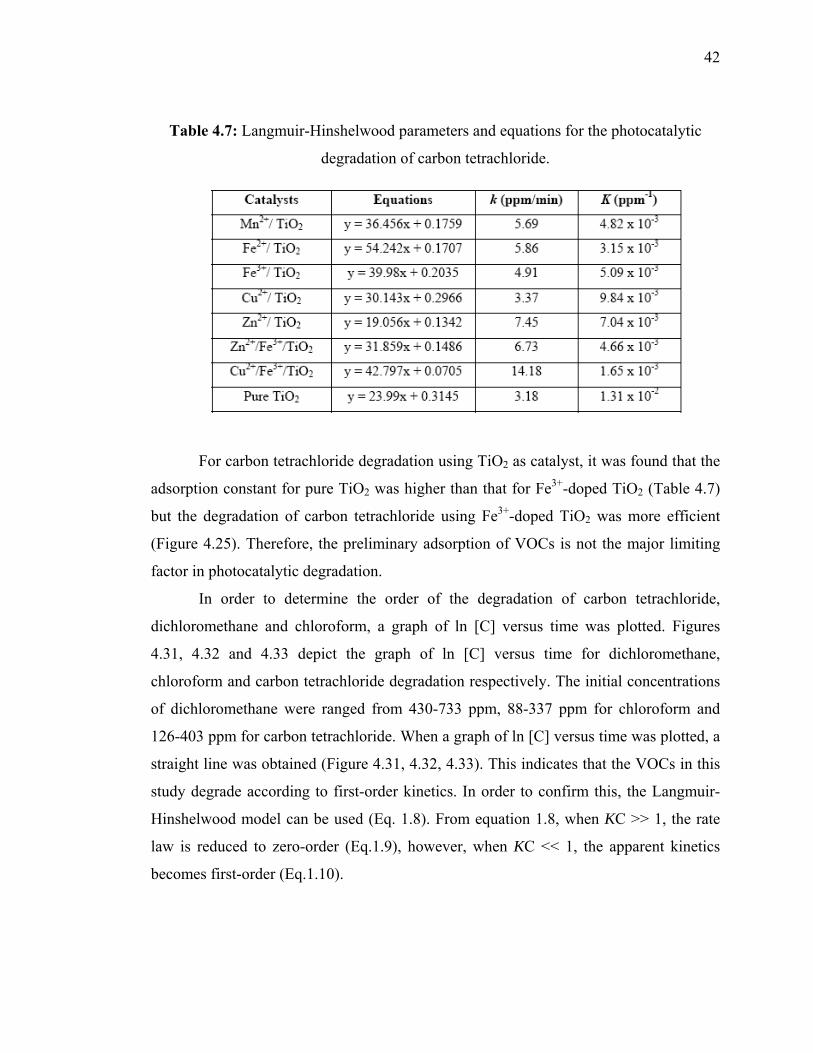
42
Table 4.7: Langmuir-Hinshelwood parameters and equations for the photocatalytic
degradation of carbon tetrachloride.
For carbon tetrachloride degradation using TiO2 as catalyst, it was found that the
adsorption constant for pure TiO2 was higher than that for Fe3+-doped TiO2 (Table 4.7)
but the degradation of carbon tetrachloride using Fe3+-doped TiO2 was more efficient
(Figure 4.25). Therefore, the preliminary adsorption of VOCs is not the major limiting
factor in photocatalytic degradation.
In order to determine the order of the degradation of carbon tetrachloride,
dichloromethane and chloroform, a graph of ln [C] versus time was plotted. Figures
4.31, 4.32 and 4.33 depict the graph of ln [C] versus time for dichloromethane,
chloroform and carbon tetrachloride degradation respectively. The initial concentrations
of dichloromethane were ranged from 430-733 ppm, 88-337 ppm for chloroform and
126-403 ppm for carbon tetrachloride. When a graph of ln [C] versus time was plotted, a
straight line was obtained (Figure 4.31, 4.32, 4.33). This indicates that the VOCs in this
study degrade according to first-order kinetics. In order to confirm this, the Langmuir-
Hinshelwood model can be used (Eq. 1.8). From equation 1.8, when KC >> 1, the rate
law is reduced to zero-order (Eq.1.9), however, when KC << 1, the apparent kinetics
becomes first-order (Eq.1.10).
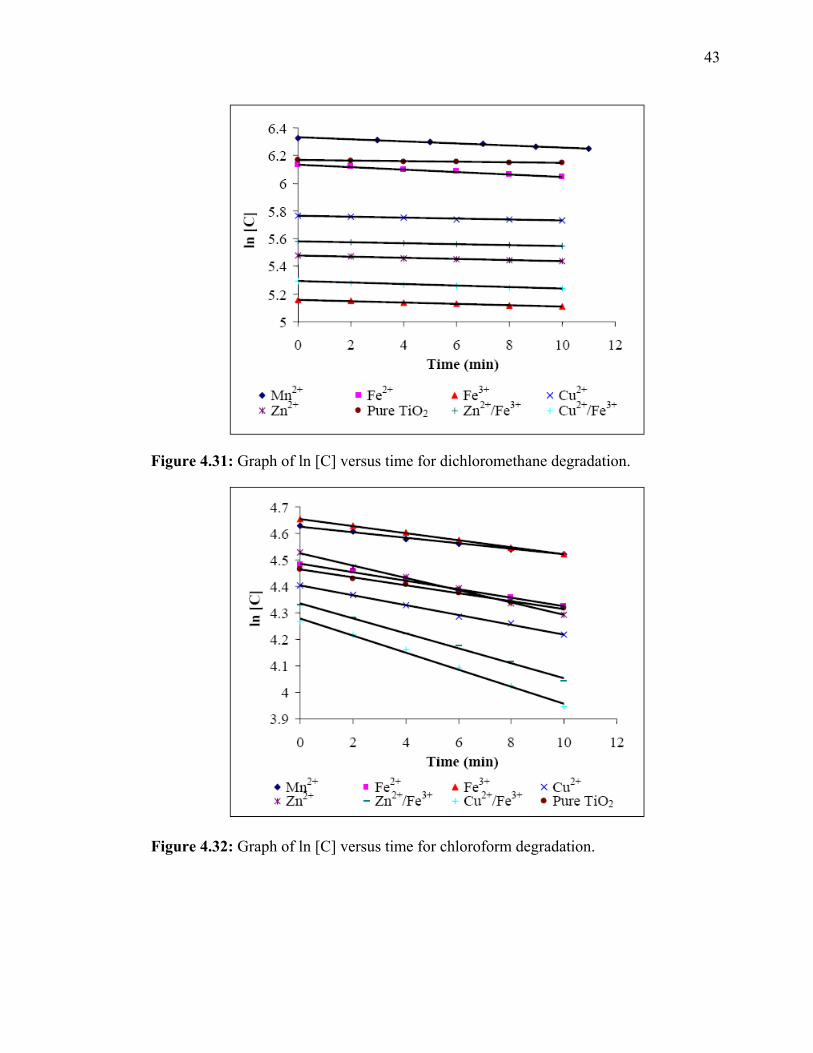
43
Figure 4.31: Graph of ln [C] versus time for dichloromethane degradation.
Figure 4.32: Graph of ln [C] versus time for chloroform degradation.
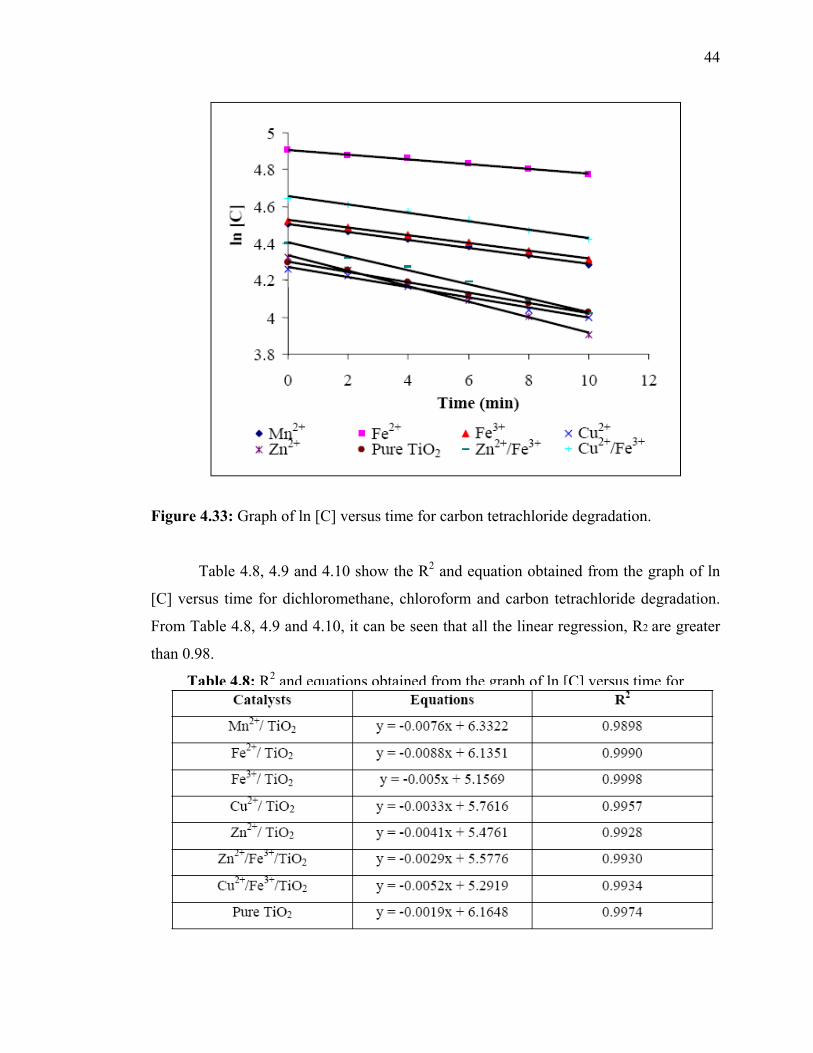
44
Figure 4.33: Graph of ln [C] versus time for carbon tetrachloride degradation.
Table 4.8, 4.9 and 4.10 show the R2 and equation obtained from the graph of ln
[C] versus time for dichloromethane, chloroform and carbon tetrachloride degradation.
From Table 4.8, 4.9 and 4.10, it can be seen that all the linear regression, R2 are greater
than 0.98.
Table 4.8: R2 and equations obtained from the graph of ln [C] versus time for
dichloromethane.
Table 4.9: R2 and equations obtained from the graph of ln [C] versus time for
chloroform.
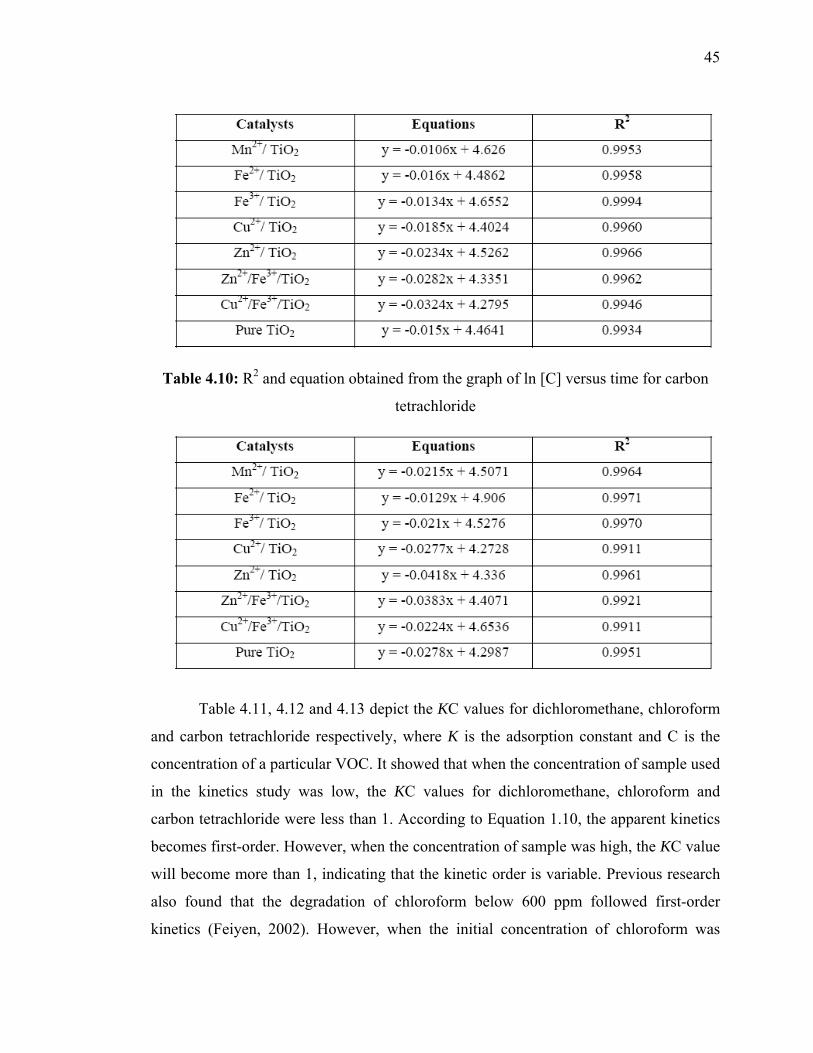
45
Table 4.10: R2 and equation obtained from the graph of ln [C] versus time for carbon
tetrachloride
Table 4.11, 4.12 and 4.13 depict the KC values for dichloromethane, chloroform
and carbon tetrachloride respectively, where K is the adsorption constant and C is the
concentration of a particular VOC. It showed that when the concentration of sample used
in the kinetics study was low, the KC values for dichloromethane, chloroform and
carbon tetrachloride were less than 1. According to Equation 1.10, the apparent kinetics
becomes first-order. However, when the concentration of sample was high, the KC value
will become more than 1, indicating that the kinetic order is variable. Previous research
also found that the degradation of chloroform below 600 ppm followed first-order
kinetics (Feiyen, 2002). However, when the initial concentration of chloroform was

46
above 600 ppm, the reaction seemed to follow second-order kinetics with respect to
chloroform concentration, indicating a possible change in the mechanism. From Table
4.13, it can be noticed that the KC value for degradation of carbon tetrachloride using
pure TiO2 and Cu2+/TiO2 is 0.92 and 0.70 respectively, which is higher than other
sample catalysts. This is due to the adsorption constant (K) for pure TiO2 and Cu2+/TiO2
are very high, consequently, the resulted KC values also become high. This indicates that
not only the concentration of sample will result in the change of the mechanism but also
the adsorption of the sample on the catalyst.
Table 4.11: KC values for dichloromethane.
Table 4.12: KC values for chloroform.
Table 4.13: KC values for carbon tetrachloride.

47
4.8 Model for the Photocatalytic Degradation of Chlorinated Hydrocarbons
When photocatalytic degradation of VOCs was conducted, the information
obtained from the use of GC-MS can be used to predict the possible model of the
photocatalytic degradation process. Table 4.14, 4.15 and 4.16 show the fragments
obtained before and after illumination of UV light for dichloromethane, chloroform and
carbon tetrachloride respectively. The fragments were analyzed using the integral form
of the GC-MS spectra. Appendix E, F and G show the integral form of the GC-MS
spectra for photocatalytic degradation of dichloromethane, chloroform and carbon
tetrachloride respectively.
4.8.1 Dichloromethane
When photocatalytic degradation of dichloromethane was carried out, fragments
listed in Table 4.14 were obtained. From the information obtained from GC-MS, we may
propose a model for the photocatalytic degradation of dichloromethane as follows:
Chlorine radicals were formed during the illumination of dichloromethane using UV
light. Chlorine radicals were expected to attack CH2Cl2 to initialize the degradation
process (Eq. 4.16).
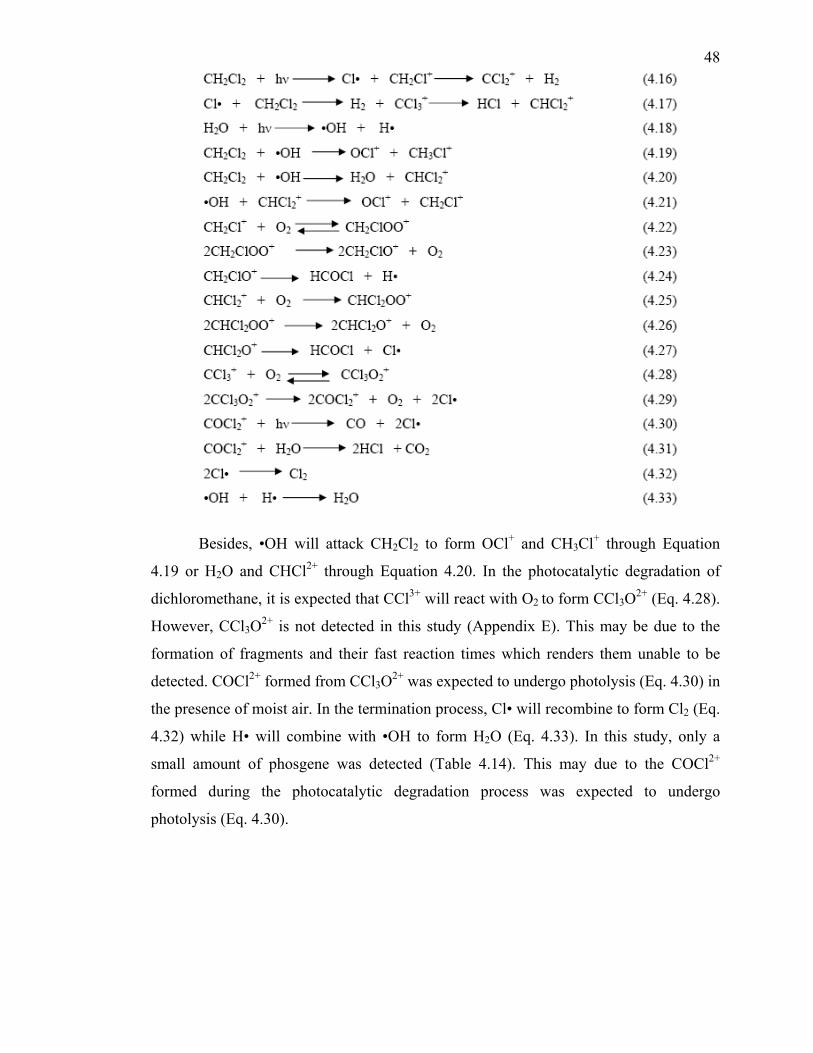
48
Besides, •OH will attack CH2Cl2 to form OCl+ and CH3Cl+ through Equation
4.19 or H2O and CHCl2+ through Equation 4.20. In the photocatalytic degradation of
dichloromethane, it is expected that CCl3+ will react with O2 to form CCl3O2+ (Eq. 4.28).
However, CCl3O2+ is not detected in this study (Appendix E). This may be due to the
formation of fragments and their fast reaction times which renders them unable to be
detected. COCl2+ formed from CCl3O2+ was expected to undergo photolysis (Eq. 4.30) in
the presence of moist air. In the termination process, Cl• will recombine to form Cl2 (Eq.
4.32) while H• will combine with •OH to form H2O (Eq. 4.33). In this study, only a
small amount of phosgene was detected (Table 4.14). This may due to the COCl2+
formed during the photocatalytic degradation process was expected to undergo
photolysis (Eq. 4.30).

49
Table 4.14: Fragments obtained during photocatalytic degradation of dichloromethane.
4.8.2 Chloroform
When photocatalytic degradation of chloroform was conducted, the fragments
listed in Table 4.15 were obtained. A possible model for the photocatalytic degradation
of chloroform is given below. It was discovered that the fragments observed in this study
were quite similar to
those detected in previous research. A research about photodegradation of chloroform
and carbon tetrachloride using a low mercury lamp with 92 % output at 254 nm and 6 %
at 185 nm had been conducted (Feiyen, 2002). No catalyst was used in the
photodegradation process. Fragments such as CHCl2+, CCl3+, CCl3O2+, CHCl2OO+ and
CHCl2O+ was observed in the research (Feiyen, 2002). However, in this study, a light
source from a 6 W black lamp with ~ 354 nm wavelength was used. The catalysts used
in this study were Zn2+/Fe3+/TiO2 and Mn2+/TiO2. The fragments which were not
observed in the research done by Feiyen but are observed in this study are CHCl2+,
CH2Cl+, CCl2+ and OCl+ (Table 4.15).

50
In the presence of UV light, the photocatalytic degradation of chloroform results
in the formation of Cl• and CHCl2+. Then, Cl• and CH2Cl2+ will decompose into CCl2+
and HCl (Eq. 4.34). CH2Cl+formed from the photocatalytic degradation of chloroform
can react with •OH to form CH2Cl+ (Eq. 4.36). CH2Cl+ reacts with •H to form CH3Cl+
through Equation 4.37. The integral form of the GC-MS spectra shows the presence of
CH2Cl+ (Table 4.15).
Table 4.15: Fragments obtained during photocatalytic degradation of chloroform.

51
When chloroform is degraded, it will not only be attacked by Cl• but also •OH to form
H2O and CCl3+ (Eq. 4.39). In the photocatalytic degradation of chloroform, CCl3O2+ is
expected to form from the reaction between O2 and CCl3+ through (Eq. 4.40), however,
CCl3O2+ is not observed in this study. This may be due to the fast formation and reaction
times which renders it unable to be observed. Phosgene formed from CCl3O2+ was
expected to undergo photolysis since the photocatalytic degradation of chloroform was
carried out in ambient conditions which contain moist air, which was reported (Feiyen,
2002) as a prerequisite for the process of phosgene photolysis.
4.8.3 Carbon Tetrachloride
In this study, photocatalytic degradation of carbon tetrachloride using
Zn2+/Fe3+/TiO2 and Mn2+-doped TiO2 as catalyst produced the fragments as listed in
Table 4.16. It can be seen that most of the fragments observed in this study are similar to
those observed in the previous research. However, in this study, some new fragments
such as OCl+, CHCl2+ and CH2Cl+were observed. From the information obtained from
GC-MS, the possible model is presumed to be as follow:

52
During the illumination of UV, the produced Cl• will react with CCl3+ to form
Cl• and CCl2+ (Eq. 4.50). CCl4 can be attacked by •OH to form OCl+ and CHCl3+
(Eq.4.53). The integral form of the GC-MS spectra shows the presence of OCl+ (Table
4.16). Besides, CCl4 can also attacked by H• to form HCl and CCl3+ (Eq. 4.52). CCl3+
produced in the photocatalytic degradation of carbon tetrachloride can react with O2 to
form CCl3O2+ (Eq. 4.54) or react with H• to produce CCl2+ and CHCl2+ (Eq.4.56 and
4.57). However, in this study, CCl3O2+ is unable to be detected. CHCl2+ formed from the
reaction between CCl3+ and H• can react with O2 to form CHCl2OO+ (Eq.4.60).
Unfortunately, CHCl2OO+ is unable to be detected and this may be due to the fast
reaction between CHCl2+ and O2 and the product decomposed to CHCl2O+ and O2. Since
the presence of CHCl2O+ is able to be identified (Table 4.16), therefore, CHCl2OO+ is
presumed to be presence in the photocatalytic degradation of carbon tetrachloride. Table
4.16 shows that only a small amount of phosgene is detected. This may due to the
phosgene is rapidly hydrolyzed to CO2 and HCl in the presence of moisture.
4.9 Characterization
4.9.1 Film Thickness and Refractive Index
The film thickness and refractive index values of all the thin films are given in
Table 4.17.
Table 4.16: Fragments obtained during photocatalytic degradation of carbon
tetrachloride.
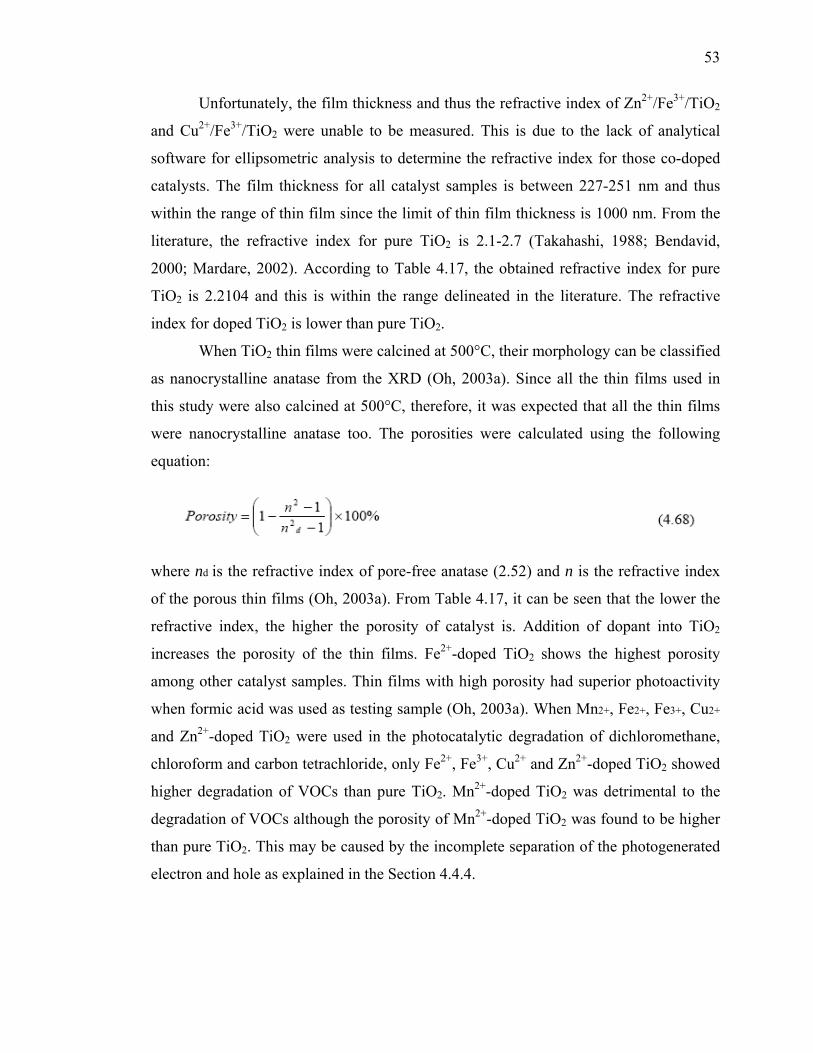
53
Unfortunately, the film thickness and thus the refractive index of Zn2+/Fe3+/TiO2
and Cu2+/Fe3+/TiO2 were unable to be measured. This is due to the lack of analytical
software for ellipsometric analysis to determine the refractive index for those co-doped
catalysts. The film thickness for all catalyst samples is between 227-251 nm and thus
within the range of thin film since the limit of thin film thickness is 1000 nm. From the
literature, the refractive index for pure TiO2 is 2.1-2.7 (Takahashi, 1988; Bendavid,
2000; Mardare, 2002). According to Table 4.17, the obtained refractive index for pure
TiO2 is 2.2104 and this is within the range delineated in the literature. The refractive
index for doped TiO2 is lower than pure TiO2.
When TiO2 thin films were calcined at 500°C, their morphology can be classified
as nanocrystalline anatase from the XRD (Oh, 2003a). Since all the thin films used in
this study were also calcined at 500°C, therefore, it was expected that all the thin films
were nanocrystalline anatase too. The porosities were calculated using the following
equation:
where nd is the refractive index of pore-free anatase (2.52) and n is the refractive index
of the porous thin films (Oh, 2003a). From Table 4.17, it can be seen that the lower the
refractive index, the higher the porosity of catalyst is. Addition of dopant into TiO2
increases the porosity of the thin films. Fe2+-doped TiO2 shows the highest porosity
among other catalyst samples. Thin films with high porosity had superior photoactivity
when formic acid was used as testing sample (Oh, 2003a). When Mn2+, Fe2+, Fe3+, Cu2+
and Zn2+-doped TiO2 were used in the photocatalytic degradation of dichloromethane,
chloroform and carbon tetrachloride, only Fe2+, Fe3+, Cu2+ and Zn2+-doped TiO2 showed
higher degradation of VOCs than pure TiO2. Mn2+-doped TiO2 was detrimental to the
degradation of VOCs although the porosity of Mn2+-doped TiO2 was found to be higher
than pure TiO2. This may be caused by the incomplete separation of the photogenerated
electron and hole as explained in the Section 4.4.4.

54
4.9.2 UV-Visible Spectrum
The absorption spectrum for all optimum ratio metal ions doped TiO2 and
undoped TiO2 were taken using the Shimadzu UV-Vis-NIR Scanning
Spectrophotometer. Figure 4.34 shows the UV-Vis absorption spectrum wavelength in
the range of 300-540 nm for doped and undoped TiO2.
A slight shift to a higher wavelength or red shift was noted for Zn2+ co-doped
Fe3+/TiO2 and Cu2+ co-doped Fe3+/TiO2. This indicates a decrease in band gap value of
the respective catalysts. Meanwhile, Fe2+ and Mn2+-doped TiO2 showed a slight shift to a
lower wavelength or blue shift indicating an increase in the band gap. However, for
Zn2+/TiO2, Fe3+/TiO2 and Cu2+/TiO2, blue shift or red shift is unable to be differentiated
since the absorption are very close (Figure 4.34). Zn2+ co-doped Fe3+/TiO2, Cu2+ co-
doped Fe3+/TiO2, Fe3+-doped TiO2 and Zn2+-doped TiO2 have higher absorbances than
pure TiO2 at the visible region while Mn2+ doped TiO2 and Fe2+ doped TiO2 have lower
absorbances than pure TiO2 at the visible region. At wavelengths below 400 nm, the
absorption increases rather quickly.
The red shift in optical energy gap is considered to be due to the following
factors. The energy level for dopants lies below the conduction band edge (Ecb) and
above valence band edge (Evb) of TiO2. The introduction of such energy levels in the
band gap induces the red shift in the band gap transition and the visible light absorption
through a charge transfer between a dopant and cb (or vb) or a d-d transition in the
crystal field according the energy level. Previous research also found that addition of
Fe3+ into TiO2 had shifted the absorption edge into higher wavelengths (Jiang, 2002).
Table 4.17: Film thickness, refractive index and porosity of doped and undoped TiO2

55
Figure 4.34: UV-Vis absorption spectra for doped and undoped TiO2 thin films.
4.9.3 Determination of Band Gap
The optical band gaps, Eg values for all catalyst samples were determined by
plotting (αhν)1/2 versus the equivalent energy at the wavelength, λ. (Amor, 1998). Since
the thickness of Cu2+ co-doped Fe3+/TiO2 and Zn2+ co-doped Fe3+/TiO2 were unable to
be determined, their α values were not calculated. As a consequence, the Eg for Cu2+
codoped Fe3+/TiO2 and Zn2+ co-doped Fe3+/TiO2 were not determined. Figure 4.35
shows the graph of (αhν)1/2 versus equivalent energy at particular wavelength for Fe3+-
doped TiO2. The graph of (αhν)1/2 versus equivalent energy at particular wavelength for
other thin films can be referred in Appendix H. It is noted that all obtained graphs have a
similar curve. The respective values of Eg can be obtained by extrapolation to (αhν)1/2 =
0. The Eg for all thin films are summarized in Table 4.18.

56
According to Table 4.18, the obtained band gap values are different in
comparison to the well-known value of 3.2 eV for the TiO2 anatase. In this study, the
obtained band gap values are in the range of 3-3.05 eV, which is lower than the normal
value of 3.2 eV but is close to the literature data. Most researchers obtained the indirect
band gap values in the range of 3.05-3.4 eV (Chen, 1999; Mardare, 2000; Abou-
Helal,2002). Also, the obtained indirect band gap values were 3.2, 2.95 and 2.7 eV for
pure, 5 and 10 mole % Pb2+-doped TiO2 respectively (Rahman, 1999). The thin films
were deposited on vitreous silica substrates using the sol-gel dip-coating method. From
Table 4.18, it can be seen that the addition of Fe2+, Fe3+ and Zn2+ increases the Eg value
but the differences are insignificant. On other hand, the Eg values for Mn2+ and Cu2+ are
similar to the ones obtained for pure TiO2. If compared the indirect band gaps as shown
in Table 4.18 with the UV-Vis spectra (Figure 4.34), it can be seen that absorption edges
for some catalysts have been shifted to higher or lower wavelength, however, the
differences in the indirect band gaps between these catalysts and pure TiO2 are
insignificant. As an example, Mn2+/TiO2 has shifted the absorption edge to lower
wavelength, therefore, it is expected that the indirect band gap for Mn2+/TiO2 is higher
than pure TiO2.
However, it is found that the indirect band gap for Mn2+/TiO2 is similar with the
indirect band gap for pure TiO2. This may be due to the difference in film thicknesses
for both catalysts. According to the Equation 3.1, film thickness plays an important role
in the determination of absorption coefficient value (α). When film thickness is different,
the absorption coefficient value will be changed too. Since indirect band gap can be
obtained by extrapolation to (αhν)1/2 = 0, therefore, different film thickness will lead to
different absorption coefficient value which in turn will result in the changing of indirect
band gap.
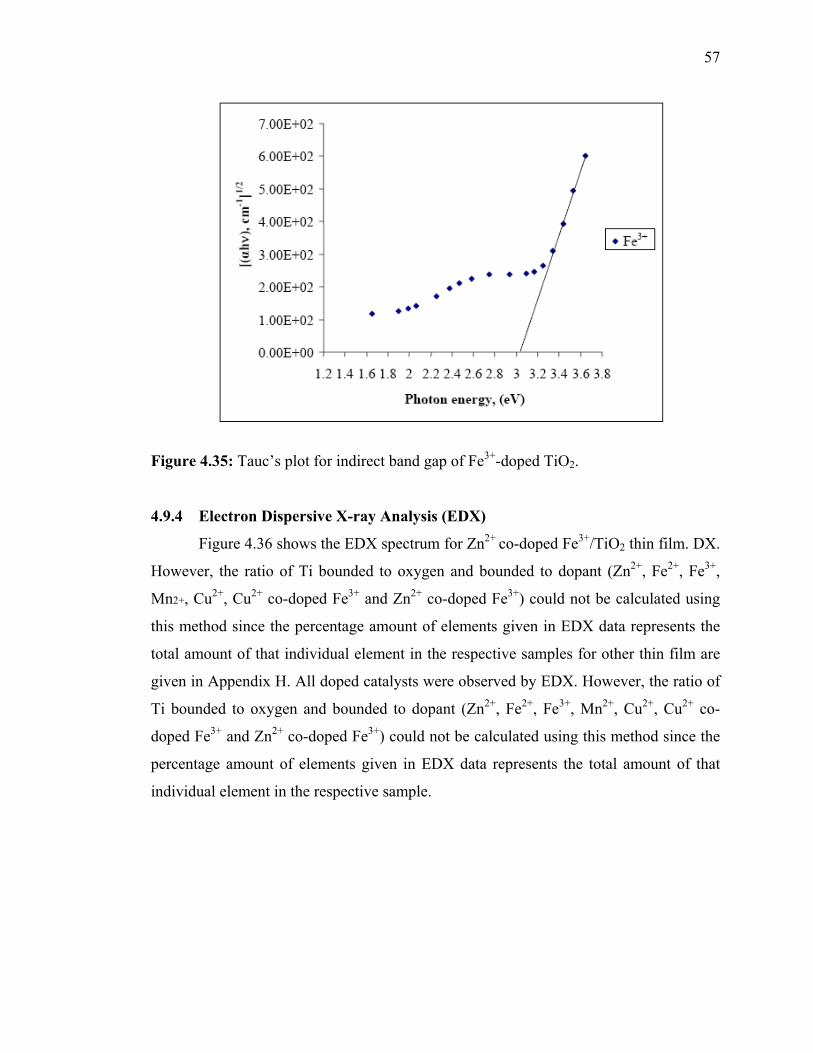
57
Figure 4.35: Tauc’s plot for indirect band gap of Fe3+-doped TiO2.
4.9.4 Electron Dispersive X-ray Analysis (EDX)
Figure 4.36 shows the EDX spectrum for Zn2+ co-doped Fe3+/TiO2 thin film. DX.
However, the ratio of Ti bounded to oxygen and bounded to dopant (Zn2+, Fe2+, Fe3+,
Mn2+, Cu2+, Cu2+ co-doped Fe3+ and Zn2+ co-doped Fe3+) could not be calculated using
this method since the percentage amount of elements given in EDX data represents the
total amount of that individual element in the respective samples for other thin film are
given in Appendix H. All doped catalysts were observed by EDX. However, the ratio of
Ti bounded to oxygen and bounded to dopant (Zn2+, Fe2+, Fe3+, Mn2+, Cu2+, Cu2+ co-
doped Fe3+ and Zn2+ co-doped Fe3+) could not be calculated using this method since the
percentage amount of elements given in EDX data represents the total amount of that
individual element in the respective sample.

58
Table 4.18: The optical band gaps for pure TiO2 and doped TiO2.
Figure 4.36: EDX spectrum for Zn2+ co-doped Fe3+/TiO2 thin film.
4.9.5 Scanning Electron Microscopy (SEM)
In the characterization of thin film using SEM, only the best catalyst was
characterized. Figure 4.37 shows the SEM micrograph of Zn2+ co-doped Fe3+/TiO2 thin
film. Scanning of Zn2+ co-doped Fe3+/TiO2 thin film was made with 5000 magnification

59
and 30 kV scanning voltage. According to Figure 4.37, it was found that pores are
produced in the thin film. Pores are produced in the films because PEG contained in the
sol-gel decomposes at 450°C (Sonawane, 2004). In the preparation of Zn2+ co-doped
Fe3+/TiO2 thin film, PEG was added into the sol-gel and the catalyst was calcined at
500°C. Therefore, it is expected that pores exist in the catalyst and this has a good
agreement with the obtained micrograph.
Figure 4.37: SEM micrograph of Zn2+ co-doped Fe3+/TiO2 thin film.
60
CHAPTER 5
CONCLUSIONS AND RECOMMENDATIONS
5.0 Conclusions
Transparent and non-abrasive doped and undoped TiO2 thin films were
successfully prepared using the sol-gel method. It was noted that the photocataytic
degradation of under studied VOCs did not only depend on the concentration and type of
dopant ions but also the type of VOCs. When doped catalysts with different dopant
ratios were used, only catalysts with optimum dopant ratios gave the highest %
degradation of studied VOCs. All Cu2+, Fe2+, Zn2+, Fe3+-doped TiO2 had an optimum
dopant ratio of 1:0.0005, while Zn2+ co-doped Fe3+/TiO2 and Cu2+ co-doped Fe3+/TiO2
showed an optimum dopant ratio of 1:0.0005:0.0005.
Catalysts such as Cu2+, Fe2+, Zn2+, Fe3+-doped TiO2, Zn2+ co-doped Fe3+/TiO2
and Cu2+ co-doped Fe3+/TiO2 increased the photocatalytic degradation of
dichloromethane, chloroform and carbon tetrachloride. The rate of degradation of the
studied chlorinated hydrocarbons follows the order: CHCl3 > CH2Cl2 > CCl4. In the
photocatalytic degradation of chloroform and carbon tetrachloride mixture, chloroform
showed higher % degradation than carbon tetrachloride. When the concentrations of
CHCl3 and CCl4 were increased, the % degradation of CHCl3 and CCl4 decreased.
Kinetic studies were carried out using doped and pure TiO2 for each VOC. A
linear plot of reciprocal initial rate versus reciprocal initial concentration results in a
good fitting of the L-H model to the experimental data thus confirming the L-H nature of
the photocatalytic degradation reaction. Although in the degradation of dichloromethane,
the initial rate of Fe3+-doped TiO2 was lower than for other sample catalysts, the amount
of dichloromethane degraded was higher. This indicates that a higher adsorption
constant does not always result in a higher degradation rate. In order to determine the
order of the degradation of carbon tetrachloride, dichloromethane and chloroform, a
graph of In [C] versus time was plotted. The obtained data showed that the VOCs in this
study degraded according to first-order kinetics.
61
GC-MS was used to analyze fragments that may form during the photocatalytic
degradation of the VOCs. A possible model was proposed for the photocatalytic
degradation of dichloromethane, chloroform and carbon tetrachloride. Structural and
optical characterizations were conducted through SEM/EDX, UVVis
spectrophotometeric and ellipsometric analyses. The thin film thickness and refractive
index of Zn2+ co-doped Fe3+/TiO2 and Cu2+ co-doped Fe3+/TiO2 were unable to be
determined using ellipsometry. As a consequence, the indirect band gap values for Cu2+
co-doped Fe3+/TiO2 and Zn2+ co-doped Fe3+/TiO2 were not determined.
The film thickness for all catalyst samples is between 227-251 nm and thus
within the range of acceptable thin film dimensions since the limit of thin film thickness
is 1000 nm. The refractive index for doped TiO2 is lower than pure TiO2. Refractive
index can be used to calculate the porosity of the thin films. It was found that the lower
the refractive index, the higher is the porosity. Fe3+ -doped TiO2 shows the highest
porosity among other catalyst samples. Thin films with high porosity had superior
photoactivity. However, when Mn2+, Fe2+, Fe3+, Cu2+ and Zn2+ doped TiO2 were used in
the degradation of dichloromethane, chloroform and carbon tetrachloride, only Fe2+,
Fe3+, Cu2+ and Zn2+ doped TiO2 showed higher degradation of VOCs than pure TiO2.
Mn2+ doped TiO2 was found to be detrimental to the degradation of VOCs
although the porosity of Mn2+ doped TiO2 was found to be higher than pure TiO2. The
absorption spectrum for all doped TiO2 with optimum dopant ratio and undoped TiO2
were taken using the Shimadzu UV-Vis-NIR Scanning Spectrophotometer. A slight shift
to a higher wavelength or red shift was noted for Zn2+ co-doped Fe3+/TiO2, Cu2+ co-
doped Fe3+/TiO2 and Cu2+ doped TiO2. Meanwhile, Fe3+, Fe2+, Mn2+ and Zn2+ showed a
slight shift to a lower wavelength.
The optical band gap, Eg values for all catalyst samples were determined by
plotting (αhν)1/2 versus the equivalent energy at the wavelength, λ. It is noted that all
obtained graphs have a similar curve. The obtained band gap values are in the range of
3-3.05 eV, which is lower than the normal value of 3.2 eV but is close to the literature
data. It is expected that their photocatalytic activity will be lower than pure TiO2.

62
However, when photocatalytic degradation of dichloromethane, chloroform and
carbon tetrachloride were carried out, it was found that the photocatalytic activities of
Fe3+-doped TiO2 and Zn2+-doped TiO2 were higher than pure TiO2. Band gap, therefore,
is not the main contributing factor to photocatalytic activity to doped and pure TiO2. All
doped catalysts were observed by EDX. However, the ratio of Ti bounds to oxygen and
bounds to dopant (Zn2+, Fe2+, Fe3+, Mn2+, Cu2+ co-doped Fe3+ and Zn2+ co-doped Fe3+)
could not be calculated using this method. In the characterization of thin film using
SEM, only the best catalyst was characterized. It was found that pores are produced in
the thin film.
REFERENCES
Abou-Helal, M.O. and Seeber, W.T. (2002). Preparation of TiO2 Thin Films by Spray
Pyrolysis to be Used as a Photocatalyst. Appl. Surf. Sci. 195: 53-62.
Alberici, R.M. and Jardim, W.F. (1997). Photocatalytic Destruction of VOCs in The
Gas-phase Using Titanium Dioxide. Appl. Catal. B: Environ. 14: 55-68.
Amor, S.B., Baud, G., Jacquet, M. and Pichon, N. (1998). Photoprotecive Titania
Coatings on PET Substrates. Surf. and Coatings Techol. 102: 63-72.
Arana, J., Cabo, C.G.i., Dona-Rodriguez, J.M., Gonzalez-Diaz, O., Herrera-Melian, J.A.
and Perez-Pena, J. (2004). FTIR Study of Formic Acid Interaction with TiO2 and
TiO2 doped with Pd and Cu I Photocatalytic Processes. Appl. Surf. Sci.
Arana, J., Diaz, O. G., Dona Rodriguez, Saracho, M. M., Herrera Melian, J.A. and Perez
Pena, J. (2001). Photocatalytic Degradation of Formic Acid Using Fe/ TiO2
Catalysts: The Role of Fe3+/ Fe2+ as TiO2 Dopant Ions in the Degradation
Mechanism. Appl. Catal. B: Environ. 32: 49-61.
Arroyo, R., Cordoba, G., Padilla, J. and Lara, V.H. (2002). Influence of Manganese
Ions on The Anatase-rutile Phase Transition of TiO2 Prepared by Sol-gel Process.
Mater. Lett. 54: 397-420.
Bendavid, A., Martin, P.J., Takikawa, H. (2000). Deposition and Modification of
Titanium Dioxide Thin Films by Filtered Arc Deposition. Thin Solid Films. 360:
102. 241-249.

63
Binder, L., Jantscher, W., Hofer, F. and Kothleitner, G. (1998). Production and
Characterization of Ellectrolytically Doped Manganese Oxide. J. Power Sources.
70: 1-7.
Borgarello, E., Kiwi, J., Gractzel, M., Pelizzetti, E., Visca, M. (1982). Visible Light
Induced Water Cleavage in Colloidal Solutions of Cr-doped TiO2 Particles. J. Am.
Chem. Soc. 104: 2996-3002.
Braun, A.M., Jakob, L. and Oliveros, E. (1993). Advanced Oxidation Processes:
Concepts of Reactor Design. AQUAAA, 42: 166-173.
Brezova, V., Blazkova, A., Karpinsky, L., Groskova, J., Havlinova, B., Jorik, V. and
Ceppan, M. (1997). Phenol Decomposition Using Mn+/TiO2 Photocatalysts
Supported by The Sol-gel Technique on Glass Fibres. J. Photochem. Photobio. A:
Chem. 109: 177-183
Butler, E.C. and Davis, A.P. (1993). Photocatalytic Oxidation in Aqueous Titanium
Dioxide Suspensions: The influence of Dissolved Transition Metals. J. Photochem.
Photobiol. A: Chem. 70: 273-283.
Cardona, A.I., Candal, R., Sanchez, B., Avila, P. and Rebollar, M. (2004). TiO2 on
Magnesium Silicate Monolith: Effects of Different Preparation Techniques on the
Photocatalytic Oxidation of Chlorinated Hydrocarbons. Energy. 29: 845-852.
Chen, C.H., Kelder, E.M., Schoonman, J. (1999). Electrostatc sol-Spray Deposition
(ESSD) and Characterization of Nanostructured TiO2 Thin Films. Thin Solid films.
342: 35-41.
Choi, W., Ko, J. Y., Park, H. and Chung, J. S. (2001). Investigation on TiO2- coated
Optical Fibers for Gas-phase Photocatalytic Oxidation of Acetone. Appl. Catal. B:
Environ. 31: 209-220.
Dionysiou, D.D., Suidan, M.T., Bekou, E., Baudin, I., Laine, J.M. (2000). Effect of
Ionic Strength and Hydrogen Peroxide on the Photocatalytic Degradation of 4-
Chlorobenzoic Acid in Water. Appl. Catal. B: Environ. 26: 153-171.
Djeghri, N., Teichner, S. J. (1980). Heterogeneous Photocatalysis-the Photooxidation
of 2-Methylbutane. J. Catal. 62: 99-106.
Dvoranova, D., Brezova, V., Mazur, M. and Malati, M. A. (2002). Investigations of
Metal-doped Titanium Dioxide Photocatalysts. Appl. Catal. B: Environ. 37: 91-105.

64
Feiyen, C., Pehkonen, S.O. and Ray, M. B. (2002). Kinetics and Mechanisms of
UV photodegradation of Chlorinated Organics in The Gas Phase. Water Research.
36:4203-4214.
Fu, X., Zeltner, W. A., Anderson, M. A. (1996). Applications in Photocatalytic
Purification of Air. In: P.V. Kamat & D. Meisel (Eds.), Semiconductor nanoclusters.
studies in surface science and catalysis Amsterdam. Elsevier Sci. 445–461.
Fox, M. A., Dulay, T. (1993). Heterogeneous Photocatalysis. Chem. Rev. 93:
341–357.
Gracia, F., Holgado, J.P., Yubero, F., Gonzales-Elipe, A.R. (2002). Phase Mixing in
Fe/TiO2 Thin Films Prepared by Ion Beam-induced Chemical Vapour Deposition:
Optical and Structural Properties. Surf. Coatings Technol. 158-159: 552-557.
Gudzinowicz, B.J., Gudzinowicz, M.J. and Martin, H.F. (1976). Fundamentals of
Integrated GC-MS. New York: Marcel Dekker, Inc.
Hale, R.C., Greaves, J. (1992). Methods for the Analysis of Persistent Chlorinated
Hydrocarbons in Tissues. J. Chromatogr. Biomed. Appl. 580: 257–278.
He, C., Xiong, Y., Chen, J. Zha, C. and Zhu, X. (2003). Photoelectrochemical
Performance of Ag-TiO2 / ITO Film and Photoelectrocatalytic Activity Towards the
Oxidation of Organic Pollutants. J. Photochem. Photobio. A: Chem. 157: 71-79.
Hester, R. E., Harrison, R. M. (1995). Volatile Organic Compounds in the Atmosphere.
London: The Royal Society of Chem.
Hirano, K., Asayama, H., Hoshino, A., Wakatsuki, H. (1997). Metal Powder Addition
Effect on the Photocatalytic Reactions and the Photogenerated Electric Charge
Collected at an Inert Electrode in Aqueous TiO2 Suspensions. J. Photochem.
Photobio. A: Chem. 110: 307-311.
Hoffmann, M.R., Martin, S.T., Choi, W., Bahnemann, D. W. (1995). Environmental
Applications of Semiconductor Photocatalysis. Chem. Reviews, 95: 69–96.
Hong, H.S., Kim, D.H., Kim, S.J., Song, J. and Lee, K.S. (2004). Photocatalytic
Behaviours and Structural Characterization of Nanocrystalline Fe-doped TiO2
Synthesized by Mechanical Alloying. J. Alloy and Compounds
Jiang, H. and Gao, L. (2002) Enhancing The UV Inducing Hydrophilicity of TiO2
Thin Film by Doping Fe Ions. Mater. Chem. And Phys. 77: 878- 881.

65
Karvinen, S. (2003). The Effects of Trace Elements on The Crystal Properties of TiO2.
Solid State Sci. 5: 811-819.
Kato, K. Tsuzuki, A. Taoda, H. Torii, Y., Kato, T. and Butsugan, Y. (1994). Crystal
Structures of TiO2 Thin Coatings Prepared from The Alkoxide Solution Via The
Dipcoating Technique Affecting The Photocatalytic Decomposition of Aqueous
Acetic Acid. J. Mater. Sci. 29: 5911-5915.
Kim, S. B. and Hong, S. C. (2002). Kinetic Study for Photocatalytic Degradation of
Volatile Organic Compounds in Air Using Thin Film TiO2 Photocatlyst. Appl.
Catal. B: Environ. 35: 305-315.
Legrand-Buscema, C., Malibert, C. and Bach, S. (2002). Elaboration and
Characterization of Thin Film of TiO2 Prepared by Sol-gel Process. Thin Solid
Films. 418: 79-84.
Legrini, O., Oliveros, E., Brawn, A.M. (1993). Photochemical Processes for Water
Treatment. Chem. Rev. 93: 671-689.
Litter, M.I. (1999). Review Heterogeneous Photocatalysis Transition Metal Ions in
Photocatalytic Systems. Appl. Catal. B: Environ. 23: 89-114.
Liu, T-C. and Cheng, T-I. (1995). Effects of SiO2 on the Catalytic Properties of TiO2
for the Incineration of Chloroform. Catal. Today. 26: 71-77.
Luo, Y. and Ollis, D. F. (1996). Heterogeneous Photocatalytic Oxidation of
Trichloroethylene and Toluene Mixtures in Air: Kinetic Promotion and Inhibition,
Time-dependent Catalyst Activity. J. Catal. 163: 1-11.
Malati, M. A., Wong, W. K. (1984). Doping TiO2 for Solar Energy Applications.
Surface Tech. 22: 305-322.
Mardare, D. (2002). Optical Constant of Heat Treated TiO2 Thin Films. Mater.
Sci. Eng. 95: 83-87.
Mardare, D., Tasca, M., Delibas, M., Rusu, G.I. (2000). On the Structural Properties
and Optical Transmittance of TiO2 R.F. Sputtered Thin Film. Appl. Surf. Sci. 156:
200-206.
Mills, A., Davies, R. H., Worsley, D. (1993). Water-Purification by Semiconductor
Photocatalysis. Chem. Soc. Reviews. 22: 417–425.
Mills, A., Le Hunte, S. (1997). An Overview of Semiconductor Photocatalysis. J.
66
Photochem. Photobio. A: Chem. 108: 1-35.
Mirmohseni, A. and Oladegeragoze, A. (2004). Determination of Chlorinated Aliphatic
Hydrocarbons in Air Using a Polymer Coated Quartz Crystal Microbalance Sensor.
Sens. Actuators B 102: 261-70.
Monneyron, P., Manero, M-H., Foussard, J.-N. and Maurette, M.-T. (2003).
Heterogeneous Photocatalysis of Butanol And Methyl Etyl Ketone-
Characterization of Catalyst and Dynamic Study. Chem. Eng. Sci. 58: 971-978.
Navio, J.A., Colon, G., Trillas, M., Peral, J., Domenech, X., Testa, J. J., Padron, J.,
Rodriguez, D. and Litter, M. I. (1998). Heterogeneous Photocatalytic Reactions of
Nitrite Oxidation and Cr(VI) Reduction on Iron-doped Titania Prepared by the Wet
Impregnation Method. Appl. Catal. B: Environ. 16: 187-196.
Oh, S.H., Kim, D.J., Hahn, S.H., Kim, E.J. (2003a). Comparison of Optical and
Photocatalytic Properties of TiO2 Thin Films Prepared by Electron-beam
Evaporation and sol-gel dip-coating. Mater. Lett. 57: 4151-4155.
Oh, S-M., Kim, S-S., Lee, J.E., Ishigaki, T. and Park, D-W. (2003b). Effect of Additives
on Photocatalytic Activity of Titanium Dioxide Powders Synthesized by Thermal
Plasma. Thin Solid Films. 435: 252-258.
Ollis, D. F. (1993). Photocatalytic puriGcation and treatment of water and air.
Lausanne: Elsevier.
Palmisano, L., Schiavello, M., Selafani, A., Martin, C., Martin, I., Rives, V. (1994)
Surface Properties of Iron-Titania Photocatalysts Employed for 4-Nitrophenol
Photodegradation in Aqueous TiO2 Dispersion. Catal. Lett. 24: 303-315.
Paola, A.D., Garcia-Lopez, E., Ikeda, S., Marci, G., Ohtani, B. and Palmisano, L. (2002)
Photocatalytic Degradation of Organic Compounds in Aqueous Systems by
Transition Metal Doped Polycrystalline TiO2. Catal. Today. 75: 87-93.
Park, S.E., Joo, H. and Kang, J.W. (2003). Effect of Impurities in TiO2 Thin Films on
Trichloroethylene Conversion. Solar Energy Mater. & Solar Cells.
Papaefthimiou, P., Ioannides, T. and Verykios, X.E. (1998). Performance of
Doped Pt/TiO2 (W6+) Catalyst for Combustion of Volatile Organic
Compounds (VOCs). Appl. Catal. B: Environ. 15: 75-92.
Pichat, P., Disdier, J., Hong-Van, C., Goutailler, G. and Gaysse, C. (2000).

67
Purification/deodorization of Indoor Air and Gaseous Effluents by TiO2
Photocatalysis. Catal. Today. 63: 363-369.
Pilchowski, K., Averkiou, C., Solutuschien, B. (1992). Adsorption of Vinyl-chloride on
Activated Carbons, Adsorber Polymers and Zeolites 2. Kinetics of Adsorption, J.
Fur Praktische Chemie-Chemiker-Zeitung. 334: 681-684
Pinard, L., Mijoin, J., Magnoux, P. and Guisnet, M. (2003). Oxidation of Chlorinated
Hydrocarbons Over P Zeolite Catalysts 1-mechanism of Dichloromethane
transformation Over PtNaY Catalysts. J. Cat. 215: 234-244.
Rahman, M.M., Krishna, K.M., Soga, T., Jimbo, T., Umeno, M. (1999). Optical
Properties and X-ray Photoelectron Spectroscopic Study of Pure and Pb-doped TiO2
Thin Films. J. Phys. Chem. Solids. 60: 201-210.
Ranjit, K.T. and Viswanathan, B. (1997). Synthesis, Characterization and Photocatalytic
Properties of Iron-doped TiO2 Catalysts. J. Photochem. Photobiol. A: Chem. 108:
79-84.
Sonawane, R.S., Kale, B.B. and Dongare, M.K. (2004). Preparation and photo-catalytic
Activity of Fe-TiO2 Thin Films Prepared by Sol-gel Dip Coating. Mater. Chem.
Phys. 85: 52-57.
Takahashi, Y. and Matsuoka, Y. (1988). Dip-coating of TiO2 Films Using a Sol Derived
from Ti(O-i-Pr)4-diethanolamine-H2O-i-PrOH System. J. Mater. Sci. 23:
2259-2266.
Wang, K-H. and Hsieh,Y-H. (1998). Heterogeneous Photocatalytic Degradation of
Trichloroethylene in Vapor Phase by Titanium Dioxide. Pergamon Environ.
International. 24: 267-274.
Winkler, K., Radeke, K.H., Stach, H. (1996). Adsorption/Desorption Behavior
of Organic-Water Pollutants onto an Adsorber Polymer. Chem. Tech. 48: 249–257.
Yang, P., Lu, C., Hua, N. and Du, Y. (2002). Titanium Dioxide Nanoparticles Codoped
with Fe3+ and Eu3+ Ions for Photocatalysis. Mater. Lett. 57: 794- 801.
Yashin, Y.I., Yashin, A.Y. (1999). New Potentialities of Chromatography in the
Determination of Pollutants in Potable Water. J. Anal. Chem. 54: 843-849.
Yuan, Z-h., Jia, J-h. and Zhang, L-d. (2002). Influence of Co-doping of Zn(II) + Fe(III)
on the Photocatalytic Activity of TiO2 for Phenol Degradation. Mater. Chem. And
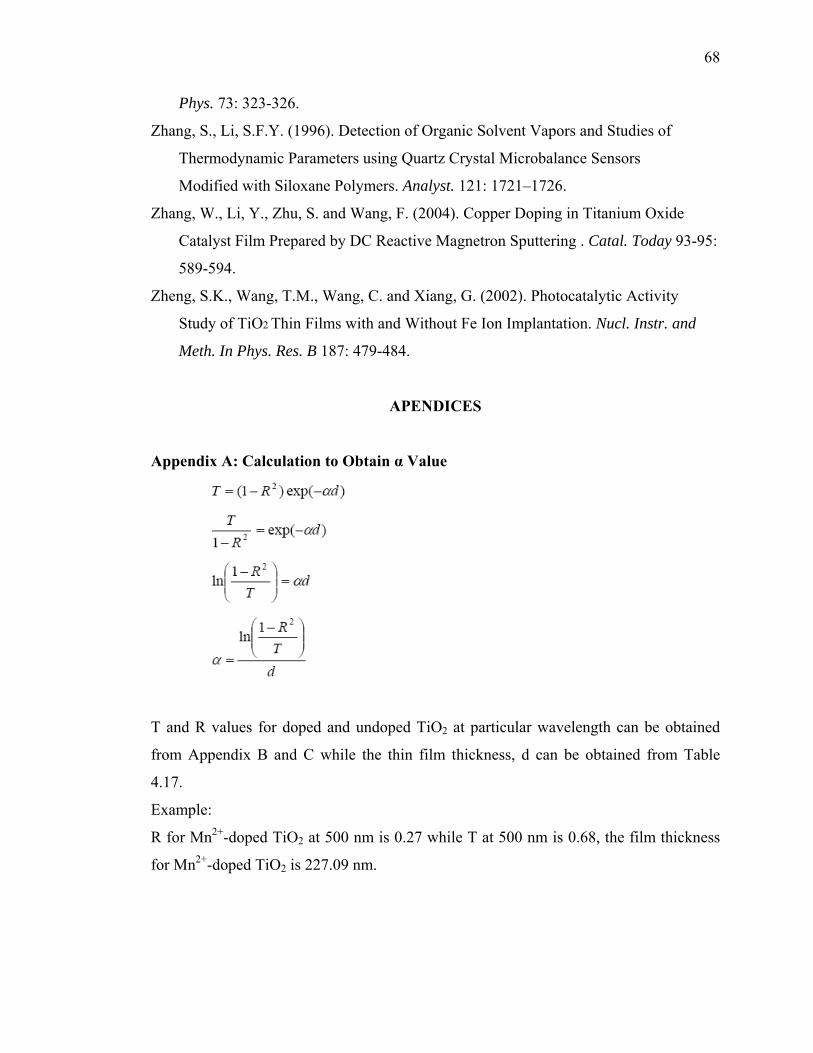
68
Phys. 73: 323-326.
Zhang, S., Li, S.F.Y. (1996). Detection of Organic Solvent Vapors and Studies of
Thermodynamic Parameters using Quartz Crystal Microbalance Sensors
Modified with Siloxane Polymers. Analyst. 121: 1721–1726.
Zhang, W., Li, Y., Zhu, S. and Wang, F. (2004). Copper Doping in Titanium Oxide
Catalyst Film Prepared by DC Reactive Magnetron Sputtering . Catal. Today 93-95:
589-594.
Zheng, S.K., Wang, T.M., Wang, C. and Xiang, G. (2002). Photocatalytic Activity
Study of TiO2 Thin Films with and Without Fe Ion Implantation. Nucl. Instr. and
Meth. In Phys. Res. B 187: 479-484.
APENDICES
Appendix A: Calculation to Obtain α Value
T and R values for doped and undoped TiO2 at particular wavelength can be obtained
from Appendix B and C while the thin film thickness, d can be obtained from Table
4.17.
Example:
R for Mn2+-doped TiO2 at 500 nm is 0.27 while T at 500 nm is 0.68, the film thickness
for Mn2+-doped TiO2 is 227.09 nm.

69
Appendix B: Reflectance data for doped and undoped TiO2
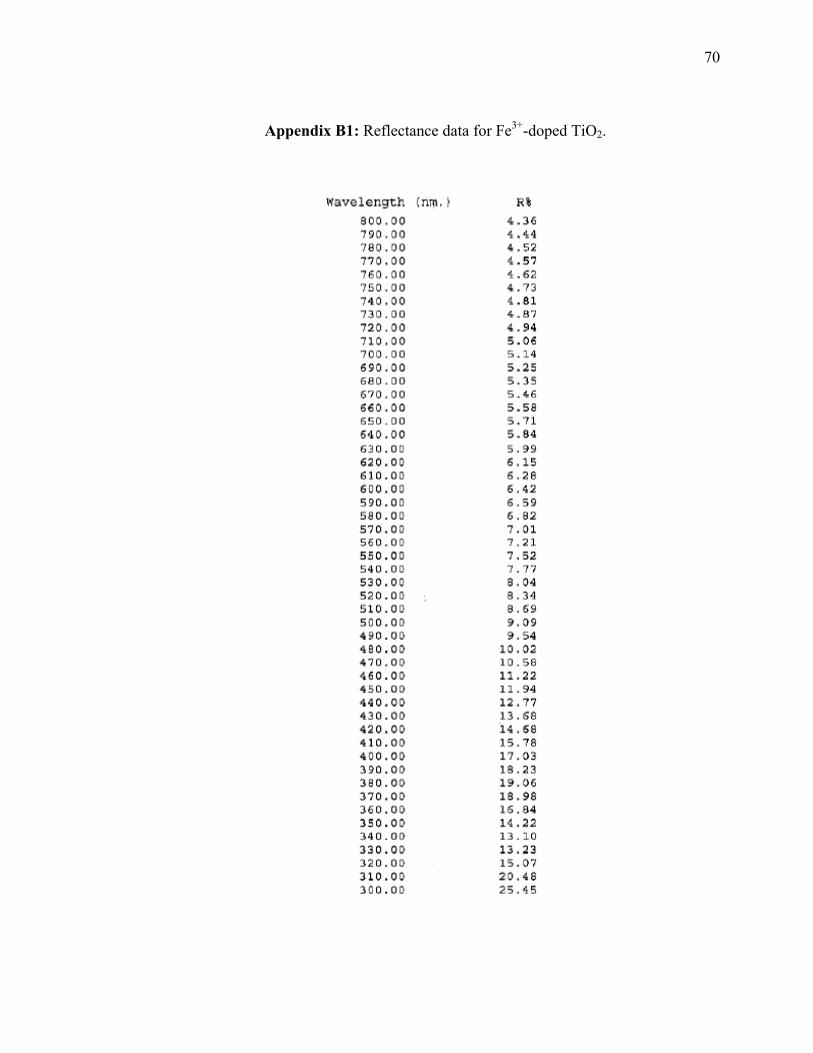
70
Appendix B1: Reflectance data for Fe3+-doped TiO2.

71
Appendix B2: Reflectance data for Fe2+-doped TiO2.

72
Appendix B3: Reflectance data for Cu2+-doped TiO2.

73
Appendix B4: Reflectance data for Mn2+-doped TiO2.

74
Appendix B5: Reflectance data for Zn2+-doped TiO2.
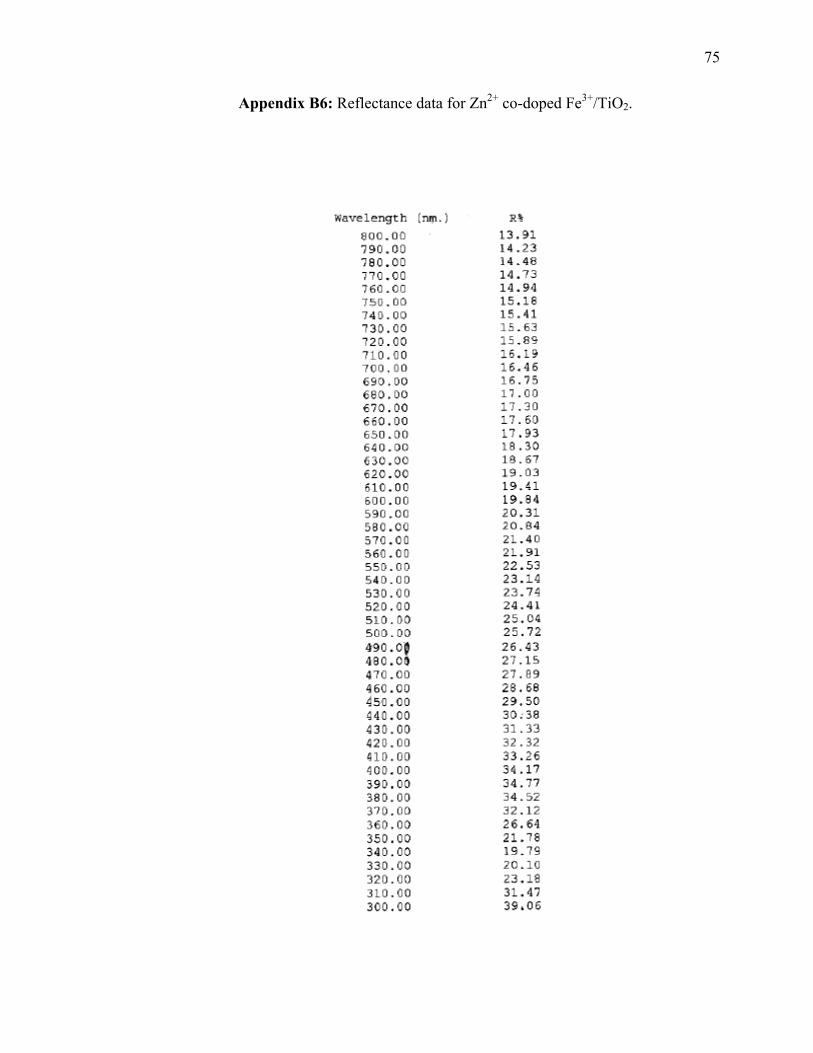
75
Appendix B6: Reflectance data for Zn2+ co-doped Fe3+/TiO2.
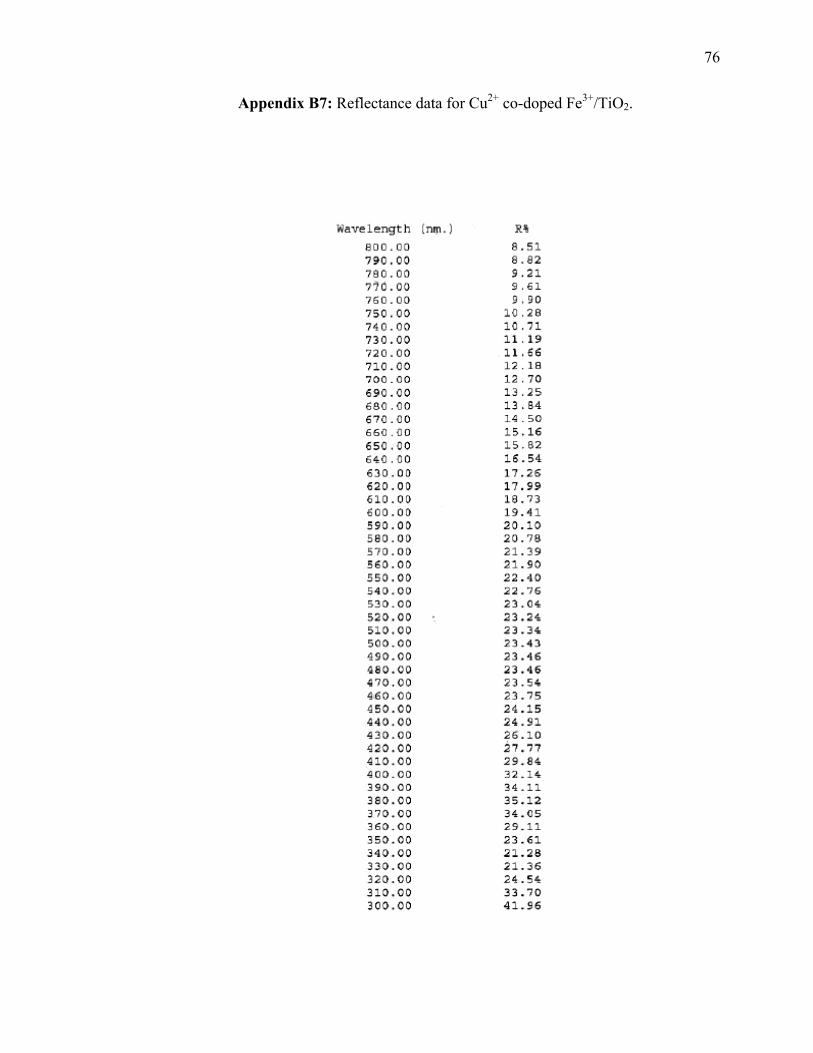
76
Appendix B7: Reflectance data for Cu2+ co-doped Fe3+/TiO2.

77
Appendix B8: Reflectance data for pure TiO2.
Appendix C: Transmittance data for doped and undoped TiO2

78
Appendix C1: Transmittance data for Fe3+-doped TiO2.
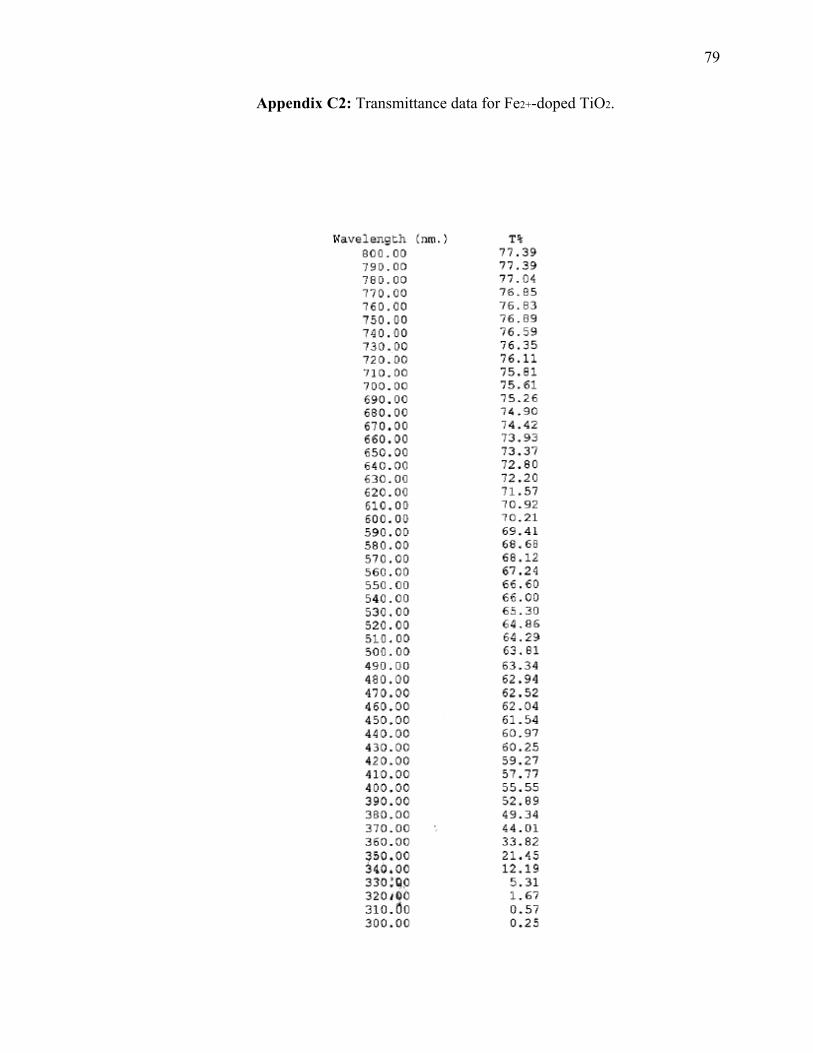
79
Appendix C2: Transmittance data for Fe2+-doped TiO2.
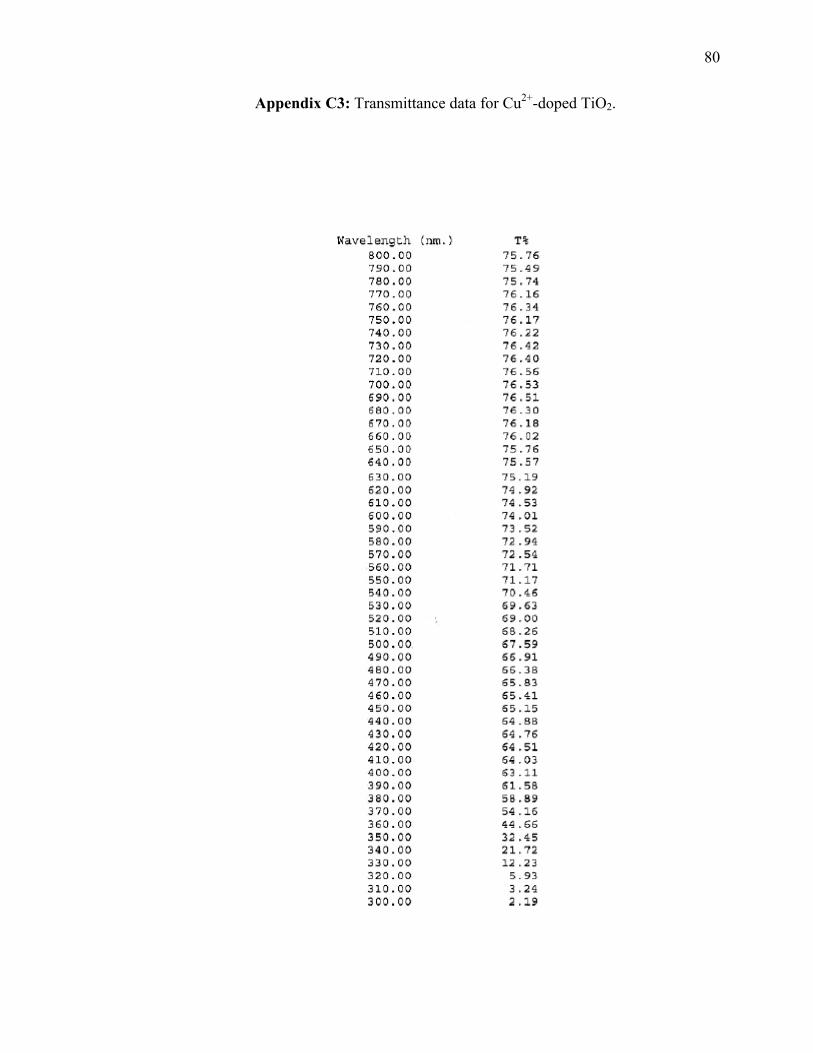
80
Appendix C3: Transmittance data for Cu2+-doped TiO2.

81
Appendix C4: Transmittance data for Mn2+-doped TiO2.

82
Appendix C5: Transmittance data for Zn2+-doped TiO2.
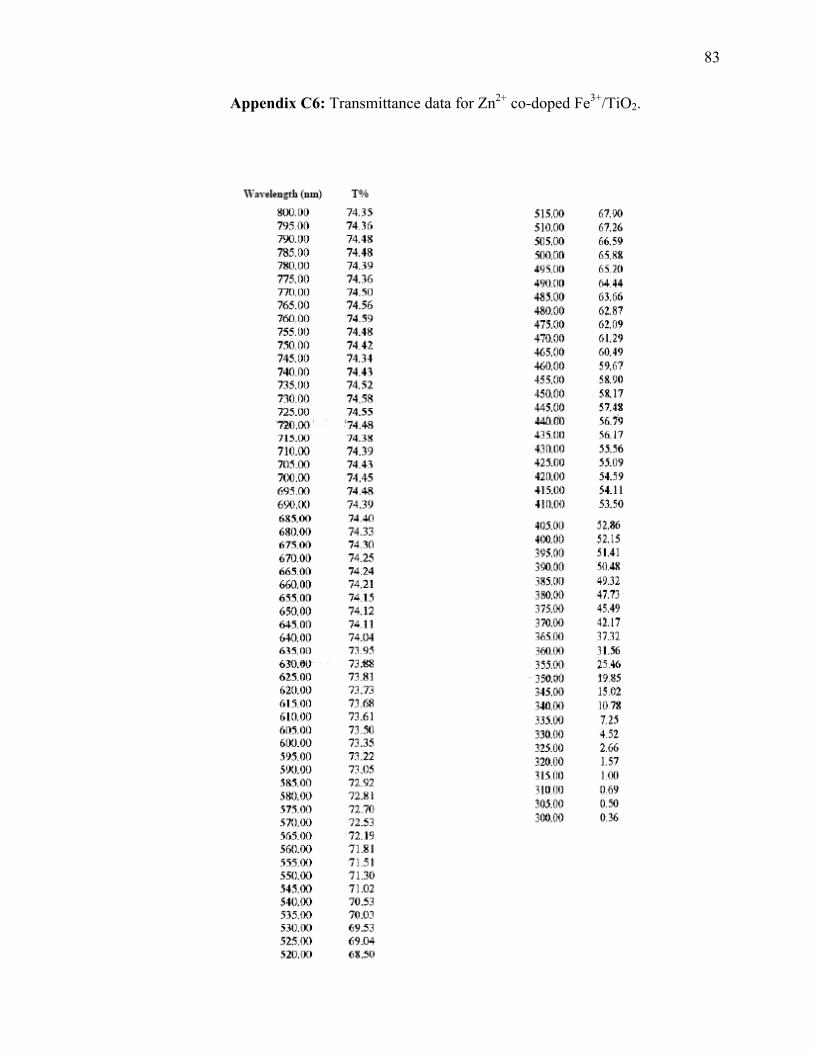
83
Appendix C6: Transmittance data for Zn2+ co-doped Fe3+/TiO2.
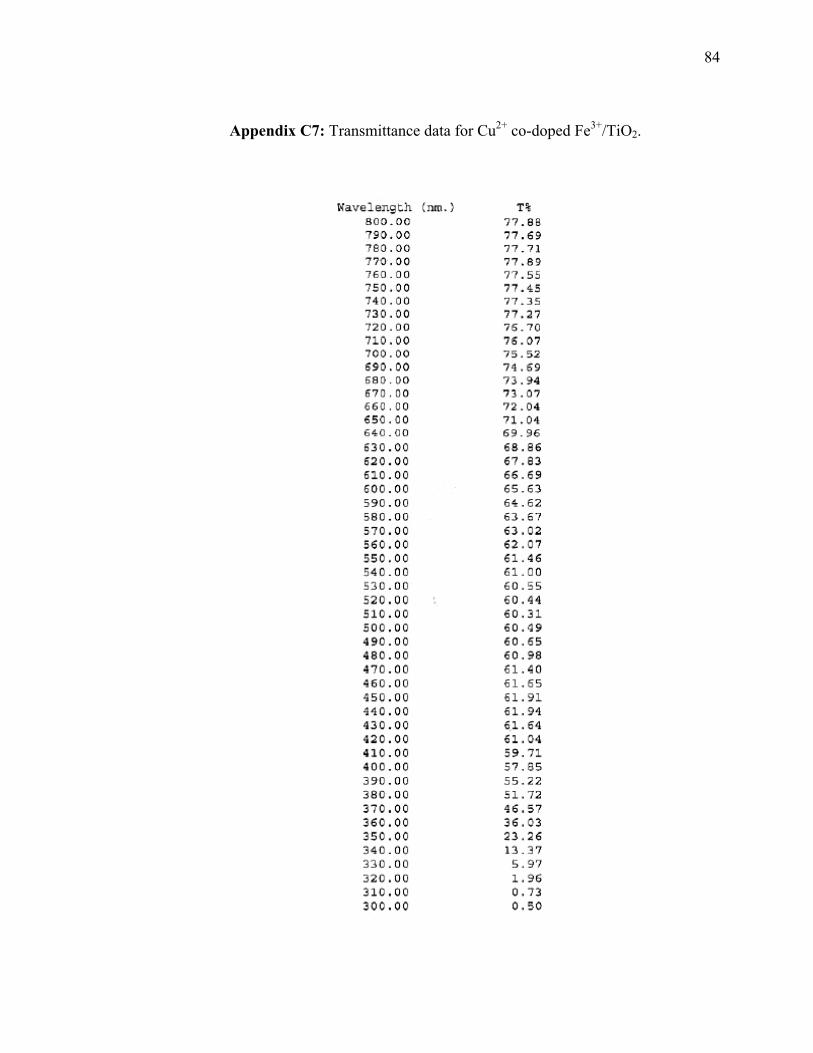
84
Appendix C7: Transmittance data for Cu2+ co-doped Fe3+/TiO2.
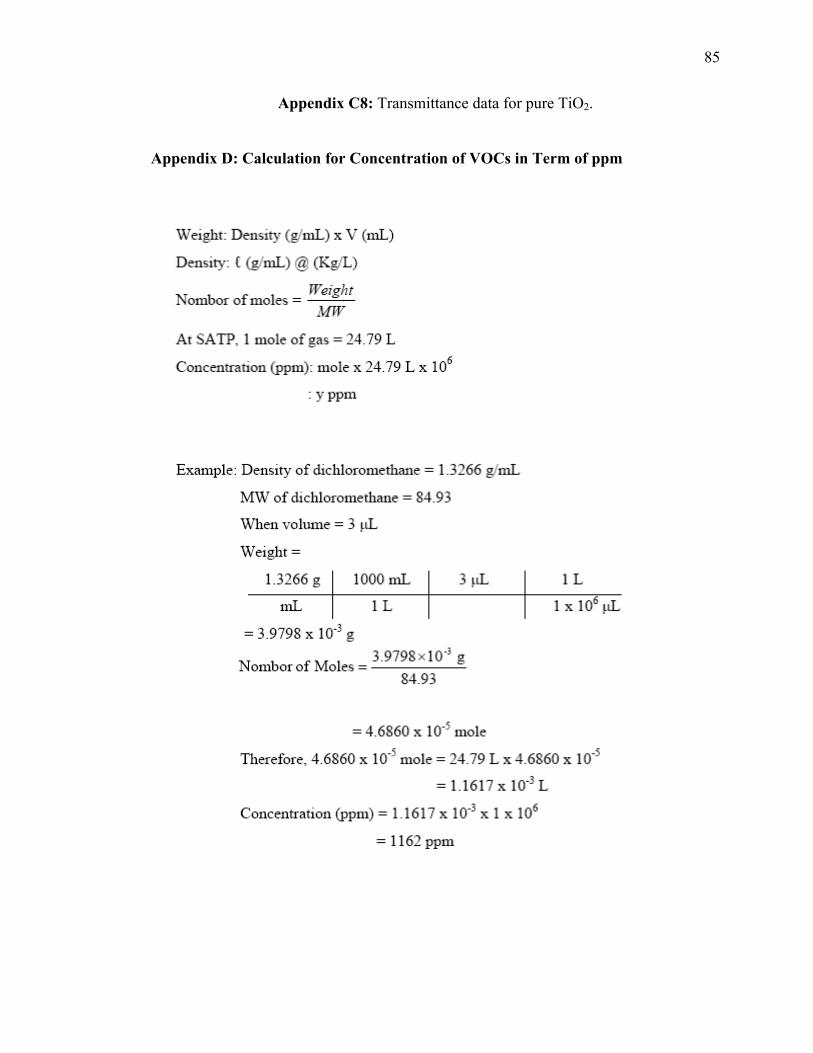
85
Appendix C8: Transmittance data for pure TiO2.
Appendix D: Calculation for Concentration of VOCs in Term of ppm

86
Appendix E: Comparision of Fragments Formed Before and After Illumination of
UV Light for Dichloromethane.
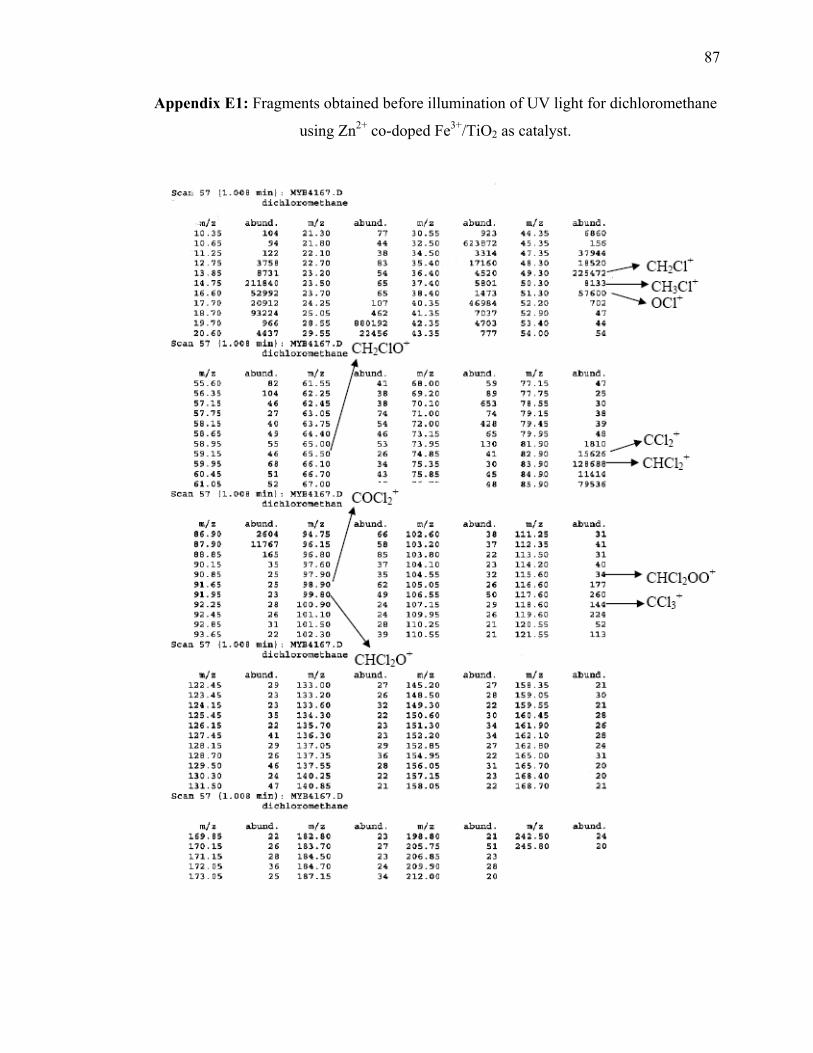
87
Appendix E1: Fragments obtained before illumination of UV light for dichloromethane
using Zn2+ co-doped Fe3+/TiO2 as catalyst.

88
Appendix E2: Fragments obtained after illumination of UV light for dichloromethane
using Zn2+ co-doped Fe3+/TiO2 as catalyst.

89
Appendix E3: Fragments obtained before illumination of UV light for dichloromethane
using Mn2+-doped TiO2 catalyst.
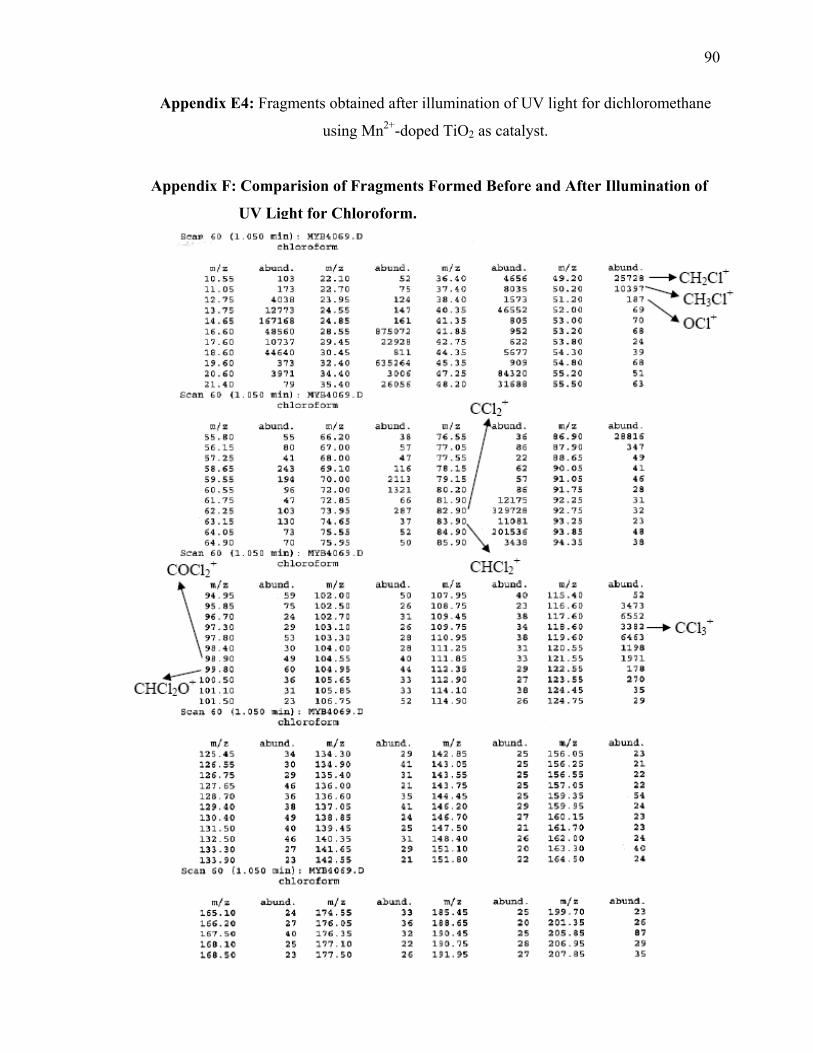
90
Appendix E4: Fragments obtained after illumination of UV light for dichloromethane
using Mn2+-doped TiO2 as catalyst.
Appendix F: Comparision of Fragments Formed Before and After Illumination of
UV Light for Chloroform.

91
Appendix F1: Fragments obtained before illumination of UV light for chloroform
using Zn2+ co-doped Fe3+/TiO2 as catalyst.

92
Appendix F2: Fragments obtained after illumination of UV light for chloroform
using Zn2+ co-doped Fe3+/TiO2 as catalyst.

93
Appendix F3: Fragments obtained before illumination of UV light for chloroform using
Mn2+-doped TiO2 as catalyst.
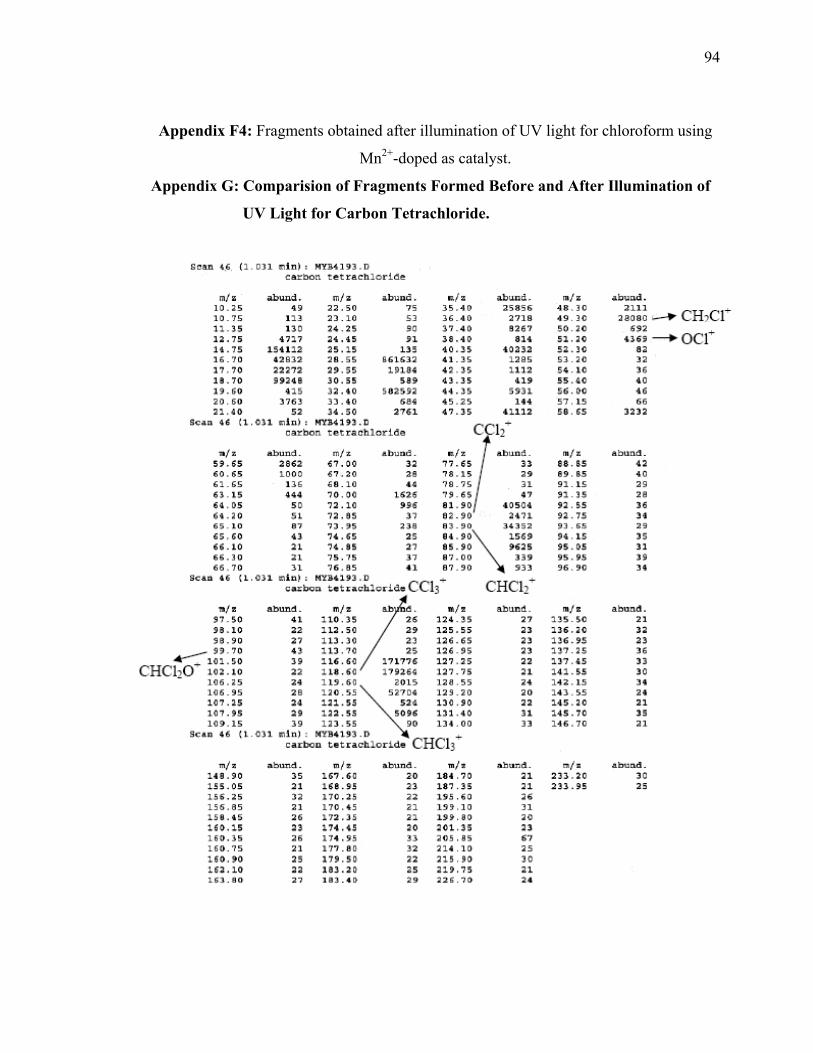
94
Appendix F4: Fragments obtained after illumination of UV light for chloroform using
Mn2+-doped as catalyst.
Appendix G: Comparision of Fragments Formed Before and After Illumination of
UV Light for Carbon Tetrachloride.

95
Appendix G1: Fragments obtained before illumination of UV light for carbon
tetrachloride using Zn2+ co-doped Fe3+/TiO2 as catalyst.
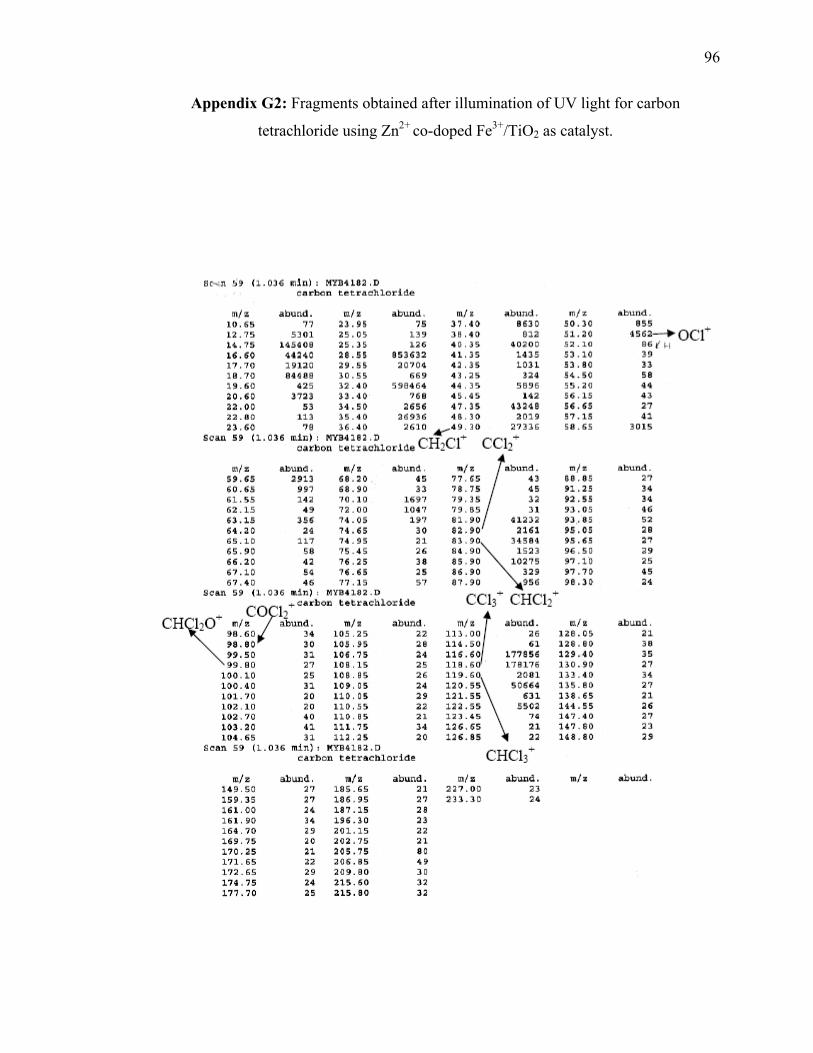
96
Appendix G2: Fragments obtained after illumination of UV light for carbon
tetrachloride using Zn2+ co-doped Fe3+/TiO2 as catalyst.

97
Appendix G3: Fragments obtained before illumination of UV light for carbon
tetrachloride using Zn2+ co-doped Fe3+/TiO2 as catalyst.

98
Appendix G4: Fragments obtained after illumination of UV light for carbon
tetrachloride using Mn2+-doped TiO2 as catalyst.
Appendix H: Tauc’s Plot for Indirect Band Gap
Appendix H1: Tauc’s plot for indirect band gap of Cu2+-doped TiO2.
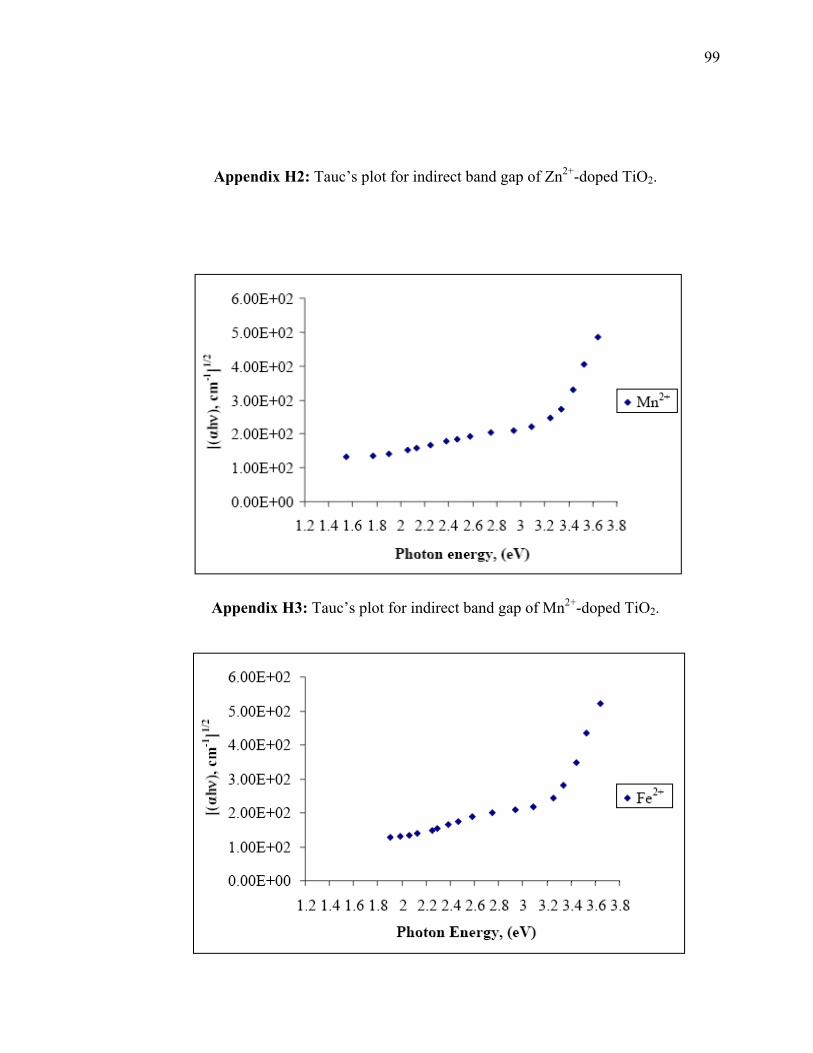
99
Appendix H2: Tauc’s plot for indirect band gap of Zn2+-doped TiO2.
Appendix H3: Tauc’s plot for indirect band gap of Mn2+-doped TiO2.

100
Appendix H4: Tauc’s plot for indirect band gap of Fe2+-doped TiO2.
Appendix H5: Tauc’s plot for indirect band gap of pure TiO2.