traffic impact assessment on a new commercial development ... · trip generation manual malaysia...
TRANSCRIPT

Jurnal Kejuruteraan SI 1(5) 2018: 43-51 https://dx.doi.org/10.17576/jkukm-2018-si1(5)-07
Traffic Impact Assessment on a New Commercial Development in the Neighbourhoods of Ampang Town in Selangor
(Penilaian Impak Trafik ke atas Sebuah Pembangunan Baharu di Kawasan Kejiranan Bandar Ampang di Selangor)
Amiruddin Ismail a,b* & Nursyahirah Surianis Mokhtara
aCivil Engineering Programme,bSmart and Sustainable Township Research Centre (SUTRA),
Faculty of Engineering & Built Environment, Universiti Kebangsaan Malaysia, Bangi, Malaysia
ABSTRACT
Traffic impact assessment (TIA) on a proposed commercial development in the neighbourhoods of Ampang Town in Selangor was conducted. In this study, trip rate analysis and regression analysis were carried out to assess future traffic expected to be generated by the proposed new commercial development. Calculations of trips were based on the Malaysian Highway Planning Unit (HPU) Trip Generation Manual (TGM) Malaysia 2010 related to a category of proposed new commercial development. Before and after construction study on the proposed new commercial development at neighbouring critical intersections and roads was carried out to determine existing and projected traffic volumes. A Statistical Package for the Social Sciences (SPSS) software was used to analyse traffic growth rate. This procedure uses a growth factor in the traffic data to show an increase in demand for transport journeys in the future. Then, intersections and roads traffic performances were analysed using the Signalised and Un-signalised Intersection Design and Research Aid (SIDRA) software. Result of SIDRA analysis with traffic projection horizon of year 2026 shows deterioration in Level of Service (LOS) D at one of the existing main junctions leading to the proposed new commercial development. Finally, traffic improvements were proposed to address future impact of generated traffic caused by the proposed new commercial development. Consequently, this study has provided a framework for TIA preparation and would assist developers and local authorities in their decision making to meet all the requirements needed in the design and improvement of traffic flow.
Keywords: Traffic impact assessment; regression analysis; trip rates; level of service
ABSTRAK
Kajian impak trafik (TIA) terhadap satu cadangan pembangunan perdagangan baharu di kawasan kejiranan Bandar Ampang di Selangor telah dijalankan. Dalam kajian ini, analisis kadar perjalanan dan analisis regresi telah dijalankan bagi menilai keadaan trafik pada masa hadapan yang akan dijanakan oleh pembangunan perdagangan baharu. Pengiraan kadar perjalanan adalah menggunakan Manual Penjanaan Perjalanan (TGM) Malaysia 2010 oleh Unit Perancang Lebuhraya Malaysia bagi kategori cadangan pembangunan perdagangan baharu. Kajian sebelum dan selepas pembinaan cadangan pembangunan perdagangan baharu di persimpangan kritikal dan di jalan raya dilakukan untuk menentukan jumlah isi padu trafik sedia ada dan terunjur. Perisian statistik SPSS (Statistical Package for the Social Sciences) digunakan untuk menganalisis kadar tumbesaran trafik. Prosedur ini menggunakan faktor tumbesaran pada data trafik untuk menunjukkan pertambahan permintaan perjalanan pengangkutan pada masa depan. Kemudian, prestasi trafik di persimpangan dan jalan raya telah dianalisis dengan menggunakan perisian SIDRA (Signalised and Un-signalised Intersection Design and Research Aid). Keputusan analisa SIDRA dengan unjuran trafik untuk tahun ufuk 2026 menunjukkan penurunan Tahap Perkhidmatan (LOS) D pada salah satu persimpangan utama menuju kepada cadangan pembangunan perdagangan baharu. Akhir sekali, cadangan penambahbaikan trafik telah dicadangkan untuk mengatasi impak trafik pada masa hadapan akibat cadangan pembangunan perdagangan baharu. Oleh yang demikian, kajian ini telah menyediakan sebuah rangka kerja dalam penyediaan TIA dan akan membantu pemaju dan pihak berkuasa dalam membuat keputusan agar dapat memenuhi semua keperluan dalam reka bentuk dan penambahbaikan aliran trafik.
Kata kunci: Kajian impak trafik; analisis regresi; kadar perjalanan; tahap perkhidmatan
INTRODUCTION
A proficient transportation system has a great importance on the infrastructural as well as the overall economic
development of a country. Therefore, National Transformation Program (NTP) of Malaysia under its 10th. Malaysia Plan has produced better road network connectivity, longer road as well as larger airports and ports. Sperling and Gordon (2010)
44
estimated by 2030, more than two billion vehicles expected to be generated by this world where California and China are having the most troublesome emissions problems.
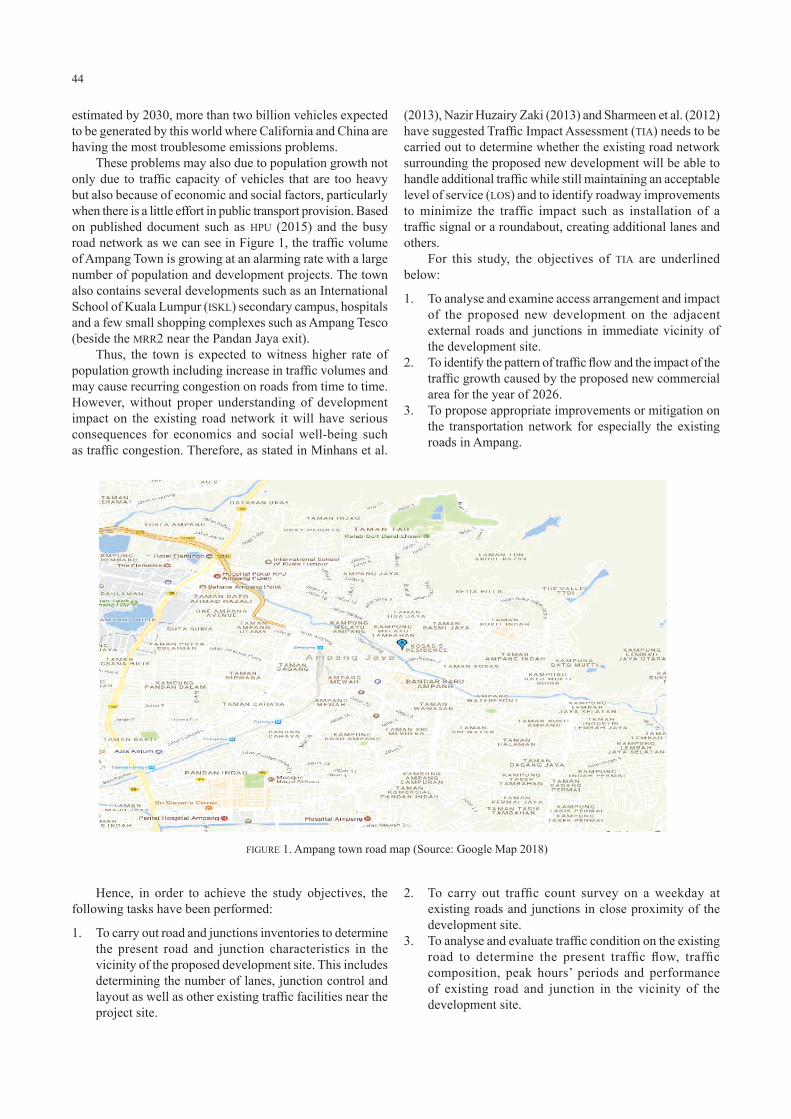
These problems may also due to population growth not only due to traffic capacity of vehicles that are too heavy but also because of economic and social factors, particularly when there is a little effort in public transport provision. Based on published document such as HPU (2015) and the busy road network as we can see in Figure 1, the traffic volume of Ampang Town is growing at an alarming rate with a large number of population and development projects. The town also contains several developments such as an International School of Kuala Lumpur (ISKL) secondary campus, hospitals and a few small shopping complexes such as Ampang Tesco (beside the MRR2 near the Pandan Jaya exit).
Thus, the town is expected to witness higher rate of population growth including increase in traffic volumes and may cause recurring congestion on roads from time to time. However, without proper understanding of development impact on the existing road network it will have serious consequences for economics and social well-being such as traffic congestion. Therefore, as stated in Minhans et al.
(2013), Nazir Huzairy Zaki (2013) and Sharmeen et al. (2012) have suggested Traffic Impact Assessment (TIA) needs to be carried out to determine whether the existing road network surrounding the proposed new development will be able to handle additional traffic while still maintaining an acceptable level of service (LOS) and to identify roadway improvements to minimize the traffic impact such as installation of a traffic signal or a roundabout, creating additional lanes and others.
For this study, the objectives of TIA are underlined below:
1. To analyse and examine access arrangement and impact of the proposed new development on the adjacent external roads and junctions in immediate vicinity of the development site.
2. To identify the pattern of traffic flow and the impact of the traffic growth caused by the proposed new commercial area for the year of 2026.
3. To propose appropriate improvements or mitigation on the transportation network for especially the existing roads in Ampang.
FIGURE 1. Ampang town road map (Source: Google Map 2018)
Hence, in order to achieve the study objectives, the following tasks have been performed:
1. To carry out road and junctions inventories to determine the present road and junction characteristics in the vicinity of the proposed development site. This includes determining the number of lanes, junction control and layout as well as other existing traffic facilities near the project site.
2. To carry out traffic count survey on a weekday at existing roads and junctions in close proximity of the development site.
3. To analyse and evaluate traffic condition on the existing road to determine the present traffic flow, traffic composition, peak hours’ periods and performance of existing road and junction in the vicinity of the development site.

45
4. To forecast the amount of traffic likely to be generated by and attracted to the proposed and surrounding development taking into consideration the proposed development components.
5. To distribute and assign development traffic to the adjacent road network based upon the present traffic pattern.
6. To investigate the impact of the development traffic on the external roads and junctions in terms of their capacities and performances and recommend mitigation measure to accommodate any possible impacts if necessary.
7. To assess the access arrangement serving the new development site and advice traffic issues associated with the proposed access points.
METHODOLOGY
The first step of the study starts with extensive literature survey and review to develop clear understanding of the concept of TIA. Then select the area for study. In this paper, a proposed new commercial development project by Perfect Eagle Development Sdn. Bhd., hereinafter refer as the Developer was planning to build office tower on Lot PT 8881, Bandar Ampang, Daerah Hulu Langat, Selangor Darul Ehsan has been selected as the study area. The primary data was obtained by carrying an inventory in the Ampang Town to assess future traffic conditions and the mean trip rates. Secondary data on traffic and land uses in terms of type and scale of all the land uses were also obtained from the Dewan Bandaraya Kuala Lumpur (DBKL).
Highway Planning Unit document on Trip Generation Manual (TGM) Malaysia 2010 was used to estimate the mean trip rates for new commercial development. The projected traffic volumes at critical intersection and road during before and after construction near the proposed new commercial development was analysed using SIDRA Intersection 6.1 (2015) software (Signalized and Un-signalised Intersection Design and Research Aid) to determine the traffic performance of roads and intersections. The success of SIDRA Solutions products has been built on reputation and career-long achievements of Dr Rahmi Akçelik, who is the company director and author of SIDRA Intersection and SIDRA Trip. In addition, IBM Statistical Package for the Social Sciences (SPSS) version 22.0 (2015) software was used in this study to analyse the rate of traffic growth as described in details in Barrette el al. (2001). This procedure uses a growth factor in
the traffic data to show an increase in demand for transport journeys in the future.
Finally, traffic improvements as described in Geetam and Mohan (2016) have been proposed to address the impact of traffic caused by the proposed new development in the future. The study methodology is summarized in a flowchart as shown in Figure 2.
RESULTS AND ANALYSIS
SITE LOCATION
The proposed development site is located to the south of Tesco Ampang and to the north of MRR2 Ampang Petronas Station. Presently, the main roads leading to the development site from Jalan Lingkaran Tengah 2 (MRR2) and Jalan Pandan 1 are Jalan Pandan 5 and Jalan Pandan Prima. Figure 3 shows the location of development site in relation to the existing road and the detail components of the proposed development.
DATA COLLECTION
Procedures described in Ismail Abdul Rahman (1991) have been adopted for data collection as follows:
1. Inventory was carried out at roads and junctions leading to the proposed development site to determine the existing characteristics of roads and junctions such as roadway lanes, width, traffic circulation, junctions’ control and layout as well as traffic condition.
2. There was six major junctions’ in vicinity of the proposed development site expected to receive immediate impact from the proposed development as shown in Table 1.
3. Manual vehicle counts were conducted at the existing junction in the vicinity of the development site. Peak hour traffic count surveys were conducted on 21st. July 2016 for a.m peak (7:00 a.m-10:00 a.m) and for p.m peak (4:30 p.m -7:30 p.m). The type and vehicle occupancy were recorded at every 15 minutes’ interval. Data from Jabatan Pengangkutan Jalan Malaysia (2016) were also used in this study.
4. Prior to evaluating the existing traffic characteristics all counted vehicles were converted into Passenger Car Equivalent (PCE) or Passenger Car Unit (PCU) factors to account for the varying traffic composition based on Trip Generation Manual Malaysia 2010.
TABLE 1. Type of existing junction controlled
Junction Id Junction Name No. of Approach Type of Junction Control
J1 Jalan Pandan 1 / Jalan Pandan 5 Junction 3 Signalised J2 Jalan Pandan Prima / Jalan Pandan 5 Junction 3 Priority J3 Tesco Ampang Access Junction off Jalan Pandan Prima 3 Left in/left-out J4 Jalan Pandan Prima / Jalan Lingkaran Tengah 2 Junction 3 Left-in/left-out J5 Jalan Pandan Prima / Jalan Pandan Prima 2 Junction 3 Left-in/left-out J6 Jalan Pandan Prima / Jalan Pandan Prima 1 Junction 3 Left-in/left-out
46
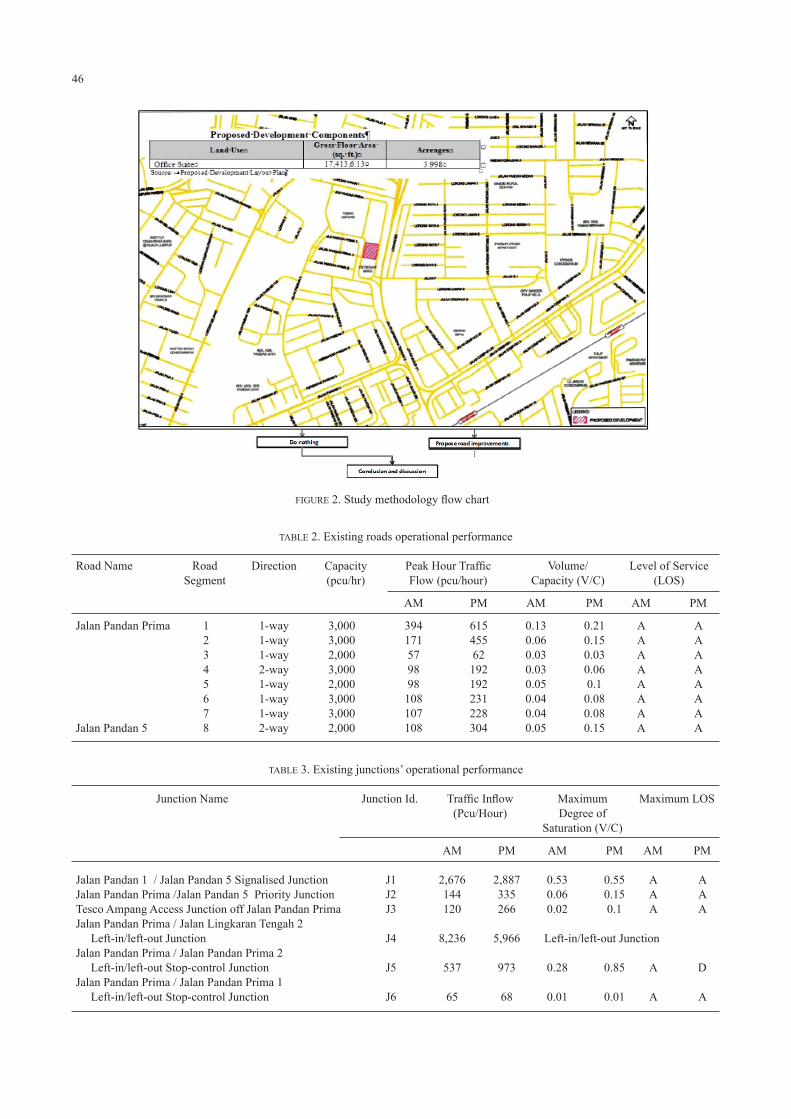
TABLE 2. Existing roads operational performance
Road Name Road Direction Capacity Peak Hour Traffic Volume/ Level of Service Segment (pcu/hr) Flow (pcu/hour) Capacity (V/C) (LOS)
AM PM AM PM AM PM
Jalan Pandan Prima 1 1-way 3,000 394 615 0.13 0.21 A A 2 1-way 3,000 171 455 0.06 0.15 A A 3 1-way 2,000 57 62 0.03 0.03 A A 4 2-way 3,000 98 192 0.03 0.06 A A 5 1-way 2,000 98 192 0.05 0.1 A A 6 1-way 3,000 108 231 0.04 0.08 A A 7 1-way 3,000 107 228 0.04 0.08 A AJalan Pandan 5 8 2-way 2,000 108 304 0.05 0.15 A A
TABLE 3. Existing junctions’ operational performance
Junction Name Junction Id. Traffic Inflow Maximum Maximum LOS (Pcu/Hour) Degree of Saturation (V/C)
AM PM AM PM AM PM
Jalan Pandan 1 / Jalan Pandan 5 Signalised Junction J1 2,676 2,887 0.53 0.55 A AJalan Pandan Prima /Jalan Pandan 5 Priority Junction J2 144 335 0.06 0.15 A ATesco Ampang Access Junction off Jalan Pandan Prima J3 120 266 0.02 0.1 A AJalan Pandan Prima / Jalan Lingkaran Tengah 2 Left-in/left-out Junction J4 8,236 5,966 Left-in/left-out JunctionJalan Pandan Prima / Jalan Pandan Prima 2 Left-in/left-out Stop-control Junction J5 537 973 0.28 0.85 A DJalan Pandan Prima / Jalan Pandan Prima 1 Left-in/left-out Stop-control Junction J6 65 68 0.01 0.01 A A
FIGURE 2. Study methodology flow chart
47
PERFORMANCE OF ExISTING ROADS
Performance of the existing roads is measured based upon the volume to capacity (V/C) ratio and LOS. Generally, LOS A and F represent the best and the worst operating conditions respectively while LOS D is considered the acceptable traffic conditions for design criteria in an urban environment. Table 2 shows the results of the overall performances of existing roads. The results of roadway V/C analysis indicated existing Jalan Pandan Prima and Jalan Pandan 5 are operating at acceptable traffic condition with LOS A during morning and evening peak hours. This is reflected during the on-site observation where there was no major traffic congestion at the mid-block section of these roads. Assumptions have been made due to the local road of Jalan Pandan Prima is already in a 3-lane one-way road and most of the drivers are likely to use the highway path rather than local road with signalized junction.
PERFORMANCE OF ExISTING JUNCTIONS
The existing operational performance of immediate junctions to the development site was evaluated as suggested by Ahmad Faiz Nasir (2012) using SIDRA software. The performances of junctions were analysed based on degree of saturation and the results are as shown in Table 3.
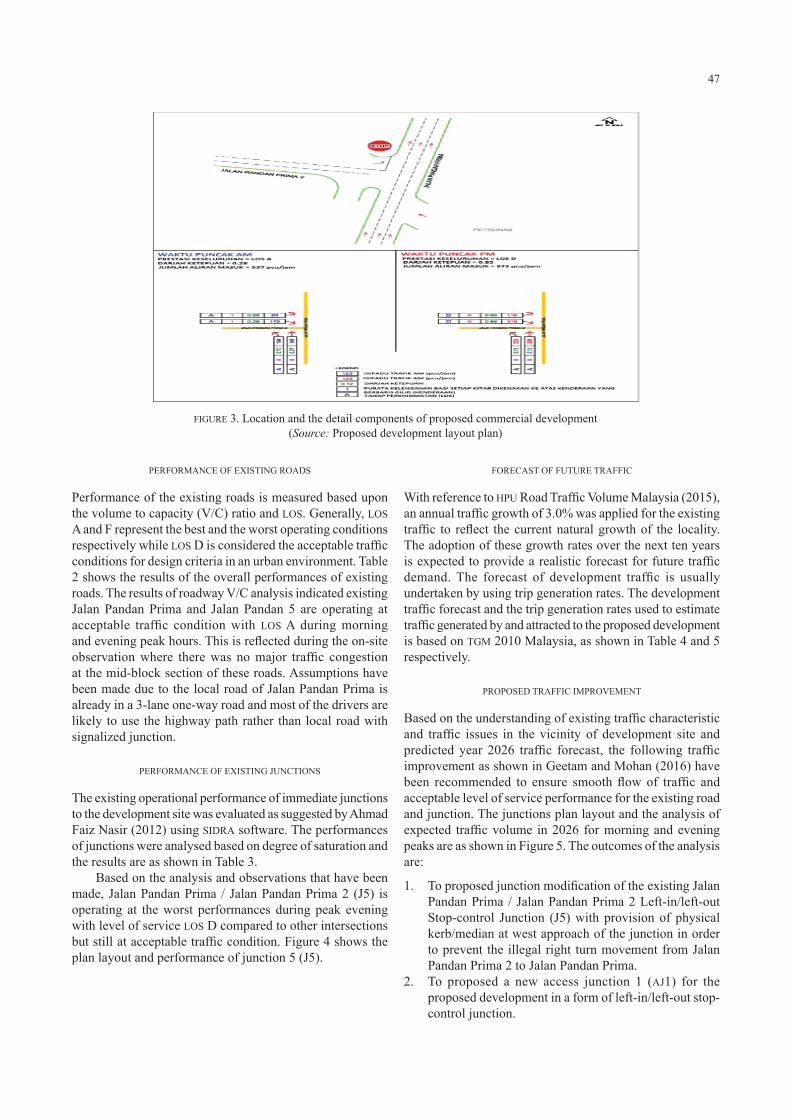
Based on the analysis and observations that have been made, Jalan Pandan Prima / Jalan Pandan Prima 2 (J5) is operating at the worst performances during peak evening with level of service LOS D compared to other intersections but still at acceptable traffic condition. Figure 4 shows the plan layout and performance of junction 5 (J5).
FORECAST OF FUTURE TRAFFIC
With reference to HPU Road Traffic Volume Malaysia (2015), an annual traffic growth of 3.0% was applied for the existing traffic to reflect the current natural growth of the locality. The adoption of these growth rates over the next ten years is expected to provide a realistic forecast for future traffic demand. The forecast of development traffic is usually undertaken by using trip generation rates. The development traffic forecast and the trip generation rates used to estimate traffic generated by and attracted to the proposed development is based on TGM 2010 Malaysia, as shown in Table 4 and 5 respectively.
PROPOSED TRAFFIC IMPROVEMENT
Based on the understanding of existing traffic characteristic and traffic issues in the vicinity of development site and predicted year 2026 traffic forecast, the following traffic improvement as shown in Geetam and Mohan (2016) have been recommended to ensure smooth flow of traffic and acceptable level of service performance for the existing road and junction. The junctions plan layout and the analysis of expected traffic volume in 2026 for morning and evening peaks are as shown in Figure 5. The outcomes of the analysis are:
1. To proposed junction modification of the existing Jalan Pandan Prima / Jalan Pandan Prima 2 Left-in/left-out Stop-control Junction (J5) with provision of physical kerb/median at west approach of the junction in order to prevent the illegal right turn movement from Jalan Pandan Prima 2 to Jalan Pandan Prima.
2. To proposed a new access junction 1 (AJ1) for the proposed development in a form of left-in/left-out stop-control junction.
FIGURE 3. Location and the detail components of proposed commercial development (Source: Proposed development layout plan)
48
TABLE 4. Trip generation rates and percentage of trips in and out of study area
Land use Time Trip Rates PCU Factor Trip Distribution (%) In Out
General Office AM 1.54 per TSF 0.81 71 29 PM 1.43 per TSF 0.86 33 67
Notes: TSF = Thousand Square Feet
TABLE 5. Peak hour development traffic forecast (pcu/hour)
GFA AM Peak Hour PM Peak Hour
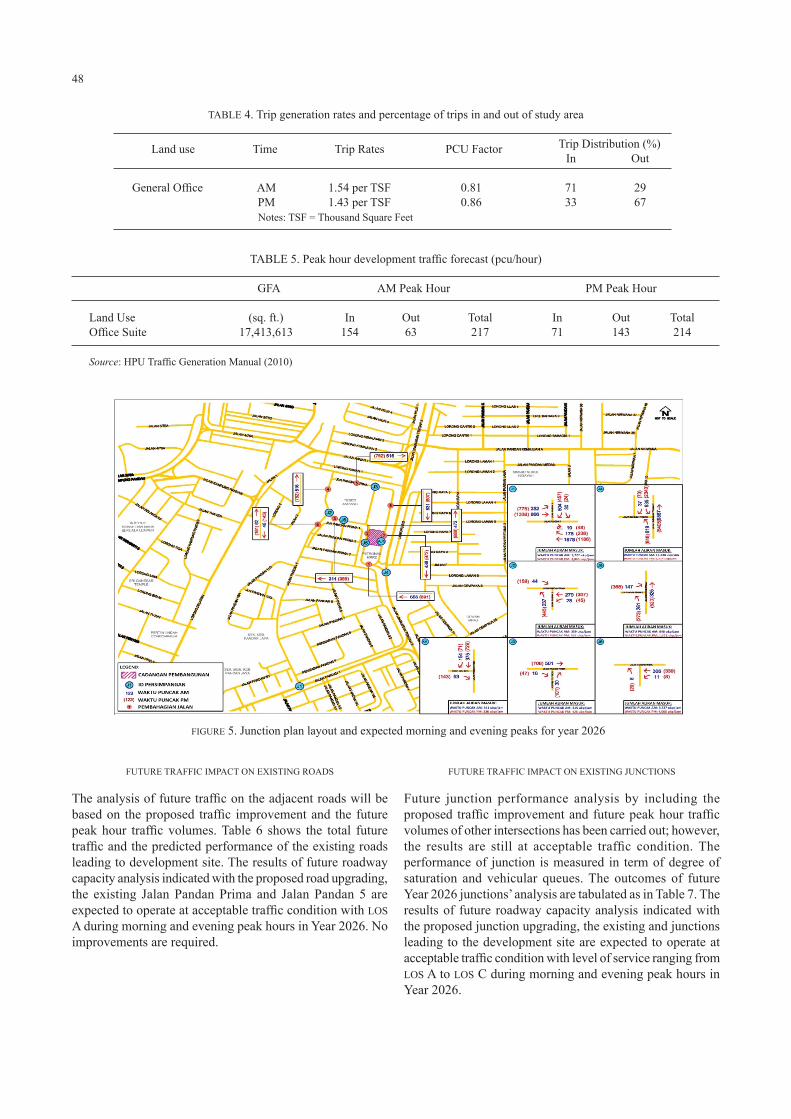
Land Use (sq. ft.) In Out Total In Out TotalOffice Suite 17,413,613 154 63 217 71 143 214
Source: HPU Traffic Generation Manual (2010)
FIGURE 5. Junction plan layout and expected morning and evening peaks for year 2026
FUTURE TRAFFIC IMPACT ON ExISTING ROADS
The analysis of future traffic on the adjacent roads will be based on the proposed traffic improvement and the future peak hour traffic volumes. Table 6 shows the total future traffic and the predicted performance of the existing roads leading to development site. The results of future roadway capacity analysis indicated with the proposed road upgrading, the existing Jalan Pandan Prima and Jalan Pandan 5 are expected to operate at acceptable traffic condition with LOS A during morning and evening peak hours in Year 2026. No improvements are required.
FUTURE TRAFFIC IMPACT ON ExISTING JUNCTIONS
Future junction performance analysis by including the proposed traffic improvement and future peak hour traffic volumes of other intersections has been carried out; however, the results are still at acceptable traffic condition. The performance of junction is measured in term of degree of saturation and vehicular queues. The outcomes of future Year 2026 junctions’ analysis are tabulated as in Table 7. The results of future roadway capacity analysis indicated with the proposed junction upgrading, the existing and junctions leading to the development site are expected to operate at acceptable traffic condition with level of service ranging from LOS A to LOS C during morning and evening peak hours in Year 2026.
49
FUTURE TRAFFIC IMPACT ANALYSIS ON PROPOSED ACCESS JUNCTION
Junction operational performance analysis was also undertaken for the proposed development Access Junction 1 (AJ1). The results for AJ1 analysis are shown in Table 8. The outcomes of junction operational performance analysis results indicated the AJ1 will operate at acceptable traffic condition with LOS A during morning peak hour and LOS B during evening peak hour in Year 2026.
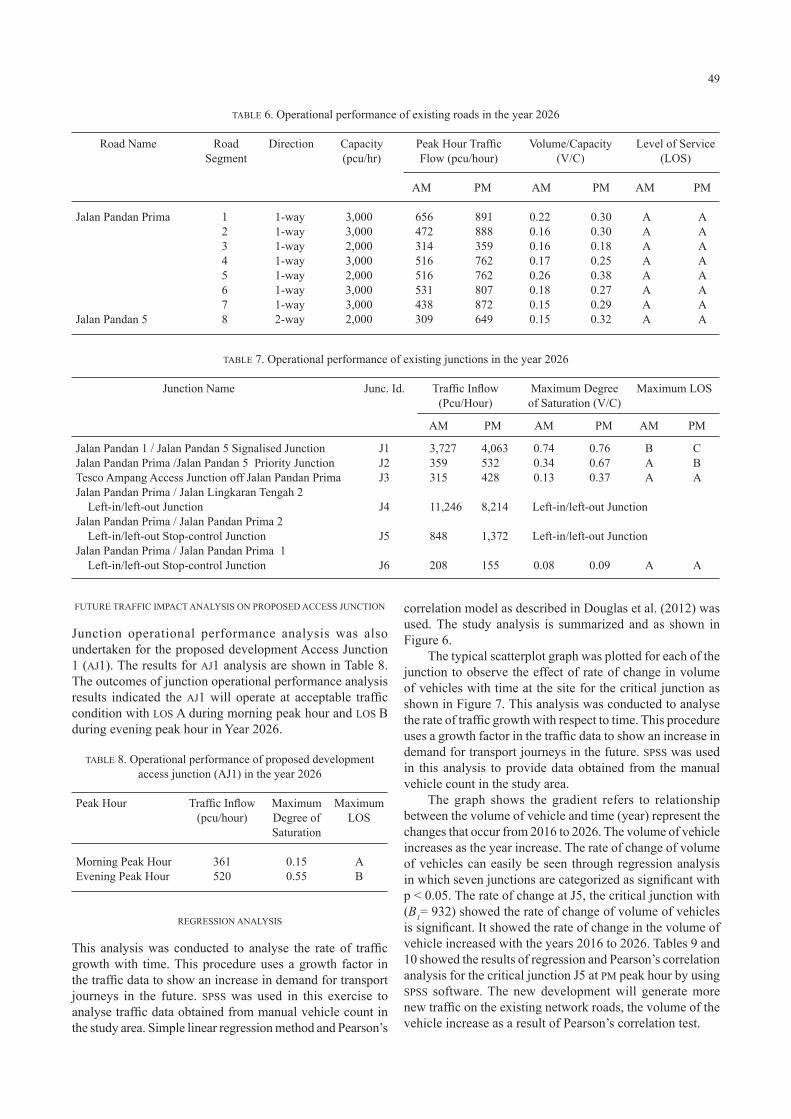
correlation model as described in Douglas et al. (2012) was used. The study analysis is summarized and as shown in Figure 6.
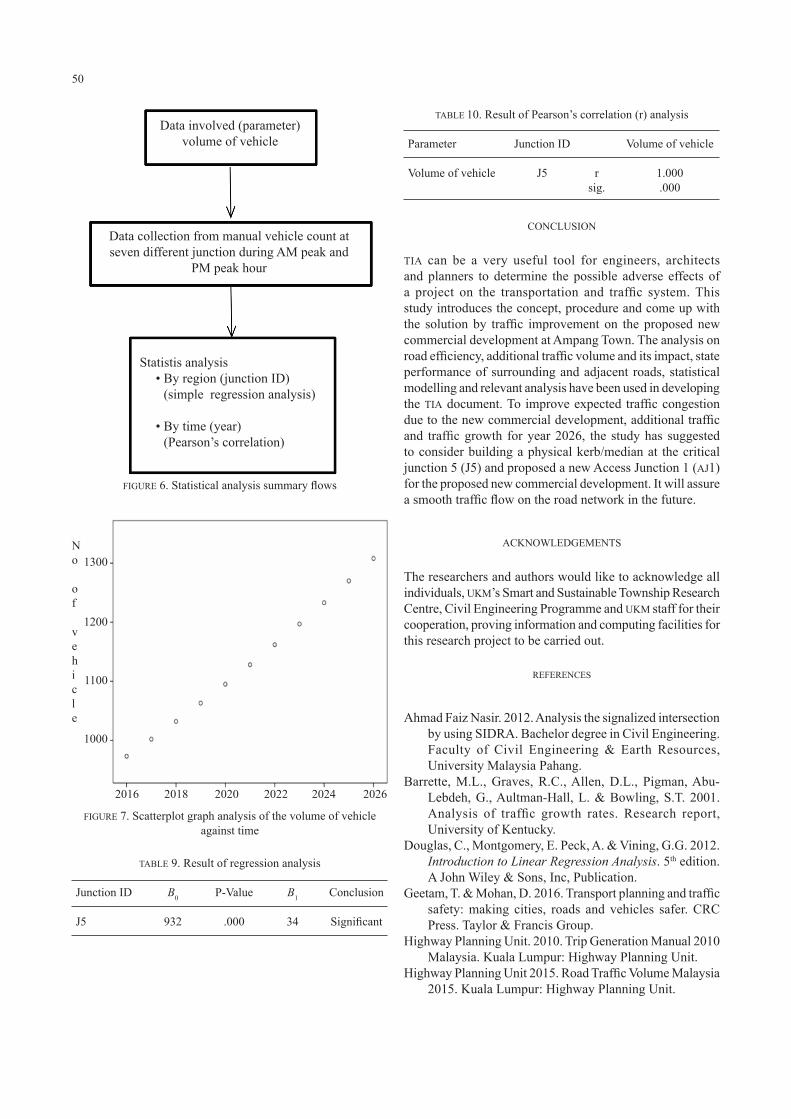
The typical scatterplot graph was plotted for each of the junction to observe the effect of rate of change in volume of vehicles with time at the site for the critical junction as shown in Figure 7. This analysis was conducted to analyse the rate of traffic growth with respect to time. This procedure uses a growth factor in the traffic data to show an increase in demand for transport journeys in the future. SPSS was used in this analysis to provide data obtained from the manual vehicle count in the study area.
The graph shows the gradient refers to relationship between the volume of vehicle and time (year) represent the changes that occur from 2016 to 2026. The volume of vehicle increases as the year increase. The rate of change of volume of vehicles can easily be seen through regression analysis in which seven junctions are categorized as significant with p < 0.05. The rate of change at J5, the critical junction with (B1= 932) showed the rate of change of volume of vehicles is significant. It showed the rate of change in the volume of vehicle increased with the years 2016 to 2026. Tables 9 and 10 showed the results of regression and Pearson’s correlation analysis for the critical junction J5 at PM peak hour by using SPSS software. The new development will generate more new traffic on the existing network roads, the volume of the vehicle increase as a result of Pearson’s correlation test.
TABLE 7. Operational performance of existing junctions in the year 2026
Junction Name Junc. Id. Traffic Inflow Maximum Degree Maximum LOS (Pcu/Hour) of Saturation (V/C)
AM PM AM PM AM PM
Jalan Pandan 1 / Jalan Pandan 5 Signalised Junction J1 3,727 4,063 0.74 0.76 B CJalan Pandan Prima /Jalan Pandan 5 Priority Junction J2 359 532 0.34 0.67 A BTesco Ampang Access Junction off Jalan Pandan Prima J3 315 428 0.13 0.37 A AJalan Pandan Prima / Jalan Lingkaran Tengah 2 Left-in/left-out Junction J4 11,246 8,214 Left-in/left-out JunctionJalan Pandan Prima / Jalan Pandan Prima 2 Left-in/left-out Stop-control Junction J5 848 1,372 Left-in/left-out JunctionJalan Pandan Prima / Jalan Pandan Prima 1 Left-in/left-out Stop-control Junction J6 208 155 0.08 0.09 A A
TABLE 8. Operational performance of proposed development access junction (AJ1) in the year 2026
Peak Hour Traffic Inflow Maximum Maximum (pcu/hour) Degree of LOS Saturation
Morning Peak Hour 361 0.15 AEvening Peak Hour 520 0.55 B
TABLE 6. Operational performance of existing roads in the year 2026
Road Name Road Direction Capacity Peak Hour Traffic Volume/Capacity Level of Service Segment (pcu/hr) Flow (pcu/hour) (V/C) (LOS) AM PM AM PM AM PM
Jalan Pandan Prima 1 1-way 3,000 656 891 0.22 0.30 A A 2 1-way 3,000 472 888 0.16 0.30 A A 3 1-way 2,000 314 359 0.16 0.18 A A 4 1-way 3,000 516 762 0.17 0.25 A A 5 1-way 2,000 516 762 0.26 0.38 A A 6 1-way 3,000 531 807 0.18 0.27 A A 7 1-way 3,000 438 872 0.15 0.29 A AJalan Pandan 5 8 2-way 2,000 309 649 0.15 0.32 A A
REGRESSION ANALYSIS
This analysis was conducted to analyse the rate of traffic growth with time. This procedure uses a growth factor in the traffic data to show an increase in demand for transport journeys in the future. SPSS was used in this exercise to analyse traffic data obtained from manual vehicle count in the study area. Simple linear regression method and Pearson’s
50
CONCLUSION
TIA can be a very useful tool for engineers, architects and planners to determine the possible adverse effects of a project on the transportation and traffic system. This study introduces the concept, procedure and come up with the solution by traffic improvement on the proposed new commercial development at Ampang Town. The analysis on road efficiency, additional traffic volume and its impact, state performance of surrounding and adjacent roads, statistical modelling and relevant analysis have been used in developing the TIA document. To improve expected traffic congestion due to the new commercial development, additional traffic and traffic growth for year 2026, the study has suggested to consider building a physical kerb/median at the critical junction 5 (J5) and proposed a new Access Junction 1 (AJ1) for the proposed new commercial development. It will assure a smooth traffic flow on the road network in the future.
ACKNOWLEDGEMENTS
The researchers and authors would like to acknowledge all individuals, UKM’s Smart and Sustainable Township Research Centre, Civil Engineering Programme and UKM staff for their cooperation, proving information and computing facilities for this research project to be carried out.
REFERENCES
Ahmad Faiz Nasir. 2012. Analysis the signalized intersection by using SIDRA. Bachelor degree in Civil Engineering. Faculty of Civil Engineering & Earth Resources, University Malaysia Pahang.
Barrette, M.L., Graves, R.C., Allen, D.L., Pigman, Abu-Lebdeh, G., Aultman-Hall, L. & Bowling, S.T. 2001. Analysis of traffic growth rates. Research report, University of Kentucky.
Douglas, C., Montgomery, E. Peck, A. & Vining, G.G. 2012. Introduction to Linear Regression Analysis. 5th edition. A John Wiley & Sons, Inc, Publication.
Geetam, T. & Mohan, D. 2016. Transport planning and traffic safety: making cities, roads and vehicles safer. CRC Press. Taylor & Francis Group.
Highway Planning Unit. 2010. Trip Generation Manual 2010 Malaysia. Kuala Lumpur: Highway Planning Unit.
Highway Planning Unit 2015. Road Traffic Volume Malaysia 2015. Kuala Lumpur: Highway Planning Unit.
TABLE 9. Result of regression analysis
Junction ID B0 P-Value B1 Conclusion
J5 932 .000 34 Significant
TABLE 10. Result of Pearson’s correlation (r) analysis
Parameter Junction ID Volume of vehicle
Volume of vehicle J5 r 1.000 sig. .000
Data involved (parameter)volume of vehicle
Data collection from manual vehicle count at seven different junction during AM peak and
PM peak hour
Statistis analysis • By region (junction ID) (simple regression analysis)
• By time (year) (Pearson’s correlation)
FIGURE 6. Statistical analysis summary flows
No
of
vehicle
1300
1200
1100
1000
2016 2018 2020 2022 2024 2026
FIGURE 7. Scatterplot graph analysis of the volume of vehicle against time

51
IBM Statistical Package for the Social Sciences (SPSS) version 22.0. 2015.
Ismail Abdul Rahman. 1991. Analisis persimpangan berlampu isyarat menggunakan Highway Capacity Manual 1985. Jurnal Kejuruteraan 3: 13-26.
Jabatan Pengangkutan Jalan Malaysia. 2016. Bilangan kenderaan bermotor berdaftar. Jabatan Perangkaan Malaysia: Kuala Lumpur. http://www.jpj.gov.my/ms.
Kartikeya, J., Sinha, N., Arkatkar, S.S. & Sarkar, A.K. 2013. Modeling growth trend and forecasting techniques for vehicular population in India. International Journal for Traffic and Transport Engineering 3(2): 139-158.
Minhans, A., Nazir Huzairy Zaki & Belwal, R. 2013. Traffic impact assessment: a case of proposed hypermarket in Skudai town of Malaysia. Jurnal Teknologi 65(3): 1-7.
Nazir Huzairy Zaki. 2013. Traffic impact assessment of new commercial developments in the neighborhoods of Skudai town. Master Thesis, Universiti Teknologi Malaysia, Faculty of Civil Engineering.
Sharmeen, N., Sadat, K., Zaman, N. & Mitra, S.K. 2012. Developing a generic methodology for traffic impact assessment of a mixed land use in Dhaka City. Journal of Bangladesh Institute of Planners 5(12): 119-128.
Sperling, D. & Gordon, D. 2010. Two Billion Cars. New York: Oxford University Press.
Nursyahirah Surianis Mokhtar, *Amiruddin IsmailCivil Engineering Programme,Smart and Sustainable Township Research Centre,Faculty of Engineering and Built Environment,Universiti Kebangsaan Malaysia
*Corresponding author; email: [email protected]
Received date: 17th May 2018Accepted date: 15th August 2018Online First date: 1st October 2018Published date: 30th November 2018