thestabilityandpredictabilityofbetas: evidence from the...
TRANSCRIPT
PertanikaJ. Soc. Sci. & Hum. 2(1): 43-52 (1994) ISSN: 0128-7702© Universiti Pertanian Malaysia Press
The Stability and Predictability of Betas: Evidence fromthe Kuala Lumpur Stock Exchange
SHAMSHER MOHAMAD and ANNUAR MD. NASSIRDeparunent ofAccounting and FinanceFaculty of Economics and Management
Universiti Pertanian Malaysia43400 UPM Serdang, Selangor Darul Ehsan, Malaysia.
Keywords: Beta, stability, portfolio, securities, expected returns
ABSTRAK
Beta mengukur risiko bersistem atau risiko tidakboleh di pelbagai sesuatu sekuriti. Para pelabur inginkan nilaibeta yang stabil (yang boleh diramal) untuk membolehkan mereka menilai pulangan teIjangka atas pelaburanmereka dengan tepat. Nilai beta yang tidak stabil akan menyebabkan nilai pulangan teIjangka kurang tepat danseterusnya tidak dapat menunjukkan prestasi sebenar sesuatu pelaburan. Kajian ini meniliti soal kestabilan dankebolehramalan beta Fowler-Rorke (beta ini mengambilkira soal ketipisan dagangan kebanyakan saham-sahamdi Bursa Saham Kuala Lumpur) bagi 148 firma yang tersenarai di BSKL. Penemuan kajian ini menunjukkanbahawa beta saham individu dan portfolio adalah pegun mengikut masa. Seperti dijangka beta portfolio adalahlebih stabil dari beta saham individu dan cara pembentukan portfolio mempengaruhi kestabilan beta portfolio.Kestabilan beta portfolio tercapai dengan sekurang-kurangnya 15 saham atau lebih, tidak kira cara mana portfolio itu dibentuk. Secara keseluruhannya, penemuan ini mencadangkan bahawa tahap kebolehpercayaan terhadapbeta saham individu dan portfolio yang dianggarkan di BSKL tidak boleh diperkecilkan (diendahkan) oleh parapelabur apabila membuat keputusan pemilihan portfolio dan pelaburan.
ABSTRACf
Beta measures the systematic or undiversifiable risk ofa security. Investors desire stable (and hence predictable)measures of beta to enable them to accurately estimate the expected returns on their investment. Instable betaslead to inaccurate estimates ofexpected returns over time and hence provide misleading signals on performanceof investments. This study examines the stability and predictability of the three leads/lags version of FowlerRorke betas (unlike OLS betas, these betas address the problem of thinness of trading peculiar to the KLSE) of148 firms listed on the Kuala Lumpur Stock Exchange (KLSE). The findings suggest that the beta of both individual securities and portfolios are quite stationary over time. As expected the portfolio betas are relatively morestable than individual securities betas. Furthermore, the method of portfolio formation affects the relative ponfolio beta stability. However, portfolio beta stability is achieved with 15 or more securities, irrespective of methodof portfolio formation. Overall, the findings indicate that investors can reliably utilise estimated individual security and portfolio betas for their portfolio selection and investment decisions.
INTRODUCTION
Since the introduction of the systematic risk coefficient or beta in Capital Market Theory (Sharpe,1964) as an important stastistic in estimating thereturns on assets and consequently in the makingof investment decisions, considerable effort hasbeen expended on obtaining empirical estimatesof betas (Wallace, 1980). It is generally acceptedthat the total risk ofan asset consists ofdiversifiableand non-diversifiable portions. Diversifiable riskis attributed to factors which are specific to theasset and can be eliminated through diversifica-
tion. Non-diversifiable risk is due to factors whichinfluence all assets in the market and hence constitute the only relevant risk for each asset. Investment theory suggests that beta is the appropriatemeasure of risk for diversified portfolios(Jensen,1968) and the efficient market theorysuggests that the amount of return above the riskfree rate an investment manager can expect depends solely upon beta or the sensitivity of theinvestment's return to the changes in market returns. Sharpe (1964) and Lintner (1965) developed the Capital Asset Pricing Model (CAPM) to
Shamsher Mohamad and Annuar Md. Nassir
explain the relevant risk and returns on assets inthe market. The CAPM states that the risk premium for any asset is related to the risk premiumof the market expressed in the following way:
Where E (R) is the expected return on asset i,R
fis the risk-free rate,
B is the beta coefficient.I
The importance of beta as a tool for makinginvestment decisions has been increasingly recognised and some local brokerage firms regularlyprovide information on the beta coefficients of alarge number ofstocks listed on the Kuala LumpurStock Exchange. Institutional investors desire tohave the best possible estimates of ongoing or possibly changing betas of competitive funds to develop investment strategies relative to expectedperformance of their portfolios and those of theircompetitors' in the market cycle ahead. Theseestimates will allow inferences to be made withrespect to their competitors expected market outlook. For example, a gradually increasing fundbeta would indicate a bullish outlook on the partof the competitor. A stable and predictable betaestimate will also enhance the validity of the betabased investment performance ranking tools suchas Treynor's (1965) andJensen's (1968) performance measures. The portfolio manager's abilityto select securities is reflected in the sum of returns above or below expectations as defined bybeta. If beta values are not accurate measures ofrisk, they will provide misleading signals about theportfolio manager's performance.
The estimation of betas is important for understanding the risk-return relationship in a thinlytraded market. The investment community desires an efficient market (at least in a semi-strongsense), as it will help to optimally allocate scarceresources (Fama 1970). To ascertain the efficiencyof the market, the information-content or eventtype of studies in finance and accounting rely onthe ordinary least squares (OLS) beta to forcastreturns. Excess returns based on the OLS betaestimates then form the basis for testing the capital market effects of various accounting information or signals. Under this approach, any fluctuation in beta is captured in the OLS residuals, a
characteristic that adversely affects the efficiencyestimates and the power of the tests. The stabilityof the beta is important in this case, and if thebeta is not stable, then appropriate adjustmentsneed to be made to the beta to enhance the powerof conventional capital market tests of information content. The concern over the accuracy ofbeta is its non-stationarity beyond some acceptable level.
Though there is evidence that beta is a robust description of how investors analyse risk under conditions of uncertainty and how they expect their portfolios to perform under these conditions (Sharpe and Cooper, 1972), Fama andFrench (1992) observed that the positive relationship between OLS beta and the average returnson US stocks observed by Black, Jensen andScholes (1972) and Fama and MacBeth (1973)does not seem to hold anymore, and the book-tomarket value of equity is a better explanatory variable of the cross-section of average returns. However, the existing tests cannot conclusively indicate whether this anomaly results from a faultysingle-index asset pricing model and/or a persistent mispricing of securities; hence market professionals and academics still use beta as a measureof market risk or market sensitivity. However, aslong as securities continue to move in line withthe broad market movements, portfolio managers must be concerned about the sensitivity of theirportfolios to the general market, the stability ofthat relationship and the accuracy of the investment tools they utilise. The use ofbeta coefficientsin security portfolio analysis and investments strategy selection will only be of value if betas are stable and thus predictable.
The OLS technique is usually used to estimatebeta as the regression coefficient of a simple linear regression based on data of at least four to sixyears to ensure relative stability of the beta (Alexanderand Chervany (1980)). However, the OLSbeta for common stocks has been found to be unstable over time (Levy (1971), Sharpe and Cooper(1972) ). The KLSE is a thinly-traded market andas such the beta in the market model is estimatedwith a serious bias leading to a non-synchronoustrading problem (Ariffand Lim, 1989; Annuar andShamsher, 1991). This problem arises when themarket index at time t is based on stocks whoseclosing prices do not synchronise at t. Conse-
44 PertanikaJ. Soc. Sci. & Hum. Vol. 2 No.1 1994
The Stability and Predictability of Betas: Evidence from the Kuala Lumpur Stock Exchange
quently, any estimate of return or systematic riskon a thinly-traded share is strictly not comparablewith another thinly-traded share or with continuously traded shares. Scholes-Williams (1977),Dimson (1979) and Fowler-Rorke (1983) suggestcorrections to the OLS beta estimate to mitigatethis non-synchronous trading problem.
The objective of this study is to examine thestability and predictability of the three leads/lagsversion of Fowler-Rorke betas of firms listed onthe Kuala Lumpur Stock Exchange (KLSE). TheFowler-Rorke betas are used as there is evidence(Ariffand Lim, 1989) that these betas efficientlymitigate the thinness of the trading problem moreeffectively with the three leads/lags version.
The rest of the paper is organised as follows:Section 2 describes the data and the distributionof betas while Section 3 discusses the stability ofindividual security betas. Section 4 presents thestability of portfolio betas and Section 5 evaluatesthe predictability ofbetas. Section 6 concludes thepaper.
DATA AND DISTRIBUTION OF BETAS
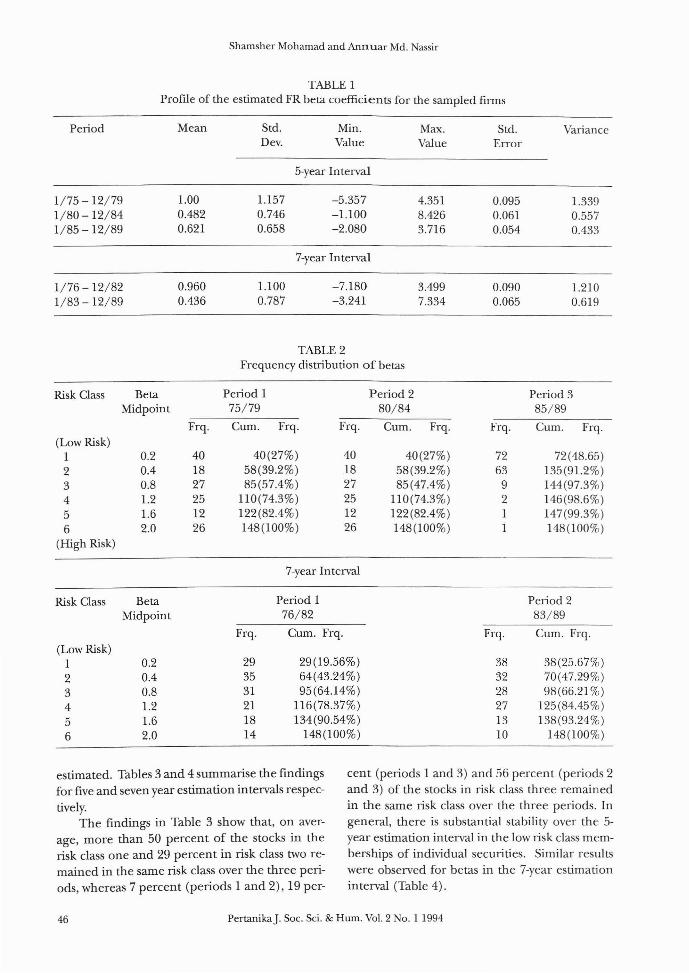
This study covers the monthly returns of 148 ordinary stocks traded on the KLSE over the periodfromJanuary 1975 to December 1989. The stability and predictability of the betas are studied overthree 5-year periods: January 1975 to December1979; January 1980 to December 1984; and January 1985 to December 1989, and two 7-year periods:January 1976 to December 1982 andJanuary1983 to December 1989. The Fowler-Rorke (FR)betas are estimated as suggested by Fowler-Rorke(1983) 1 • The equally-weighted index of all listedstocks (compiled by the authors) on KLSE is usedas a proxy for market index. The profile of theFR beta coefficients of the sampled firms for the 5and 7-year estimation intervals are summarised in
Table 1.For both the 5 and 7-year estimation intervals
there were negative betas; the minimum beta forthe former interval is -5.36 and for the latter interval -7.18. The mean of all betas is 1.00 for the75/79 period with a standard deviation of 1.15,
whereas the mean beta for the 76/82 period is0.96 with a standard deviation of 1.10. To ascertain the distribution of betas, the sample was categorised into six risk classes according to their betavalues in ascending order. The frequency distribution is summarised in Table 2.
For the 5-year estimation interval, less than40 stocks (27%) for periods 1 and 2 and 72 stocks(48.6%) for period 3 had beta values of less than0.3, whereas 26 stocks (17.5%) ofperiods I and 2and one stock of the third period had beta valuesgreater than 1.8. The number of stocks outsidethe beta range of 0.3 to 1.8 was small. A similardistribution of betas was observed for betas in the7-year interval.
STABILITY OF SECURITIES BETAS
The stability of beta has received considerable attention in the literature of financial economics.Baesel (1974) provides evidence that the stabilityof beta is dependent upon the estimation periodlength. However, Theobald (1981) demonstratedthat beta stability does not increase indefinitelywith the estimation period length, thereby implying an optimal estimation period. This study examines the stability ofbeta estimates for individualstocks and portfolios on the KLSE over five-yearand seven-year periods using the transition matrixand product moment correlation. If the betas arestable and hence predictable, then investors canassess the future riskiness of their investmen ts frompast riskiness. The correlation analysis measuresthe strength of co-movement of the two vatiables(betas in this case) as well as test of significance~.
To test the stability of betas over differentlengths of estimation period, the rates of returnwere first calculated for each stock and the market index. Then for the 15-year sample period(1975-1989), beta coefficients were calculated forthe consecutive 5 years resulting in 3 betas perstock. Two betas per stock were calculated for twoconsecutive 7-year estimation intervals. The stockswere then ranked into different risk classes andthe number of stocks that remained in the samerisk class over the various estimation intervals were
'The procedures to estimate the Fowler-Rorke (FR) betas are explained in Ariffand.Tohnson [1990].'The significance of correlation coefficient is evaluated using the F-statistics [Ramanathan, 1992 pp. 105-106].
PertanikaJ. Soc. Sci. & Hum. Vol. 2 No.1 1994 45
Shamsher Mohamad and Annuar Md. Nassir
TABLE 1Profile of the estimated FR beta coefficients for the sampled firms
Period Mean Std. Min. Max. Std. VarianceDev. Value Value Error
5-year Interval
1/75 - 12/79 1.00 1.157 -5.357 4.351 0.095 1.3391/80 -12/84 0.482 0.746 -1.100 8.426 0.061 0.5571/85 -12/89 0.621 0.658 -2.080 3.716 0.054 0.433
7-year Interval
1/76 - 12/82 0.960 1.100 -7.180 3.499 0.090 1.2101/83 - 12/89 0.436 0.787 -3.241 7.334 0.065 0.619
TABLE 2Frequency distribution of betas
Risk Class Beta Period 1 Period 2 Period 3Midpoint 75/79 80/84 85/89
Frq. Cum. Frq. Frq. Cum. Frq. Frq. Cum. Frq.(Low Risk)
1 0.2 40 40(27%) 40 40(27%) 72 72(48.65)2 0.4 18 58(39.2%) 18 58(39.2%) 63 135(91.2%)3 0.8 27 85(57.4%) 27 85(47.4%) 9 144(97.3%)4 1.2 25 110(74.3%) 25 110(74.3%) 2 146(98.6%)5 1.6 12 122(82.4%) 12 122(82.4%) I 147(99.3%)6 2.0 26 148(100%) 26 148(100%) 1 148(100%)
(High Risk)
7-year Interval
Risk Class Beta Period 1 Period 2Midpoint 76/82 83/89
Frq. Cum. Frq. Frq. Cum. Frq.(Low Risk)
1 0.2 29 29(19.56%) 38 38(25.67%)
2 0.4 35 64(43.24%) 32 70(47.29%)3 0.8 31 95(64.14%) 28 98(66.21 %)4 1.2 21 116(78.37%) 27 125(84.45%)5 1.6 18 134(90.54%) 13 138 (93.24%)
6 2.0 14 148(100%) 10 148(100%)
estimated. Tables 3 and 4 summarise the findingsfor five and seven year estimation in tervals respec
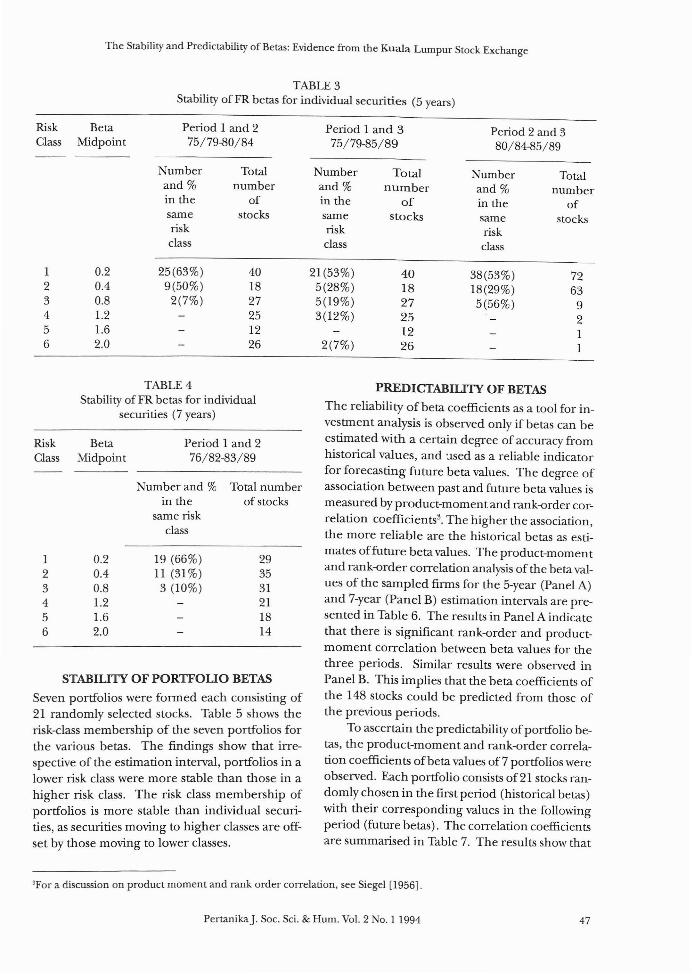
tively.The findings in Table 3 show that, on aver
age, more than 50 percent of the stocks in therisk class one and 29 percent in risk class two remained in the same risk class over the three periods, whereas 7 percent (periods 1 and 2),19 per-
cent (periods 1 and 3) and 56 percent (periods 2and 3) of the stocks in risk class three remainedin the same risk class over the three periods. Ingeneral, there is substantial stability over the 5year estimation interval in the low risk class memberships of individual securities. Similar resultswere observed for betas in the 7-year estimationinterval (Table 4).
46 PertanikaJ. Soc. Sci. & Hum. Vol. 2 No. I 1994
The Stability and Predictability of Betas: Evidence from the Kuala Lumpur Stock Exchange
TABLE 3Stability ofFR betas for individual securities (5 years)
Risk Beta Period 1 and 2 Period 1 and 3 Period 2 and 3Class Midpoint 75/79-80/84 75/79-85/89 80/84-85/89
Number Total Number Total Number Totaland % number and % number and % numberin the of in the of in the ofsame stocks same stocks same stocksrisk risk riskclass class class
1 0.2 25(63%) 40 21(53%) 40 38(53%) 722 0.4 9(50%) 18 5(28%) 18 18(29%) 633 0.8 2(7%) 27 5(19%) 27 5(56%) 94 1.2 25 3(12%) 25 25 1.6 12 12 I6 2.0 26 2(7%) 26 1
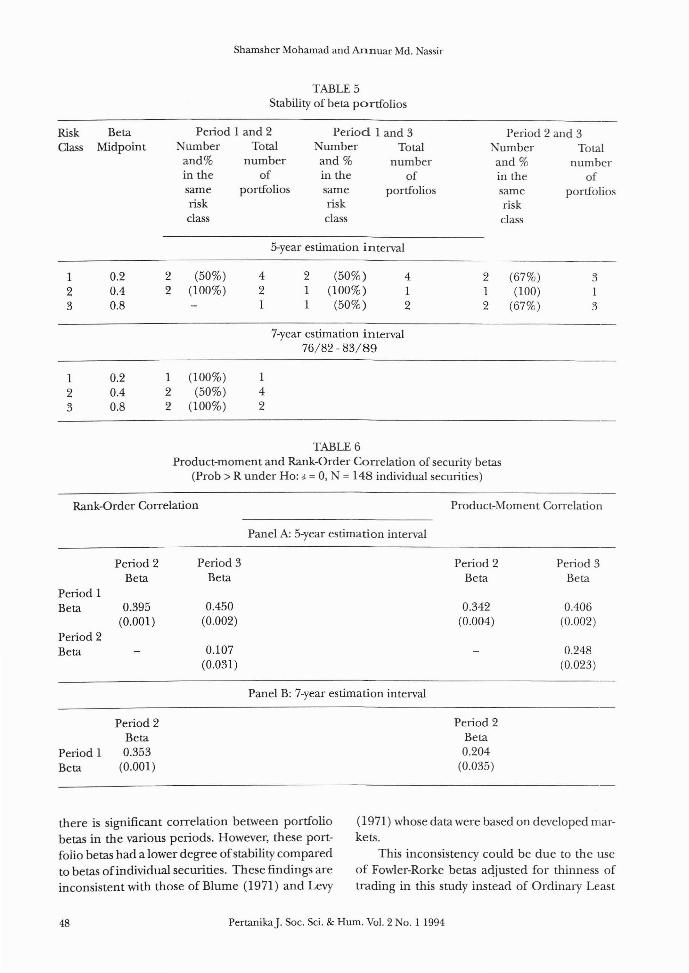
STABIliTY OF PORTFOliO BETAS
Seven portfolios were formed each consisting of21 randomly selected stocks. Table 5 shows therisk-class membership of the seven portfolios forthe various betas. The findings show that irrespective of the estimation interval, portfolios in alower risk class were more stable than those in ahigher risk class. The risk class membership ofportfolios is more stable than individual securities, as securities moving to higher classes are offset by those moving to lower classes.
TABLE 4Stability ofFR betas for individual
securities (7 years)
Period 1 and 276/82-83/89
RiskClass
123456
BetaMidpoint
0.20.40.81.21.62.0
Number and %in the
same riskclass
19 (66%)11 (31 %)3 (10%)
Total numberof stocks
293531211814
PREDICTABIliTY OF BETAS
The reliability afbeta coefficients as a tool for investment analysis is observed only if betas can beestimated with a certain degree of accuracy fromhistorical values, and :lsed as a reliable indicatorfor forecasting future beta values. The degree ofassociation between past and future beta values ismeasured by product-moment and rank-order correlation coefficients3. The higher the association,the more reliable are the historical betas as estimates offuture beta values. The product-momentand rank-order correlation analysis of the beta values of the sampled firms for the 5-year (Panel A)and 7-year (Panel B) estimation intervals are presented in Table 6. The results in Panel A indicatethat there is significant rank-order and productmoment correlation between beta values for thethree periods. Similar results were observed inPanel B. This implies that the beta coefficients ofthe 148 stocks could be predicted from those ofthe previous periods.
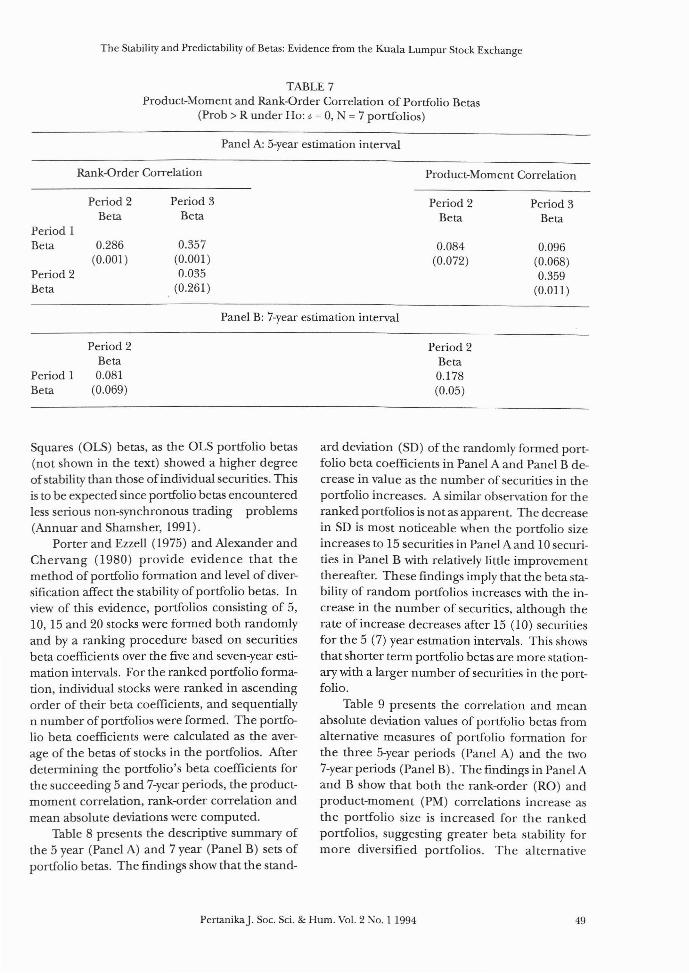
To ascertain the predictability ofportfolio betas, the product-moment and rank-order correlation coefficients ofbeta values of7 portfolios wereobserved. Each portfolio consists of21 stocks randomly chosen in the first period (historical betas)with their corresponding values in the followingperiod (future betas). The correlation coefficientsare summarised in Table 7. The results show that
'For a discussion on product moment and rank order correlation, see Siegel [1956].
PertanikaJ. Soc. Sci. & Hum. Vol. 2 No. I 1994 47
Shamsher Mohamad and Annuar Md. Nassir
TABLE 5Stability of beta portfolios
RiskClass
BetaMidpoint
Period I and 2Number Total
and% numberin the ofsame portfoliosriskclass
Period 1 and 3Number Totaland % numberin the ofsame portfoliosriskclass
Period 2 and 3Number Totaland % numberin the ofsame portfoliosriskclass
5-year estimation interval
123
123
0.20.40.8
0.20.40.8
2 (50%)2 (100%)
I (100%)2 (50%)2 (100%)
42I
I42
2 (50%)1 (100%)1 (50%)
7-year estimation interval76/82 - 83/89
412
2I2
(67%)(100)
(67%)
3I3
TABLE 6Product-moment and Rank-Order Correlation of security betas
(Prob > R under Ho: d- = 0, N = 148 individual securities)
Rank-Order Correlation
Panel A: 5-year estimation interval
Product-Moment Correlation
Period IBeta
Period 2Beta
Period IBeta
Period 2Beta
0.395(0.001)
Period 2Beta0.353
(0.001)
Period 3Beta
0.450(0.002)
0.107(0.031)
Panel B: 7-year estimation interval
Period 2Beta
0.342(0.004)
Period 2Beta0.204
(0.035)
Period 3Beta
0.406(0.002)
0.248(0.023)
there is significant correlation between portfoliobetas in the various periods. However, these portfolio betas had a lower degree ofstability comparedto betas of individual securities. These findings areinconsistent with those of Blume (1971) and Levy
(1971) whose data were based on developed markets.
This inconsistency could be due to the useof Fowler-Rorke betas adjusted for thinness oftrading in this study instead of Ordinary Least
48 PertanikaJ. Soc. Sci. & Hum. Vol. 2 No.1 1994
The Stability and Predictability of Betas: Evidence from the Kuala Lumpur Stock Exchange
TABLE 7Product-Moment and Rank-Order Correlation of Portfolio Betas
(Prob > R under Ho: 1- = 0, N = 7 portfolios)
Panel A: 5-year estimation interval
Rank-Order Correlation Product-Moment Correlation
Period 1Beta
Period 2Beta
Period 1Beta
Period 2Beta
0.286(0.001 )
Period 2Beta0.081
(0.069)
Period 3Beta
0.357(0.00l)0.035
(0.261 )
Panel B: 7-year estimation interval
Period 2Beta
0.084(0.072)
Period 2Beta0.178(0.05)
Period 3Beta
0.096(0.068)0.359
(0.011 )
Squares (OLS) betas, as the OLS portfolio betas(not shown in the text) showed a higher degreeofstability than those of individual securities. Thisis to be expected since portfolio betas encounteredless serious non-synchronous trading problems(Annuar and Shamsher, 1991).
Porter and Ezzell (1975) and Alexander andChervang (1980) provide evidence that themethod of portfolio formation and level of diversification affect the stability of portfolio betas. Inview of this evidence, portfolios consisting of 5,10, 15 and 20 stocks were formed both randomlyand by a ranking procedure based on securitiesbeta coefficients over the five and seven-year estimation intervals. For the ranked portfolio formation, individual stocks were ranked in ascendingorder of their beta coefficients, and sequentiallyn number of portfolios were formed. The portfolio beta coefficients were calculated as the average of the betas of stocks in the portfolios. Afterdetermining the portfolio's beta coefficients forthe succeeding 5 and 7-year periods, the productmoment correlation, rank-order correlation andmean absolute deviations were computed.
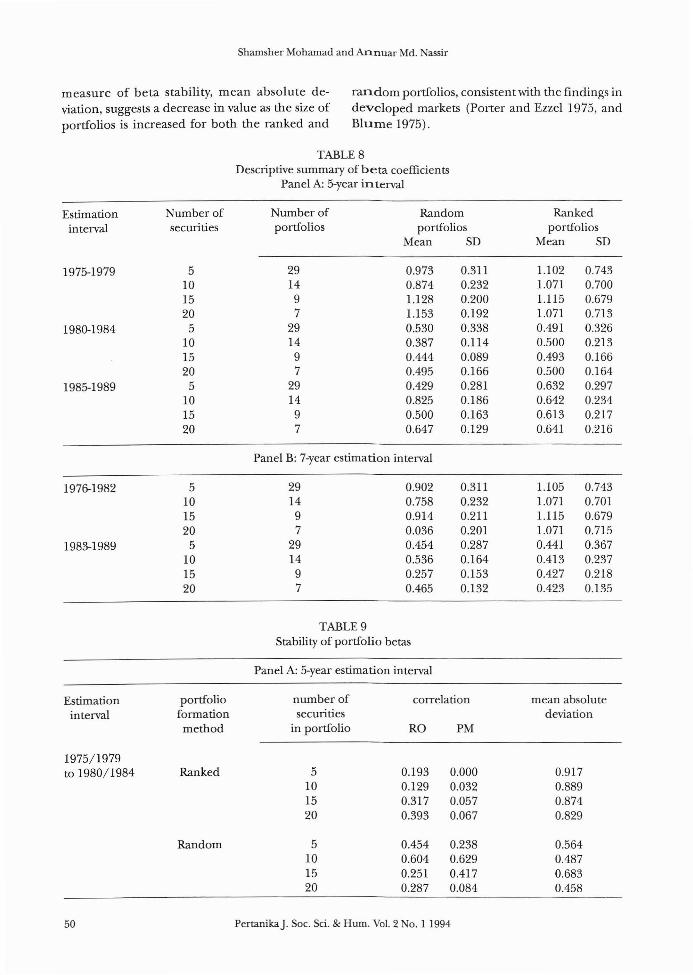
Table 8 presents the descriptive summary ofthe 5 year (Panel A) and 7 year (Panel B) sets ofportfolio betas. The findings show that the stand-
ard deviation (SD) of the randomly formed portfolio beta coefficients in Panel A and Panel B decrease in value as the number of securities in theportfolio increases. A similar observation for theranked portfolios is not as apparent. The decreasein SD is most noticeable when the portfolio sizeincreases to 15 securities in Panel A and 10 securities in Panel B with relatively little improvementthereafter. These findings imply that the beta stability of random portfolios increases with the increase in the number of securities, although therate of increase decreases after 15 (10) securitiesfor the 5 (7) year estmation intervals. This showsthat shorter term portfolio betas are more stationary with a larger number of securities in the portfolio.
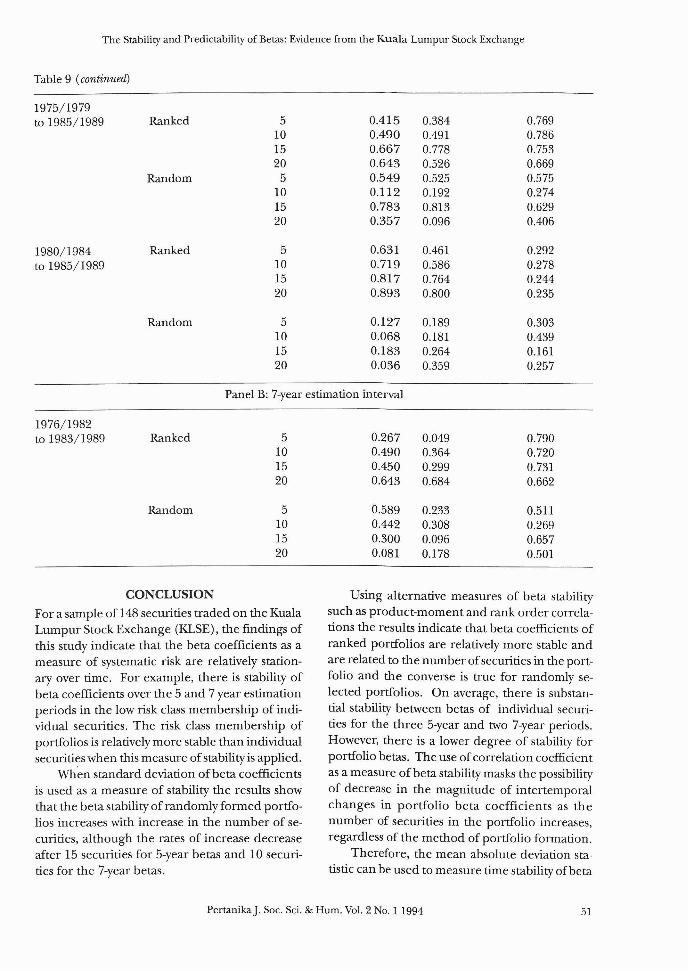
Table 9 presents the correlation and meanabsolute deviation values of portfolio betas fromalternative measures of portfolio formation forthe three 5-year periods (Panel A) and the two7-year periods (Panel B). The findings in Panel Aand B show that both the rank-order (RO) andproduct-moment (PM) correlations increase asthe portfolio size is increased for the rankedportfolios, suggesting greater beta stability formore diversified portfolios. The alternative
PertanikaJ. Soc. Sci. & Hum. Vol. 2 No. I 1994 49
Shamsher Mohamad and Annuar Md. Nassir
measure of beta stability, mean absolute de- random portfolios, consistent with the findings inviation, suggests a decrease in value as the size of developed markets (Porter and Ezzel 1975, andportfolios is increased for both the ranked and Blume 1975).
TABLE 8Descriptive summary of beta coefficients
Panel A: 5-year interval
Estimation Number of Number of Random Rankedinterval securities portfolios portfolios portfolios
Mean SD Mean SD
1975-1979 5 29 0.973 0.311 1.102 0.74310 14 0.874 0.232 1.071 0.70015 9 1.128 0.200 1.115 0.67920 7 1.153 0.192 1.071 0.713
1980-1984 5 29 0.530 0.338 0.491 0.32610 14 0.387 0.114 0.500 0.21315 9 0.444 0.089 0.493 0.16620 7 0.495 0.166 0.500 0.164
1985-1989 5 29 0.429 0.281 0.632 0.29710 14 0.825 0.186 0.642 0.23415 9 0.500 0.163 0.613 0.21720 7 0.647 0.129 0.641 0.216
Panel B: 7-year estimation interval
1976-1982 5 29 0.902 0.311 1.105 0.74310 14 0.758 0.232 1.071 0.70115 9 0.914 0.211 1.115 0.67920 7 0.036 0.201 1.071 0.715
1983-1989 5 29 0.454 0.287 0.441 0.36710 14 0.536 0.164 0.413 0.23715 9 0.257 0.153 0.427 0.21820 7 0.465 0.132 0.423 0.135
TABLE 9Stability of portfolio betas
Panel A: 5-year estimation interval
Estimationinterval
1975/1979to 1980/1984
portfolioformationmethod
Ranked
number of correlationsecurities
in portfolio RO PM
5 0.193 0.00010 0.129 0.03215 0.317 0.05720 0.393 0.067
5 0.454 0.23810 0.604 0.62915 0.251 0.41720 0.287 0.084
mean absolutedeviation
0.9170.8890.8740.829
50 PertanikaJ. Soc. Sci. & Hum. Vol. 2 No.1 1994
The Stability and Predictability of Betas: Evidence from the Kuala Lumpur Stock Exchange
Table 9 (continueti)
1975/1979to 1985/1989 Ranked 5 0.415 0.384 0.769
10 0.490 0.491 0.78615 0.667 0.778 0.75320 0.643 0.526 0.669
Random 5 0.549 0.525 0.57510 0.112 0.192 0.27415 0.783 0.813 0.62920 0.357 0.096 0.406
1980/1984 Ranked 5 0.631 0.461 0.292to 1985/1989 10 0.719 0.586 0.278
15 0.817 0.764 0.24420 0.893 0.800 0.235
Random 5 0.127 0.189 0.30310 0.068 0.181 0.43915 0.183 0.264 0.16120 0.036 0.359 0.257
Panel B: 7-year estimation interval
1976/1982to 1983/1989 Ranked 5 0.267 0.049 0.790
10 0,490 0.364 0.72015 0.450 0.299 0.73120 0.643 0.684 0.662
Random 5 0.589 0.233 0.51110 0.442 0.308 0.26915 0.300 0.096 0.65720 0.081 0.178 0.501
CONCLUSION
For a sample of 148 securities traded on the KualaLumpur Stock Exchange (KLSE), the findings ofthis study indicate that the beta coefficients as ameasure of systematic risk are relatively stationary over time. For example, there is stability ofbeta coefficients over the 5 and 7 year estimationperiods in the low risk class membership of individual securities. The risk class membership ofportfolios is relatively more stable than individualsecurities when this measure of stability is applied.
Wh'en standard deviation of beta coefficientsis used as a measure of stability the results showthat the beta stability of randomly formed portfolios increases with increase in the number of securities, although the rates of increase decreaseafter 15 securities for 5-year betas and 10 securities for the 7-year betas.
Using alternative measures of beta stabilitysuch as product-moment and rank order correlations the results indicate that beta coefficients ofranked portfolios are relatively more stable andare related to the number ofsecurities in the portfolio and the converse is true for randomly selected portfolios. On average, there is substantial stability between betas of individual securities for the three 5-year and two 7-year periods.However, there is a lower degree of stability forportfolio betas. The use of correlation coefficientas a measure of beta stability masks the possibilityof decrease in the magnitude of intertemporalchanges in portfolio beta coefficients as thenumber of securities in the portfolio increases,regardless of the method of portfolio formation.
Therefore, the mean absolute deviation statistic can be used to measure time stability ofbeta
PertanikaJ. Soc. Sci. & Hum. Vol. 2 No.1 1994 51
Shamsher Mohamad and Annuar Md. Nassir
coefficients. The results show that time stability
of portfolio beta coefficients are directly related
to the number of securities in the portfolio and
are significantly stable for portfolios of 15 or moresecurities, irrespective of the method ofportfolio
formation.Overall, the results indicate that the individual
securities and portfolio betas are relatively stable
and can be reliably used for portfolio selection
and investment decisions.
REFERENCES
ANNUAR, M.N and M. SHAMSHER. 1991. Estimation ofunbiased systematic risk measures: The caseof Kuala Lumpur Stock Exchange (KLSE).M'sian Mgt Rev. 26(2): 35-50.
AJuFF, M. and L.W. JOHNSON. 1990. Securities Marketsand Stock Pricing: Evidence from a Developing Capital Market in Asia. Singapore. Longman Singapore Publishers (Pte) Ltd.
AJuFF, M. and K M. LIM. Methods selection for correcting non-synchronous trading bias in beta riskof stocks. Working paper presented at Financeand Banking Seminar, National University ofSingapore.
ALEXANDER, GJ. and N.L. CHERVANY. 1980. On the estimation and stability of beta. J Finan. andQuant. Analys. 15: 123-137.
BAESEL, J.B. 1974. On the assessment of risk: somefurther considerations.J Finan. 29: 1491-1494.
BLACK, F, M.JENSEN and M. SCHOLES. 1972. The Capital Asset Pricing Model: Some Empirical Tests.In Studies in the Theory ofCapital Markets, ed. M.C.Jensen, p. 79-121 New York. Praeger.
BLUME, M.K 1971. On the assessment of risk.J Finan.26: 1-10.
DIMSON, E. 1979. Risk measurement when shares aresubjected to infrequent trading.J Finan. Econs.7: 197-226.
FAMA, K F. 1970. Efficient market markets: a reviewof theory and empirical work. J Finan. 25(2):383-417.
FAMA, E.F. and KR FRENCH, 1992. The cross-sectionof expected stock returns.J Finan. 47: 427-465.
FAMA, KF. andJ. McBETH. 1973. Risk, return and equilibrium: empirical tests. J Polito £Con. 71: 607636.
FOWLER, DJ. and C.H. RORKE. 1983. Risk managementwhen shares are subjected to infrequent trading. J Finan. Econs. 12: 279-289.
JENSEN, M. 1968. The performance of mutual fundsin the period 1945-1964.J Finan. 23: 389-419.
LEVY, RA. 1971. Stationary ofbeta coefficients. Finan.Analysts.J 27: 55-62.
LINTER,J. 1965. The valuation of risky assets and theselection of risky investments in stock profilesand capital budgets. Rev. Econs and Stats. 47: 1337.
PHUONG, T.H. and w.T. WENG. 1986. Stability andPredicability of Betas. In Investment Analysis andManagement. ed. Saw See Hock and Lim ChooPengo Singapore: Longman Singapore (Pte) Ltd.
PORTER, R.B. andJ.R. EZZEL. 1975. A note on the predictability ofbeta coefficients. J Bus. Res. 3: 367372.
RAMANATHAN, R 1992. Introductory Econometics withApplications. (2nd Edn.). Dryden Press.
SIEGEL, S. 1956. Non Parametric Statistics for the Behavioural Sciences. Tokyo. McGraw-Hill KogakushaLtd.
SHARPE, W.F. 1964. Capital asset prices: a theory ofmarket equilibrium under conditions of risk. JFinan. 19: 425-442.
SCHOLES, M and J. WILL!Al\1S. 1977. Estimating betasfrom non-synchronous data. J Finan. Econs.5: 309-328.
SHARPE, W.F. and G.M. COOPER. 1972. Risk-returnclasses of New York Stock Exchange commonstocks. Finan. Analy.J 38: 45-50.
THEOBOLD, M. 1981. Beta stationarity and estimationperiod: some analytical results. J Finan. andQuant. Analys. 16: 747-757.
TREYNOR,J. 1965. How to rate management of investment funds. Ham Bus. Review. 63-75.
WALLACE A. 1980. Is beta dead. Institutional Invest01:Gan/Feb) 23-30.
(Received 19 May 1993)
52 PertanikaJ. Soc. Sci. & Hum. Vol. 2 No.1 1994