the influence of tidal activities on water quality of paka river
TRANSCRIPT
Malaysian Journal of Analytical Sciences, Vol 19 No 5 (2015): 979 - 990
979
MALAYSIAN JOURNAL OF ANALYTICAL SCIENCES
Published by The Malaysian Analytical Sciences Society
THE INFLUENCE OF TIDAL ACTIVITIES ON WATER QUALITY OF PAKA
RIVER TERENGGANU, MALAYSIA
(Pengaruh Aktiviti Pasang Surut Kepada Kualiti Air Sungai Paka Terengganu, Malaysia)
Muhammad Barzani Gasim*, Nadila Abdul Khalid, Haniff Muhamad
East Coast Environmental Research Institute (ESERI),
Universiti Sultan Zainal Abidin,
Gong Badak Campus, 21300 Kuala Terengganu, Terengganu, Malaysia
*Corresponding author: [email protected]
Received: 14 April 2015; Accepted: 9 July 2015
Abstract
A study to determine the water quality at seven stations was carried out on the Paka River, Terengganu between two tides.
Sampling begins from the estuary of the Paka River, and ended about 14 km from the mouth by a distance 2 km for each station.
Sampling was carried out between two tides (high and low tides) and within two variations of time representing the first
sampling (wet period) and the second sampling (dries period). Water quality parameters such as temperature, dissolved oxygen,
conductivity, salinity, pH and total dissolved solids (TDS) were measured directly in the field using multiparameter the YSI 556.
Analysis of sodium, magnesium sulfate was carried out according to the APHA and HACH methods. Determination of primary
data and physicochemical characteristics of the River Paka are measured and analyzed for each sampling station.
Physicochemical parameters such as temperature, pH, dissolved oxygen, total dissolved solids, salinity, electrical conductivity,
sodium, and magnesium sulphate concentration were used to determine its relationship of the movement of tides and other
factors that affect water quality. Station 1 shows the highest reading physicochemical parameters than station 7 during the first
and second samplings. The higher reading most of physicochemical parameters was also observed during the dry season, this is
because the river flow from upstream was decline due to low rainfall intensity.
Keywords: Paka River, monsoon season, water quality parameter, sea water intrusion
Abstrak
Satu kajian penentuan kualiti air di tujuh stesen pensampelan telah dijalankan di Sungai Paka, Terengganu di antara keadaan laut
pasang dan surut. Persampelan bermula dari muara Sungai Paka, dan berakhir kira-kira 14 km dari muara berdasarkan jarak 2 km
setiap stesen. Persampelan telah dijalankan berdasarkan keadaan pasang surut (air laut pasang dan air surut) dalam dua variasi
masa yang mewakili pensampelan pertama (tempoh basah) dan persampelan kedua (tempoh kering). Parameter kualiti air seperti
suhu, oksigen terlarut, kekonduksian, kemasinan, pH dan jumlah pepejal terlarut (TDS) diukur langsung di lapangan dengan
menggunakan multiparameter YSI 556. Analisis bagi natrium, magnesium sulfat telah dijalankan mengikut kaedah APHA dan
HACH. Penentuan data primer dan ciri-ciri fizikokimia Sungai Paka diukur dan dianalisis bagi setiap stesen persampelan.
Parameter fizikokimia yang terdiri daripada suhu, pH, oksigen terlarut, jumlah pepejal terlarut, kemasinan, kekonduksian
elektrik, natrium, kepekatan sulfat dan magnesium telah digunakan bagi menentukan hubungannya dengan pergerakan air laut
dan faktor-faktor lain yang mempengaruhi kualiti air. Stesen 1 menunjukkan bacaan tertinggi parameter fizikokimia tertinggi
berbanding stesen 7bagi kebanyakan parameter fizikokimia semasa pasang dan surut dalam pensampelan pertama dan kedua.
Bacaan yang lebih tinggi bagi kebanyakan parameter fizikokimia juga ditunjukkan semasa musim kering, ini adalah kerana
aliran sungai dari hulu menurun disebabkan keamatan hujan yang rendah.
Kata kunci: Sungai Paka, musim tengkujuh, parameter kualiti air, intrusi air laut
ISSN
1394 - 2506
Gasim et al: THE INFLUENCE OF TIDAL ACTIVITIES ON WATER QUALITY OF PAKA RIVER
TERENGGANU, MALAYSIA
980
Introduction
A semi-enclosed tropical continental shelf sea that situated between east and west of Malaysia is called the southern
South China Sea. Sea surface temperature of South Sea China is affected by monsoons as stated by [1]. Northeast
monsoon during winter season enhances a low and high pressure system over Australia and Asia, respectively. This
monsoon causes discharge of heavy precipitation and fresh water due to extreme rainfall, which later lower the
salinity of water mass in Peninsular Malaysia eastern coast. Besides, sea surface temperature also declines around
1ºC as reported by [2,3], as cloudy skies during this season reducing the penetration of solar radiation to the sea
surface.
On the other hand, southwest monsoon caused by a high pressure system over Australia and a low pressure system
over Asia during northern summer. This is because the intensity of solar heating rises during the summer that leads
to blistering temperature over the Asian landmass. As hot air expands and rises upwards, a semi-permanent low-
pressure area develops. In addition, there is a lack of clouds during this season, which causes the salinity field
pattern and sea surface temperature is rising due to increasing the penetration of solar radiation into sea surface.
However, increase exposure of solar radiation caused by global warming, becomes a critical issue as the sea surface
temperature gradually increases.Sea level rise interrupts the freshwater properties as the projection of salinization
towards groundwater and estuaries reservoirs.
Thus, disturbance in water quality of freshwater such as rivers by the influx of saline water might cause a certain
fish in stress condition, as some species, especiallyin juvenile and egg stages which cannot tolerate the change in
water quality. For example, eggs of trout cod have limited survival rate of 50% when exposes to changing salinity
level of fresh water around 450 mg/L [4].
Besides, deformation occurs due to differences in propagation velocities at low and high water, since wave cannot
propagate at the same pattern as the water depth decreases from deep water to shallow water. The high tidal water
becomes a sharply peaked event and low water become a long flat events are the result of wave deformation.
Damping also one of the phenomena that can influences wave propagation. A river flowing down a steep slope or
gradient has higher velocity than one which flows down a gentler gradient, higher water velocity at the upstream
during low tide may due to the greater volume of freshwater drainage, as compared to the downstream [5,6].
Damping occurs when the friction between flowing water and the bottom, especially in the shallower parts of the
estuary cause energy loss and as a result the wave height will be reduced.A study conducted by [7] stated that
coastal populations and ecosystems can be affected by sea level rise through coastal inundation, flooding and saline
intrusion. A study by [8] showed that sea level rise cause sodium concentration in excess of 50 mg/L to be present
in aquifer recharge water of Delaware River, Philadelphia.A study conducted by [9] showed that most of the tidal
ranges are usually highest during spring tides, while low tides are typically higher and high tides are lower during
neap tides. In the mixed tide, the diurnal and semidiurnal oscillations are both important factors and the tide is
characterized by a large inequality in the high water heights, low water heights, or both. There are usually two high
and two low waters each day, but occasionally the tide may become diurnal [10].
Concluded that conductivity alone should be sufficient to establish whether a seawater intrusion is occurring or not.
However, other parameters such as calcium, chloride, magnesium, potassium, sodium and sulphate are useful
chemical analyses to confirm conductivity readings. High tides increase the movement of seawater further in the
upstream and affected TDS concentration in the river, this is due to the concentration of high dissolved salts, mainly
consisting of sodium, chloride and magnesium composition in the seawater, which later also increase water’s ability
to conduct electricity since salts and other inorganic chemicals will break into tiny, electrically charged ions when
dissolve in water [11]. Besides, monitor several parameters can be used to detect whether there might be other
reasons such as the effects from natural strata, connate water or contaminated sites that cause an elevated
conductivity.
Malaysian Journal of Analytical Sciences, Vol 19 No 5 (2015): 979 - 990
981
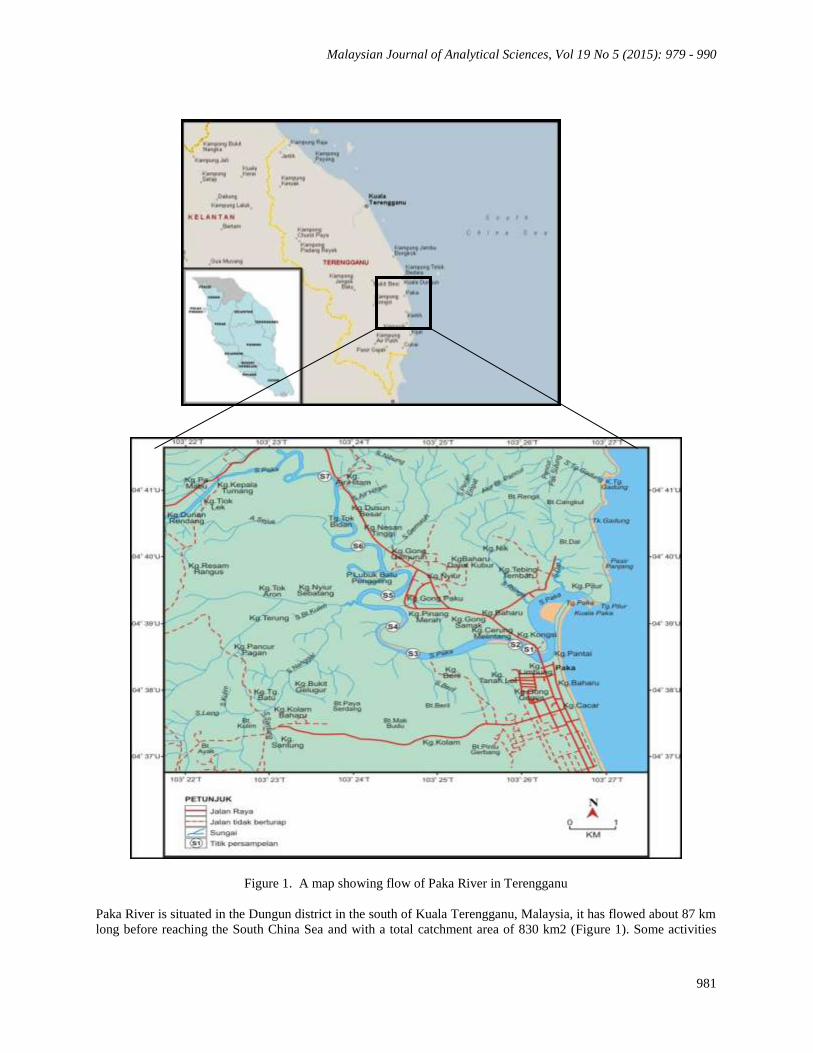
Figure 1. A map showing flow of Paka River in Terengganu
Paka River is situated in the Dungun district in the south of Kuala Terengganu, Malaysia, it has flowed about 87 km
long before reaching the South China Sea and with a total catchment area of 830 km2 (Figure 1). Some activities
Gasim et al: THE INFLUENCE OF TIDAL ACTIVITIES ON WATER QUALITY OF PAKA RIVER
TERENGGANU, MALAYSIA
982
along the river were recognise such as sand mining process removal of sand and gravel from the riverbed; the
development of fishing villages, freshwater fish culture cages; housings and jetty.
Based on [12,13] reports, there were erosion cases had been occurringin the area of Paka River estuary due to
development and reducing vegetation at the river banks along the river and eventually increase the rate of
erosion.The main objective in this study isto determine the selected water quality parameter conditions of the study
area during water tides of dry and wet periods.
Materials and Methods
Sampling Methods
Samplings were carried out two times during the study period, involving the dry and rainy periods, the first
sampling was done in the month of November 2012 which represented the Northeast monsoon (wet period),
meanwhile the second sampling was done in the month of February 2013 which represented the Southeast monsoon
(dry period). The study site was divided into seven stations which 2 km apart, starting at the estuary of the river.
Sampling station was ended where value of water salinity nearly or exactly reaches zero. Prior to in situ parameter
measurements and water sample collection, a Global Positioning System (GPS) was used to locate the exact
coordinate for each sampling station. Sample of surface water was collected about 10 cm below the surface using
500 ml HDPE bottles. Three replicate samples were collected from the respective sampling stations using specific
bottles according to the [14,15] and labelled according to sampling station. Plastic bottles containing water samples
were preserved using nitric acid, were stored at 4ºC in an icebox instantaneously after sampling and were used for
laboratory analysis.
Measurement of In Situ Parameters
Parameters such as temperature, dissolved oxygen, conductivity, salinity, pH and total dissolved solids (TDS) were
directly measured in the field by using Multiparameter YSI 556 meter. All of these equipments were calibrated
before taking any measurements in the field sampling.
Laboratory Analysis
Analyses of water quality parameters such as sodium and magnesium conconcentrations in water sample had been
analysed by using Atomic Absorption Spectrophotometer (AAS).Analyses of sulphate was performed according to
the standard method of analysis [14,15,16]. Reading for each physicochemical parameter was replicated three times
for each station in order to minimize the errors.
Results and Discussion
Water Quality Analysis
There are eight parameters have clear correlations with the influence of seawater movement in the river. Eight
parameters are including pH, dissolved oxygen, total dissolved solids, electrical conductivity (EC), salinity, sodium,
sulphate and magnesium. The results for the physicochemical analysis of the river water samples from seven
different sampling points in Paka River were analysed and recorded.
pH
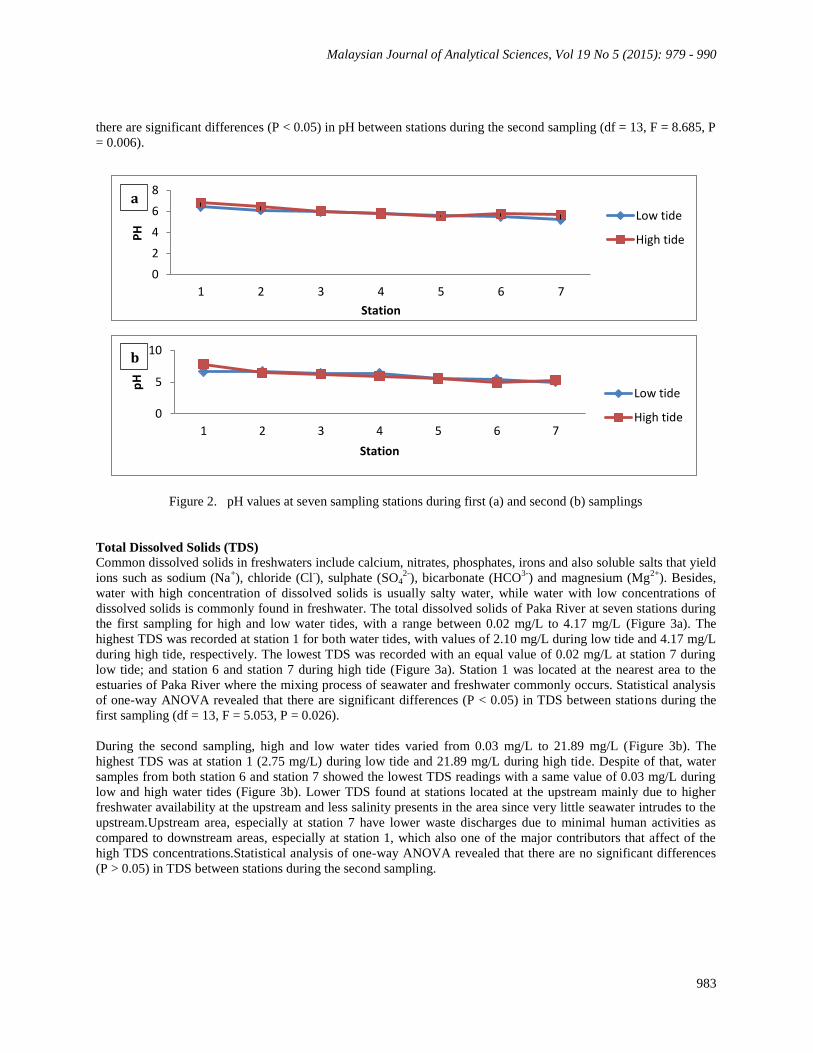
The pH for seven stations was recorded and illustrated in graphs. The pH of Paka River at seven stations during the
first sampling for high and low water tides were ranging from 5.19 to 6.80 (Figure 2a). Station 1 showed the highest
reading of pH for both water tides, which are 6.43 during low tide and 6.80 during high tide. Whereas, the lowest
pH was recorded at station 7 during low tide with a value of 5.19, and station 5 recorded the lowest pH during high
tide with a value of 5.55 (Figure 2a). Statistical analysis of one-way ANOVA revealed that there are significant
differences (P < 0.05) in pH between stations during the first sampling (df = 13, F = 8.585, P = 0.006).
The pH of Paka River at seven stations during the second sampling for high and low water tides were ranging from
4.92 to 7.80 (Figure 2b). The highest pH was recorded at station 1 for both water tides, which are 6.68 during low
tide and 7.80 during high tide. Station 7 showed the lowest pH value of 5.02 during low tide, and station 6 showed
the lowest pH value of 4.92 during high tide. The higher of pH value at station 1 is due to domestic water use and
drainages from development areas near station 1 (Figure 2b). Statistical analysis of one-way ANOVA revealed that
Malaysian Journal of Analytical Sciences, Vol 19 No 5 (2015): 979 - 990
983
there are significant differences (P < 0.05) in pH between stations during the second sampling (df = 13, F = 8.685, P
= 0.006).
Figure 2. pH values at seven sampling stations during first (a) and second (b) samplings
Total Dissolved Solids (TDS)
Common dissolved solids in freshwaters include calcium, nitrates, phosphates, irons and also soluble salts that yield
ions such as sodium (Na+), chloride (Cl
-), sulphate (SO4
2-), bicarbonate (HCO
3-) and magnesium (Mg
2+). Besides,
water with high concentration of dissolved solids is usually salty water, while water with low concentrations of
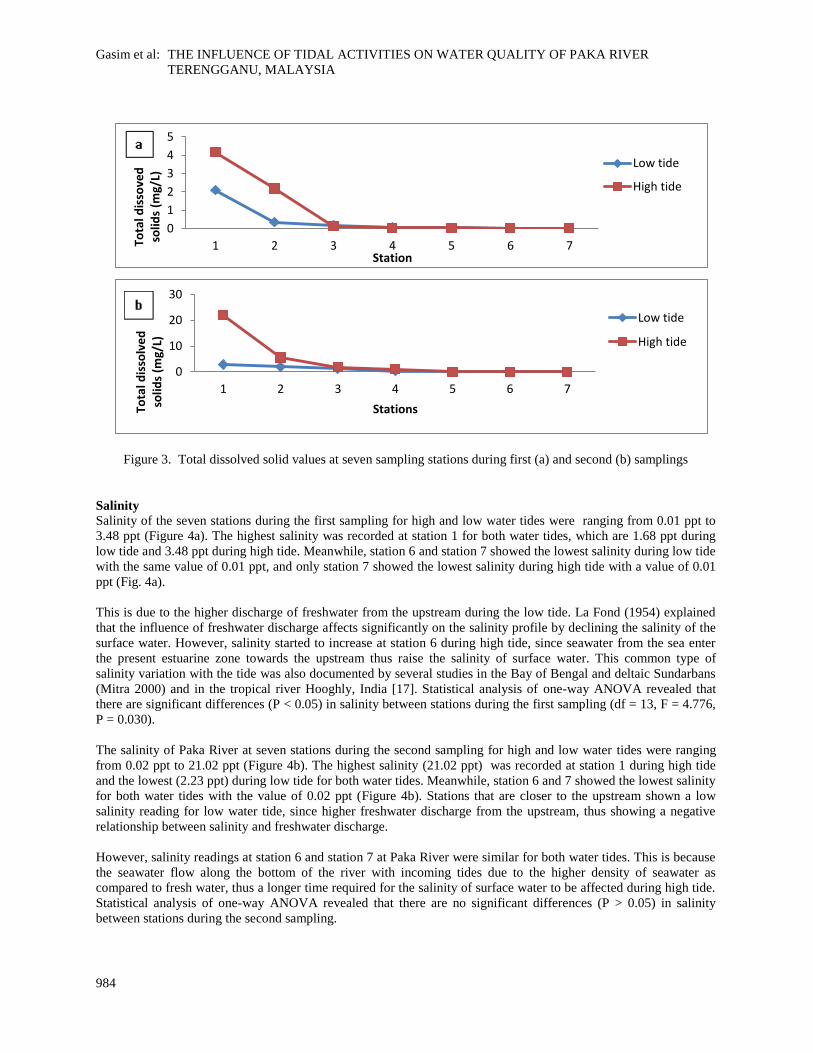
dissolved solids is commonly found in freshwater. The total dissolved solids of Paka River at seven stations during
the first sampling for high and low water tides, with a range between 0.02 mg/L to 4.17 mg/L (Figure 3a). The
highest TDS was recorded at station 1 for both water tides, with values of 2.10 mg/L during low tide and 4.17 mg/L
during high tide, respectively. The lowest TDS was recorded with an equal value of 0.02 mg/L at station 7 during
low tide; and station 6 and station 7 during high tide (Figure 3a). Station 1 was located at the nearest area to the
estuaries of Paka River where the mixing process of seawater and freshwater commonly occurs. Statistical analysis
of one-way ANOVA revealed that there are significant differences (P < 0.05) in TDS between stations during the
first sampling (df = 13, F = 5.053, P = 0.026).
During the second sampling, high and low water tides varied from 0.03 mg/L to 21.89 mg/L (Figure 3b). The
highest TDS was at station 1 (2.75 mg/L) during low tide and 21.89 mg/L during high tide. Despite of that, water
samples from both station 6 and station 7 showed the lowest TDS readings with a same value of 0.03 mg/L during
low and high water tides (Figure 3b). Lower TDS found at stations located at the upstream mainly due to higher
freshwater availability at the upstream and less salinity presents in the area since very little seawater intrudes to the
upstream.Upstream area, especially at station 7 have lower waste discharges due to minimal human activities as
compared to downstream areas, especially at station 1, which also one of the major contributors that affect of the
high TDS concentrations.Statistical analysis of one-way ANOVA revealed that there are no significant differences
(P > 0.05) in TDS between stations during the second sampling.
b
0
2
4
6
8
1 2 3 4 5 6 7
PH
Station
Low tide
High tide
0
5
10
1 2 3 4 5 6 7
pH
Station
Low tide
High tide
a
b
Gasim et al: THE INFLUENCE OF TIDAL ACTIVITIES ON WATER QUALITY OF PAKA RIVER
TERENGGANU, MALAYSIA
984
Figure 3. Total dissolved solid values at seven sampling stations during first (a) and second (b) samplings
Salinity
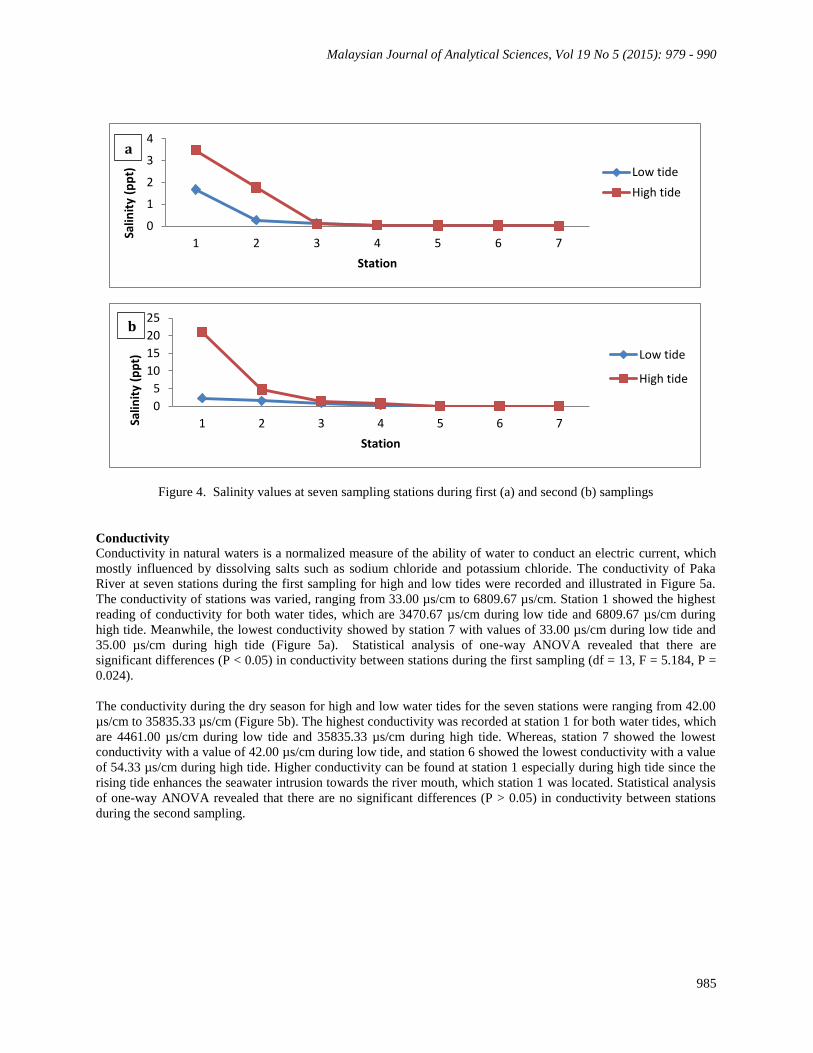
Salinity of the seven stations during the first sampling for high and low water tides were ranging from 0.01 ppt to
3.48 ppt (Figure 4a). The highest salinity was recorded at station 1 for both water tides, which are 1.68 ppt during
low tide and 3.48 ppt during high tide. Meanwhile, station 6 and station 7 showed the lowest salinity during low tide
with the same value of 0.01 ppt, and only station 7 showed the lowest salinity during high tide with a value of 0.01
ppt (Fig. 4a).
This is due to the higher discharge of freshwater from the upstream during the low tide. La Fond (1954) explained
that the influence of freshwater discharge affects significantly on the salinity profile by declining the salinity of the
surface water. However, salinity started to increase at station 6 during high tide, since seawater from the sea enter
the present estuarine zone towards the upstream thus raise the salinity of surface water. This common type of
salinity variation with the tide was also documented by several studies in the Bay of Bengal and deltaic Sundarbans
(Mitra 2000) and in the tropical river Hooghly, India [17]. Statistical analysis of one-way ANOVA revealed that
there are significant differences (P < 0.05) in salinity between stations during the first sampling (df = 13, F = 4.776,
P = 0.030).
The salinity of Paka River at seven stations during the second sampling for high and low water tides were ranging
from 0.02 ppt to 21.02 ppt (Figure 4b). The highest salinity (21.02 ppt) was recorded at station 1 during high tide
and the lowest (2.23 ppt) during low tide for both water tides. Meanwhile, station 6 and 7 showed the lowest salinity
for both water tides with the value of 0.02 ppt (Figure 4b). Stations that are closer to the upstream shown a low
salinity reading for low water tide, since higher freshwater discharge from the upstream, thus showing a negative
relationship between salinity and freshwater discharge.
However, salinity readings at station 6 and station 7 at Paka River were similar for both water tides. This is because
the seawater flow along the bottom of the river with incoming tides due to the higher density of seawater as
compared to fresh water, thus a longer time required for the salinity of surface water to be affected during high tide.
Statistical analysis of one-way ANOVA revealed that there are no significant differences (P > 0.05) in salinity
between stations during the second sampling.
0
1
2
3
4
5
1 2 3 4 5 6 7Tota
l dis
sove
d
solid
s (m
g/L)
Station
Low tide
High tide
0
10
20
30
1 2 3 4 5 6 7
Tota
l dis
solv
ed
so
lids
(mg/
L)
Stations
Low tide
High tide
Malaysian Journal of Analytical Sciences, Vol 19 No 5 (2015): 979 - 990
985
Figure 4. Salinity values at seven sampling stations during first (a) and second (b) samplings
Conductivity
Conductivity in natural waters is a normalized measure of the ability of water to conduct an electric current, which
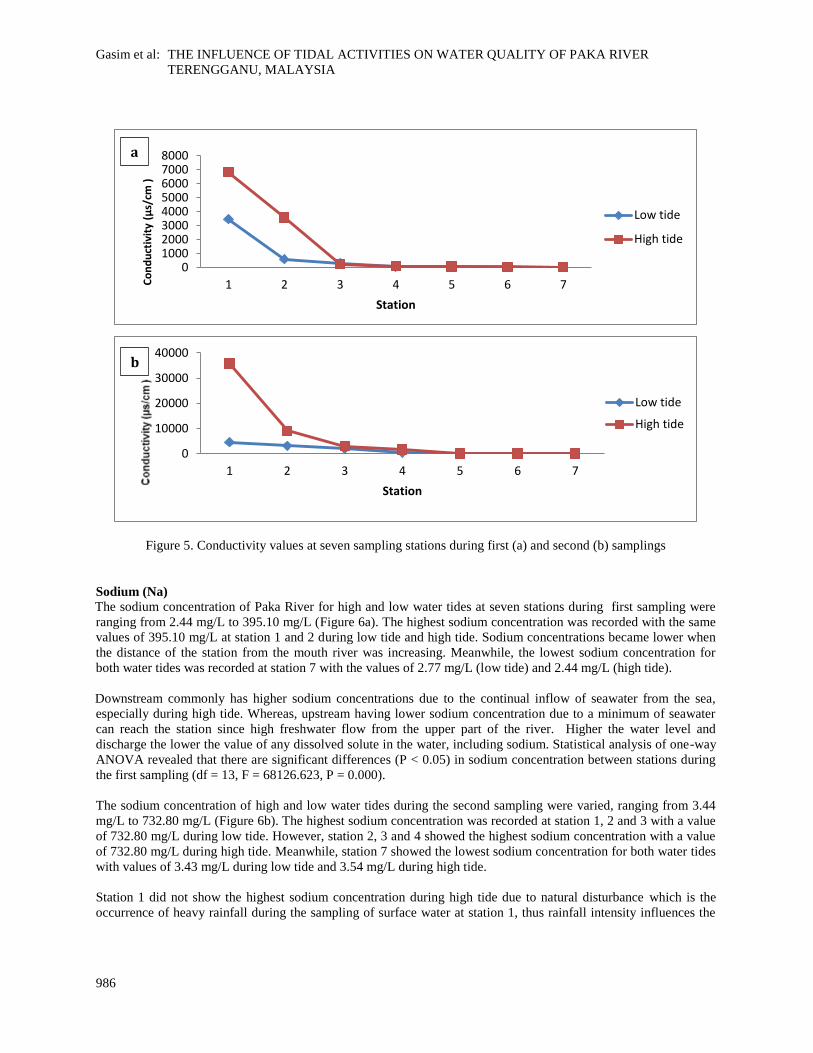
mostly influenced by dissolving salts such as sodium chloride and potassium chloride. The conductivity of Paka
River at seven stations during the first sampling for high and low tides were recorded and illustrated in Figure 5a.
The conductivity of stations was varied, ranging from 33.00 µs/cm to 6809.67 µs/cm. Station 1 showed the highest
reading of conductivity for both water tides, which are 3470.67 µs/cm during low tide and 6809.67 µs/cm during
high tide. Meanwhile, the lowest conductivity showed by station 7 with values of 33.00 µs/cm during low tide and
35.00 µs/cm during high tide (Figure 5a). Statistical analysis of one-way ANOVA revealed that there are
significant differences (P < 0.05) in conductivity between stations during the first sampling (df = 13, F = 5.184, P =
0.024).
The conductivity during the dry season for high and low water tides for the seven stations were ranging from 42.00
µs/cm to 35835.33 µs/cm (Figure 5b). The highest conductivity was recorded at station 1 for both water tides, which
are 4461.00 µs/cm during low tide and 35835.33 µs/cm during high tide. Whereas, station 7 showed the lowest
conductivity with a value of 42.00 µs/cm during low tide, and station 6 showed the lowest conductivity with a value
of 54.33 µs/cm during high tide. Higher conductivity can be found at station 1 especially during high tide since the
rising tide enhances the seawater intrusion towards the river mouth, which station 1 was located. Statistical analysis
of one-way ANOVA revealed that there are no significant differences (P > 0.05) in conductivity between stations
during the second sampling.
0
1
2
3
4
1 2 3 4 5 6 7
Salin
ity
(pp
t)
Station
Low tide
High tide
0
5
10
15
20
25
1 2 3 4 5 6 7Salin
ity
(pp
t)
Station
Low tide
High tide
a
a
b
a
Gasim et al: THE INFLUENCE OF TIDAL ACTIVITIES ON WATER QUALITY OF PAKA RIVER
TERENGGANU, MALAYSIA
986
Figure 5. Conductivity values at seven sampling stations during first (a) and second (b) samplings
Sodium (Na)
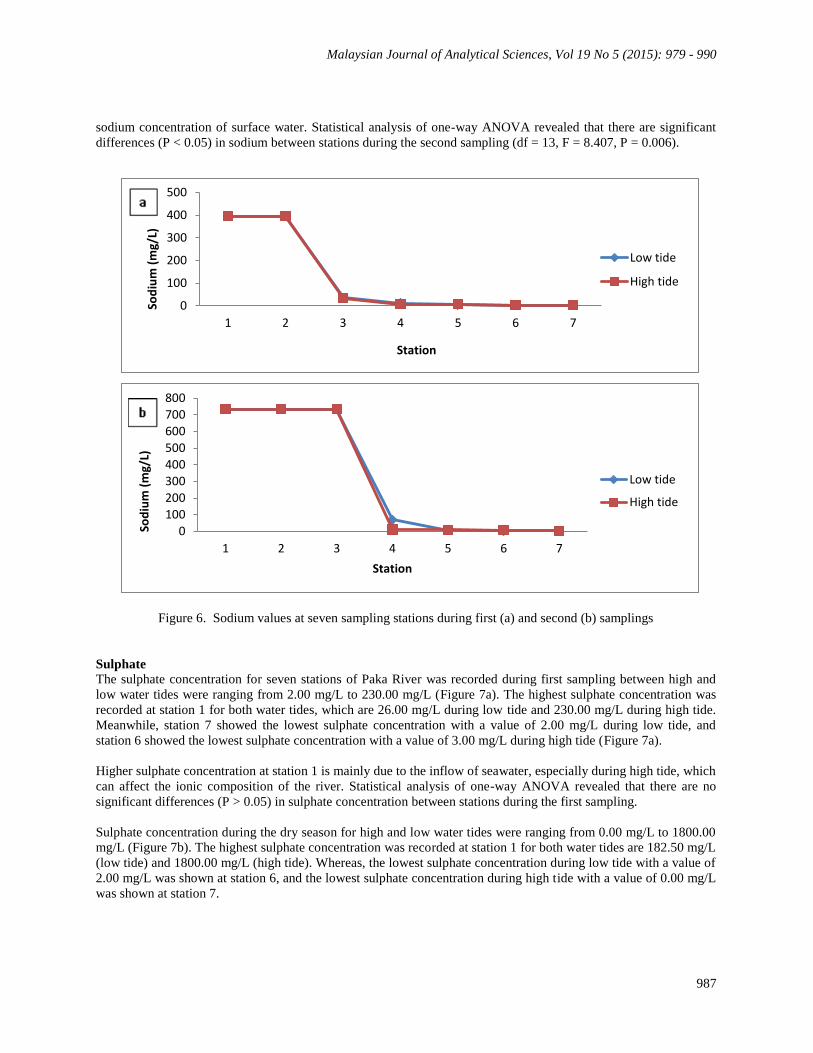
The sodium concentration of Paka River for high and low water tides at seven stations during first sampling were
ranging from 2.44 mg/L to 395.10 mg/L (Figure 6a). The highest sodium concentration was recorded with the same
values of 395.10 mg/L at station 1 and 2 during low tide and high tide. Sodium concentrations became lower when
the distance of the station from the mouth river was increasing. Meanwhile, the lowest sodium concentration for
both water tides was recorded at station 7 with the values of 2.77 mg/L (low tide) and 2.44 mg/L (high tide).
Downstream commonly has higher sodium concentrations due to the continual inflow of seawater from the sea,
especially during high tide. Whereas, upstream having lower sodium concentration due to a minimum of seawater
can reach the station since high freshwater flow from the upper part of the river. Higher the water level and
discharge the lower the value of any dissolved solute in the water, including sodium. Statistical analysis of one-way
ANOVA revealed that there are significant differences (P < 0.05) in sodium concentration between stations during
the first sampling (df = 13, F = 68126.623, P = 0.000).
The sodium concentration of high and low water tides during the second sampling were varied, ranging from 3.44
mg/L to 732.80 mg/L (Figure 6b). The highest sodium concentration was recorded at station 1, 2 and 3 with a value
of 732.80 mg/L during low tide. However, station 2, 3 and 4 showed the highest sodium concentration with a value
of 732.80 mg/L during high tide. Meanwhile, station 7 showed the lowest sodium concentration for both water tides
with values of 3.43 mg/L during low tide and 3.54 mg/L during high tide.
Station 1 did not show the highest sodium concentration during high tide due to natural disturbance which is the
occurrence of heavy rainfall during the sampling of surface water at station 1, thus rainfall intensity influences the
010002000300040005000600070008000
1 2 3 4 5 6 7Co
nd
uct
ivit
y (µ
s/cm
)
Station
Low tide
High tide
0
10000
20000
30000
40000
1 2 3 4 5 6 7
Station
Low tide
High tide
a
b
Malaysian Journal of Analytical Sciences, Vol 19 No 5 (2015): 979 - 990
987
sodium concentration of surface water. Statistical analysis of one-way ANOVA revealed that there are significant
differences (P < 0.05) in sodium between stations during the second sampling (df = 13, F = 8.407, P = 0.006).
Figure 6. Sodium values at seven sampling stations during first (a) and second (b) samplings
Sulphate
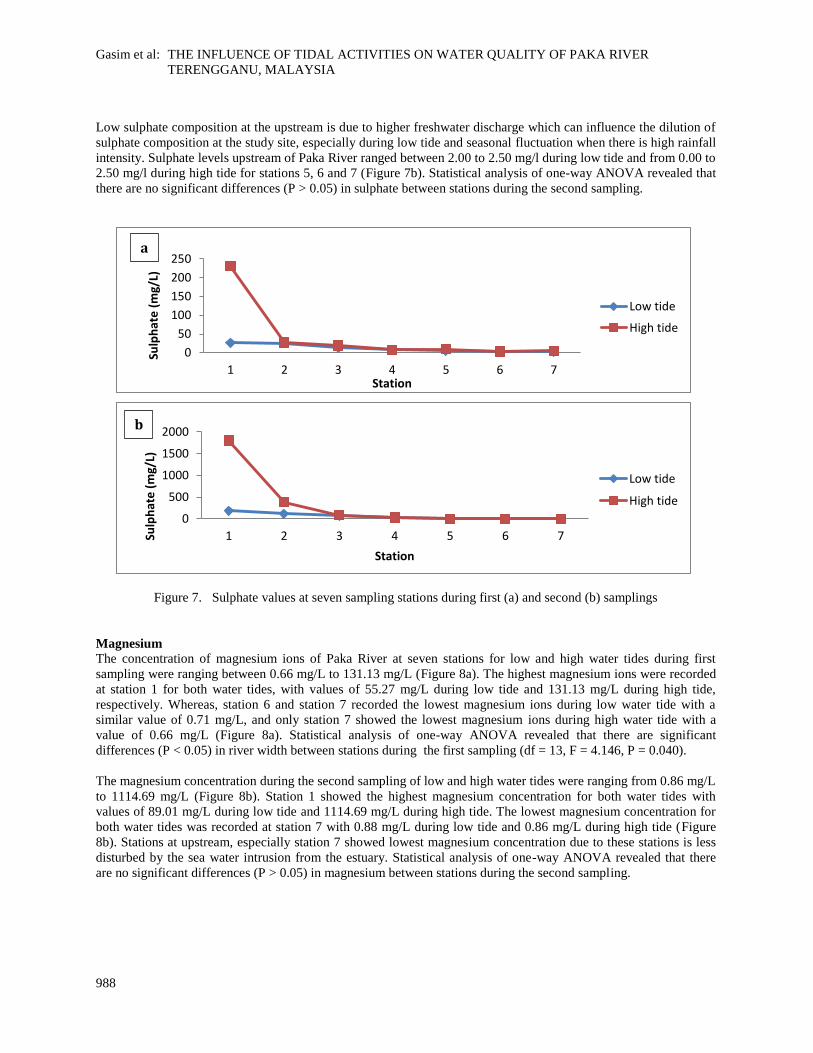
The sulphate concentration for seven stations of Paka River was recorded during first sampling between high and
low water tides were ranging from 2.00 mg/L to 230.00 mg/L (Figure 7a). The highest sulphate concentration was
recorded at station 1 for both water tides, which are 26.00 mg/L during low tide and 230.00 mg/L during high tide.
Meanwhile, station 7 showed the lowest sulphate concentration with a value of 2.00 mg/L during low tide, and
station 6 showed the lowest sulphate concentration with a value of 3.00 mg/L during high tide (Figure 7a).
Higher sulphate concentration at station 1 is mainly due to the inflow of seawater, especially during high tide, which
can affect the ionic composition of the river. Statistical analysis of one-way ANOVA revealed that there are no
significant differences (P > 0.05) in sulphate concentration between stations during the first sampling.
Sulphate concentration during the dry season for high and low water tides were ranging from 0.00 mg/L to 1800.00
mg/L (Figure 7b). The highest sulphate concentration was recorded at station 1 for both water tides are 182.50 mg/L
(low tide) and 1800.00 mg/L (high tide). Whereas, the lowest sulphate concentration during low tide with a value of
2.00 mg/L was shown at station 6, and the lowest sulphate concentration during high tide with a value of 0.00 mg/L
was shown at station 7.
0
100
200
300
400
500
1 2 3 4 5 6 7
Sod
ium
(m
g/L)
Station
Low tide
High tide
0
100
200
300
400
500
600
700
800
1 2 3 4 5 6 7
Sod
ium
(m
g/L)
Station
Low tide
High tide
Gasim et al: THE INFLUENCE OF TIDAL ACTIVITIES ON WATER QUALITY OF PAKA RIVER
TERENGGANU, MALAYSIA
988
Low sulphate composition at the upstream is due to higher freshwater discharge which can influence the dilution of
sulphate composition at the study site, especially during low tide and seasonal fluctuation when there is high rainfall
intensity. Sulphate levels upstream of Paka River ranged between 2.00 to 2.50 mg/l during low tide and from 0.00 to
2.50 mg/l during high tide for stations 5, 6 and 7 (Figure 7b). Statistical analysis of one-way ANOVA revealed that
there are no significant differences (P > 0.05) in sulphate between stations during the second sampling.
Figure 7. Sulphate values at seven sampling stations during first (a) and second (b) samplings
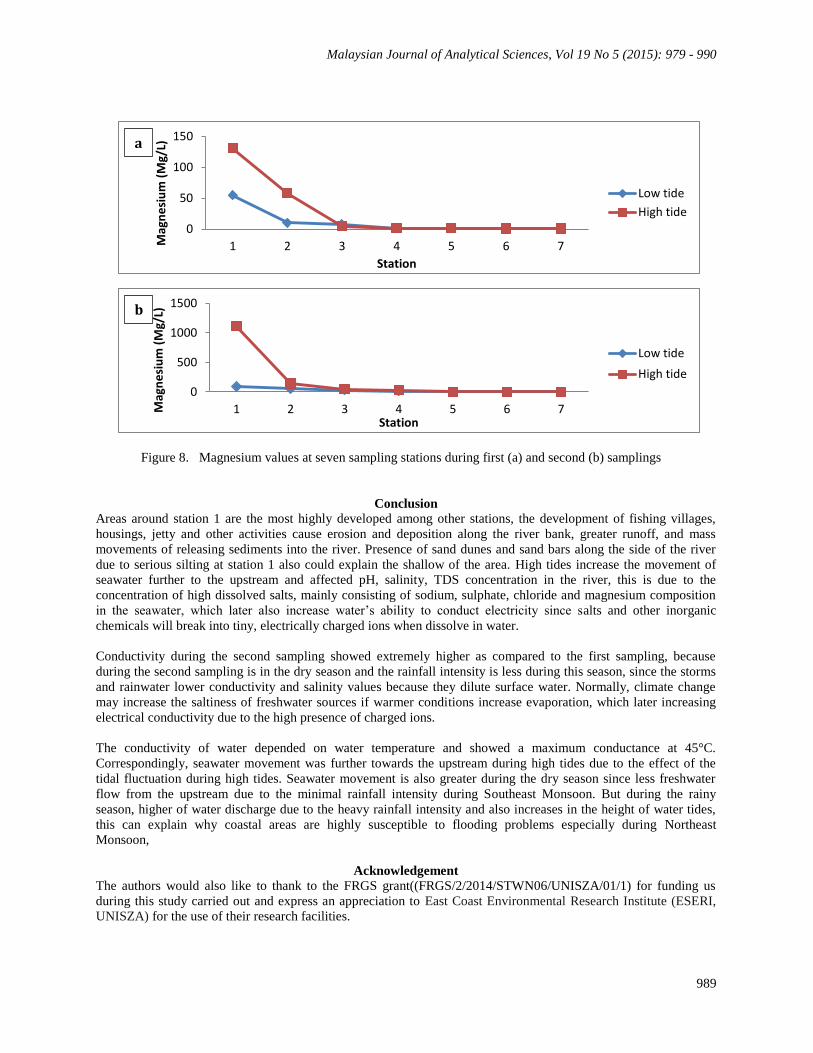
Magnesium
The concentration of magnesium ions of Paka River at seven stations for low and high water tides during first
sampling were ranging between 0.66 mg/L to 131.13 mg/L (Figure 8a). The highest magnesium ions were recorded
at station 1 for both water tides, with values of 55.27 mg/L during low tide and 131.13 mg/L during high tide,
respectively. Whereas, station 6 and station 7 recorded the lowest magnesium ions during low water tide with a
similar value of 0.71 mg/L, and only station 7 showed the lowest magnesium ions during high water tide with a
value of 0.66 mg/L (Figure 8a). Statistical analysis of one-way ANOVA revealed that there are significant
differences (P < 0.05) in river width between stations during the first sampling (df = 13, F = 4.146, P = 0.040).
The magnesium concentration during the second sampling of low and high water tides were ranging from 0.86 mg/L
to 1114.69 mg/L (Figure 8b). Station 1 showed the highest magnesium concentration for both water tides with
values of 89.01 mg/L during low tide and 1114.69 mg/L during high tide. The lowest magnesium concentration for
both water tides was recorded at station 7 with 0.88 mg/L during low tide and 0.86 mg/L during high tide (Figure
8b). Stations at upstream, especially station 7 showed lowest magnesium concentration due to these stations is less
disturbed by the sea water intrusion from the estuary. Statistical analysis of one-way ANOVA revealed that there
are no significant differences (P > 0.05) in magnesium between stations during the second sampling.
0
500
1000
1500
2000
1 2 3 4 5 6 7Sulp
hat
e (
mg/
L)
Station
Low tide
High tide
0
50
100
150
200
250
1 2 3 4 5 6 7
Sulp
hat
e (
mg/
L)
Station
Low tide
High tide
a
b
Malaysian Journal of Analytical Sciences, Vol 19 No 5 (2015): 979 - 990
989
Figure 8. Magnesium values at seven sampling stations during first (a) and second (b) samplings
Conclusion
Areas around station 1 are the most highly developed among other stations, the development of fishing villages,
housings, jetty and other activities cause erosion and deposition along the river bank, greater runoff, and mass
movements of releasing sediments into the river. Presence of sand dunes and sand bars along the side of the river
due to serious silting at station 1 also could explain the shallow of the area. High tides increase the movement of
seawater further to the upstream and affected pH, salinity, TDS concentration in the river, this is due to the
concentration of high dissolved salts, mainly consisting of sodium, sulphate, chloride and magnesium composition
in the seawater, which later also increase water’s ability to conduct electricity since salts and other inorganic
chemicals will break into tiny, electrically charged ions when dissolve in water.
Conductivity during the second sampling showed extremely higher as compared to the first sampling, because
during the second sampling is in the dry season and the rainfall intensity is less during this season, since the storms
and rainwater lower conductivity and salinity values because they dilute surface water. Normally, climate change
may increase the saltiness of freshwater sources if warmer conditions increase evaporation, which later increasing
electrical conductivity due to the high presence of charged ions.
The conductivity of water depended on water temperature and showed a maximum conductance at 45°C.
Correspondingly, seawater movement was further towards the upstream during high tides due to the effect of the
tidal fluctuation during high tides. Seawater movement is also greater during the dry season since less freshwater
flow from the upstream due to the minimal rainfall intensity during Southeast Monsoon. But during the rainy
season, higher of water discharge due to the heavy rainfall intensity and also increases in the height of water tides,
this can explain why coastal areas are highly susceptible to flooding problems especially during Northeast
Monsoon,
Acknowledgement
The authors would also like to thank to the FRGS grant((FRGS/2/2014/STWN06/UNISZA/01/1) for funding us
during this study carried out and express an appreciation to East Coast Environmental Research Institute (ESERI,
UNISZA) for the use of their research facilities.
0
500
1000
1500
1 2 3 4 5 6 7Mag
ne
siu
m (
Mg/
L)
Station
Low tide
High tide
0
50
100
150
1 2 3 4 5 6 7Mag
ne
siu
m (
Mg/
L)
Station
Low tide
High tide
a
b
Gasim et al: THE INFLUENCE OF TIDAL ACTIVITIES ON WATER QUALITY OF PAKA RIVER
TERENGGANU, MALAYSIA
990
References
1. Nasir, M. S. and Camerlengo, A. L. (1997). Response of the ocean mixed layer, off the east coast of Peninsular
Malaysia during the northeast and southwest monsoons. Geoacta 22: 134-143.
2. Camerlengo, A. and Ines Demmle, M. (1997). Wind driver circulation of Peninsular Malaysia’s eastern
Continetal Shelf. Scientia Marina 61(2): 2003-211.
3. Daryabor, F., Samah A. A. and S.H. Ooi. (2015). Dinamical structure of the sea off the east coast of
PeninsularMalaysia. Ocean Dinamic 65: 93-106.
4. O’Brien, T. (1995). Assessment of the impact of saline drainage on key fish species. Banens, R.J. & Lehane, R.
1995 Riverine Environment Research Forum. Eds. Canberra: Murray-Darling Basin Commission. 43-46.
5. Aberle, J. and Smart, G.M., (2003).The influence of roughness structure on flow resistance on steep slopes.
Journal of Hydraulic Research 41(3): 259-269.
6. Urish, D. W. and Qanbar, E. K. (1997). Hydraulic evaluation ofground water discharge, Nauset Marsh, Cape
Cod National Seashore, Massachusetts. Technical Report NPS/NESO-RNR/NRT 97–07
7. McLean, R. F., Tsyban, A., Burkett, V., Codignott, J. O., Forbes, D. L., Mimura, N., Beamish, R. J., and
Ittekkot. V. (2001). Coastal Zones and Marine Ecosystems. In Climate Change 2001: Impacts, Adaptation, and
Vulnerability. Contribution of Working Group II to the Third Assessment Report of the Intergovernmental
Panel on Climate Change. Edited by James J. McCarthy Osvaldo F. Canziani, Neil A. Leary, David J. Dokken,
and Kasey S. White, Cambridge University Press, Cambridge, UK, 343-379.
8. Hull, C. H. J., Thatcher, M. L. And Tortoriello, R.C. (1986). Salinity in the Delaware Estuary. Hull, C.H.J.
& Titus,J.G. Greenhouse Effect, Sea Level Rise, and Salinity in the Delaware Estuary. Eds.
Washington: Delaware River Basin Commission and US Environmental Protection Agency. p8–18.
9. Li, L., Barry, D. A., Stagnitti, F., Parlange, J. Y. and Jeng, D.S., (2000). Beach water table fluctuations due to
spring– neap tides: moving boundary effects. Advances in Water Resources 23(8): 817-824.
10. Hanson, C. (2005). Review of Environment Canterbury’s groundwater quality monitoring programme.
Environment Canterbury Report, U05/70.
11. Giménez, E. and Morell, I. (1997). Hydrogeochemical analysis of salinization processes in the coastal aquifer
of Oropesa (Castellón, Spain). Environmental Geology 29: 118-131.
12. BERNAMA, (2012). Consultant to Study Erosion Of Sungai Paka Estuary. Bernama Media. 26 February.
http://my.news.yahoo.com/consultant-study-erosion-sungai-paka-estuary-115605004.html [5 April 2013]
13. Siti Airunnisa,A. (2010). Consultant To Study Erosion Of Sungai Paka Estuary. Utusan Online. 5
May.http://www.utusan.com.my/utusan/info.asp?y=2010&dt=0505&pub=Utusan_Malaysia&sec=Timur&pg=
wt_01.htm [5 April 2013]
14. APHA, (1998). Standard Methods for the Examination of Water and Wastewater. 20th edition. American.
Public Health Association, Washington, DC.
15. APHA, (2005). American Public Health Association, American Water Works Association and World
Environment Federation. Standard Methods for Examination of Water and Wastewater. 21st Edition. American
Public Health Association, Washington DC, USA.
16. HACH, (1997). Hach Portable Turbidimeter Model 2100P Instrument and Procedure Manual, 8-25-94-
6ED,Rev. 5, Hach Company, Loveland, Colorado.
17. Mukhopadhyay, S. K., Biswas, H., De, T. K. and Jana, T. K. (2006). Fluxes of nutrients from the tropical
river Hooghly at the land-ocean boundary of Sundarbans, North-east coast of Bay of Bengal, India. Journal
of Marine Systems 62: 9-21.