the influence of tidal activities on water quality of marang river
TRANSCRIPT
Malaysian Journal of Analytical Sciences, Vol 19 No 6 (2015): 1431 - 1447
1431
MALAYSIAN JOURNAL OF ANALYTICAL SCIENCES
Published by The Malaysian Analytical Sciences Society
THE INFLUENCE OF TIDAL ACTIVITIES ON WATER QUALITY OF
MARANG RIVER, TERENGGANU, MALAYSIA
(Pengaruh Aktiviti Pasang Surut Terhadap Kualiti Air Sungai Marang, Terengganu, Malaysia)
Muhammad Barzani Gasim*, Nur Hidayah Ariffin, Haniff Muhamad,
Norsyuhada Hairoma
East Coast Environmental Research Institute (ESERI),
Universiti Sultan Zainal Abidin,
Gong Badak Campus, 21300 Kuala Terengganu, Terengganu, Malaysia
*Corresponding author: [email protected]
Received: 14 April 2015; Accepted: 9 July 2015
Abstract
A study was conducted at seven sampling stations to determine water quality condition of Marang River, Terengganu. Each
station was 2 km apart from each other, the first sampling was in 13 November 2012 and was repeated in 24 November 2013.
The aim of the study is to determine water quality in spatial and temporal variation on different tides based on selected fourteen
physicochemical parameters with regard to National Water Quality Standard. Six in-situ parameters such as pH, temperature,
salinity, conductivity, DO and TDS were measured by using YSI 556 Multiparameters. Six ex-situ parameters such as sulphate,
sodium, nitrate, phosphate, magnesium and turbidity also were measured. Sulphate, nitrate, phosphate and turbidity were
analysed according to the standard method of analysis by Portable Datalogging Spectrophotometer HACH DR/2010. Sodium and
magnesium were analysed using Atomic Absorption Spectrophotometer. One way ANOVA shows that there are no significant
changes between first sampling and second sampling, the data were average to give impression of water quality of Marang River
in spatial and temporal perspective. Overall, water quality of Marang River was classified as class I to III according to NWQS
classification, therefore Marang River needs proper water treatment for tolerant fish species and other aquatic water continuance.
Keywords: Marang River, rainy season, dry season,water quality parameter
Abstrak
Satu kajian telah dijalankan di tujuh stesen persampelan untuk menentukan keadaan kualiti air Sungai Marang, Terengganu.
Setiap stesen berjarak 2 km diantara satu sama lain, pensampelan pertama pada 13 November 2012 dan diulang pada 24
November 2013. Tujuan kajian ini adalah untuk menentukan kualiti air di dalam variasi ruang dan masa diantara laut pasang dan
surut berdasarkan empatbelas parameter fizikokimia terpilih dengan mengambil kira Piawaian Kualiti Air Kebangsaan. Enam in-
situ parameter seperti pH, suhu, kemasinan, kekonduksian, DO dan TDS diukur dengan menggunakan Multiparameter YSI 556.
Enam parameter ex-situ seperti sulfat, sodium, nitrat, fosfat, magnesium dan kekeruhan juga diukur. Sulfat, nitrat, fosfat dan
kekeruhan dianalisis mengikut kaedah standard analisis oleh Portable Datalogging Spectrophotometer Hach DR / 2010. Natrium
dan magnesium dianalisis menggunakan Spektrofotometer Penyerapan Atom. ANOVA satu hala menunjukkan bahawa tiada
perubahan yang signifikan di antara persampelan pertama dan persampelan kedua, data yang rata-rata untuk memberi gambaran
kualiti air Sungai Marang dalam perspektif ruang dan masa. Secara keseluruhan, kualiti air Sungai Marang diklasifikasikan
sebagai kelas I hingga III mengikut pengkelasan NWQS, oleh itu air Sungai Marang perlu melalui rawatan yang sesuai bagi
memastikan air yang toleran bagi kelangsungan spesies ikan dan hidupan air yang lain.
Kata kunci: Sungai Marang, musim hujan, musim kering, parameter kualiti air
ISSN
1394 - 2506
Gasim et al: THE INFLUENCE OF TIDAL ACTIVITIES ON WATER QUALITY OF MARANG RIVER,
TERENGGANU, MALAYSIA
1432
Introduction
Water is one of nature’s most important gifts to mankind. Uses of water include agricultural, industrial, household,
recreation and environmental activities. As the world population continues to rise, the needs for water demand
increase. Thus, more supply is needed to supply the demand. However, not all water is suitable for domestic uses
because some water were polluted. Thus, water resources quality need to be examined to identify the suitable
usage.The increasing demand for water in terms of both sufficient quantity and satisfied quality has forced to be
thought carefully about the comprehensive, complex and ambitious plans for good water resource management
systems. Consequently, effective planning of water resources management is important for human life and socio-
economic sustainability [1]. However, interactions between physical, biology and biochemical processes and human
mediated processes are keys in determining changes in the global water system [2]. Effective planning of water
resources management is important to facilitating sustainable socio-economic development in watershed systems.
However a planning effort is often complicated with a number of social, economic, environmental, technical and
political factors [3].
In addition, river is important for irrigation, recreation and fisheries development [4]. Estuaries are highly protected
environments and their importance is recognized by various pieces of international legislation such as Habitats
Directives. However, there is still conflict between the economic value of estuaries and their hinterlands for
development and agriculture and the enforcement of protection for their internationally important species and
habitats [5]. The success in the economic growth and industrialization in Malaysia has led to environmental
problems with increasing of land, air and water pollution [6]. In recent decades, various tools have been developed
to assist water quality management including mathematical models, optimization approaches and integrated
decision support systems. Along with the increasing use of the sophisticated tools, water quality indices are also
being developed and used worldwide due to their simplicity, adaptability and easy to use in nature [7]. However,
particularly for small rivers, some problems hinder a straight forward model application such as specifically
calibration data scarcity, lack of major investments in small systems deemed to be of minor importance and the
large number of diverse inputs, especially for rivers that flow through densely populated areas [8].
Long term observation shows that freshwater ecosystems are highly in danger which affected by climate change.
Society and natural systems will have to face the increasingly harmful climate change such as impacts on freshwater
by other human pressures including habitat loss and pollution. This has lead to introduce policies which included
adaptation and recovery to resolve this problem. However, the science community still has relatively little to say
about how to adapt freshwater ecosystems to climate change [9]. The phenomenon of global warming not only
affects the people, but also our sea. There are a lot of factors that contributed to global warming on the sea such as
rise of sea level, changes in wave’s action, water current and wind velocity [10]. In addition, the aquatic ecosystem
also affected in great pressure and undergoes change. Warming environment cause rapid increase in the
concentration of atmospheric carbon dioxide and ocean acidification may lead to coral bleaching [11]. Long term
sea level rise is a critical issue of the global climate change because of its possible huge impacts. Since 1993, sea
level is accurately monitored by satellite and these observations have shown that sea level does not rise uniformly.
In some regions it rises faster than the global average while in others, the rise is slower [12]. Seawater intrusion is
caused by prolonged changes (or in some cases severe episodic changes) in coastal groundwater levels due to
pumping, land-use change, climate variations or sea-level fluctuations. The primary damaging effects of seawater
intrusion are reduction in the available freshwater storage volume and contamination of production wells [13]. In
this study, Marang River was examined to study the water quality. The two main objectives in this study are to
determine water quality in spatial and temporal variation on different tides based on selected physicochemical
parameters and to access water quality as regard to National Water Quality Standard (NWQS).
Materials and Methods
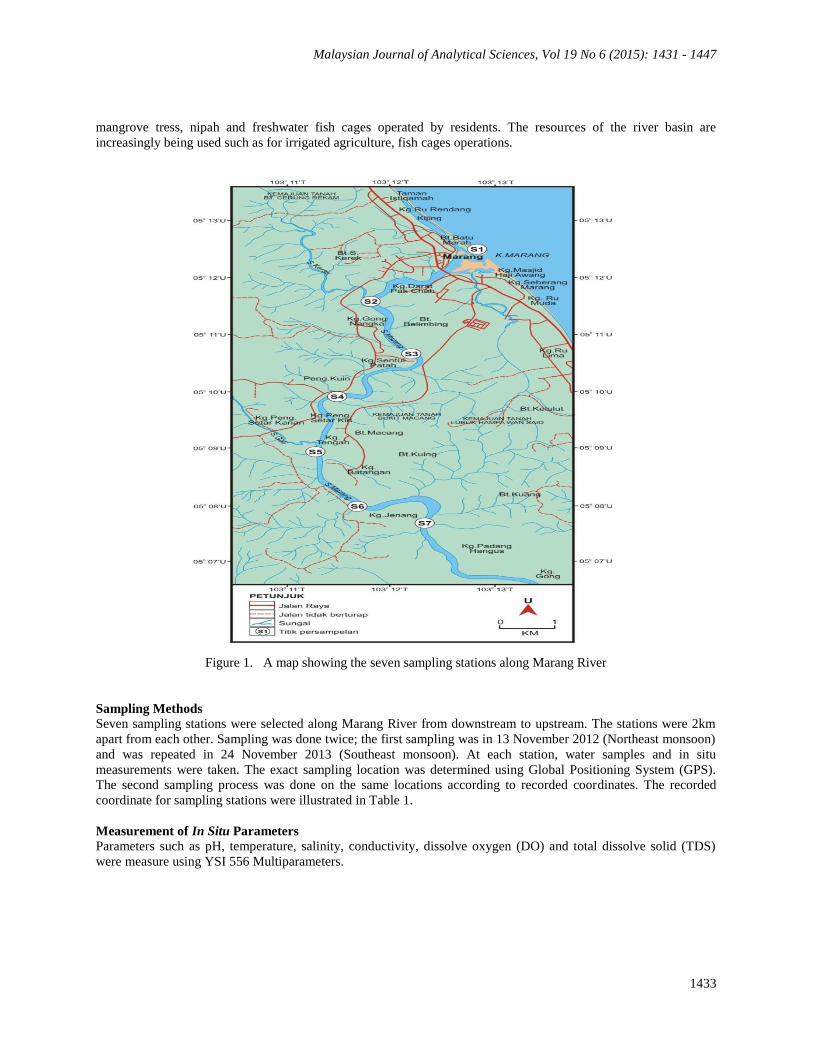
Study Area The study area (Figure 1) is located along Marang River (5°14’ N, 103°8’ E) that situated in Marang, Terengganu,
Malaysia [14]. Marang district is an area of 66,654.3 hectares and 20 km from Kuala Terengganu. This area is
always flooded in November and December every year. The occurrence is due to heavy rain was brought by
Northeast Monsoon winds coming from South China Sea. Views that can be seen along the Marang River are
Malaysian Journal of Analytical Sciences, Vol 19 No 6 (2015): 1431 - 1447
1433
mangrove tress, nipah and freshwater fish cages operated by residents. The resources of the river basin are
increasingly being used such as for irrigated agriculture, fish cages operations.
Figure 1. A map showing the seven sampling stations along Marang River
Sampling Methods
Seven sampling stations were selected along Marang River from downstream to upstream. The stations were 2km
apart from each other. Sampling was done twice; the first sampling was in 13 November 2012 (Northeast monsoon)
and was repeated in 24 November 2013 (Southeast monsoon). At each station, water samples and in situ
measurements were taken. The exact sampling location was determined using Global Positioning System (GPS).
The second sampling process was done on the same locations according to recorded coordinates. The recorded
coordinate for sampling stations were illustrated in Table 1.
Measurement of In Situ Parameters
Parameters such as pH, temperature, salinity, conductivity, dissolve oxygen (DO) and total dissolve solid (TDS)
were measure using YSI 556 Multiparameters.
Gasim et al: THE INFLUENCE OF TIDAL ACTIVITIES ON WATER QUALITY OF MARANG RIVER,
TERENGGANU, MALAYSIA
1434
Laboratory Analysis
Sulphate, nitrate and phosphate concentrations as well as turbidity in water sample were analysed by using Portable
Datalogging Spectrophotometer HACH DR/2010. Sodium and magnesium conconcentrations in water sample had
been analysed by using Atomic Absorption Spectrophotometer (AAS).
Data Analysis
One way ANOVA (Analysis of Variance) and SPSS (Statistical Package for the Social Sciences) software were
used to analyze the collected data.
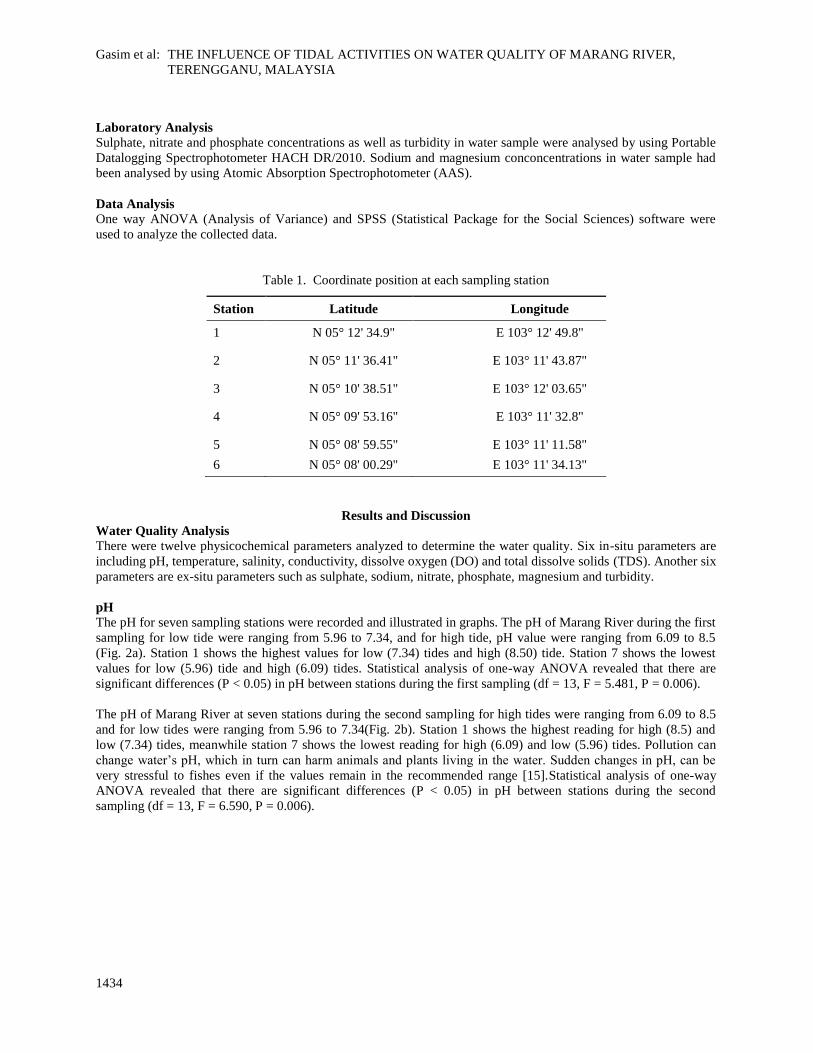
Table 1. Coordinate position at each sampling station
Station Latitude Longitude
1 N 05° 12' 34.9" E 103° 12' 49.8"
2 N 05° 11' 36.41" E 103° 11' 43.87"
3 N 05° 10' 38.51" E 103° 12' 03.65"
4 N 05° 09' 53.16" E 103° 11' 32.8"
5 N 05° 08' 59.55" E 103° 11' 11.58"
6 N 05° 08' 00.29" E 103° 11' 34.13"
Results and Discussion
Water Quality Analysis
There were twelve physicochemical parameters analyzed to determine the water quality. Six in-situ parameters are
including pH, temperature, salinity, conductivity, dissolve oxygen (DO) and total dissolve solids (TDS). Another six
parameters are ex-situ parameters such as sulphate, sodium, nitrate, phosphate, magnesium and turbidity.
pH
The pH for seven sampling stations were recorded and illustrated in graphs. The pH of Marang River during the first
sampling for low tide were ranging from 5.96 to 7.34, and for high tide, pH value were ranging from 6.09 to 8.5
(Fig. 2a). Station 1 shows the highest values for low (7.34) tides and high (8.50) tide. Station 7 shows the lowest
values for low (5.96) tide and high (6.09) tides. Statistical analysis of one-way ANOVA revealed that there are
significant differences (P < 0.05) in pH between stations during the first sampling (df = 13, F = 5.481, P = 0.006).
The pH of Marang River at seven stations during the second sampling for high tides were ranging from 6.09 to 8.5
and for low tides were ranging from 5.96 to 7.34(Fig. 2b). Station 1 shows the highest reading for high (8.5) and
low (7.34) tides, meanwhile station 7 shows the lowest reading for high (6.09) and low (5.96) tides. Pollution can
change water’s pH, which in turn can harm animals and plants living in the water. Sudden changes in pH, can be
very stressful to fishes even if the values remain in the recommended range [15].Statistical analysis of one-way
ANOVA revealed that there are significant differences (P < 0.05) in pH between stations during the second
sampling (df = 13, F = 6.590, P = 0.006).
Malaysian Journal of Analytical Sciences, Vol 19 No 6 (2015): 1431 - 1447
1435
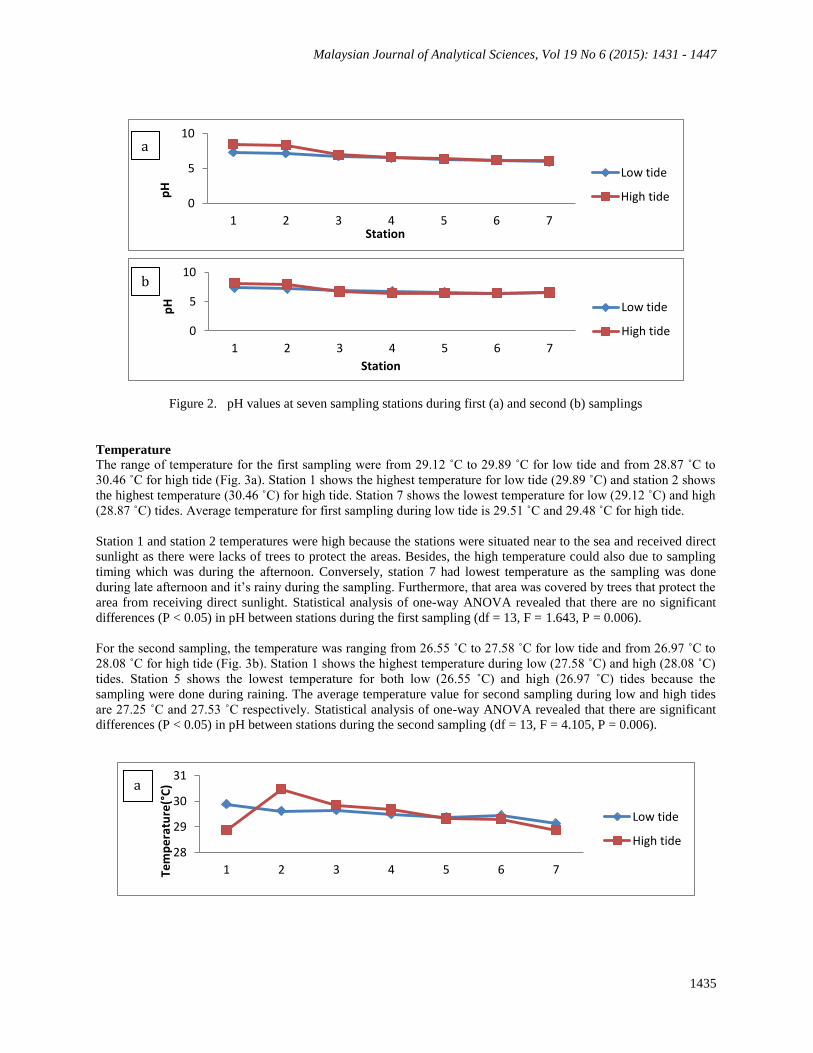
Figure 2. pH values at seven sampling stations during first (a) and second (b) samplings
Temperature
The range of temperature for the first sampling were from 29.12 ˚C to 29.89 ˚C for low tide and from 28.87 ˚C to
30.46 ˚C for high tide (Fig. 3a). Station 1 shows the highest temperature for low tide (29.89 ˚C) and station 2 shows
the highest temperature (30.46 ˚C) for high tide. Station 7 shows the lowest temperature for low (29.12 ˚C) and high
(28.87 ˚C) tides. Average temperature for first sampling during low tide is 29.51 ˚C and 29.48 ˚C for high tide.
Station 1 and station 2 temperatures were high because the stations were situated near to the sea and received direct
sunlight as there were lacks of trees to protect the areas. Besides, the high temperature could also due to sampling
timing which was during the afternoon. Conversely, station 7 had lowest temperature as the sampling was done
during late afternoon and it’s rainy during the sampling. Furthermore, that area was covered by trees that protect the
area from receiving direct sunlight. Statistical analysis of one-way ANOVA revealed that there are no significant
differences (P < 0.05) in pH between stations during the first sampling (df = 13, F = 1.643, P = 0.006).
For the second sampling, the temperature was ranging from 26.55 ˚C to 27.58 ˚C for low tide and from 26.97 ˚C to
28.08 ˚C for high tide (Fig. 3b). Station 1 shows the highest temperature during low (27.58 ˚C) and high (28.08 ˚C)
tides. Station 5 shows the lowest temperature for both low (26.55 ˚C) and high (26.97 ˚C) tides because the
sampling were done during raining. The average temperature value for second sampling during low and high tides
are 27.25 ˚C and 27.53 ˚C respectively. Statistical analysis of one-way ANOVA revealed that there are significant
differences (P < 0.05) in pH between stations during the second sampling (df = 13, F = 4.105, P = 0.006).
0
5
10
1 2 3 4 5 6 7
Low tide
High tide
Station
pH
0
5
10
1 2 3 4 5 6 7
Low tide
High tide
Station
pH
28
29
30
31
1 2 3 4 5 6 7
Low tide
High tide
Tem
pe
ratu
re(°
C)
a
b
a
Gasim et al: THE INFLUENCE OF TIDAL ACTIVITIES ON WATER QUALITY OF MARANG RIVER,
TERENGGANU, MALAYSIA
1436
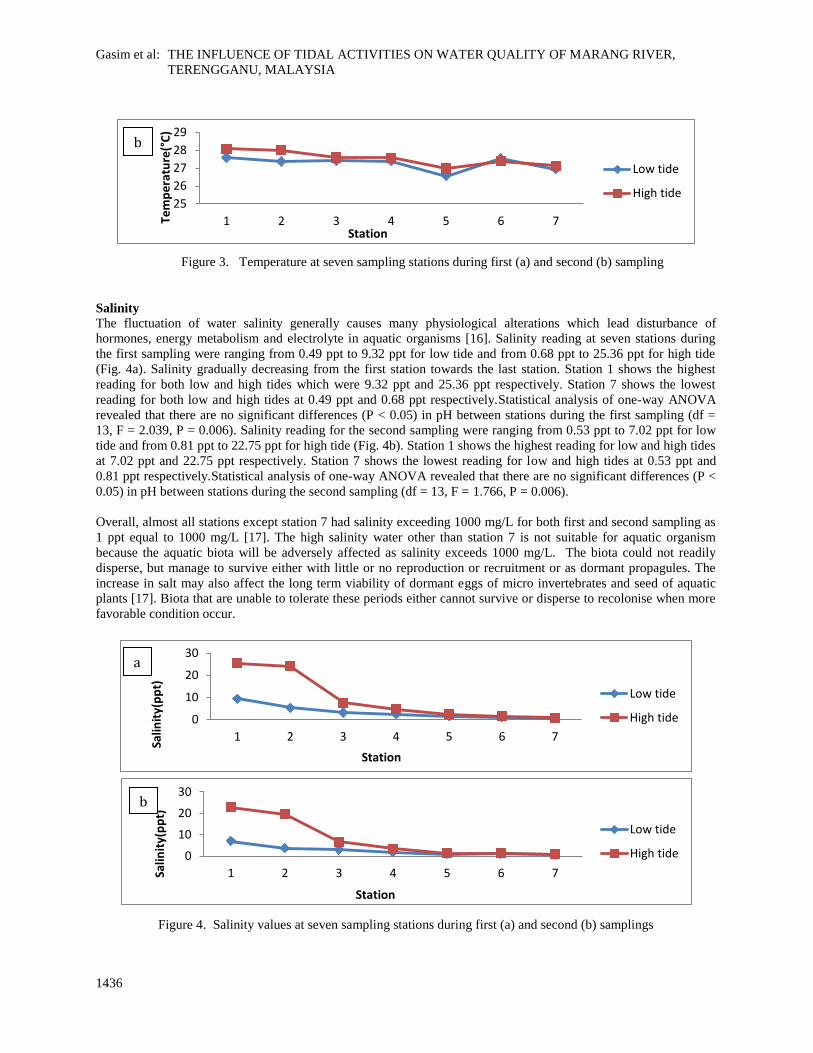
Figure 3. Temperature at seven sampling stations during first (a) and second (b) sampling
Salinity
The fluctuation of water salinity generally causes many physiological alterations which lead disturbance of
hormones, energy metabolism and electrolyte in aquatic organisms [16]. Salinity reading at seven stations during
the first sampling were ranging from 0.49 ppt to 9.32 ppt for low tide and from 0.68 ppt to 25.36 ppt for high tide
(Fig. 4a). Salinity gradually decreasing from the first station towards the last station. Station 1 shows the highest
reading for both low and high tides which were 9.32 ppt and 25.36 ppt respectively. Station 7 shows the lowest
reading for both low and high tides at 0.49 ppt and 0.68 ppt respectively.Statistical analysis of one-way ANOVA
revealed that there are no significant differences (P < 0.05) in pH between stations during the first sampling (df =
13, F = 2.039, P = 0.006). Salinity reading for the second sampling were ranging from 0.53 ppt to 7.02 ppt for low
tide and from 0.81 ppt to 22.75 ppt for high tide (Fig. 4b). Station 1 shows the highest reading for low and high tides
at 7.02 ppt and 22.75 ppt respectively. Station 7 shows the lowest reading for low and high tides at 0.53 ppt and
0.81 ppt respectively.Statistical analysis of one-way ANOVA revealed that there are no significant differences (P <
0.05) in pH between stations during the second sampling (df = 13, F = 1.766, P = 0.006).
Overall, almost all stations except station 7 had salinity exceeding 1000 mg/L for both first and second sampling as
1 ppt equal to 1000 mg/L [17]. The high salinity water other than station 7 is not suitable for aquatic organism
because the aquatic biota will be adversely affected as salinity exceeds 1000 mg/L. The biota could not readily
disperse, but manage to survive either with little or no reproduction or recruitment or as dormant propagules. The
increase in salt may also affect the long term viability of dormant eggs of micro invertebrates and seed of aquatic
plants [17]. Biota that are unable to tolerate these periods either cannot survive or disperse to recolonise when more
favorable condition occur.
Figure 4. Salinity values at seven sampling stations during first (a) and second (b) samplings
25
26
27
28
29
1 2 3 4 5 6 7
Low tide
High tide
Station
Tem
pe
ratu
re(°
C)
0
10
20
30
1 2 3 4 5 6 7
Low tide
High tide
Station
Salin
ity(
pp
t)
0
10
20
30
1 2 3 4 5 6 7
Low tide
High tide
Station
Salin
ity(
pp
t)
b
a
b
Malaysian Journal of Analytical Sciences, Vol 19 No 6 (2015): 1431 - 1447
1437
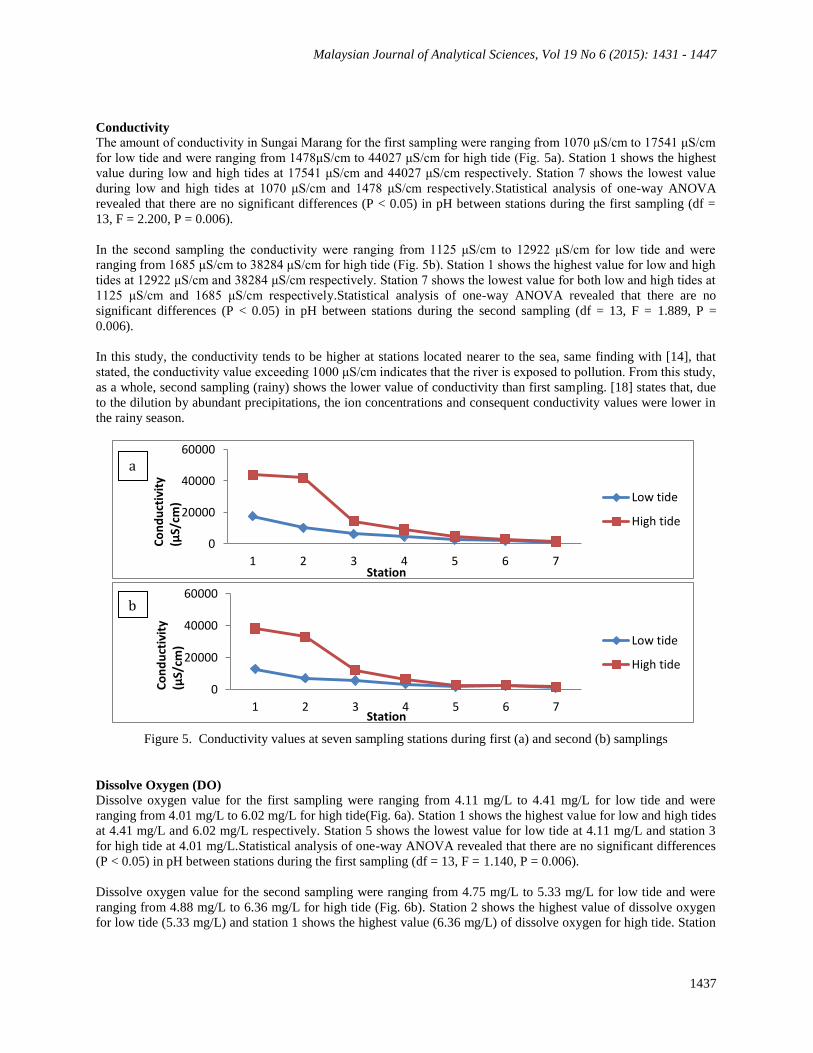
Conductivity
The amount of conductivity in Sungai Marang for the first sampling were ranging from 1070 μS/cm to 17541 μS/cm
for low tide and were ranging from 1478μS/cm to 44027 μS/cm for high tide (Fig. 5a). Station 1 shows the highest
value during low and high tides at 17541 μS/cm and 44027 μS/cm respectively. Station 7 shows the lowest value
during low and high tides at 1070 μS/cm and 1478 μS/cm respectively.Statistical analysis of one-way ANOVA
revealed that there are no significant differences (P < 0.05) in pH between stations during the first sampling (df =
13, F = 2.200, P = 0.006).
In the second sampling the conductivity were ranging from 1125 μS/cm to 12922 μS/cm for low tide and were
ranging from 1685 μS/cm to 38284 μS/cm for high tide (Fig. 5b). Station 1 shows the highest value for low and high
tides at 12922 μS/cm and 38284 μS/cm respectively. Station 7 shows the lowest value for both low and high tides at
1125 μS/cm and 1685 μS/cm respectively.Statistical analysis of one-way ANOVA revealed that there are no
significant differences (P < 0.05) in pH between stations during the second sampling (df = 13, F = 1.889, P =
0.006).
In this study, the conductivity tends to be higher at stations located nearer to the sea, same finding with [14], that
stated, the conductivity value exceeding 1000 μS/cm indicates that the river is exposed to pollution. From this study,
as a whole, second sampling (rainy) shows the lower value of conductivity than first sampling. [18] states that, due
to the dilution by abundant precipitations, the ion concentrations and consequent conductivity values were lower in
the rainy season.
Figure 5. Conductivity values at seven sampling stations during first (a) and second (b) samplings
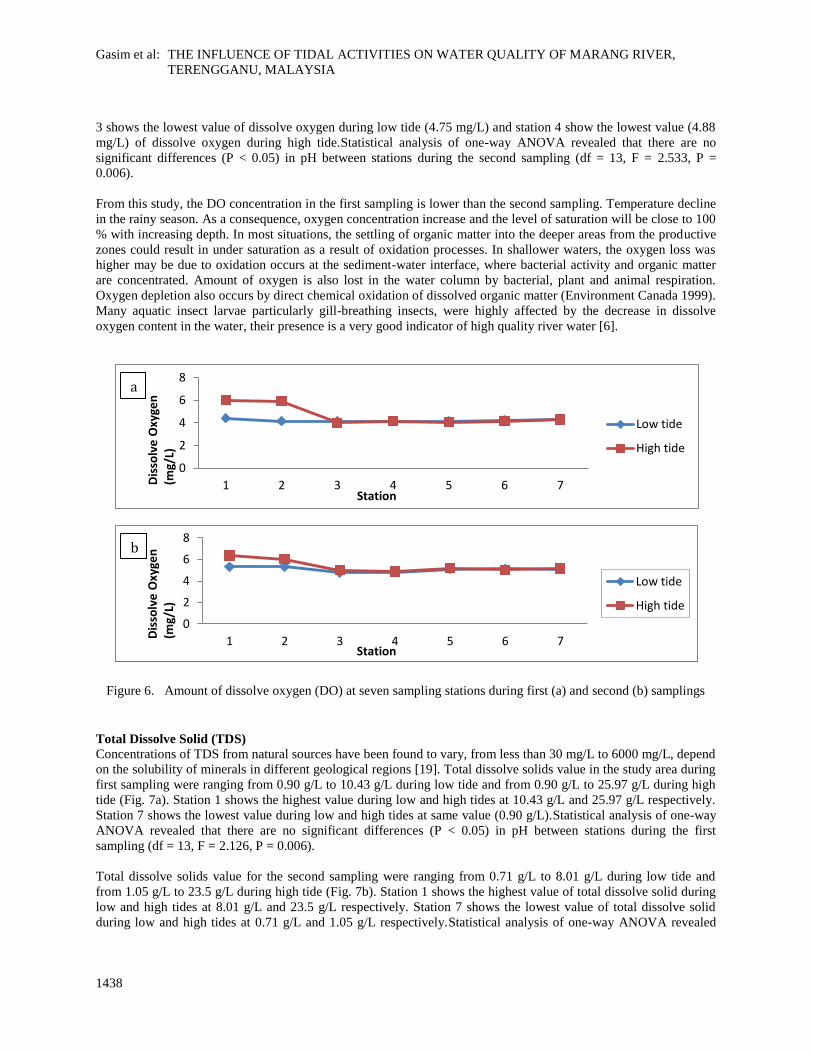
Dissolve Oxygen (DO)
Dissolve oxygen value for the first sampling were ranging from 4.11 mg/L to 4.41 mg/L for low tide and were
ranging from 4.01 mg/L to 6.02 mg/L for high tide(Fig. 6a). Station 1 shows the highest value for low and high tides
at 4.41 mg/L and 6.02 mg/L respectively. Station 5 shows the lowest value for low tide at 4.11 mg/L and station 3
for high tide at 4.01 mg/L.Statistical analysis of one-way ANOVA revealed that there are no significant differences
(P < 0.05) in pH between stations during the first sampling (df = 13, F = 1.140, P = 0.006).
Dissolve oxygen value for the second sampling were ranging from 4.75 mg/L to 5.33 mg/L for low tide and were
ranging from 4.88 mg/L to 6.36 mg/L for high tide (Fig. 6b). Station 2 shows the highest value of dissolve oxygen
for low tide (5.33 mg/L) and station 1 shows the highest value (6.36 mg/L) of dissolve oxygen for high tide. Station
0
20000
40000
60000
1 2 3 4 5 6 7
Low tide
High tide
Station
Co
nd
uct
ivit
y (μS/cm
)
0
20000
40000
60000
1 2 3 4 5 6 7
Low tide
High tide
Station
Co
nd
uct
ivit
y (μS/cm
)
a
b
Gasim et al: THE INFLUENCE OF TIDAL ACTIVITIES ON WATER QUALITY OF MARANG RIVER,
TERENGGANU, MALAYSIA
1438
3 shows the lowest value of dissolve oxygen during low tide (4.75 mg/L) and station 4 show the lowest value (4.88
mg/L) of dissolve oxygen during high tide.Statistical analysis of one-way ANOVA revealed that there are no
significant differences (P < 0.05) in pH between stations during the second sampling (df = 13, F = 2.533, P =
0.006).
From this study, the DO concentration in the first sampling is lower than the second sampling. Temperature decline
in the rainy season. As a consequence, oxygen concentration increase and the level of saturation will be close to 100
% with increasing depth. In most situations, the settling of organic matter into the deeper areas from the productive
zones could result in under saturation as a result of oxidation processes. In shallower waters, the oxygen loss was
higher may be due to oxidation occurs at the sediment-water interface, where bacterial activity and organic matter
are concentrated. Amount of oxygen is also lost in the water column by bacterial, plant and animal respiration.
Oxygen depletion also occurs by direct chemical oxidation of dissolved organic matter (Environment Canada 1999).
Many aquatic insect larvae particularly gill-breathing insects, were highly affected by the decrease in dissolve
oxygen content in the water, their presence is a very good indicator of high quality river water [6].
Figure 6. Amount of dissolve oxygen (DO) at seven sampling stations during first (a) and second (b) samplings
Total Dissolve Solid (TDS)
Concentrations of TDS from natural sources have been found to vary, from less than 30 mg/L to 6000 mg/L, depend
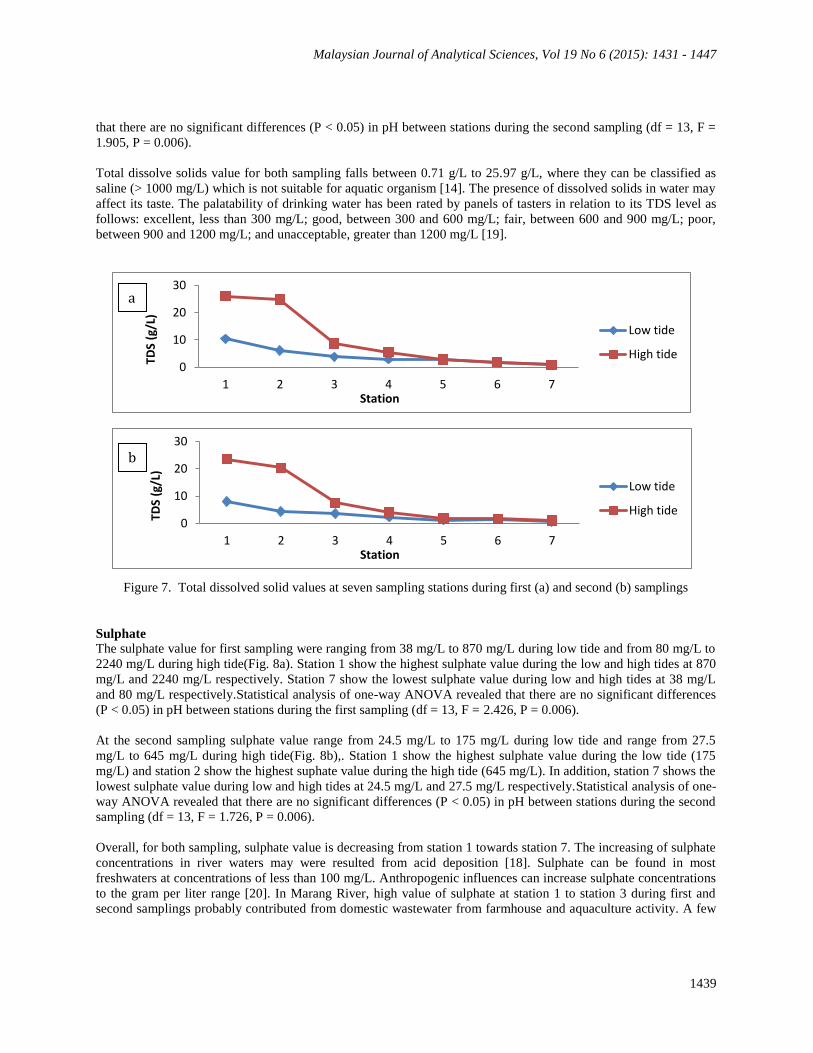
on the solubility of minerals in different geological regions [19]. Total dissolve solids value in the study area during
first sampling were ranging from 0.90 g/L to 10.43 g/L during low tide and from 0.90 g/L to 25.97 g/L during high
tide (Fig. 7a). Station 1 shows the highest value during low and high tides at 10.43 g/L and 25.97 g/L respectively.
Station 7 shows the lowest value during low and high tides at same value (0.90 g/L).Statistical analysis of one-way
ANOVA revealed that there are no significant differences (P < 0.05) in pH between stations during the first
sampling (df = 13, F = 2.126, P = 0.006).
Total dissolve solids value for the second sampling were ranging from 0.71 g/L to 8.01 g/L during low tide and
from 1.05 g/L to 23.5 g/L during high tide (Fig. 7b). Station 1 shows the highest value of total dissolve solid during
low and high tides at 8.01 g/L and 23.5 g/L respectively. Station 7 shows the lowest value of total dissolve solid
during low and high tides at 0.71 g/L and 1.05 g/L respectively.Statistical analysis of one-way ANOVA revealed
0
2
4
6
8
1 2 3 4 5 6 7
Low tide
High tide
Station
Dis
solv
e O
xyge
n
(mg/
L)
0
2
4
6
8
1 2 3 4 5 6 7
Low tide
High tide
Station
Dis
solv
e O
xyge
n
(mg/
L)
a
b
Malaysian Journal of Analytical Sciences, Vol 19 No 6 (2015): 1431 - 1447
1439
that there are no significant differences (P < 0.05) in pH between stations during the second sampling (df = 13, F =
1.905, P = 0.006).
Total dissolve solids value for both sampling falls between 0.71 g/L to 25.97 g/L, where they can be classified as
saline (> 1000 mg/L) which is not suitable for aquatic organism [14]. The presence of dissolved solids in water may
affect its taste. The palatability of drinking water has been rated by panels of tasters in relation to its TDS level as
follows: excellent, less than 300 mg/L; good, between 300 and 600 mg/L; fair, between 600 and 900 mg/L; poor,
between 900 and 1200 mg/L; and unacceptable, greater than 1200 mg/L [19].
Figure 7. Total dissolved solid values at seven sampling stations during first (a) and second (b) samplings
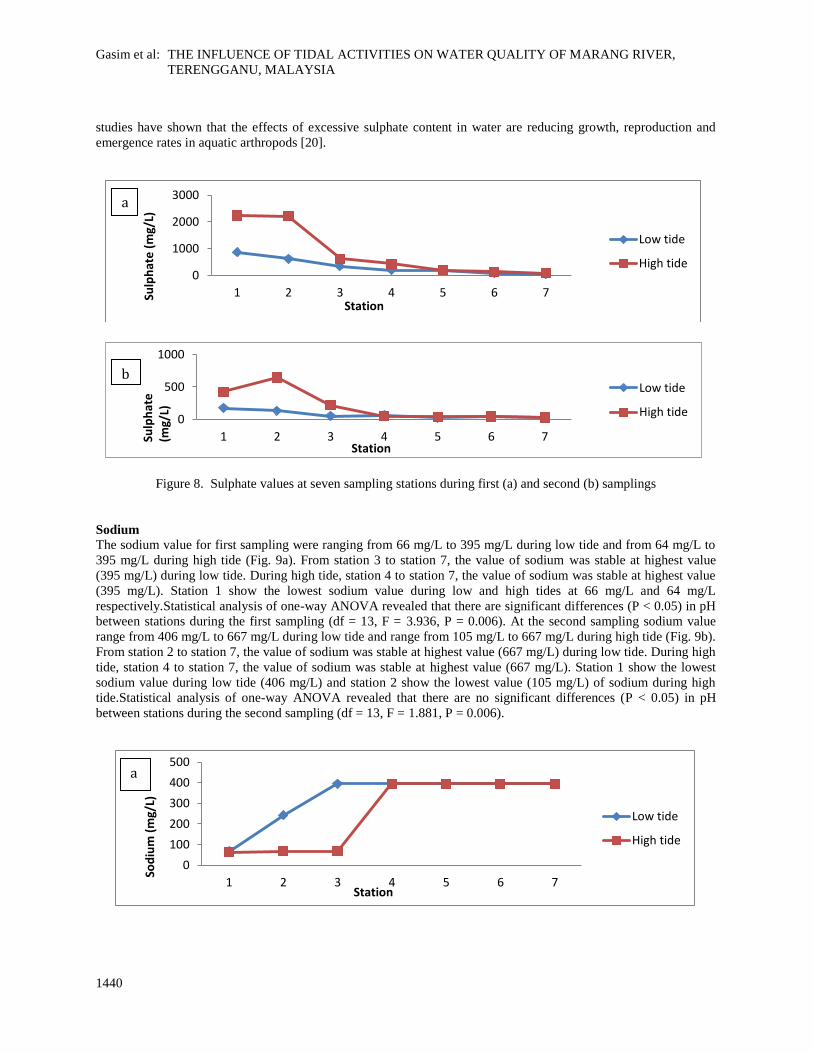
Sulphate
The sulphate value for first sampling were ranging from 38 mg/L to 870 mg/L during low tide and from 80 mg/L to
2240 mg/L during high tide(Fig. 8a). Station 1 show the highest sulphate value during the low and high tides at 870
mg/L and 2240 mg/L respectively. Station 7 show the lowest sulphate value during low and high tides at 38 mg/L
and 80 mg/L respectively.Statistical analysis of one-way ANOVA revealed that there are no significant differences
(P < 0.05) in pH between stations during the first sampling (df = 13, F = 2.426, P = 0.006).
At the second sampling sulphate value range from 24.5 mg/L to 175 mg/L during low tide and range from 27.5
mg/L to 645 mg/L during high tide(Fig. 8b),. Station 1 show the highest sulphate value during the low tide (175
mg/L) and station 2 show the highest suphate value during the high tide (645 mg/L). In addition, station 7 shows the
lowest sulphate value during low and high tides at 24.5 mg/L and 27.5 mg/L respectively.Statistical analysis of one-
way ANOVA revealed that there are no significant differences (P < 0.05) in pH between stations during the second
sampling (df = 13, F = 1.726, P = 0.006).
Overall, for both sampling, sulphate value is decreasing from station 1 towards station 7. The increasing of sulphate
concentrations in river waters may were resulted from acid deposition [18]. Sulphate can be found in most
freshwaters at concentrations of less than 100 mg/L. Anthropogenic influences can increase sulphate concentrations
to the gram per liter range [20]. In Marang River, high value of sulphate at station 1 to station 3 during first and
second samplings probably contributed from domestic wastewater from farmhouse and aquaculture activity. A few
0
10
20
30
1 2 3 4 5 6 7
Low tide
High tide
Station
TDS
(g/L
)
0
10
20
30
1 2 3 4 5 6 7
Low tide
High tide
Station
TDS
(g/L
)
a
b
Gasim et al: THE INFLUENCE OF TIDAL ACTIVITIES ON WATER QUALITY OF MARANG RIVER,
TERENGGANU, MALAYSIA
1440
studies have shown that the effects of excessive sulphate content in water are reducing growth, reproduction and
emergence rates in aquatic arthropods [20].
Figure 8. Sulphate values at seven sampling stations during first (a) and second (b) samplings
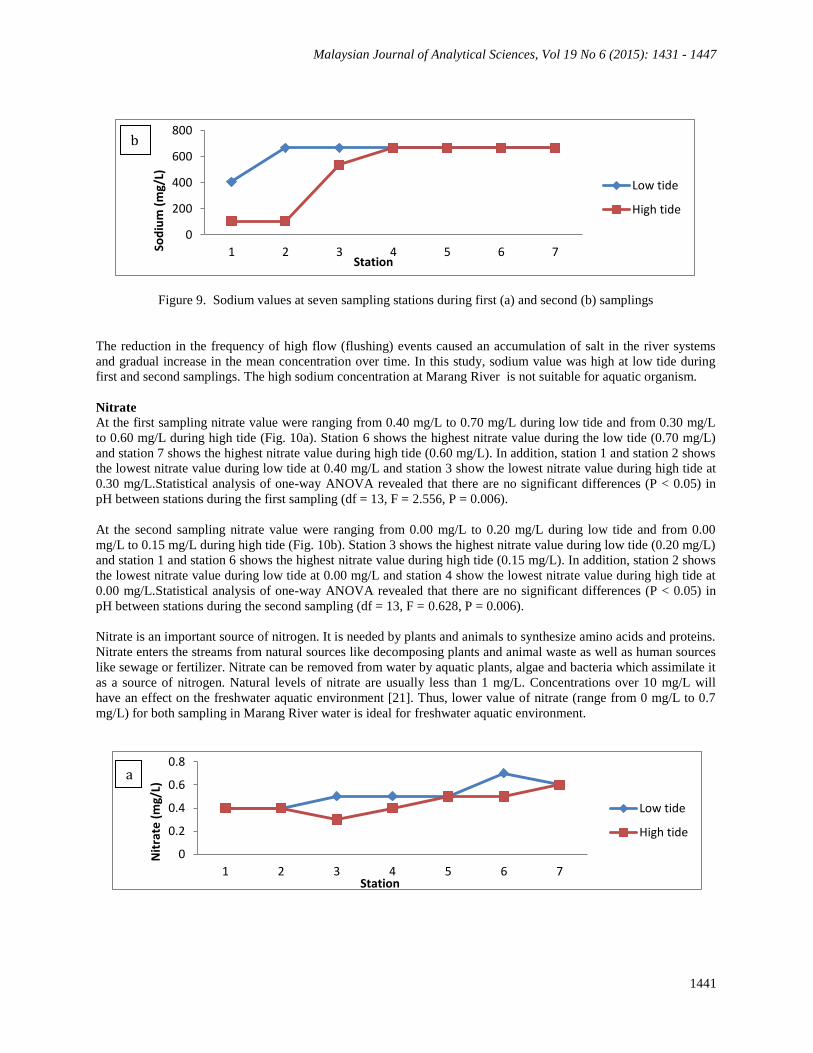
Sodium
The sodium value for first sampling were ranging from 66 mg/L to 395 mg/L during low tide and from 64 mg/L to
395 mg/L during high tide (Fig. 9a). From station 3 to station 7, the value of sodium was stable at highest value
(395 mg/L) during low tide. During high tide, station 4 to station 7, the value of sodium was stable at highest value
(395 mg/L). Station 1 show the lowest sodium value during low and high tides at 66 mg/L and 64 mg/L
respectively.Statistical analysis of one-way ANOVA revealed that there are significant differences (P < 0.05) in pH
between stations during the first sampling (df = 13, F = 3.936, P = 0.006). At the second sampling sodium value
range from 406 mg/L to 667 mg/L during low tide and range from 105 mg/L to 667 mg/L during high tide (Fig. 9b).
From station 2 to station 7, the value of sodium was stable at highest value (667 mg/L) during low tide. During high
tide, station 4 to station 7, the value of sodium was stable at highest value (667 mg/L). Station 1 show the lowest
sodium value during low tide (406 mg/L) and station 2 show the lowest value (105 mg/L) of sodium during high
tide.Statistical analysis of one-way ANOVA revealed that there are no significant differences (P < 0.05) in pH
between stations during the second sampling (df = 13, F = 1.881, P = 0.006).
0
1000
2000
3000
1 2 3 4 5 6 7
Low tide
High tide
Station
Sulp
hat
e (
mg/
L)
0
100
200
300
400
500
1 2 3 4 5 6 7
Low tide
High tide
Station
Sod
ium
(m
g/L)
0
500
1000
1 2 3 4 5 6 7
Low tide
High tide
Station
Sulp
hat
e
(mg/
L)
b
a
a
Malaysian Journal of Analytical Sciences, Vol 19 No 6 (2015): 1431 - 1447
1441
Figure 9. Sodium values at seven sampling stations during first (a) and second (b) samplings
The reduction in the frequency of high flow (flushing) events caused an accumulation of salt in the river systems
and gradual increase in the mean concentration over time. In this study, sodium value was high at low tide during
first and second samplings. The high sodium concentration at Marang River is not suitable for aquatic organism.
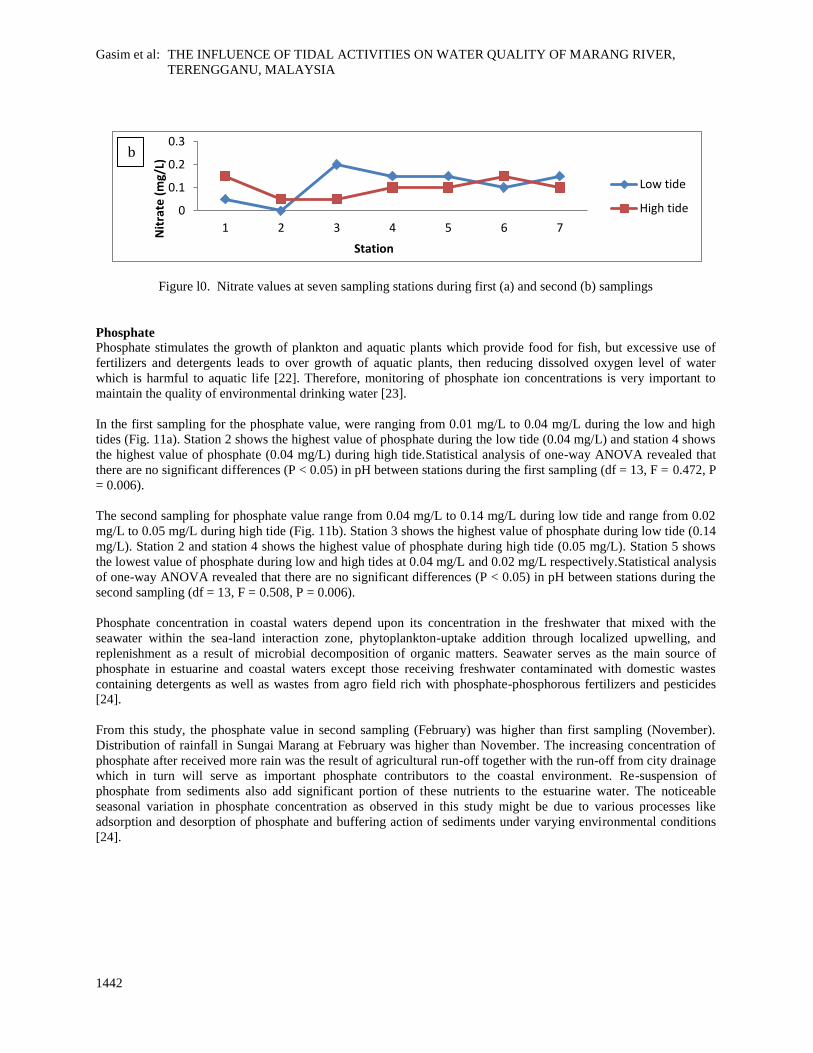
Nitrate
At the first sampling nitrate value were ranging from 0.40 mg/L to 0.70 mg/L during low tide and from 0.30 mg/L
to 0.60 mg/L during high tide (Fig. 10a). Station 6 shows the highest nitrate value during the low tide (0.70 mg/L)
and station 7 shows the highest nitrate value during high tide (0.60 mg/L). In addition, station 1 and station 2 shows
the lowest nitrate value during low tide at 0.40 mg/L and station 3 show the lowest nitrate value during high tide at
0.30 mg/L.Statistical analysis of one-way ANOVA revealed that there are no significant differences (P < 0.05) in
pH between stations during the first sampling (df = 13, F = 2.556, P = 0.006).
At the second sampling nitrate value were ranging from 0.00 mg/L to 0.20 mg/L during low tide and from 0.00
mg/L to 0.15 mg/L during high tide (Fig. 10b). Station 3 shows the highest nitrate value during low tide (0.20 mg/L)
and station 1 and station 6 shows the highest nitrate value during high tide (0.15 mg/L). In addition, station 2 shows
the lowest nitrate value during low tide at 0.00 mg/L and station 4 show the lowest nitrate value during high tide at
0.00 mg/L.Statistical analysis of one-way ANOVA revealed that there are no significant differences (P < 0.05) in
pH between stations during the second sampling (df = 13, F = 0.628, P = 0.006).
Nitrate is an important source of nitrogen. It is needed by plants and animals to synthesize amino acids and proteins.
Nitrate enters the streams from natural sources like decomposing plants and animal waste as well as human sources
like sewage or fertilizer. Nitrate can be removed from water by aquatic plants, algae and bacteria which assimilate it
as a source of nitrogen. Natural levels of nitrate are usually less than 1 mg/L. Concentrations over 10 mg/L will
have an effect on the freshwater aquatic environment [21]. Thus, lower value of nitrate (range from 0 mg/L to 0.7
mg/L) for both sampling in Marang River water is ideal for freshwater aquatic environment.
0
200
400
600
800
1 2 3 4 5 6 7
Low tide
High tide
Station
Sod
ium
(m
g/L)
0
0.2
0.4
0.6
0.8
1 2 3 4 5 6 7
Low tide
High tide
Station
Nit
rate
(m
g/L)
b
a
Gasim et al: THE INFLUENCE OF TIDAL ACTIVITIES ON WATER QUALITY OF MARANG RIVER,
TERENGGANU, MALAYSIA
1442
Figure l0. Nitrate values at seven sampling stations during first (a) and second (b) samplings
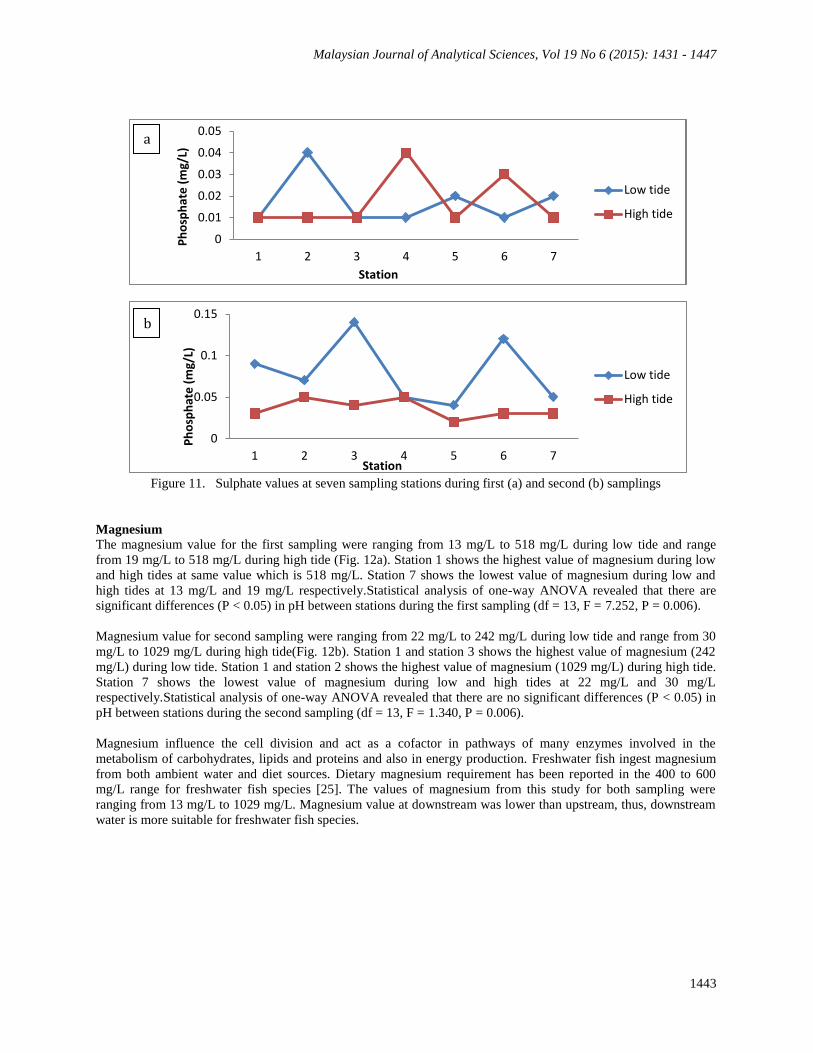
Phosphate
Phosphate stimulates the growth of plankton and aquatic plants which provide food for fish, but excessive use of
fertilizers and detergents leads to over growth of aquatic plants, then reducing dissolved oxygen level of water
which is harmful to aquatic life [22]. Therefore, monitoring of phosphate ion concentrations is very important to
maintain the quality of environmental drinking water [23].
In the first sampling for the phosphate value, were ranging from 0.01 mg/L to 0.04 mg/L during the low and high
tides (Fig. 11a). Station 2 shows the highest value of phosphate during the low tide (0.04 mg/L) and station 4 shows
the highest value of phosphate (0.04 mg/L) during high tide.Statistical analysis of one-way ANOVA revealed that
there are no significant differences (P < 0.05) in pH between stations during the first sampling (df = 13, F = 0.472, P
= 0.006).
The second sampling for phosphate value range from 0.04 mg/L to 0.14 mg/L during low tide and range from 0.02
mg/L to 0.05 mg/L during high tide (Fig. 11b). Station 3 shows the highest value of phosphate during low tide (0.14
mg/L). Station 2 and station 4 shows the highest value of phosphate during high tide (0.05 mg/L). Station 5 shows
the lowest value of phosphate during low and high tides at 0.04 mg/L and 0.02 mg/L respectively.Statistical analysis
of one-way ANOVA revealed that there are no significant differences (P < 0.05) in pH between stations during the
second sampling (df = 13, F = 0.508, P = 0.006).
Phosphate concentration in coastal waters depend upon its concentration in the freshwater that mixed with the
seawater within the sea-land interaction zone, phytoplankton-uptake addition through localized upwelling, and
replenishment as a result of microbial decomposition of organic matters. Seawater serves as the main source of
phosphate in estuarine and coastal waters except those receiving freshwater contaminated with domestic wastes
containing detergents as well as wastes from agro field rich with phosphate-phosphorous fertilizers and pesticides
[24].
From this study, the phosphate value in second sampling (February) was higher than first sampling (November).
Distribution of rainfall in Sungai Marang at February was higher than November. The increasing concentration of
phosphate after received more rain was the result of agricultural run-off together with the run-off from city drainage
which in turn will serve as important phosphate contributors to the coastal environment. Re-suspension of
phosphate from sediments also add significant portion of these nutrients to the estuarine water. The noticeable
seasonal variation in phosphate concentration as observed in this study might be due to various processes like
adsorption and desorption of phosphate and buffering action of sediments under varying environmental conditions
[24].
0
0.1
0.2
0.3
1 2 3 4 5 6 7
Low tide
High tide
Station
Nit
rate
(m
g/L)
b
Malaysian Journal of Analytical Sciences, Vol 19 No 6 (2015): 1431 - 1447
1443
0
0.01
0.02
0.03
0.04
0.05
1 2 3 4 5 6 7
Low tide
High tide
Station
Ph
osp
hat
e (
mg/
L)
Figure 11. Sulphate values at seven sampling stations during first (a) and second (b) samplings
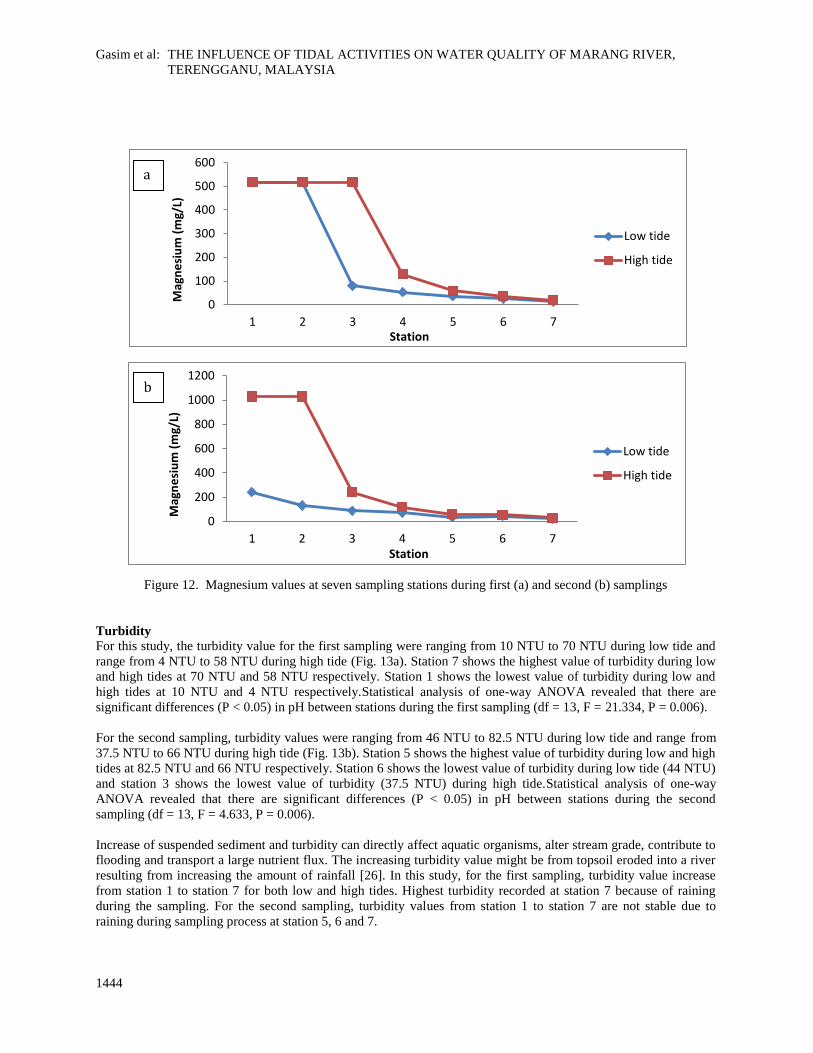
Magnesium
The magnesium value for the first sampling were ranging from 13 mg/L to 518 mg/L during low tide and range
from 19 mg/L to 518 mg/L during high tide (Fig. 12a). Station 1 shows the highest value of magnesium during low
and high tides at same value which is 518 mg/L. Station 7 shows the lowest value of magnesium during low and
high tides at 13 mg/L and 19 mg/L respectively.Statistical analysis of one-way ANOVA revealed that there are
significant differences (P < 0.05) in pH between stations during the first sampling (df = 13, F = 7.252, P = 0.006).
Magnesium value for second sampling were ranging from 22 mg/L to 242 mg/L during low tide and range from 30
mg/L to 1029 mg/L during high tide(Fig. 12b). Station 1 and station 3 shows the highest value of magnesium (242
mg/L) during low tide. Station 1 and station 2 shows the highest value of magnesium (1029 mg/L) during high tide.
Station 7 shows the lowest value of magnesium during low and high tides at 22 mg/L and 30 mg/L
respectively.Statistical analysis of one-way ANOVA revealed that there are no significant differences (P < 0.05) in
pH between stations during the second sampling (df = 13, F = 1.340, P = 0.006).
Magnesium influence the cell division and act as a cofactor in pathways of many enzymes involved in the
metabolism of carbohydrates, lipids and proteins and also in energy production. Freshwater fish ingest magnesium
from both ambient water and diet sources. Dietary magnesium requirement has been reported in the 400 to 600
mg/L range for freshwater fish species [25]. The values of magnesium from this study for both sampling were
ranging from 13 mg/L to 1029 mg/L. Magnesium value at downstream was lower than upstream, thus, downstream
water is more suitable for freshwater fish species.
0
0.05
0.1
0.15
1 2 3 4 5 6 7
Low tide
High tide
Station
Ph
osp
hat
e (
mg/
L)
b a
a
b
Gasim et al: THE INFLUENCE OF TIDAL ACTIVITIES ON WATER QUALITY OF MARANG RIVER,
TERENGGANU, MALAYSIA
1444
Figure 12. Magnesium values at seven sampling stations during first (a) and second (b) samplings
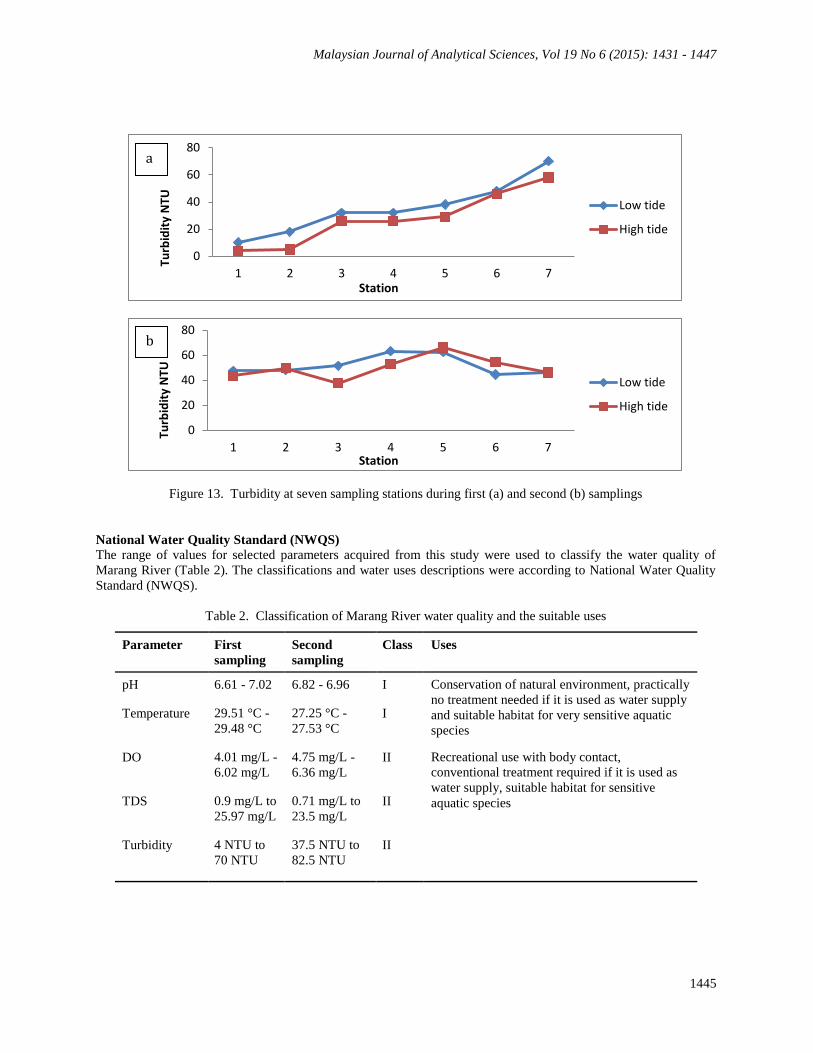
Turbidity
For this study, the turbidity value for the first sampling were ranging from 10 NTU to 70 NTU during low tide and
range from 4 NTU to 58 NTU during high tide (Fig. 13a). Station 7 shows the highest value of turbidity during low
and high tides at 70 NTU and 58 NTU respectively. Station 1 shows the lowest value of turbidity during low and
high tides at 10 NTU and 4 NTU respectively.Statistical analysis of one-way ANOVA revealed that there are
significant differences (P < 0.05) in pH between stations during the first sampling (df = 13, F = 21.334, P = 0.006).
For the second sampling, turbidity values were ranging from 46 NTU to 82.5 NTU during low tide and range from
37.5 NTU to 66 NTU during high tide (Fig. 13b). Station 5 shows the highest value of turbidity during low and high
tides at 82.5 NTU and 66 NTU respectively. Station 6 shows the lowest value of turbidity during low tide (44 NTU)
and station 3 shows the lowest value of turbidity (37.5 NTU) during high tide.Statistical analysis of one-way
ANOVA revealed that there are significant differences (P < 0.05) in pH between stations during the second
sampling (df = 13, F = 4.633, P = 0.006).
Increase of suspended sediment and turbidity can directly affect aquatic organisms, alter stream grade, contribute to
flooding and transport a large nutrient flux. The increasing turbidity value might be from topsoil eroded into a river
resulting from increasing the amount of rainfall [26]. In this study, for the first sampling, turbidity value increase
from station 1 to station 7 for both low and high tides. Highest turbidity recorded at station 7 because of raining
during the sampling. For the second sampling, turbidity values from station 1 to station 7 are not stable due to
raining during sampling process at station 5, 6 and 7.
0
100
200
300
400
500
600
1 2 3 4 5 6 7
Low tide
High tide
Station
Mag
ne
siu
m (
mg/
L)
0
200
400
600
800
1000
1200
1 2 3 4 5 6 7
Low tide
High tide
Station
Mag
ne
siu
m (
mg/
L)
b
a
b
Malaysian Journal of Analytical Sciences, Vol 19 No 6 (2015): 1431 - 1447
1445
Figure 13. Turbidity at seven sampling stations during first (a) and second (b) samplings
National Water Quality Standard (NWQS)
The range of values for selected parameters acquired from this study were used to classify the water quality of
Marang River (Table 2). The classifications and water uses descriptions were according to National Water Quality
Standard (NWQS).
Table 2. Classification of Marang River water quality and the suitable uses
Parameter First
sampling
Second
sampling
Class Uses
pH 6.61 - 7.02 6.82 - 6.96 I Conservation of natural environment, practically
no treatment needed if it is used as water supply
and suitable habitat for very sensitive aquatic
species
Temperature 29.51 °C -
29.48 °C
27.25 °C -
27.53 °C
I
DO 4.01 mg/L -
6.02 mg/L
4.75 mg/L -
6.36 mg/L
II Recreational use with body contact,
conventional treatment required if it is used as
water supply, suitable habitat for sensitive
aquatic species TDS 0.9 mg/L to
25.97 mg/L
0.71 mg/L to
23.5 mg/L
II
Turbidity 4 NTU to
70 NTU
37.5 NTU to
82.5 NTU
II
0
20
40
60
80
1 2 3 4 5 6 7
Low tide
High tide
Station
Turb
idit
y N
TU
a
0
20
40
60
80
1 2 3 4 5 6 7
Low tide
High tide
Station
Turb
idit
y N
TU
b
b
a
Gasim et al: THE INFLUENCE OF TIDAL ACTIVITIES ON WATER QUALITY OF MARANG RIVER,
TERENGGANU, MALAYSIA
1446
Table 2 (cont’d). Classification of Marang River water quality and the suitable uses
Parameter First
sampling
Second
sampling
Class Uses
Nitrate 0.3 mg/L to
0.7 mg/L
0 mg/L to 0.2
mg/L
III Extensive treatment required if it is used as
water supply, suitable habitat for common, of
economic value and tolerant fish species and for
livestock drinking
Conductivity 1070
µS/cm to
44027
µS/cm
1125 µS/cm
to 38284
µS/cm
III
Conclusion
Based on the twelve physicochemical parameters water quality analysis, the study area is slightly alkaline, suitable
temperature for aquatic life, high value of conductivity, salinity, sulphate, magnesium and turbidity and low value of
nitrate and phosphate. For water quality analysis, according to one way ANOVA, for the first sampling, only four
parameters show significant different and the other parameters not have significant different. For the second
sampling, only three parameters have significant different and the other parameters have no significant different.
From that, the data were average to show the impression or overview of water quality at Sungai Marang in spatially
and temporal which is it shows there are no obvious changes between two sampling. According to National Water
Quality Standard (NWQS), the water quality parameters acquired from seven sampling stations along Marang River
have two parameters (pH and temperature) classified the river as class I, three parameters (dissolve oxygen, total
dissolve solid and turbidity) classified the river as class II and two parameters (nitrate and conductivity) classified
the river as class III. In general, Marang River water required to treatment for water supply and sensitive to aquatic
organism. Thus, some action must be taken to conserve, manage and improve water quality in Sungai Marang to
protect aquatic life community and for human water resources.
Acknowledgement
The authors would also like to thank to the express an appreciation to East Coast Environmental Research Institute
(ESERI), Universiti Sultan Zainal Abidin (UniSZA) for the use of their research facilities.
References
1. Li, Y. P., Huang, G. H. and Nie, S. L. (2010). Planning water resources management systems using a fuzzy-
boundary interval-stochastic programming method.
2. Davies, E. G. R. and Simnovic, S. P. (2011). Global water resources modeling with an intedrated model of the
social economic-environmental system. Journal of Advances in Water Resources 34(6): 684-700.
3. Li, L., Barry, D.A., Stagnitti, F., Parlange, J.Y. and Jeng, D.S. (2000). Beach water table fluctuations due to
spring–neap tides: moving boundary effects. Advances in Water Resources 23(8): 817-824.
4. Rosli, N. A., Zawawi, M. H. and Bustami, R. A. (2011). Salak river water quality identification and
classification according to physic-chemical characteristics. Proceeding Engineering 50: 69-77.
5. Ravenscroft, N. O. M. and Beardall, C. H. (2003). The importance of freshwater flows over estuarine mudflats
for wintering waders and wildfowl. Journal of Biological Conservation 113(1): 89-97.
6. Al-Shami, S. A. Rawi, C. S. M., Ahmad, A. H., Hamid, S. A. and Nor, S. A. M. (2011). Influence of
agricultural, industrial, and anthropogenicstresses on the distribution and diversity of macroinvertebrates in
Juru River Basin, Penang, Malaysia. Ecotoxicology and Environmental Safety 74: 1195-1202.
7. Taner, M. U., Ustun, B. and Erdincler, A. (2011). A simple tool for the assessment of water quality in polluted
lagoon systems: A case study for Kucukcekmece Lagoon, Turkey. Ecological Indicators 11: 749-756.
8. Mannina, G. and Viviani, G. (2010). Water quality modelling for ephemeral rivers: model development and
parameter assessment. Journal of Hydrology 393: 186-196.
Malaysian Journal of Analytical Sciences, Vol 19 No 6 (2015): 1431 - 1447
1447
9. Wilby, R. L., Orr, H., Watts, G., Battarbee, R.W., Berry, P.M., Chadd, R., Dugdale, S.J., Elliott, J. A., Extence,
C., Hannah, D. M., Holmes, N., Johnson, A. C., Knights, B.,Milner, N. J., Ormerod, S. J., Solomon, D.,
Timlett, R., Whitehead, P. J. and Wood, P. J. (2010). Evidence needed to manage freshwater ecosystems in a
changing climate: Turning adaptation principles into practice.
10. Hayrol Azril, Mohamed Shaffril, Bahaman Abu Samah, D’Silva, J. L. &Uli. J. (2011).
11. Kumar, P. K. D., Kumar, S. P., Roshin, R. P., Narvekar, J. and Vivekanandan, E. (2009). Response of the
Arabian Sea to global warming and associated regional climateshift. Journal of Marine Environment 68: 217-
222.
12. Meyssignac, B., Calafat, F. M., Somot, S., Rupolo, V., Stocchi, P., Llovel, W. and Cazenave, A. (2011). Two-
dimensional reconstruction of the Mediterranean Sea level over 1970-2006 from tide gage data and regional
ocean circulation model outputs. Journal of Global and Planetary Change 77(1-2): 49-61.
13. Werner, A. D., Bakker, M., Post, V. E. A., Vandenbohede, A., Lu, C., Ashtiani, B. A., Simmons, C. T. and
Barry, D. A. (2012). Seawater intrusion processes, investigation and management: recent advances and future
challenges. Journal of Advances in Water Resources.
14. Marghany, M. (2003). ERS-1 modulation transfer function impact on shoreline change model. Journal of
Applied Earth Observation and Geoinformation 4: 279-294.
15. French, C. R., Carr, J. J., Dougherty, E. M., Eidson, L. A. K., Reynolds, J. C. and Degrandpre, M. D. (2002).
Spectrophotometric pH measurements of freshwater.
16. Bayson, E., Atli, G., Gurler, C. O., Dogan, Z., Eroglu, A., Kocalar, K. and Canli, M. (2012). The effects of
increased freshwater salinity in the biodisponibility of metals (Cr, Pb) and effects on antioxidant systems of
Oreochromisniloticus.
17. Nielsen, D. L., Brock, M. A., Ress, G. N. and Baldwin, D. S. (2003). Effects of increasing salinity on
freshwater ecosystems in Australia. Journal of Botany 51: 655-665.
18. Li, X. D., Liu, C. Q., Liu, X. L. and Bao, L. R. (2011). Identification of dissolved sulfate sources and the role of
sulfuric acid in carbonate weathering using dual-isotopic data from the Jialing River, Southwest China. Journal
of Asian Earth Science 42: 370-380.
19. WHO. (2003).Guidelines for Drinking Water Quality. Geneva: World Health Organization.
20. Soucek, D. J. (2007). Sodium sulfate impacts feeding, specific dynamic action, and growth rate in the
freshwater bivalve Corbiculafluminea. Journal of Aquatic Toxicology 83: 315-322.
21. Camargo, J. A., Alonso, A. and Salamanca, A. (2005). Nitrate toxicity to aquatic animals: a review with new
data for freshwater invertebrates. Journal of Chemosphere 58: 1255-1267.
22. Shyla, B., Mahadevaiah and Nagendrappa, G. (2011). A simple spectrophotometric method for the
determination of phosphate in soil, detergents, water, bone and food samples through the formation of
phosphomolybdate complex followed by its reduction with thiourea. Journal of Molecular and Biomolecular
Spectroscopy 78(1): 497-502.
23. Nakamura, H., Tanaka, H., Hasegawa, M., Masuda, Y., Arikawa, Y., Nomura, Y., Ikebukuro, K. and Karube, I.
(1999). An automatic flow-injection analysis system for determining phosphate ion in river water using
pyruvate oxidase G from from Aerococcusviridans. Journal of Talanta 50(4): 799-807.
24. George, B., Kumar, J. I. N. and Kumar, R. N. (2012). Study on the influence of hydro-chemical parameters on
phytoplankton distribution along Tapi estuarine area of Gulf of Khambat, India. Journal of Aquatic Research
38: 157-170.
25. Lee, B. J., Jaroszewska, M., Dabrowski, K., Czesny, S. and Rinchard, J. (2012). Effects of dietary vitamin B1
(thiamine) and magnesium on the survival, growth and histological indicators in lake trout
(Salvelinusnamaycush) juveniles.
26. Prathumratana, L., Sthiannopkao, S. and Kim, K. W. (2008). The relationship of climatic and hydrological
parameters to surface water quality in the lower Mekong River. Environment International 34: 960-866.