spatial distribution of pressure drag acting on
TRANSCRIPT
SPATIAL DISTRIBUTION OF PRESSURE DRAG ACTING ON RECTANGULAR 1 BLOCK ARRAYS WITH VARIOUS LAYOUTS 2
3 Sheikh Ahmad Zaki1, Aya Hagishima2, and Jun Tanimoto2 4
1Malaysia-Japan International Institute of Technology, Universiti Teknologi Malaysia, 5 International Campus, Jalan Semarak, 54100 Kuala Lumpur, Malaysia 6
[email protected] 7 2Interdisciplinary Graduate School of Engineering Sciences, Kyushu University 8
6-1, Kasuga-koen, Kasuga-shi, Fukuoka 816-8580, Japan 9 10
ABSTRACT This study reported a series of wind tunnel experiments on the spatial distribution of the pressure drag acting on the walls of rectangular block arrays, which were arranged in staggered, square, and diamond layouts under the conditions of different packing densities. The obtained bulk pressure coefficients of a block located in various staggered arrays showed clear dependency of packing density. This result suggests the importance of the consideration for the reduction of wind-driven cross ventilation due to neighborhood densely built-up area in building simulation coupled with ventilation model.
INTRODUCTION Natural ventilation of buildings generally leads to better air quality and reduction of the thermal load of air-conditioning systems. In a naturally ventilated building, air is driven in and out because of the pressure differences induced by wind or buoyancy forces. To estimate the efficiency of wind-induced ventilation, various wind tunnel experiments, field measurements, and numerical simulations have been performed. The wind pressure coefficient of an isolated building is simple but important information used to quantify not only the wind-load design of a building but also the amount of ventilation of a building based on Bernoulli’s assumption of a steady incompressible flow. Eaton and Mayne (1975) performed full-scale experiments for wind pressure coefficients of two-story homes in Adlesbury, London. Wind tunnel experiments on an isolated building have also been performed and validated by comparing these results with the full-scale data (Okada and Ha, 1991; Cochran, 1992; Endo et al. 2006). The computational fluid dynamics (CFD) technique has been used for the estimation of wind-induced ventilation. Prior studies on a single building in a computational domain can be categorized into two groups. The first group has examined external building flows by considering a building as a solid body and has provided a database of pressure coefficient distributions (e.g., Nozawa and Tamura, 2002; Lim et al., 2009). The other group of studies has explicitly considered the room air. For example, Jiang and Chen (2003) and Evola and Popov (2006)
studied the pressure distribution inside and around a building with three different ventilation routes using large eddy simulation (LES) and Reynolds-averaged Navier-Stokes (RANS) equation model, respectively. Meroney (2009) simulated five different conditions of cross-ventilation for a rectangular isolated building using the RANS model and evaluated the pressure distributions. In addition to the study on a single building, Chow (2004) and Dagnew and Bitsuamlak (2010) investigated sheltering effects of an adjacent vertical building located in the vicinity under different window configurations using CFD. Katayama et al. (1992) and Jiang and Chen (2002) investigated cross-ventilation in a group of apartment buildings and presented the distribution of air flow and wind pressure difference around the buildings on the basis of a wind tunnel experiment and LES, respectively. Nevertheless, the effect of surrounding buildings on wind-induced ventilation has not yet been systematically clarified. To this end, we have performed a series of wind tunnel experiments on the total surface drag acting on an array of urban buildings with various layouts and packing densities from the viewpoint of atmospheric boundary layer research (Hagishima et al., 2009; Zaki et al., 2011). Because the total surface drag of an urban rough surface consists of form drag and friction drag, if we can quantify the ratio of pressure drag to total drag, the database of our previous work can be applied to the estimation of the effect of urban geometry on the wind-induced ventilation in an urban building. Therefore, in this study, we measured the pressure drag distribution of walls of blocks arranged in a regular layout in a wind tunnel. In addition to the evaluation of the wind-induced ventilation in an urban building, estimation of the geometry dependence of urban airflow is also an important factor in the comfort and health of urban inhabitants. The vertical profile of the inertial sublayer above an urban area can be expressed by the following log-law equation under neutral stability conditions
,ln*
−
κ=
oz z
dzuu
where the roughness length zo and displacement height d are aerodynamic parameters that depend on
(1)
Proceedings of Building Simulation 2011: 12th Conference of International Building Performance Simulation Association, Sydney, 14-16 November.
- 1686 -
the urban geometry. κ is the von Karman constant, ordinarily assumed to be a constant value between 0.36−0.41, uz is the wind speed at height z, and u* is the friction velocity. The roughness length zo is a length scale that is directly related to the overall drag of a surface. In contrast, Jackson (1981) explained the physical meaning of displacement height d as the center height of the moment of the drag force acting on a rough surface. Studies on these two parameters for various geometry conditions of urban arrays have been carried out through various methodologies, including wind tunnel experiments and numerical simulations. Methods to estimate zo and d based on experimental data or CFD can be classified into several groups. The first group simultaneously estimates u*, zo, and d using the measured wind profile based on log-law fitting (Salizzonni et al., 2008), whose accuracy has been reported to be low. In the second group, zo and d are estimated by log-law fitting, and u* is obtained by direct measurement using hot-wire anemometry or a drag balance instrument (Cheng et al., 2007; Hagishima et al., 2009; Zaki et al., 2011). According to Iyengar and Farell (2001), u* determined from drag balance measurement is more accurate than hot-wire anemometry. Kanda and Moriizumi (2009) have estimated zo and u* directly using the log-law equation based on the data of mean streamwise velocity and Reynolds stress at a measurement point within the inertial sublayer using the value of d predicted by Macdonald’s simple method. Leonardi et al. (2003) and Cheng et al. (2007) have derived d from the measured pressure drag distribution using Jackson’s theory. Recently, Leonardi and Castro (2010) determined d on the basis of Jackson’s theory using the highly precise data obtained by DNS on cubical staggered arrays with different λp. Their results support the validity of Jackson`s concept of the physical meaning of d and showed that Macdonald’s model underestimates d for low λp. The difficulty and inaccuracy of the experimental estimation of zo and d using a fitting method have also been pointed out. Moreover, they have suggested that the von Karman constant κ actually varies between 0.41 and 0.36 as λp increases. According to their statement, to obtain zo and d experimentally with high accuracy, careful consideration of the estimation technique is needed. In light of this prior work, in the present study, we have performed a wind tunnel experiment on the spatial distribution of pressure drag acting on the walls of rectangular block arrays arranged in staggered, square, and diamond layouts under the conditions of different roughness and packing densities. The wall pressure of the blocks was measured using pressure-tapping blocks and a micro-manometer.
The first aim of this experiment was to quantify the contribution of pressure drag to the total surface drag in order to evaluate whether our previous data of Cd based on drag balance (Hagishima et al., 2009; Zaki et al., 2011) can be used for evaluating the wind-induced ventilation in an urban building. In addition, the effects of roughness, packing density, and layout on the spatial distribution of pressure coefficient are discussed. The second aim was the experimental determination of a center height of moment of drag force, which was assumed to be d on the basis of Jackson’s theory, for cubical arrays with square and diamond layouts. The data was compared with our previous estimation by the log-law fitting of wind profiles (Hagishima et al., 2009; Zaki et al., 2011).
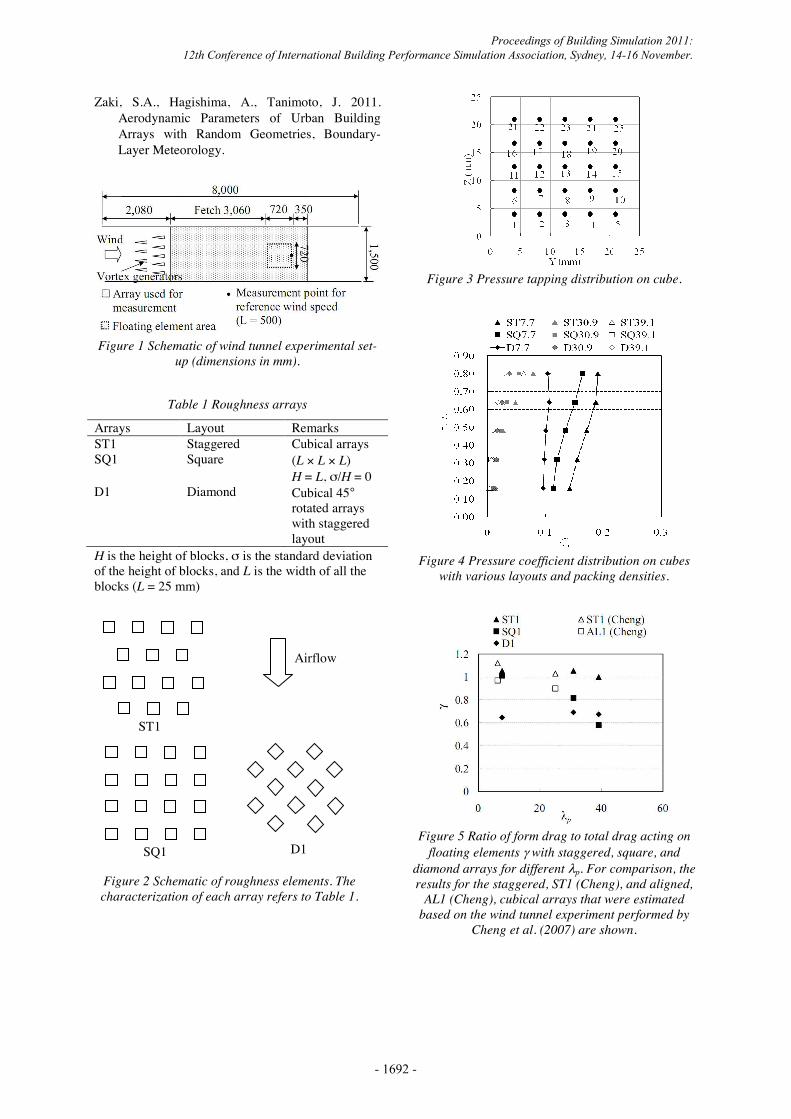
EXPERIMENTAL SET-UP Wind tunnel The experiments were conducted in a low-speed single-return wind tunnel at the laboratory of the Interdisciplinary Graduate School of Engineering Sciences, Kyushu University, Japan. The wind tunnel has a working section 1 m high × 1.5 m wide × 8 m long. A schematic plan-view of the wind tunnel is shown in Figure 1. The surrounding areas covered with a roughness array have a length of 3 m and 0.18 m in the windward and leeward directions, respectively. Therefore, the length of fetch is approximately 120 times that of the block height.
Roughness array The schematic plan-view of block arrays with layouts of staggered (hereafter ST1), square (hereafter SQ1), and diamond (hereafter D1), shown in Figure 2, were investigated. All blocks are sharp-edged cubes with a size of 25 mm, and hereafter, we assume H = 25 mm as a standard length scale. In this study, the measurement was taken under three different packing densities of λp (7.7%, 17.4%, and 30.9%) for arrays of ST1, SQ1, and D1. The details of the measured arrays are summarized in Table 1.
Instrumentation Pressure drag measurements were performed by replacing a wooden cube with one that was fitted with 25 pressure tappings on a vertical face, as shown in Figure 3. The tapped holes of the block were connected by tubes to a 16-port pressure scanner (Scanivalve, DSA 3217). The tapping block was installed in two different settings in an array to obtain the pressures of both the windward and leeward walls. The wind pressure coefficient was calculated from a differential of the two values. The reference flow speed at 20H was measured using a Pitot-static tube connected to the pressure scanner mentioned above, the static pressure of which was used as the reference pressure for the wall pressure measurement. The pressure measurement was done after a warm-up period of approximately one hour and calibration at zero pressure. The sampling
Proceedings of Building Simulation 2011: 12th Conference of International Building Performance Simulation Association, Sydney, 14-16 November.
- 1687 -
frequency and sampling time at each measurement point were 200 Hz and 50 s, respectively. We repeated the pressure drag measurement three times for each tapping and used the averaged values in the following analysis. The pressure drag acting on an individual cube was estimated as an ensemble average of cubes located in the spanwise direction to obtain an accurate representative value of the array. All the measurements described here were carried out at a free-stream velocity of approximately 8 ms−1.
RESULTS AND DISCUSSION Wind pressure coefficient The wind pressure coefficient on a wall of a cube is defined as:
,5.0 2)(
z
bfzp U
PPC
ρ
−=
where Pf and Pb are the pressures on front and back faces, respectively; Uz is the reference mean speed at a height of z; and ρ is the density of air. Contributions of pressure drag to total drag force Figure 4 shows the comparison of the pressure coefficient Cp(20H) on the cubes with various layouts and packing densities. The cube arrays with λp = 7.7% have much higher values of the pressure coefficient than those with λp = 30.9% and 39.1%, which is caused by a weaker sheltering effect due to the longer distance between surrounding blocks. The values of Cp of λp = 30.9% and 39.1% are quite similar regardless of the layout, likely due to the skimming flow phenomenon at high packing density. For the sparse condition, λp = 7.7%, the value of Cp increases in the order of the following arrays: diamond, square, and staggered. According to our previous measurement of the total drag using a floating drag balance (Hagishima et al., 2009), the total drag coefficient Cd(20H) of the diamond array is larger than those of the staggered and square arrays. The different trends of Cd and Cp indicate the contribution of skin friction drag on the total drag varies among those three arrays. In order to compare the pressure drag on blocks to total drag of the array, we introduce a parameter, γ, the pressure-to-total drag ratio which can be defined as follows:
ACNAC
zd
fzp
)(
)(=γ .
In this equation, Af is the total frontal area of blocks located in the floating element used for the measurement of the total drag, A is the floating area, N is the total number of blocks on the floating element, and Cd(z) is the drag coefficient that can be expressed as follows:
,5.0 2)(
z
ozd U
Cρτ
=
where τo is the total surface shear stress acting on an array. The ratio γ is shown in Figure 5. The drag ratio γ for staggered arrays with various packing densities is almost constant and equal to unity, indicating that the skin viscous friction is negligible for staggered arrays, and the array can be aerodynamically classified as a “fully rough” wall. This result is consistent with the data of Cheng et al. (2007) which was determined on the basis of wind tunnel experiment. Based on the above result, our previous experimental data of total surface drag for a staggered array seems to be directly applicable to the assessment of the potential of wind-induced ventilation in buildings located in an urban district of diverse building coverage. In contrast, for the square array, γ decreases dramatically from λp = 7%–39%. This finding is likely due to the effect of channel flow on streets parallel to the mean wind, which contributes the large frictional resistance on the surface of streets and walls. This behavior is consistent with the result found using DNS (Leornadi et al., 2003), which led to the conclusion that the maximum form drag occurs at low packing density and coincides with minimum skin frictional drag. In the case of diamond array, the drag ratio γ remained steady at approximately 0.65 for λp = 7%−39%, indicating that the portion of skin frictional drag for the diamond array is approximately 35%. This result is attributable to the characteristics of flow around a cube rotated 45° to the mean direction. Strong vortices might be generated at the lower layer of the front block, which tends to reduce the cavity height in the canopy layer as presented by Hansen and Cermak (1975). In addition, the “horse-shoe” vortices that appeared around the block reported by Plate (1982) may affect this tendency. Effect of urban geometry on bulk driving force of wind-induced ventilation Using the values of γ, we present a database of pressure coefficients for a block located in a regular staggered array based on our previous work (Hagishima et al. 2009) for the assessment of the effectiveness of wind-induced ventilation. We estimate the pressure coefficient C’p(z) using the following equation:
,)('
)(f
zdzp CCλ
γ=
where Cd(z) is the drag coefficient of blocks at a height z measured by Hagishima et al. (2009). The estimated Cp
’ at 2H and 20H for the cubical arrays with staggered, square, and diamond layouts under various density conditions are shown in Figure
(3)
(2)
(5)
(4)
Proceedings of Building Simulation 2011: 12th Conference of International Building Performance Simulation Association, Sydney, 14-16 November.
- 1688 -
6, along with the data for the rectangular staggered array (ST1.5) consisting of uniform blocks with a size of 25 mm × 25 mm × H37.5 mm. Cp(2H)
’ is insusceptible to boundary layer height and inflow turbulence features, whereas Cp(20H)
’ is affected by the momentum deficit due to arrays. Since the measurement of pressure drag was made under only three conditions of λp, unknown values of γ for several arrays are assumed to be the same as those of the array with similar geometry. For example, we substituted γ of ST1 for that of ST1.5. In the case of the square and diamond arrays, we assume the values of γ are almost identical under the condition of λp ≤ 7.7%. For λp = 17.4% we interpolated the values of γ between 7.7% and 30.9%. As can be seen from the data given in Figure 6, the Cp’ at 2H and 20H for all arrays decrease almost monotonically with λp. The Cp(2H)’ of ST1 is larger than those of SQ1 and D1 when λp ≤ 17%, but is almost the same value as when λp exceeds 30%. This result indicates that under the condition of small building coverage, the staggered layout is more effective than the square and diamond geometries for introduction of outside air due to wind-induced ventilation to the extent that inflow velocity at 2H is constant. In contrast, the discrepancy of Cp(20H)’ between ST1 and the others is relatively small when λp is less than 17% compared to the data of Cp(2H)
’. For the staggered array, Cp(2H)
’ can be estimated from the intuitive simple mathematical expression by the following equation: Cp
’(z) = Aλp − B
where A and B are empirical coefficients. Figure 6 contains the estimation of this model; the equation 6 with values A = 0.01 and B = 0.1 shows fairly good agreement with experimental data for z = 2H. Intercomparison of pressure drag measurement ESDU (1986) provides a comprehensive database of pressure coefficients Cx of isolated obstacles with various shapes under uniform flow, which is defined as follows:
,21 2
xf CAUF ρ=
where F is the mean force acting on a block, Af is the frontal area of a block, and Cx is the drag coefficient for the low turbulence of uniform flow of an isolated block. The vertically averaged wind speed within canopy U is defined as follows,
dzUUH
= 0
22.
We assume here that a wind profile within the canopy layer can be expressed by the exponential law presented by Macdonald (2002):
,1exp
−=
Hza
UU
H
where a is the attenuation coefficient, empirically treated as 9.6λf for a cubical array. By integrating this equation, we can obtain the relationship between UH and U , as follows:
( )aeUU
a
H 2−1
=2−
22.
Hence, the original drag coefficient Cx can be modified into pressure coefficient Cp(H) defined by UH as follows:
( )
aeCC
a
xHp 2−1
=2−
)( .
Substituting the values for an isolated cube (Cx = 1.175) given in the ESDU database into equation (11) results in a value of Cp(H) = 0.80 for λp = 4.3%. In contrast, our estimation of Cp(2H)
’ = 0.71. Because we did not measure the spatially averaged value of wind speed at H, strict comparison of Cp between our experiment and ESDU cannot be done. Nevertheless, the discrepancy is approximately 11% and seems to be acceptable. Center height of moment of drag force The center height of the moment of drag force, Hc can be derived from the pressure drag measurement (Cheng et al., 2007) using the following expressions:
,PMHc =
( ),1
n
HPPM
n
iibifi
=
−=
( ),1
n
PPP
n
ibifi
=
−=Δ
where M is the average of the moment; PΔ is the average of the pressure difference; Pfi and Pbi are pressures on the front and back faces of a pressure tapping, respectively; Hi is the height of a pressure tapping; and n is the total number of pressure tappings on the cube. In our previous study (Hagishima et al. 2009), we estimated zo and d based on the log-law fitting (hereafter, we refer to this method as “two-parameter fitting”). In the present study, we recalculate zo using a non-linear least square method based on the assumption that Hc is identical to d (hereafter one-parameter fitting). We optimize zo which satisfies the minimum of the sum of error ratio of mean wind speed E determined as follows:
(12)
(13)
(14)
(6)
(7)
(8)
(9)
(11)
(10)
Proceedings of Building Simulation 2011: 12th Conference of International Building Performance Simulation Association, Sydney, 14-16 November.
- 1689 -
( ),
ln
11
2
*
=
−κ
−
+−=
t
bi i
o
cii
Uz
HzuU
btE
where Ui is the measured wind speed at a height zi, and zb and zt are the lowest and highest levels for the mean wind measurement from the selected region between 1.5H to 7H, which are used for the determination of parameters. The details of the estimation procedure are similar to those described in Hagishima et al. (2009). The estimated Hc and zo normalized by a block height H are shown in Figure 7. The displacement heights presented by Hagishima et al. (2009) are plotted as a reference, and the previous work from Macdonald et al. (1998), Kanda et al. (2004), Cheng et al. (2007), and Leonardi and Castro (2010) are also shown for comparison. The estimated Hc/H values for staggered arrays and square arrays are significantly lower than d/H, except for the lowest packing density. This behavior is consistent with the results of cubical staggered array using LES reported by Leonardi and Castro (2010). A similar tendency is also found by Kanda et al. (2004) for square arrays and Cheng et al. (2007) for aligned and staggered arrays with various packing densities. However, the tendency of the curves of λp-Hc/H is slightly different from the well-known prediction by Macdonald et al. (1998), which exhibits a convex increase of d. Kanda et al. (2004) and Leonardi et al. (2003) reported that the center at which the form drag acts Hc does not coincide with the displacement height obtained by the two-parameter fitting method due to the existence of the recirculation regime within the canopy layer. In contrast, Leonardi and Castro (2008) supported Jackson’s theory and pointed out that the seeming discrepancy between Hc and d is caused by the fact that the von Karman coefficient is not universal, but varies with λp owing to flow characteristics around blocks. The zo/H values of the three arrays based on one-parameter fitting are slightly larger than the data derived by two-parameter fitting (Hagishima et al., 2009) when λp ≥ 31%. The results are consistent with the results of the staggered and aligned arrays for λp = 25% presented by Cheng et al. (2007). The discrepancy of zo/H for the staggered and diamond arrays between one-parameter and two-parameter fitting is relatively larger for λp = 7.7%. In contrast, the discrepancy of the two methods of staggered array for λp = 6.25% reported by Cheng et al. (2007) is extremely small. This result might be due to the shortage of our measurement points of wind speed to obtain a spatially-averaged profile under the condition of sparse density.
According to the statement by Leonardi and Castro (2010), not only the directly measured Hc, but also modification of von Karman’s coefficient results in a good low-law fitting. Considering the present result, for further experimental determination of zo of various types of arrays, it is necessary to improve the measurement method of mean wind distribution to obtain a more precisely spatially averaged profile.
CONCLUSION The spatial distributions of pressure drag acting on the walls of rectangular block arrays arranged in various layouts, roughness, and packing densities were directly measured using pressure-tapped cubes in a wind tunnel. Square, staggered, and diamond layouts were adopted for the experiment. We quantified the pressure drag contribution to the total surface drag by combining the present experiment and our previous experiment for drag balance measurement (Hagishima et al. 2009). The pressure-to-total drag ratio γ for the staggered arrays was almost unity when λp ≤ 39%. On the other hand, the square and diamond arrays with packing density λp ≥ 31% showed a contribution of approximately 20%−40% to the skin friction drag. Using the values of γ, we determined the relationship between the bulk pressure coefficient at 2H and 20H for the three arrays and estimated the values of λp as a database for the assessment of wind-induced ventilation in an urban building. Our results suggest that the staggered geometry is the most effective of all the layouts under the condition of low building coverage. A simple mathematical expression for Cp and λp was derived. The acquired knowledge on how building density reduces wind pressure of a building wall can be used for the estimation of wind-driven cross ventilation in a network airflow model embedded in building simulation codes by modifying a wind pressure of an isolated building. Subsequently, we derived the heights of a centroid of pressure drag, Hc, for each array and recalculated zo by assuming that Hc was identical to d. The slope of the Hc/H versus λp plots for the three arrays increased slightly when λp was less than 39.1%. Notably, this tendency was different from the convex increasing trend reported by Macdonald et al. (1998). The estimated Hc/H values for the staggered and square arrays were significantly lower than d/H, except for the lowest packing density; such a tendency is consistent with that observed in previous studies (Leonardi and Castro 2010 and Cheng et al. 2007). In addition, we compared the estimated Hc and zo with our previous data (Hagishima et al. 2009), which was based on the simultaneous log-law fitting of zo and d. Thus, the present results suggest that both the accurate measurement of spatially averaged wind profiles and the direct measurement of Hc are desirable for further experimental determination of the roughness length and displacement height of an array.
(15)
Proceedings of Building Simulation 2011: 12th Conference of International Building Performance Simulation Association, Sydney, 14-16 November.
- 1690 -
ACKNOWLEDGEMENT This research was financially supported by a Grant-in Aid for Scientific Research (22360238) from the Ministry of Education, Science and Culture of Japan.
REFERENCES Cheng, H., Hayden, P., Robins, A.G., Castro, I.P.
2007. Flow over cube arrays of different packing densities, Journal of Wind Engineering and Industrial Aerodynamics.
Chow, W.K. 2004. Wind-induced indoor-air flow in a high-rise building adjacent to a vertical wall, Applied energy.
Cochran, L.S. 1992. Wind-tunnel modelling of low-rise structures, PhD dissertion at Colorado State University.
Dagnew, A.K., Bitsuamlak, G.T. 2010. LES evaluation of wind pressure on a standard tall building with and without a neighbouring building, The Fifth International Symposium on Computational Wind Engineering.
Eaton, K.J., Mayne, J.R. 1975. The measurement of wind pressure on two storey houses at Aylesbury, Journal of Industrial Aerodynamics.
Endo, M., Bienkiewicz, B., Ham, H.J. 2006. Wind-tunnel investigation of point pressure on TTU test building, Journal of Wind Engineering and Industrial Aerodynamics.
ESDU 1980. Mean fluid forces and moments on rectangular prisms: surface-mounted structures in turbulent shear flow, Engineering Sciences Data Item Number 80003.
Evola, G., Popov, V. 2006. Computational analysis of wind driven natural ventilation in buildings, Energy and Buildings.
Hagishima, A., Tanimoto, J., Nagayama, K.., Meno, S. 2009. Aerodynamic parameters of regular arrays of rectangular blocks with various geometries, Boundary-Layer Meteorology.
Hansen, A.C., Cermak, J.E. 1975. Vortex-containing wakes of surface obstacles, Project THEMIS Technical Report No. 29, Civil Engineering, Department Colorado State University.
Iyengar, A.K.S., Farell, C. 2001. Experimental issues in atmospheric boundary layer simulations: roughness length and integral length scale determination, Journal of Wind Engineering and Industrial Aerodynamics.
Jackson, P.S. 1981. On the displacement height in the logarithmic velocity profile, Journal of Fluid Mechanics.
Jiang, Y., Chen, Q. 2002. Effect of fluctuating wind direction on cross natural ventilation in buildings from large eddy simulation, Building and Environment.
Jiang, Y., Chen, Q. 2003. Buoyancy-driven single-sided natural ventilation in buildings with large openings, International Journal of Heat and Mass Transfer.
Kanda, M., Moriwaki, R., Kasamatsu, F. 2004. Large eddy simulation of turbulent organized structure within and above explicitly resolved cube arrays, Boundary-Layer Meteorology.
Kanda, M., Moriizumi, T. 2009. Momentum and heat transfer over urban-like surfaces. Boundary-Layer Meteorology.
Katayama, T., Tsutsumi, J., Ishii, A. 1992. Full-scale measurements and wind tunnel tests on cross-ventilation, Journal of Wind Engineering and Industrial Aerodynamics.
Leonardi, S., Orlandi, P., Smalley, R.J., Djenidi, L., Antonia, R.A. 2003. Direct numerical simulations of turbulent channel flow with transverse square bars on one wall, J. Fluid Mech.
Leonardi, S., Castro, I.P. 2010. Channel flow over large cube roughness: a direct numerical simulation study, J. Fluid Mech.
Lim, H.C., Thomas, T.G., Castro, I.P. 2009. Flow around a cube in a turbulent boundary layer: LES and experiment, Journal of Wind Engineering and Industrial Aerodynamics.
MacDonald, R.W., Griffiths, R.F., Hall, D.J. 1998. An improved method for estimation of surface roughness of obstacle arrays, Atmospheric Environment.
MacDonald, R.W. 1999. Modelling the mean velocity profile in the urban canopy layer, Boundary-Layer Meteorology.
Meroney, R.N. 2009. CFD prediction of airflow in building for natural ventilation, 11th American Conference on Wind Engineering.
Nozawa, K., Tamura, T. 2002. Large eddy simulation of the flow around a low-rise building immersed in a rough-wall turbulent boundary layer, Journal of Wind Engineering and Industrial Aerodynamics.
Okada, H., Ha, Y.C 1991. Comparing of wind tunnel and full scale pressure measurement tests on the Texas Tech Building. Proceeding of the Eight International Conference on Wind Engineering.
Plate, E.J. 1982. Engineering Meteorology: Studies in wind engineering and industrial aerodynamics, vol 1, Elsevier Scientific Publishing Company, Amsterdam, New York
Salizzoni, P., Soulhac, L., Mejean, P., Perkins, R.J. 2008. Influence of a two-scale surface roughness on a neutral turbulent boundary layer. Boundary-Layer Meteorology.
Proceedings of Building Simulation 2011: 12th Conference of International Building Performance Simulation Association, Sydney, 14-16 November.
- 1691 -
Zaki, S.A., Hagishima, A., Tanimoto, J. 2011. Aerodynamic Parameters of Urban Building Arrays with Random Geometries, Boundary-Layer Meteorology.
Figure 1 Schematic of wind tunnel experimental set-
up (dimensions in mm).
Table 1 Roughness arrays
Arrays Layout Remarks ST1 Staggered Cubical arrays
(L × L × L) H = L, σ/H = 0
SQ1 Square
D1 Diamond Cubical 45° rotated arrays with staggered layout
H is the height of blocks, σ is the standard deviation of the height of blocks, and L is the width of all the blocks (L = 25 mm)
Figure 3 Pressure tapping distribution on cube.
Figure 4 Pressure coefficient distribution on cubes
with various layouts and packing densities.
Figure 5 Ratio of form drag to total drag acting on
floating elements γ with staggered, square, and diamond arrays for different λp. For comparison, the results for the staggered, ST1 (Cheng), and aligned,
AL1 (Cheng), cubical arrays that were estimated based on the wind tunnel experiment performed by
Cheng et al. (2007) are shown.
Airflow
ST1
SQ1 D1
Figure 2 Schematic of roughness elements. The characterization of each array refers to Table 1.
Proceedings of Building Simulation 2011: 12th Conference of International Building Performance Simulation Association, Sydney, 14-16 November.
- 1692 -
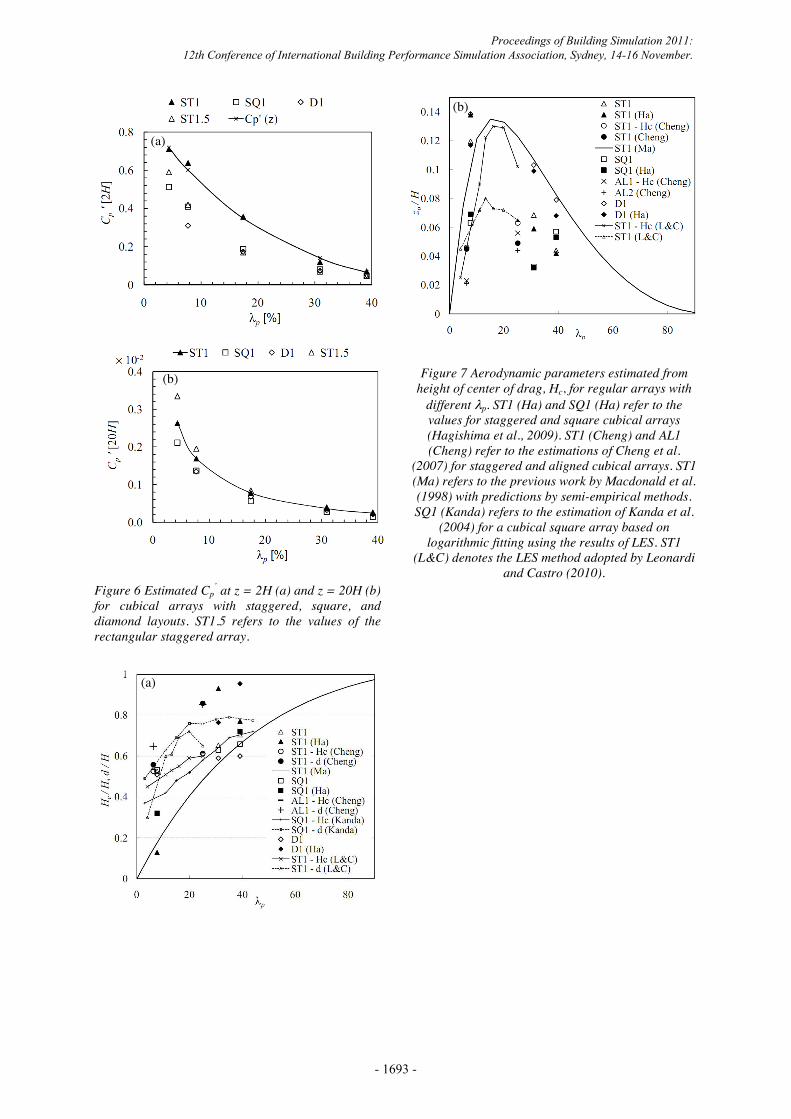
Figure 6 Estimated Cp
’ at z = 2H (a) and z = 20H (b) for cubical arrays with staggered, square, and diamond layouts. ST1.5 refers to the values of the rectangular staggered array.
Figure 7 Aerodynamic parameters estimated from height of center of drag, Hc, for regular arrays with
different λp. ST1 (Ha) and SQ1 (Ha) refer to the values for staggered and square cubical arrays (Hagishima et al., 2009). ST1 (Cheng) and AL1 (Cheng) refer to the estimations of Cheng et al.
(2007) for staggered and aligned cubical arrays. ST1 (Ma) refers to the previous work by Macdonald et al. (1998) with predictions by semi-empirical methods. SQ1 (Kanda) refers to the estimation of Kanda et al.
(2004) for a cubical square array based on logarithmic fitting using the results of LES. ST1
(L&C) denotes the LES method adopted by Leonardi and Castro (2010).
(a)
(a)
(b)
(b)
Proceedings of Building Simulation 2011: 12th Conference of International Building Performance Simulation Association, Sydney, 14-16 November.
- 1693 -