presentation for the prime - … · building sector energy efficiency project (bseep) ) c/o...
TRANSCRIPT

BUILDING SECTOR ENERGY EFFICIENCY PROJECT (BSEEP) )
C/O CAWANGAN ALAM SEKITAR DAN TENAGA (ENVIRONMENT AND ENERGY BRANCH )
IBU PEJABAT JKR MALAYSIA ( P.W.D. HEAD QUARTERS MALAYSIA)
TKT. 23, MENARA PJD NO. 50, JALAN TUN RAZAK 50400 KUALA LUMPUR
Telefon : (603) 4041 1924 Faksimili : (603)4041 1988 http://www.jkr.gov.my/bseep/
PRESENTATION FOR THE PRIME
MINISTER’S
GREEN TECH AND CLIMATE CHANGE
COUNCIL MEETING
REALISING THE 3 KEY BENEFITS
OF ENERGY EFFICIENT BUILDINGS
Prepared by the
Building Sector Energy Efficiency Project (BSEEP), JKR.
Preliminary draft, 14 July 2014; updates 20 July, 1 August 2014
Not for circulation – still in draft form with requested changes still in the
process of being made
2 | P a g e E n e r g y E f f i c i e n c y i n B u i l d i n g s
OVERVIEW
The purpose of this paper is to present building sector energy efficiency
policies for inclusion in RMK11 and beyond, demonstrating their
financial, environmental and social benefits.
Building sector electricity consumption is growing at an increasing rate,
faster than GDP growth.
This trend of ever increasing consumption can be halted with energy
efficiency (EE) – using less energy to provide the same outcome.
Energy efficiency provides three key benefits: Economic, Environmental
and Social.
However, to realise these benefits government intervention is required to
overcome a range of barriers.
The barriers to building sector EE include:
A widely disconnected market between developers and occupants
of buildings
Low awareness of the value of energy efficiency
Fragmented and weak institutional setups
Gaps in regulation and enforcement
Lack of data on building energy use.
Addressing these barriers involves enabling the market, creating a
stable financing mechanism, incentivising the market, having

3 | P a g e E n e r g y E f f i c i e n c y i n B u i l d i n g s
government lead by example, undertaking institutional transformation
and monitoring and evaluation.
Government investment of around RM 1.5b over RMK11 can reduce
building sector GHG emissions by 3%. However a longer term
commitment to building sector EE can deliver much larger savings, of
34% by 2035, reducing carbon emissions by 274m tonnes and providing
RM87b of net financial benefit with 15,000 people employed.
This document is divided into three sections:
1. An executive summary providing an overview of energy
consumption trends in the building sector, the barriers preventing
buildings from becoming more efficient, and a suggested approach
for government to overcome these barriers in order to unlock the
substantial economic, environmental and social benefit of EE;
2. An introduction that expands on the barriers to EE in Malaysia and
the suggested strategy, and introduces research and assessment
of twelve mechanisms/approaches/ enablers that can drive energy
efficiency;
3. The detailed research and assessment of the twelve
mechanisms/approaches/ enablers.
Bruce Rowse, Kevin Hor
Building Sector Energy Efficiency Project.

4 | P a g e E n e r g y E f f i c i e n c y i n B u i l d i n g s
CONTENTS
EXECUTIVE SUMMARY ........................................................................ 9
Objectives ............................................................................................................ 9
Background ......................................................................................................... 9
Basis of consideration ........................................................................................ 11
Implications ........................................................................................................ 17
Conclusion ......................................................................................................... 23
Acknowledgements ............................................................................................ 25
Acronyms ........................................................................................................... 27
Disclaimer .......................................................................................................... 30
INTRODUCTION .................................................................................. 31
BSEEP ............................................................................................................... 31
What is covered in this document ...................................................................... 32
Why reduce building sector energy use? ........................................................... 33
Benefits of EE in the building sector not yet being realised. .............................. 34
Suggested strategies for building sector EE ...................................................... 45
Comparison of policies ...................................................................................... 57
Expected results ................................................................................................ 58
5 | P a g e E n e r g y E f f i c i e n c y i n B u i l d i n g s
DISCUSSION PAPERS ON EACH OF THE POLICY TOPICS ............ 62
Utility driven energy efficiency / Utility Energy Efficiency Obligation (White
Certificate scheme) ............................................................................................... 63
Summary ........................................................................................................... 63
Utility driven energy efficiency ........................................................................... 66
What is a utility energy efficiency obligation? .................................................... 69
Where energy efficiency schemes are used ...................................................... 71
What sort of activities are undertaken to generate savings from UEEOs? ........ 73
How UEEOs work .............................................................................................. 75
Plus, minus, interesting of UEEO ....................................................................... 79
Designing a UEEO ............................................................................................. 85
Applicability to Malaysia ..................................................................................... 86
Appliance and Equipment Standards & Labelling ............................................... 117
Summary ......................................................................................................... 117
Purpose of this document ................................................................................ 118
Standards and Labelling in Malaysia ............................................................... 119
Global and regional experience with MEPS ..................................................... 120
Suggestions for Malaysia ................................................................................. 125
Synergies with other policy measures ............................................................. 137
Building performance disclosure ......................................................................... 139

6 | P a g e E n e r g y E f f i c i e n c y i n B u i l d i n g s
Summary ......................................................................................................... 139
What is building performance disclosure? ....................................................... 140
Why disclose building performance? ............................................................... 144
Global experience with building performance disclosure ................................. 145
Suggestions for Malaysia ................................................................................. 164
Energy Efficiency Rating Tools for Buildings....................................................... 178
Summary ......................................................................................................... 178
What are building energy efficiency rating tools?............................................. 179
An asset rating or an operational rating tool? .................................................. 181
International experience with rating tools ......................................................... 183
Factors important to energy efficiency building disclosure tool selection ......... 190
Suggestions for Malaysia ................................................................................. 190
National Building Consumption Database ........................................................... 194
Summary ......................................................................................................... 194
Why a National Building Energy Consumption Database? .............................. 196
A suggested NBECD for Malaysia ................................................................... 197
Author’s personal experience .......................................................................... 202
Synergies with other policy measures ............................................................. 203
Energy Efficiency Codes for Buildings ................................................................ 204
Summary ......................................................................................................... 204

7 | P a g e E n e r g y E f f i c i e n c y i n B u i l d i n g s
Current Building Energy Efficiency Codes and practice in Malaysia ................ 205
The importance of Building Energy Efficiency Codes to energy security and
reducing energy consumption. ......................................................................... 210
Global experience with Building Energy Efficiency Standards ......................... 214
Suggested pathway for EE building standards going forward in Malaysia. ...... 221
Synergies with other policy measures ............................................................. 227
Energy efficient technologies / construction methods for new buildings ............. 229
Summary ......................................................................................................... 229
International experience .................................................................................. 230
Key success factors ......................................................................................... 231
What should the focus be on? ......................................................................... 233
Suggested policy pathway ............................................................................... 239
Energy Performance Requirements for Government Buildings........................... 242
Summary ......................................................................................................... 242
Energy performance requirements for government buildings .......................... 244
International experience .................................................................................. 245
Malaysian experience ...................................................................................... 249
Suggestions for Malaysia ................................................................................. 250
Synergies with other policy measures ............................................................. 255
Enabling ESCO delivered projects ...................................................................... 256

8 | P a g e E n e r g y E f f i c i e n c y i n B u i l d i n g s
Summary ......................................................................................................... 256
ESCOs – limited by a funding constraint? ....................................................... 257
Suggested approach in Malaysia ..................................................................... 265
Synergies with other policy measures ............................................................. 267
Housing mortgages that enable EE .................................................................... 268
Summary ......................................................................................................... 268
The International Experience ........................................................................... 269
Suitability to Malaysia ...................................................................................... 280
Synergies with other policy measures ............................................................. 290
Capacity building for EE in Buildings .................................................................. 291
Summary ......................................................................................................... 291
Capacity building ............................................................................................. 292
International experience in systematic capacity building ................................. 296
Suggestions for Malaysia ................................................................................. 299
Incentives for EE in Buildings.............................................................................. 303
Summary ......................................................................................................... 303
Why incentives? ............................................................................................... 304
Types of incentives .......................................................................................... 311
Malaysian experience with incentives .............................................................. 315
Suggestions for Malaysia going forward .......................................................... 319

9 | P a g e E n e r g y E f f i c i e n c y i n B u i l d i n g s
EXECUTIVE SUMMARY
OBJECTIVES
The purpose of this paper is to present building sector energy efficiency
policies for inclusion in RMK11 and beyond, demonstrating their
financial, environmental and social benefits.
BACKGROUND
The vast majority of buildings in Malaysia are energy inefficient. They
are uncomfortably hot and humid unless air conditioning is used, and the
lighting is inefficient.
As living standards and comfort expectations rise in Malaysia, energy
use per building is increasing. The rapid construction rate – at current
rates of growth in 2031 Malaysia will have twice the number of electricity
consumers that is now has in 2014 – is also causing building sector
consumption to rise.
The building sector accounts for 54% of Malaysia’s electricity use.
Building sector electricity consumption is growing faster than industrial
electricity consumption, and at current growth rates by 2020 buildings
will use 50% more electricity than they did in 2012. Carbon emissions
and coal imports will increase accordingly.

10 | P a g e E n e r g y E f f i c i e n c y i n B u i l d i n g s
This trend of ever increasing consumption can be halted with energy
efficiency (EE) – using less energy to provide the same outcome. For
example using less energy to illuminate a workspace. Energy efficiency
provides three key benefits:
1. Economic benefits. These benefits can be very high. For
example, investing RM 1 million to make a building more efficient
can yield up to RM 15 million in lifetime energy savings. Over the
20 years from 2016 to 2035, RM 34 b of government investment in
building sector EE could yield RM 174 b in energy savings across
Malaysia. It costs less to save 1 GWh than it takes to generate 1
GWh of electricity. Which is why globally there is a shift to make
energy efficiency the “first fuel”.
2. Environmental benefits. The building sector represents around
15% of Malaysia’s greenhouse gas (GHG) emissions. 274 million
tonnes of GHG could be saved by 2035 with the investment
outlined above, reducing building sector emissions by one third
compared with Business as Usual (BAU).
3. Social benefits. Investments in energy efficiency are labour
intensive and geographically dispersed. Roughly 5 times as many
jobs are created in EE than when the same amount of money is
invested in building and operating fossil fuel power plants. 15,000
jobs could be created by 2025 with the investment in building
sector EE outlined above. EE creates jobs and builds skills for the
growing global green economy.

11 | P a g e E n e r g y E f f i c i e n c y i n B u i l d i n g s
Whilst energy efficiency (EE) is economically, environmentally and
socially more beneficial than building more power plants, government
intervention is required to address the barriers to EE and create a
market for EE.
The barriers to building sector EE include a widely disconnected market
between developers and occupants of buildings, low awareness of the
value of energy efficiency, fragmented and weak institutional setups,
gaps in regulation and enforcement and lack of data on building energy
use.
Addressing these barriers involves enabling and incentivising the
market, creating a stable financing mechanism, having government lead
by example, strengthening institutions, and monitoring and evaluation.
BASIS OF CONSIDERATION
Trends in building sector energy consumption
Building sector electricity consumption is increasing at a rapid rate. As
figure 1 shows, electricity consumption in Malaysian buildings has grown
at an increasing rate in a highly predictable manner since 1990.
If this trend was continued to 2020, building sector electricity
consumption will be 50% higher than in 2012.
Furthermore building sector electricity consumption has grown at a faster
rate than GDP (constant prices). In 2012 building sector electricity
consumption intensity was 49% higher per unit of GDP than in 1997.

12 | P a g e E n e r g y E f f i c i e n c y i n B u i l d i n g s
Figure 1 - Trendline of building sector electricity consumption projected forward to 2020. Based on
Energy Commission (EC) for Malaysia on the Malaysian Energy Information Hub, in accordance with the
following categories: Agricultural, Transport, Commercial, Residential (Domestic) and Industrial, with
Commercial and Residential assumed to represent building sector electricity consumption. GDP is based
on data published by the Malaysian department of statistics, with a reference of the year 2000 = 100.
Energy efficiency can break this trend and provide other benefits. It is
possible to have GDP growth without ever increasing energy use. In the
UK between 2000 and 2012 GDP grew by 58%, yet energy use dropped
by 12%. In Australia electricity consumption in the National Electricity
Market has dropped 8% since 2008/09, yet GDP has continued to grow.
y = 47,134 x2 + 1,298,117 x + 8,545,154 R² = 1
-
100,000
200,000
300,000
400,000
500,000
600,000
700,000
800,000
900,000
1,000,000
-
10,000,000
20,000,000
30,000,000
40,000,000
50,000,000
60,000,000
70,000,000
80,000,000
90,000,000
100,000,000
19
90
19
91
19
92
19
93
19
94
19
95
19
96
19
97
19
98
19
99
20
00
20
01
20
02
20
03
20
04
20
05
20
06
20
07
20
08
20
09
20
10
20
11
20
12
20
13
20
14
20
15
20
16
20
17
20
18
20
19
20
20
GD
P (
con
stan
t p
rice
s, R
M m
illio
n)
Co
nsu
mp
tio
n (
MW
h)
Building Sector Electricity Consumption (projected to 2020), GDP (constant prices) to 2012
Electricity Consumption (MWh) GDP at constant prices (RM, reference 2000 = 100)

13 | P a g e E n e r g y E f f i c i e n c y i n B u i l d i n g s
Belarus, whose GDP and GDP growth matches Malaysia’s, reduced its
energy intensity per unit of GDP by two-thirds between 1990 and 2010.
The benefits of EE in the building sector
Broadly speaking it costs much less to save one megawatt-hour (MWh)
of electricity than it does to purchase one MWh of electricity. BSEEPs
modelling indicates that energy efficiency can cost effectively deliver
large savings at a cost of roughly RM 0.15/kWh, far lower than the RM
0.30/kWh required to generate electricity from fossil fuels. To meet the
growth in electricity demand it is cheaper to invest in energy efficiency at
the point where energy is used – in buildings – rather than investing in
new power plants, transmission and distribution infrastructure. Treating
energy efficiency as the first fuel – as California has done since the
1970s – provides wide ranging economic, environmental and social
benefits.
The most cost effective time to undertake energy efficiency in a building
is at the design stage, and with strong rates of construction, Malaysia
has the opportunity to deliver savings at lower costs than in developed
countries where retrofits form the backbone of energy efficiency policy.
Malaysia has had an active green building community since 2007,
focussed on reducing the energy consumption of new buildings. Based
on data estimates for the first 50 green certified buildings provided by
the Malaysian Green Building Index (GBI), BSEEP calculates that every
ringgit invested in making a building more efficient reduces electricity
consumption by RM 0.30 per year. Over a 50 year building lifetime this
results in a total return of RM 15.

14 | P a g e E n e r g y E f f i c i e n c y i n B u i l d i n g s
However for existing buildings there is also opportunity to cost effectively
improve the performance buildings. This is particularly the case at the
time of refurbishment, which typically happens every 15 to 20 years.
Upgrading to the most efficient lighting or air conditioning has a lower
lifetime cost than purchasing a cheaper less efficient system.
Malaysia’s electricity supply has over recent years moved to greater
dependency on imported coal. As a result the greenhouse gas
emissions factor – the amount of greenhouse gas produced for each
MWh of electricity generated – has increased.
Energy efficiency reduces carbon emissions, a key environmental
benefit.
Energy efficiency is labour intensive, unlike electricity production which
is fuel intensive. As a result more jobs are created when investment is
made in energy efficiency than when it is invested in generation.
There are, however, a range of barriers that require government
intervention in order to capture the benefits of EE. These barriers have
not yet been effectively addressed in Malaysia, with the consequence of
ever increasing electricity consumption as shown in figure 1.
The barriers to EE.
The barriers to EE in Malaysia include:
A widely disconnected market between developers and occupants
of buildings. Developers do not benefit financially from buildings
that use less energy (occupants do), yet developers are required

15 | P a g e E n e r g y E f f i c i e n c y i n B u i l d i n g s
to make the upfront investment to enable these savings. With the
exception of high-end new buildings (where rating systems such
as the Green Building Index add prestige), there is a lack of a
marketplace driving demand for EE buildings.
Low awareness of the value of energy efficiency
Energy efficiency is generally not factored into purchase decisions.
And often information on the benefit of EE is not available at the
point of purchase.
The benefit of energy efficiency as an investment is not
understood. Energy efficiency provides a good ROI, however it is
not often perceived as an investment opportunity.
Fragmented and weak institutional setups
Jurisdiction issues, for example between the Energy Commission
(EC) and the Sustainable Energy Development Authority (SEDA),
both of which have energy efficiency programs that appear to
overlap. E.g. SEDA implemented the SAVE program which
incentivised consumers to refer to appliance energy efficiency
labels in their purchase decisions, but ST administers the
appliance standards and labelling program.
Lack of a clearly visible champion strongly promoting EE.
Lack of coordination between different institutions.
Human resources capacity issues. For example only 2 people are
employed to administer the appliance energy standards and
labelling program, an insufficient number to adequately enforce
the program. Whilst these regulations were introduced in May

16 | P a g e E n e r g y E f f i c i e n c y i n B u i l d i n g s
2013 – and require domestic refrigerators, televisions, fans and air
conditioners to display an energy label and meet Minimum Energy
Performance Standards (MEPS), there is still low compliance with
the program. Yet a 5% non-compliance rate in any one year costs
energy users an additional estimated RM 24m in electricity
charges over the lifetime of those non-compliant products!
Gaps in regulation and enforcement. For example:
- Only one state has gazetted the Uniform Building By Laws
2012 which incorporate requirements from MS 1525: Code of
Practice on Energy Efficiency and Use of Renewable Energy
for Non-Residential Buildings
- No regulation exists around the public disclosure of building
performance.
- Insufficient penalties to enable full compliance with the
Efficient Management of Electrical Energy Regulations
(EMEER)
- As described above low compliance with the Standards and
Labelling requirements for domestic appliances.
Lack of data on building energy use. Data on building energy
consumption is not collected, reported, analysed or shared in a way that
can drive voluntary energy efficiency or enable the measurement,
verification and evaluation of EE interventions.

17 | P a g e E n e r g y E f f i c i e n c y i n B u i l d i n g s
IMPLICATIONS
Until such point as these barriers are addressed, it is likely that electricity
consumption in buildings will continue to increase at an accelerating
rate, as shown in figure 1.
The recommended strategy to address these barriers includes six
elements. These are: enable the market, create a stable financing
mechanism, incentivise the market, have government lead by example,
strengthen institutions, and monitor and evaluate.
Enabling the market:
The Uniform Building By Laws, 2012, which incorporate energy
efficiency provisions from MS 1525, need to be gazetted by the
majority of states and municipalities in Malaysia.
Energy usage and the opportunity provided by energy efficiency
needs to become more visible through the mandatory disclosure of
energy building performance. To enable this
- An energy efficiency rating tool for existing buildings which
covers a range of building types needs to be available.
- A National Building Energy Consumption Database (NBECD)
needs to be developed.
Awareness should be raised through Appliance and Equipment
Standards and Labelling (S&L) and expansion of the S&L program
to cover commercial equipment, notably chillers and commercial
air-conditioners.

18 | P a g e E n e r g y E f f i c i e n c y i n B u i l d i n g s
Subsidies on electricity prices should be totally removed.
Create a stable financing mechanism
To provide funding to government to effectively resource and
administer energy efficiency programs, and to incentivise energy
efficiency an additional tariff charge on electricity bills should
apply.
Create a revolving fund for large energy users to access ESCO
delivered project.
Incentivise the market
As mandatory disclosure is introduced incentives can be used to
drive early compliance.
Longer term incentives can be used to motivate the adoption of
very high efficiency technologies.
Ultimately market based incentives using methods which clearly
enable energy savings to be determined, should be used. When
energy savings can be clearly quantified, incentives can be
created (and funded) based on the “negawatts” saved, which can
be priced to compete with generated megawatts. The aim should
be to move to these market based methods (used in Europe,
North and South America and Australia) by the 12th Malaysia
plan. A Utility Energy Efficiency Obligation or dedicated Energy
Efficiency Generator could be established to enable this.
19 | P a g e E n e r g y E f f i c i e n c y i n B u i l d i n g s
Have government lead by example
Government ministries should be required to adhere to energy
performance requirements for their buildings.
Mechanisms should be in place to enable ESCOS to deliver EE to
government
Government should adopt green procurement principles.
Strengthen Institutions
Define champion and supporting stakeholders
Greatly increase resourcing for the administration of EE programs
Enhance capacity including cooperation with the private sector
Monitor and Evaluate.
The following should be monitored and evaluated:
Compliance with MS1525
The disclosure of building energy consumption (enabled through
analysis of data in the National Building Energy Consumption
Database)
Monitor compliance with Standards and labelling
Monitor the impact and effectiveness of incentives
Improve the monitoring of how well government is leading by
example (i.e. PEMANDU)

20 | P a g e E n e r g y E f f i c i e n c y i n B u i l d i n g s
Input the results of monitoring and evaluation into the Malaysian
Sustainable Consumption and Production Indicators (MYSCPI) – a
comprehensive SCP monitoring system
Cutting across these six strategic interventions is the establishment of a
Malaysian Training Centre for Energy and Water Efficiency and a Green
Building Council with government representation.
Adopting this approach, table 1 below provides estimates of costs and
benefits over the next four Malaysian plans, covering the period from
2016 to 2035. Benefits accrue over time, reflecting the fact that energy
efficiency requires up-front investment to deliver long term savings.
Table 1 Estimated economics of suggested energy efficiency policies, RM11 to
RMK14 (2016 to 2035)
Period
Revenue
raised
from tariff
charge
(RM m)
Total
government
investment in
incentives and
tax benefits
(RM m)
Net financial
benefit to the
Malaysian
economy (RM
m)
No of
people
employed
GHG
savings
(m
tonnes)
vs BAU
Reduction in
electricity
consumption
vs BAU
RMK 11 1,000 1,500 - 1,600 2,600 5 3%
RMK 12 6,100 6,600 2,900 10,200 30 13%
RMK 13 12,400 12,400 24,200 14,600 90 25%
RMK 14 13,800 13,800 62,200 14,700 150 34%
TOTAL 33,400 34,300 87,700 14,700 270 34%

21 | P a g e E n e r g y E f f i c i e n c y i n B u i l d i n g s
It’s broadly estimated that the policies identified could, over the period of
the 11th Malaysian plan, reduce building sector electricity consumption
by 3 % compared with BAU by 2020. By 2035 the continuation of these
policies could reduce building sector electricity consumption by 34% vs
BAU.
Low savings in RMK11 and growing savings in subsequent years reflect
the fact that building sector EE is an investment with yields that go up
the longer it is done for. EE is not a “no-cost/near zero cost” way of
delivering GHG abatement; this misguided perception that EE can
deliver savings for free is a key reason for policy failings in the EE sector
around the world. Well managed EE delivers excellent returns, but does
require substantial up-front investment.
Investment funding should come from revenue raised from an additional
tariff charge – a stable mechanism that can deliver large amounts of
investment funding. Whilst it is envisaged that this will be mostly used to
fund a Utility Energy Efficiency Obligation (UEEO) or similar, funds
raised will also be allocated to fund the administration of a range of EE
policies, including measurement, verification and evaluation (MV&E).
This additional tariff would start 2018 with an additional tariff of RM
0.2sen/kWh, which rises to 0.3sen/kWh and RM 0.4sen/kWh in 2019
and 2020. It continues to rise gradually through to 2028, at which point it
is RM 2 sen/kWh, and remains at this level. This additional charge would

22 | P a g e E n e r g y E f f i c i e n c y i n B u i l d i n g s
not apply to low income households on the lowest tariff, who are
estimated to consume no more than 20% of Malaysia’s total electricity
consumption. Over the 11th Malaysian plan it would raise nearly RM
1,000m. By 2035 nearly RM 33b could be raised for investment in EE.
The tariff charge could be enabled in the first instance by linking it to the
subsidy rationalisation program.
Further funding for energy efficiency will come in the form of governmet
revenue foregone over the period 2016 to 2025, from tax exemptions for
energy efficient new buildings.
Responsibility matrix
Suggested responsibilities for implementation of the strategy are tabled
below.

23 | P a g e E n e r g y E f f i c i e n c y i n B u i l d i n g s
Table 2 - Suggested responsibility matrix
Strategy Approach
Respons-
ibility
Staffing
(RMK 11)
Enable the market
(regulation)
Support the gazetting and application of EE building
codes and standards across Malaysia KPKT 2
Require Mandatory disclosure of building performance ST 16
Strengthen and expand the appliance and equipment EE
Standards and Labelling program ST 9
Create a stable
financing
mechanism Impose a tariff charge ST
19
Incentivise the
market
Create a Utility Energy Efficiency Obligation (UEEO),
making EE the first fuel ST
Have government
lead by example
Require all Ministries to develop and implement an
Energy Management Plan in line with ISO 50001,
including the use of Energy Performance Contracts JKR
7, plus 1 in
each of the
24 ministries
Strengthen
Institutions
Establish an Energy and Water Efficiency training centre MoE 4
Establish a coordination unit and monitor and report
annually ST 5
Monitor and
evaluate
TOTAL 96
CONCLUSION
Building sector electricity consumption is growing rapidly in Malaysia,
faster than growth in GDP. This trend can be broken by investing in
energy efficiency. Energy efficiency provides economic, environmental

24 | P a g e E n e r g y E f f i c i e n c y i n B u i l d i n g s
and social benefits, however to realise the benefit a range of barriers
need to be overcome.
Addressing these barriers involves enabling the market, creating a
stable financing mechanism, incentivising the market, having
government lead by example, undertaking institutional transformation
and monitoring and evaluation.
Government investment of around RM 1.45b over RMK11 can reduce
building sector GHG emissions by 3%. However a longer term
commitment to building sector EE can deliver much larger savings, of
34% by 2035, and providing RM87b of net financial benefit with 15,000
people employed, and saving 274 m tonnes of GHG.
Bruce Rowse, Kevin Hor
Building Sector Energy Efficiency Project.

25 | P a g e E n e r g y E f f i c i e n c y i n B u i l d i n g s
ACKNOWLEDGEMENTS
The policy papers prepared by the Building Sector Energy Efficiency
Project (BSEEP) and which are presented in this paper is the result of
consultation via workshops and individual discussion with a wide range
of people. This suggestions and ideas of the following individuals is
gratefully acknowledged:
YBhg. Dato’ Ir. Dr.
Roslan Md Taha
Pengarah (National
Project Director)
CAST JKR
YBhg. Datin Noor
Haliza Mohd Noor
Director EPU
Ir. Mohd Zaini Bin Abu
Hassan
Superintendent Electrical
Engineer
CKE JKR
Ir. Hj. Baihaki Bin
Azraee
Electrical Engineer CKE JKR
Mahira Bt Othman Assistant Secretary KKR
Mohd Sukri Mat Jusoh Deputy Director EPU
Safwan Rosidy b.
Mohammad
Principal Assistant
Director
EPU
Dr. Gerhard Weihs Team Coach SCP EPU
Dr. Khalid Bid Abdul
Hamid
Deputy Secretary, Fiscal
& Economic Division
MoF
Dr. Noraisah Binti
Spahat
Section Head, Fiscal &
Economic Division
MoF

26 | P a g e E n e r g y E f f i c i e n c y i n B u i l d i n g s
Khoh Joo Bee Deputy Secretary KPKT
Aminah Abd Rahman Director KPKT
Ir. Francis Xavier Jacob Senior Analyst ST
Ir. Zulkiflee Umar Head, Demand Side
Management (DSM)
ST
Norazrin B. Rupadi Executive, DSM ST
Omar Farouk bin Ali
Askar
Executive, DSM ST
Hafiza binti Yob Regulatory Officer, DSM ST
Steve Anthony Lojuntin Deputy Director SEDA
Mohd Najmi b.
Abdullah Sani
Assistant Director SEDA
Muhammed Fendi
Mustafa
Senior Analyst, Built
Environment
GreenTech
Malaysia
Ir. Sharifah Jusoh Head, Electrical and
Electronic 2 Section
SIRIM
Mohd Fairuz bin
Zainordin
Senior Testing Executive SIRIM
Roswaidin Mohd Zain Deputy Director MIDA
Ar. Zulkhairi Md. Zain Architect PAM
Azliza Abd. Shukor Assistant Vice President IRDA
Ar. Zulkifli Zahari President MAESCO

27 | P a g e E n e r g y E f f i c i e n c y i n B u i l d i n g s
Ir. Chen Thiam Leong ACEM Past
President/GBIAP
ACEM/GBI
Ir. H.P Looi Past President MGBC
B.K. Sinha Co-Chair, Research
Committee
MGBC
Raja Nor Laila Raja
Jaapar
Senior Project Officer MGBC
James Chua Executive Director GreenRE
Chin Bung Seang Technical Manager GreenRE
Stanley Kok General Manager PPK
Ir. Dr. Cheong Thiam
Fook
Director IEM
CK Tang Director VESB
Deep Kumar Project Executive BSEEP
Muhammad Hafiz
Azizan
Component 1 Consultant BSEEP
ACRONYMS
AC Air conditioner
ACEM Association of Consulting Engineers Malaysia
BAU Business as usual

28 | P a g e E n e r g y E f f i c i e n c y i n B u i l d i n g s
BSEEP Building Sector Energy Efficiency Project
EC Energy Commission (malay: Suruhanjaya Tenaga)
EE Energy Efficiency
EMEER Efficient Management of Electrical Energy Regulations
EPU Economic Planning Unit
ESCO Energy Services Contractor
GBI Malaysian Green Building Index
GDP Gross Domestic Product
GEF Global Environment Facility
GHG Greenhouse Gas
GWh gigawatt hour
JKR Department of Public Works
KeTTHA Ministry of Energy, Green Technology and Water
KKR Ministery of Housing
KPKT Ministry of Housing and Local Government
kW kilowatt
kWh kilowatt hour
M&V Measurement and Verification
MAESCO Malaysian Association of Energy Services Contractors
MEPS Minimum Energy Performance Standards
MGBC Malaysian Green Building Confederation

29 | P a g e E n e r g y E f f i c i e n c y i n B u i l d i n g s
MoE Ministry of Education
MoF Ministry of Finance
MWh megawatt hour
NBECD National Building Energy Consumption Database
PV Photovoltaic
RMK11 11th Malaysian Plan
S&L Standards and Labelling
SCP Sustainable Consumption and Production
SEDA Sustainable Energy Development Authority
ST Suruhanjaya Tenaga (english: Energy Commission)
UBBL Uniform Building By Laws
UNDP United Nations Development Program

30 | P a g e E n e r g y E f f i c i e n c y i n B u i l d i n g s
DISCLAIMER
The contents of this draft paper are the responsibility of the authors and
do not necessarily reflect the views of the Malaysian government, UNDP
or GEF.
We apologize for any mistakes, omissions and existing gaps in this
document. Your feedback is invited to improve the paper.
Reasonable effort has been made to base the ideas and modelling in
this report on factual evidence and reasonable assumptions, however it
should be born in mind that the authors may have erred, and disclaim
any legal liability.

31 | P a g e E n e r g y E f f i c i e n c y i n B u i l d i n g s
INTRODUCTION
BSEEP
The Building Sector Energy Efficiency Project (BSEEP), with financial
support of Global Environment Facility (GEF) / UNDP, and implemented
through JKR (Public Works Department), aims to reduce emissions of
GHG growth through the continued and further adaptation of energy
efficiency in new and existing buildings. https://www.jkr.gov.my/bseep/
Component 2 of the BSEEP project aims to contribute to the adoption of
policies that are effective in making a significant contribution to reducing
the energy use of buildings in Malaysia.
This discussion paper is a result of BSEEPs research into a wide range
of policy topics raised by stakeholders, and summarises and presents
the findings from this research.
The research approach has been to examine the application of the
suggested policies internationally, and to then put forward suggestions
for application in Malaysia.
The following topics have been examined by BSEEP
1. A Utility Energy Efficiency Obligation (UEEO)
2. Appliance and Equipment Standards and Labelling (S&L)
3. Disclosure of Building Performance
4. Energy efficiency building rating tools

32 | P a g e E n e r g y E f f i c i e n c y i n B u i l d i n g s
5. A National Building Energy Consumption Database (NBECD)
6. Energy efficiency codes and standards for buildings
7. Energy efficient technologies / construction methods for new
buildings.
8. Energy performance standards for government buildings.
9. Enabling Energy Services Contractors
10. Mortgages to enable EE
11. Capacity building in EE
12. Incentives for EE
WHAT IS COVERED IN THIS DOCUMENT
This document is divided into three sections:
1. An executive summary providing an overview of energy
consumption trends in the building sector, the barriers preventing
buildings from becoming more efficient, and a suggested approach
for government to overcome these barriers in order to unlock the
substantial economic, environmental and social benefit of EE;
2. An introduction that expands on the barriers to EE in Malaysia and
the suggested strategy, and introduces research and assessment
of twelve mechanisms/approaches/ enablers that can drive energy
efficiency;
3. The detailed research and assessment of the twelve
mechanisms/approaches/ enablers.

33 | P a g e E n e r g y E f f i c i e n c y i n B u i l d i n g s
Accompanying this document is a spreadsheet model, which contains
calculations and assumptions supporting the estimates of costs and
benefits.
WHY REDUCE BUILDING SECTOR ENERGY USE?
Reducing building sector electricity consumption will:
Improve energy security and reduce dependence on imported
fuels, such as coal. EE can deliver cost-effective generation of
“nega-watts” cheaper than the cost of building and operating a
coal fired power station and create more long term jobs.
Reduce greenhouse gas emissions. Malaysia has made a
voluntary commitment to decrease GHG intensity by 40%
compared with BAU by 2020.
Reduce the budgetary impact of subsidies. Malaysia’s natural gas
generates more revenue on the international market than it does
when used for domestic electricity generation, and the government
pays the difference through subsidies. Reducing energy use
reduces the cost of subsidies.
Reduce costs for electricity users. Reduced costs for domestic
users can enhance quality of life. For commercial users it can
improve profitability.
Improve Malaysia’s competitiveness internationally. Many
countries are investing heavily in energy efficiency. In the long run

34 | P a g e E n e r g y E f f i c i e n c y i n B u i l d i n g s
this improves their international competitiveness. Failure to invest
in EE could reduce Malaysia’s international competitiveness.
Create jobs. Around five more jobs are created in EE than in
energy generation per million dollars invested.1
By 2035 building sector EE has the potential to reduce electricity
consumption by 34% compared with BAU, creating 15,000 jobs and
reducing GHG emissions by 270 million tonnes. And rather than cost
money, the net economic benefit is estimated at RM 87 billion.
BENEFITS OF EE IN THE BUILDING SECTOR NOT
YET BEING REALISED.
Whilst EE can provide many benefits, in the building sector it appears
they are not yet being realised.
As figure 1 shows, electricity consumption in Malaysian buildings has
grown at an increasing rate in a highly predictable manner since 1990. A
number of EE building sector initiatives have been undertaken – for
example rebates on energy efficiency chillers – and whilst these initiative
have been effective in reducing energy use in individual buildings, they
have not be done so at a sufficiently large scale to make an observable
impact on Malaysia’s overall building sector electricity consumption.
1 A 1997 Canadian analysis of 30 studies across North America found that on average one million
dollars created five more jobs when invested in energy efficiency than it did when invested in energy
generation. http://www.pembina.org/reports/CompAnayl_EmplAirEmRed_1997.pdf

35 | P a g e E n e r g y E f f i c i e n c y i n B u i l d i n g s
If this trend was continued to 2020, building sector electricity
consumption would be 94,000,000 MWh in 2020, and 50% higher than
in 2012.
Why are the benefits of EE in the building sector not yet
being realised?
Compared with other countries, Malaysia’s building sector EE policies
are weak, as shown in figure 2 below. Malaysia’s performance contrasts
strongly with that of one of its main trading partners, China, which tops
the rankings.
Figure 2 - Malaysia's Building Sector Energy Efficiency Policy Score. As reported in the 2014
International Energy Efficiency Scorecard, ACEEE. *Malaysia’s policy performance was not reported in
the scorecard, but has been derived by BSEEP using the methodology presented in the scorecard
0
5
10
15
20
25
Building sector Energy Efficiency Policy Score
Ideal

36 | P a g e E n e r g y E f f i c i e n c y i n B u i l d i n g s
Table 3 below assesses where Malaysia currently stands in a range of
dimensions with respect to building sector EE.

Table 3 Assessment of current building sector EE approach and performance
Areas of
Assessment
Descriptions Strategy/objective Action plans/Activities Performance/Results Issues and Gaps
1. Institutional
Framework
Various
government,
government-
affliiated and
non govt
stakeholders are
promoting EE
JKR promotes EE in govt buildings
KeTTHA promotes EE in buildings as part
of the green technology policy
ST administers EMEER and MEPS
CIDB is supporting its member on EE
developments
The NGOs GBI, MGBC, REHDA, etc
promote EE.
Development corridors (eg IRDA) are
trying to put in place EE policies.
JKR implements most
new government
construction projects
ST regulates EE
CIDB develops a
sustainable
infrastructure blueprint
NGOs promote green
buildings (eg GBI)
Mixed results.
The level of
coordination varies.
Responsibilities can
be unclear (eg SEDA
implementing the
SAVE scheme, not
ST)
Champion stakeholder for building sector
EE is unclear.
No central coordination to track building
sector energy use, manage EE initiatives
and report on impacts and benefits
2. Policy and
regulatory
framework
UBBL (new
buildings)
EMEER, MEPS,
National EE
Master Plan (not
adopted), Green
Technology
Policy,
Make new buildings more efficient
Make appliances more efficient
Provide a roadmap for holistic EE
KeTTHA is developing a
NEEAP
JKR has mandatory EE
performance
requirements for new
govt. building designs.
CIDB and JKR are
working on rating tools
KeTTHA has created
regulations: MEPS &
EMEER implemented.
Low Carbon City
framework created.
Status of NEEAP
unclear
Low adoption of UBBL
Lack of monitoring
Lack of effective enforcement mechanisms
Low adoption of UBBL
EMEER compliance not 100%
MEPS compliance low at start of scheme
Lack of market oriented policy
Lack of overall building sector EE policy.

38 | P a g e E n e r g y E f f i c i e n c y i n B u i l d i n g s
Areas of
Assessment
Descriptions Strategy/objective Action plans/Activities Performance/Results Issues and Gaps
3. Financial
Initiatives
Incentives are provided and
administered by various
agencies
Incentivise EE initiatives to
promote take-up by
industrial & commercial
sector
Past & present: Pioneer
status, Investment Tax
Allowance, GTFS, Innocert,
Renewable Energy and
Energy Efficiency Scheme
(BPMB), SAVE, Free energy
audits, Import duty and sales
tax exemption for EE
equipment, Green building
rating tax incentive for
developers and purchasers
Very limited GTFS
applicants for
building EE
No information on
other incentives.
Low uptake due to
mechanism
Low uptake of loan guarantee
Monitoring and Evaluation not generally
done
Largely project based instead of program
based.
No stable financing mechanism identified to
fund incentives
4. Human
Capital
8 staff employed by EC to
administer EE regulation.
JKR assign a slightly higher
number of staff to
administer EE in
government buildings.
Human capacity
development is done on
internationally sponsored
projects.
NGOs undertake capacity
development.
Danish Project on EE
capacity building (finished)
BSEEP Project
Workshops held /
guidelines developed
Huge lack of human resources in
government.
Weak utilisation of domestic private sector
capacities

39 | P a g e E n e r g y E f f i c i e n c y i n B u i l d i n g s
Areas of Assessment Descriptions Strategy/objective Action plans/Activities Performance/Results Issues and Gaps
5. Infrastructure The building stock is
expected to double by
2031.
Electricity consumption in
existing buildings is rising
Develop standards for
new buildings and
incorporate in the UBBL
Limit appliance energy
use through standards &
labelling
Certain provisions of
MS1525 have been
incorporated into the
UBBL.
MEPS has been
introduced at the
residential level
Only 1 state has gazetted the EE
provisions.
MEPS compliance rates and
savings unknown.
The EE provisions of the UBBL
haven’t been widely adopted by
state and local government.
A broad mechanism to enable
the retrofitting of existing
buildings is missing.
Lack of substantial investment in
building sector EE.
6. Innovations Various green technologies
Develop priority
technologies
Green Technology
foresight 2030.
Prioritised areas are related to
building envelope
Technology development on
random base rather than
systematic assessment; however
it is hoped this can be addressed
by the Green Technology
foresight report.
7. Awareness/Education Various initiatives by
various stakeholders
Informing and training on
selected topics
Programmes
implemented by
KeTTHA, ST, MGTC,
JKR and NGOs
Awareness workshops, leaflets,
materials, guidelines, newspaper
campaigns, training
Low awareness of most energy
users
Few consistent and systematic
capacity and awareness
programs.

40 | P a g e E n e r g y E f f i c i e n c y i n B u i l d i n g s
Areas of Assessment Descriptions Strategy/objective Action plans/Activities Performance/Results Issues and Gaps
8. Monitoring &
Evaluation
KPIs have been
formulated in some
cases
Monitoring of budget
spending
SAVE, MEPS, SIRIM
energy testing lab
No information No systematic monitoring and
evaluation regarding impacts and
effects
9. Green growth aspects Building sector is
recognised as a key
sector in the
economy
It is assumed that green
technologies have huge
potential in the building
sector
Green technology and
SCP and BSEEP
policies are in
development
Draft strategies Systematic capitalising on building
sector EE for growth (connecting
the market) is in the infant stage.
In response to each of these issues and gaps the following approach is recommended.

41 | P a g e E n e r g y E f f i c i e n c y i n B u i l d i n g s
Table 4 Strategy, actions and KPIs to overcome the issues and gaps in building sector EE.
Areas of
Assessment
Descriptions Strategy/objective Action plans/Activities Performance/R
esults
KPI
1. Institutional
Framework
Champion stakeholder for building
sector EE is unclear.
No central coordination
Define the champion stakeholder
and assisting stakeholders
Allocate responsibilities and
resources
Clear
identification of
champion and
others
Identified by 2016
Budget allocation
2.. Policy and
regulatory
framework
Lack of monitoring
Lack of effective enforcement
mechanisms
Low adaption of UBBL
Low full compliance with the EMEER
MEPS compliance low at start of
scheme
Lack of market oriented policy
Lack of overall building sector EE
policy.
Have a comprehensive EE
building policy and regulation to:
connect the market
create a stable financing
mechanism
incentivise the market
enable government to lead by
example
initiate institutional transformation
Monitor, evaluate.
Utility energy efficiency obligation
MS 1525 and its application across
Malaysia
Mandatory disclosure of building
energy performance
Appliance and Equipment
Standards and Labelling
Energy performance requirements
for govt. bldgs.
The policy is in
place
Blueprint ready by 2015,
policy endorsed by
Cabinet by ____

42 | P a g e E n e r g y E f f i c i e n c y i n B u i l d i n g s
Areas of
Assessment
Descriptions Strategy/objective Action plans/Activities Performance/Results KPI
3. Financial
Initiatives
Low uptake of loan
guarantee
Monitoring and Evaluation
not done
Largely project based
instead of program based.
No stable financing
mechanism identified to
fund incentives
Ensure long term
stable funding and
targeted distribution of
funds with the goal of
driving large scale EE
in buildings.
Tariff charge / Utility energy efficiency
obligation
Develop methods which enable
appropriate incentive allocation
Targeted incentives for new buildings
(tax breaks)
Potentially provide a EE specific
revolving fund for ESCOs. (RM 1
billion), supported by government
purchase of EPCs
Stable long term funding
Effective usage of funds
Effective monitoring and
verification
Tariff charge of 0.2
sen/kWh from 2018 rising
to 2 sen/kWh by 2028, and
raising MR 990m in
revenue over RMK11, and
RM 33,000 by 2035. NB.
Current tariff is around RM
0.47/kWh.
This is used to deliver RM
88 b in net financial benefit
by 2035.
4. Human
Capital
Huge lack of human
resources in government.
Weak utilisation of
domestic private sector
capacities
Enhance capacity of
government to
administrate EE policy
Increase number of people employed
to administer EE in government.
Employ training pathways
Include private sector participation to
multiply human resources
Establish a Malaysian Training Centre
for Energy and Water Efficiency
Sufficient capacity to
effectively administer the
policy and its
instruments; an estimate
of 96 persons.
Training Centre is
established
EE building policy has to be
tabled together with a
business plan that spells
out resourcing
requirements, including
staffing.

43 | P a g e E n e r g y E f f i c i e n c y i n B u i l d i n g s
Areas of
Assessment
Descriptions Strategy/objective Action plans/Activities Performance/Results KPI
5. Infrastructure The EE provisions of the
UBBL haven’t been widely
adopted by state and local
government.
A mechanism to enable the
retrofitting of existing
buildings is missing.
Lack of substantial
investment in building
sector EE.
Speed-up uptake of the
application of
MS1525/UBBL at the state
and local government
level.
Create mechanism that
create a market for the
retrofitting existing
buildings.
Persuade the states and local
authorities to mandate the use of
the EE provisions of the UBBL.
Create the following mechanisms:
Building performance disclosure,
Utility energy efficiency obligation
(UEEO), Expanded scope for
MEPS, government obligation to
engage in EPCs.
Establish a Green Building
Council with government
representation.
Wide mandatory uptake
of the EE provisions at
the state and local govt
level.
Market driven retrofitting
of buildings, driven by
mandatory disclosure,
MEPS, UEEO.
80% of states and local
authorities adopt the
MS1525/UBBL provisions
by 2020.
98% of buildings using
above 500 MWh/year
disclose their performance
in a NBECD by 2025.
UEEO saves 2m MWh in
2020.
MEPS encompasses all air
conditioning by 2017, by
2020 MEPS compliance
rate is 98%.
6. Innovations Technology development
on random base rather
than systematic
assessment.
Prioritise technologies
which can compete in the
marketplace
Assess and develop a list of
technologies based on their
market suitability.
Priority technologies
identified
Technologies identified are
in the Green Technology
Master Plan

44 | P a g e E n e r g y E f f i c i e n c y i n B u i l d i n g s
Areas of
Assessment
Descriptions Strategy/objective Action plans/Activities Performance/Results KPI
7. Awareness Low awareness of most
energy users
Few consistent and
systematic capacity and
awareness program.
Increase awareness of
all energy users, building
developers, occupants,
government and
students on the
importance of EE
buildings.
Mandatory building performance
disclosure
Cross government and cross
institutional effort to promote EE
Establish a Malaysian Training
Centre for Energy and Water
Efficiency
Building sector energy
consumption can be
tracked in detail.
Coordinated efforts of all
stakeholders to promote
EE in buildings within a
broader SCP campaign.
98% of obligated buildings
are reporting to a NBECD
Annual mass media,
internet, social media
campaigns.
8. Monitoring and
Evaluation
No systematic monitoring
and evaluation regarding
impacts and effects
Beyond the KPIs, the
effects and impacts of
the EE building policy
shall be monitored and
evaluated.
EE building M&E is included in the
MYSCPI framework.
Produce annual reports, using the
National Building Energy
Consumption Database (NBECD).
Ensure the NBECD enables tracking
of energy saving activities.
Relevant indicators
identified and data
collected, evaluated and
reported.
Annual reports.
9. Green Growth
Relevance
Systematic capitalising on
building sector EE for
growth (connecting the
market) is in the infant
stage.
Systematically connect
the market to get
stakeholders
transactions mobilised to
enable green growth.
Move systematic integration of
green growth in the building sector
from the infant to childhood stage
Economic,
environmental and social
benefits
6,000 GWh, 4.6m tonnes of
GHG saved over RMK11,
2,600 jobs in buildings
sector EE by 2020.
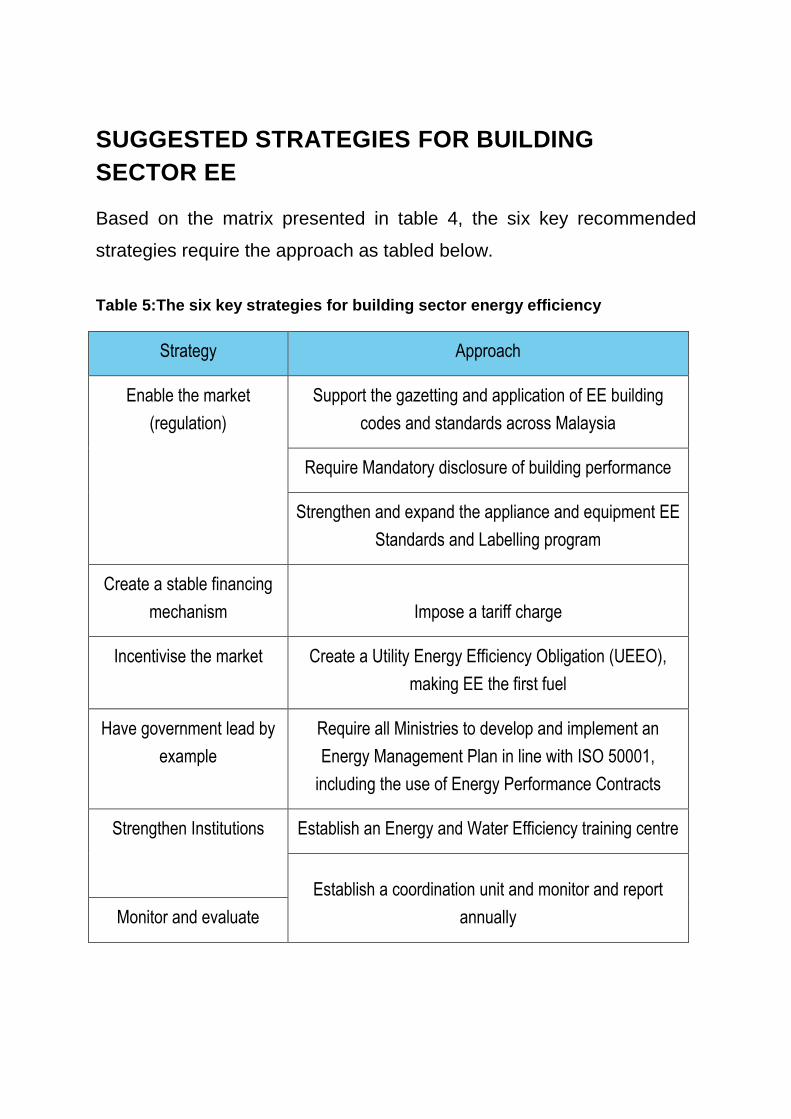
SUGGESTED STRATEGIES FOR BUILDING
SECTOR EE
Based on the matrix presented in table 4, the six key recommended
strategies require the approach as tabled below.
Table 5:The six key strategies for building sector energy efficiency
Strategy Approach
Enable the market
(regulation)
Support the gazetting and application of EE building
codes and standards across Malaysia
Require Mandatory disclosure of building performance
Strengthen and expand the appliance and equipment EE
Standards and Labelling program
Create a stable financing
mechanism Impose a tariff charge
Incentivise the market Create a Utility Energy Efficiency Obligation (UEEO),
making EE the first fuel
Have government lead by
example
Require all Ministries to develop and implement an
Energy Management Plan in line with ISO 50001,
including the use of Energy Performance Contracts
Strengthen Institutions Establish an Energy and Water Efficiency training centre
Establish a coordination unit and monitor and report
annually Monitor and evaluate

46 | P a g e E n e r g y E f f i c i e n c y i n B u i l d i n g s
These approaches are summarised below
Enable the market
Support the gazetting and application of EE building codes and
standards across Malaysia
Effective building codes and standards are one of the most cost effective
ways of achieving large energy savings. For example good passive
design is something that can save large amounts of energy, yet the
opportunity for good passive design is largely lost once the building is
built.
However in Malaysia EE building standards or codes have not been
widely adopted across all 148 municipalities.
Rather than focus on further enhancing or expanding the scope of EE
building codes and standards, the recommended approach for the 11th
Malaysian plan is to focus on improving the application of the Uniform
Building By Laws (UBBL) across the country and adopting more of the
provisions of MS1525 into the UBBL, whilst also continuing to support
the voluntary application of MS 1525 in the construction of “green”
buildings.
Until such point that codes are widely applied, the economies of scale
that result in the construction industry effectively internalising the
additional costs will not be realised to their full extent.
The International Energy Agency has developed a ten step process
encompassing the plan-implement-monitor-evaluate process that

47 | P a g e E n e r g y E f f i c i e n c y i n B u i l d i n g s
addresses these barriers to codes implementation. It is suggested that
Malaysia adopt a consultative process to both review its past
achievements and how to identify how to fully apply this process over
the 11th Malaysian plan.
Once code compliance is widespread, Malaysia can then move to
tighten codes and expand their application. A suggested pathway is that
Malaysia set building energy intensity requirements that lower every five
years such that new buildings use zero net energy by 2040, and that
these be widely communicated to enable industry to prepare
appropriately.
Require Mandatory disclosure of building performance
Mandatory disclosure of building energy performance has been shown
to be effective in reducing energy consumption in commercial buildings.
This is achieved by drawing energy consumption and comparative
performance to building owners, occupiers, tenants and buyers, and
thus providing competitive market advantage to better performing
buildings. In the residential sector energy saving results are less clear,
although there is evidence that property values and rental yields go up
as homes become more efficient.
In very rough numbers, at best, Malaysian mandatory disclosure could
lead to energy savings worth RM 325 billion annually, with the benefit
being approximately seven times the direct compliance costs. GHG
savings could reach 0.6 million tonnes annually and 250 people provided
with employment.

48 | P a g e E n e r g y E f f i c i e n c y i n B u i l d i n g s
Mandatory annual disclosure is initially recommended for large office
tenancies and common property areas in larger buildings consuming
over 1,000 MWh/year. Over five years the scheme should be tightened
to eventually cover all non-industrial buildings consuming over 200
MWh/year.
Existing regulation can be modified to enable building energy
performance disclosure. Excess government revenue from a Utility
Energy Efficiency Obligation (UEEO) or White Certificate scheme could
be used to fund early incentives which would be withdrawn over the first
three to five years. Penalties would drive the necessary compliance to
ensure that the scheme is widely adhered to, which is essential for its
success.
Mandatory disclosure would be enabled through a National Building
Energy Consumption Database (NBECD). The key purpose of an
NBECD is to enable traceability of the impact of energy efficiency
measures through to changes in energy consumption, and to be able to
do so with a large data set in order to provide a high degree of
confidence in any findings.
If an ambitious set of building sector EE policies are to be adopted in the
11th Malaysian plan efficiencies should be sought in program
administration.
A NBECD is an elegant and cost-effective way of doing this and can also
serve the additional purpose of providing an administration and
regulatory tool.

49 | P a g e E n e r g y E f f i c i e n c y i n B u i l d i n g s
Strengthen and expand the appliance and equipment EE
Standards and Labelling program
Standards and Labelling (S&L) of appliances and equipment is widely
recognised as being a highly cost-effective EE policy measure. S&L is
the most widely used EE policy measure globally.
Malaysia, via a 2013 amendment to the Electricity Supply Act, restricts
the sale of domestic equipment, low voltage equipment usually sold
directly to the public, and low voltage equipment that does not require
special skills in its operation, unless approved by the Energy
Commission. It stipulates that in order to be approved a number of high
energy using residential appliances need to meet certain minimum
energy performance requirements (MEPS) and have an energy
efficiency label, as determined by the EC.
The EC is now planning to expand the scope of coverage.
International experience shows that the Measurement, Verification and
Evaluation (MV&E) of S&L programs is often a weak link in such
programs. Even relatively small percentage failure rates in compliance
can result in significant lost savings. Sufficient resourcing of MV&E
provides an outstanding return on investment.
It’s suggested that Malaysia have four areas of policy focus around S&L:
1. Additional products for the expansion of S&L should be selected
based on their economic benefit. This means expanding to also
cover equipment used in the commercial and industrial sectors,
particularly to commercial air conditioning

50 | P a g e E n e r g y E f f i c i e n c y i n B u i l d i n g s
2. The roll out of additional products should happen in accordance
with a long term plan, which needs to be developed.
3. Malaysia should be better resourcing its capacity to administer and
enforce compliance with standards and labelling regulations,
including establishing a dedicated department to do this.
4. Malaysia can continue to play a role in harmonisation, particularly
around testing standards. As a small country that exports air
conditioners Malaysia has more to win than lose out of
harmonisation.
Create a stable financing mechanism – impose a tariff
charge
An additional tariff charge of 0.2 sen/kWh in 2018, rising to 2 sen/kWh
over an eleven year period and then remaining at 2 sen/kWh will provide
a stable long term financing mechanism.
At the current average tariff of 47 sen/kWh, this tariff charge will initially
represent less than 0.5% of the typical electricity bill, and will not apply to
residential consumers using less than 200 kWh/month.
A wide range of countries use this mechanism to fund EE incentives
through a Utility Energy Efficiency Obligation (UEEO). This includes EU
countries, Brazil and various states in the USA and Australia.

51 | P a g e E n e r g y E f f i c i e n c y i n B u i l d i n g s
Incentivise the market through a UEEO
A Utility Energy Efficiency Obligation (UEEO), also known as a white
certificate scheme, is a way of financing energy efficiency upgrades and
driving large investment in energy efficiency. This is an emerging form of
policy, used in Australia, the US, Europe and Brazil.
UEEOs place an obligation on energy utilities to save energy, with a
fixed amount of “negawatts” to be generated each year. In effect EE
needs to be considered as a fuel – in California it is considered as the
first fuel. Utilities purchase energy savings – or negawatts – at a certain
price per negawatt-hour.
A UEEO is financed by an additional charge on electricity bills, with this
used to then incentivise EE – for example by providing a discount on a 5
star air refrigerator – based on the amount of negawatt-hours generated
over the lifetime of the fridge.
For a scheme that ran for 20 years from 2018 electricity consumers
could save over RM 100 billion (at a cost of RM 40 billion in additional
tariff charges), and greenhouse gas savings of 190 million tonnes could
be realised. The tariff charge could be enabled by linking it to the
subsidy rationalisation program.
Importantly a well-designed scheme can deliver energy efficiency
benefits to virtually all consumers – not just those who can afford
expensive renewable energy or EE measures. For example by providing
discounts on 5 star energy efficient appliances such as TVs and
refrigerators – appliances that are purchased by all income levels.

52 | P a g e E n e r g y E f f i c i e n c y i n B u i l d i n g s
UEEOs are a relatively complex instrument and are significantly more
complex to administer than the Feed in Tariff as already exists in
Malaysia. However, as a market based mechanism they should deliver
least cost energy savings, with the price of each certificate, equivalent to
1 MWh of electricity saved, set by the market. Our estimate is that a
price of RM 150/MWh – equivalent to 15 sen/kWh - should provide a
strong incentive, noting that this is roughly half the cost of electricity
generation in Malaysia.
Given the complexity of a UEEO, Malaysia could consider starting with a
fairly simple model initially. It could also split off the funding mechanism
(the additional tariff charge) and manage this separately. Failure to
adequately administer a UEEO could result in “phantom” energy savings
being generated, and make little contribution to reduced carbon
emissions or improved energy security.
Malaysia could also consider using an additional tariff charge to raise
money for EE, but rather than put the obligation on the utilities to
generate savings, could put it onto a purpose created “energy efficiency
generator” as has been done in the U.S. state of Vermont. This then
removes the split incentive for a utility that also wants to maximise its
sales of generated electricity.
Have government lead by example
There are a large number of countries which have energy performance
requirements for government buildings. These range from construction
standards more stringent than those which apply to other buildings, to

53 | P a g e E n e r g y E f f i c i e n c y i n B u i l d i n g s
reporting publicly on energy consumption, through to achieving high
operational performance.
It is suggested that Malaysia require:
The mandatory compliance for new or refurbished government
buildings with JKRs performance requirements.
Mandatory annual public reporting on energy consumption of
existing buildings
A requirement to improve the energy performance of existing
buildings, enabled by both:
- A requirement for Ministries to employ energy managers and
implement energy planning activities in accordance with ISO
50001
- Energy Performance Contracts of government buildings.
Compliance requirements would be monitored by JKR, the reporting and
improvement requirements by the Energy Commission, aided by the
Ministry of Finance.
Presently core federal government buildings2 are roughly estimated to
use RM 80m of electricity annually, and across the 22,300 government
buildings annual energy costs are estimated at RM 1.9b. A well
implemented policy has the potential to reduce energy consumption in
government buildings by 10% over the first three years with a payback of
2 Office buildings only

54 | P a g e E n e r g y E f f i c i e n c y i n B u i l d i n g s
around three years, including administration costs. Subsequent
additional savings in future years will more than cover the costs of
compliance.
In addition to the budgetary benefits this policy will build up capacity in
reporting on and reducing building energy use, and can be used to
support the implementation of building performance disclosure, the
development of a National Building Energy Reporting Database and the
introduction of mandatory standards of all buildings.
These benefits will not be realised without effective policy
implementation. This requires enhancing the authority of the EC to
collect performance data and require performance improvements, and
capacity building and effective resourcing of government building energy
managers to enable timely reporting and effective building operations to
reduce energy use.
In leading by example government can stimulate the Energy Services
Contractor (ESCO) industry in Malaysia.
ESCOs have the potential to be able to use private financing to
undertake EE, reducing the need for government investment.
Malaysia’s Green Technology Financing Scheme has RM 3.5b of
funding available as a loan guarantee for projects that reduce energy
consumption, including building energy efficiency retrofit projects that
provide guaranteed savings and are delivered by Energy Services
Contractors (ESCOs). However no ESCO projects have been

55 | P a g e E n e r g y E f f i c i e n c y i n B u i l d i n g s
implemented through this fund. The reasons for this go beyond
financing, and include:
Very little experience and familiarity in Malaysia with such projects
The lack of standard process and contracts
Financial risk is considered as high by financiers
To kick start the languishing ESCO industry in Malaysia government
should aim to purchase EE upgrades for existing buildings through
ESCOs.
Strengthen Institutions
Establish an Energy and Water Efficiency training centre
An Energy and Water Efficiency training sector will address capacity
concerns.
Strong capacity in any sector depends on market demand and the extent
to which the market demands leading performance.
As demand for building sector EE in Malaysia picks up, it is suggested
the Malaysia develop an over-arching approach to systematic wide
capacity building in EE that integrates over time with the training sector.
It’s suggested that Malaysia:
Allocate responsibility to the Ministry of Education, and establish a
Malaysian Training Centre for Energy and Water Efficiency

56 | P a g e E n e r g y E f f i c i e n c y i n B u i l d i n g s
Look at capacity developing in governance, industry, and the
training sector
Ensure consistency of resourcing for the governance of EE – a
key challenge internationally
Focus not just on enhancing technical skills, but ensure that there
is capacity in policy, law, finance, management, measurement,
verification and evaluation
Foster international collaboration for the development of capacity,
so as to learn from and avoid the mistakes of other countries when
introducing new policies
Tap into a wide range of internationally provided training and e-
learning in EE.
Establish a coordination unit
A coordination unit will play the important role of driving energy efficiency
across all areas of building sector energy use. It will also monitor
performance and results, and be responsible for overall achievement of
building sector EE KPIs.
The establishment of a coordination unit also requires strong resourcing
of EE. It is suggested that 96 people be employed in government to
administer EE programs, as outlined in table 2.

57 | P a g e E n e r g y E f f i c i e n c y i n B u i l d i n g s
Monitor and Evaluate
The establishment of a NBECD, and a coordination unit, will enable the
implementation of EE policy to be effectively monitored and evaluated.
Annual reports showing plans and progress should be provided at the
Ministerial level.
COMPARISON OF POLICIES
In arriving at the suggested policy approach above, a range of policies
were considered in response to stakeholder assessment.
These have been ranked by the author with respect to the following four
dimensions, in the Malaysian context:
Magnitude of savings when well implemented
International performance
Ease of effective implementation
Cost effectiveness
The ranking goes from 1 (low ranking) to 5 (high ranking). For example
energy efficiency codes and standards for building rank at 5 for
magnitude of savings when well implemented. This is the policy measure
that is expected to yield the greatest savings in Malaysia. On the other
hand mortgages to enable EE only ranks a 1 on the same dimension.
The ranking assessment is graphed below.

58 | P a g e E n e r g y E f f i c i e n c y i n B u i l d i n g s
Figure 3 - Policy ranking assessment. A ranking of 1 is considered to be low (weak), a ranking of 5 high
(strong).
Two policy measures have relatively low rankings – mortgages to enable
EE and Energy efficient technologies/construction methods for new
buildings - and it is suggested that these not be adopted.
The following section presents a discussion of each policy in detail.
EXPECTED RESULTS
The implementation of these policies is expected to reduce electricity
consumption costs for Malaysian consumers by RM 174b by 2035, and
reduce GHG emissions by 270 tonnes, with nearly 15,000 people
employed in energy efficiency in the building sector, as tabled below.
0
1
2
3
4
5
Mandatory disclosure ofBuilding Performance
Energy efficiency codesand standards for
buildings
Energy performancerequirements for
government buildings.
Energy efficienttechnologies /
construction methods…Mortgages to enable EE
A Utility Energy EfficiencyObligation (UEEO)
Appliance and EquipmentStandards and Labelling
(S&L)
Policy ranking assessment
Magnitude of savings when well implemented
International performance
Ease of effective implementation
Cost effectiveness

59 | P a g e E n e r g y E f f i c i e n c y i n B u i l d i n g s
Table 6 - Costs and benefits of building sector EE RMK11 to RMK14
Period
Cost to
consumers of
tariff charge
(RM m)
Savings to
consumers
(RM m)
Savings in
govt buildings
(RM m)
GHG
savings (m
tonnes)
People
employed
RMK 11
1,000
3,000
500
5
2,600
RMK 12
6,100
20,100
3,600
30
10,200
RMK 13
12,400
56,000
10,200
90
14,600
RMK 14
13,800
96,300
17,500
150
14,700
TOTAL
33,400
175,400
31,800
280
14,700
This investment in energy efficiency will leverage government
investment at a ratio of roughly 1:5, that is every RM 1b invested in
building sector EE will deliver roughly RM 5b in energy savings to
Malaysian consumers, as graphed below. And for every RM 1b of
government investment roughly RM 1.5b of private investment is
expected to be released.

60 | P a g e E n e r g y E f f i c i e n c y i n B u i l d i n g s
Figure 4 - Performance and leverage of EE investment (building sector)
More or less government investment is expected to result in more or less
private investment and savings, in proportion to these leverage ratios.
From around 2025 these policies, when well implemented, should mean
that building sector electricity consumption ceases to grow, as graphed
below. Further investment, and the inclusion of building integrated
renewable energy, should then result in building sector electricity
consumption falling. This is illustrated in the figure below.

61 | P a g e E n e r g y E f f i c i e n c y i n B u i l d i n g s
Figure 5 - Building Sector Electricity Consumption, BAU and with investment in EE
Further detail on the expected costs and benefits can be found in the
spreadsheet accompanying this document.

62 | P a g e E n e r g y E f f i c i e n c y i n B u i l d i n g s
DISCUSSION PAPERS ON EACH OF
THE POLICY TOPICS
These are presented below, with one paper on each of the following
twelve policy topics
1. A Utility Energy Efficiency Obligation (UEEO)
2. Appliance and Equipment Standards and Labelling (S&L)
3. Disclosure of Building Performance
4. Energy efficiency building rating tools
5. A National Building Energy Consumption Database (NBECD)
6. Energy efficiency codes and standards for buildings
7. Energy efficient technologies / construction methods for new
buildings.
8. Energy performance standards for government buildings.
9. Enabling Energy Services Contractors
10. Mortgages to enable EE
11. Capacity building in EE
12. Incentives for EE

63 | P a g e E n e r g y E f f i c i e n c y i n B u i l d i n g s
UTILITY DRIVEN ENERGY EFFICIENCY /
UTILITY ENERGY EFFICIENCY
OBLIGATION (WHITE CERTIFICATE
SCHEME)
SUMMARY
Utilities have the potential to engage with their customers to drive energy
efficiency. Whilst information campaigns, the provision of free energy
audits, or similar have often been undertaken by utilities, such “soft”
activities have had negligible impact on overall energy consumption.
Utilities have only been shown to be capable of either delivering or
fostering large scale energy conservation in the case of capacity
constraints (such as in Japan post-Fukushima) or where there is strong
regulation and incentive to do so.
A Utility Energy Efficiency Obligation (UEEO), also known as a white
certificate scheme, is a regulatory method of financing energy efficiency
upgrades and driving large investment in energy efficiency that utilities
can, if they so choose, use to decouple their income from the sale of
energy. This is an emerging form of policy, used in Australia, the US,
Europe and Brazil.
UEEOs place an obligation on energy utilities to save energy, with a
fixed amount of “negawatts” to be generated each year. They are
financed by an additional charge on electricity bills. Preliminary

64 | P a g e E n e r g y E f f i c i e n c y i n B u i l d i n g s
modelling for Malaysia shows that harnessing an additional charge of
RM 0.002/kWh in 2018, rising to RM 0.02/kWh over an eleven year
period and then remaining at RM 0.02/kWh has the potential to reduce
electricity consumption in Malaysia by 9% by 2037 vs BAU. For a
scheme that ran for 20 years from 2018 electricity consumers would
save over RM 100 billion, and greenhouse gas savings of 190 million
tonnes would be realised. The tariff charge could be enabled in the first
instance by linking it to the subsidy rationalisation program.
Whilst funding for energy efficiency measures could come from the
Malaysia Electricity Supply Industries Trust Account (MESITA) fund, the
amount of funding available is insufficient to provide the large investment
needed for energy efficiency to deliver significant economic benefit.
Enabling such a scheme would likely require an amendment to the
Electricity Supply Act, or alternatively a new Act.
UEEOs are a relatively complex instrument and are significantly more
complex to administer than the Feed in Tariff as already exists in
Malaysia. However, as a market based mechanism they deliver least
cost energy savings, with the price of each certificate, equivalent to 1
MWh of electricity saved, set by the market. Australian experience
shows that as schemes mature the certificate price settles to well below
the ceiling price.
Modelling undertaken indicates that an UEEO could generate RM 4
billion of funding over and above that required to administer the scheme.
This will provide a valuable revenue source averaging around RM 200
million annually for the financing of other EE policies.

65 | P a g e E n e r g y E f f i c i e n c y i n B u i l d i n g s
This policy paper describes how a UEEO works, assesses the strengths
and weaknesses of this policy measure, and looks at its suitability to
Malaysia, outlining elements of how a scheme might be set up in
Malaysia. Due to the complexity of such schemes it recommends that a
UEEO start off slowly, with a fixed certificate price, so as to provide time
for government, industry and utilities to become familiar with scheme
operation. It then recommends moving to market based certificate
pricing and rapid expansion. A scheme model is presented, showing the
possible economic benefits. Examples are presented of the level of
stimulus a UEEO could provide for a range of energy saving activities,
covering appliances, lighting, whole of building energy savings and
industry.
As an alternative to an obligation on the utilities to save energy,
Malaysia could also look at setting up a dedicated “energy efficiency
generator”, which has the liability to meet the annual target for energy
savings, effectively generating “negawatts”.
A UEEO has substantial synergy with other proposed measures. It
compliments MEPS, and the expansion of MEPS. It can be used to
incentivise improved whole of building performance. It can be used to
drive electricity savings in both the building and industrial sector, and
create significant employment opportunities in EE.
Achieving large energy savings requires large investment, which the
private sector is generally unwilling to make unless substantial incentives
exist. A UEEO is an effective way of financing and creating these
incentives.

66 | P a g e E n e r g y E f f i c i e n c y i n B u i l d i n g s
A UEEO represents a leadership opportunity to Malaysia. It can lead in
developing smart-phone based tools that greatly reduce administration
effort, and in designing a scheme that integrates in a holistic way with
other policies rather than having a piecemeal approach. And it can be
the first ASEAN country to have an effective mechanism for providing
large on-going financing for EE whilst harnessing the power of the
market to deliver least cost savings.
On the other hand UEEO schemes are complex. Without effective
administration, measurement, verification, evaluation and enforcement a
UEEO is unlikely to be effective.
The paper concludes with a number of discussion questions to elicit
further suggestions.
UTILITY DRIVEN ENERGY EFFICIENCY
Globally utilities have been shown to engage in nine different types of
activities to reduce end use energy consumption through energy
efficiency.3 These include:
1. Advice and assistance (such as energy audits)
2. Information, education and promotion (e.g. general provision of
energy saving advice on a website)
3. Financial incentives (e.g. subsidies for EE products)
3 Energy Provider-Delivered Energy Efficiency, IEA, 2013
http://www.iea.org/publications/insights/EnergyProviderDeliveredEnergyEfficiency_WEB.pdf

67 | P a g e E n e r g y E f f i c i e n c y i n B u i l d i n g s
4. Direct installation of low cost energy saving measures, often at no
cost (eg CFL light bulbs)
5. Comprehensive installation – identify and implement all known
opportunities at a site
6. Equipment replacement
7. On bill financing – loans for EE products provided, with repayment
costs added to the energy bill.
8. Technology development – R&D, demonstration and
commercialisation of EE technologies
9. Bulk procurement and distribution (e.g. CFL light bulbs)
The dominant driver for utilities to engage in energy efficiency is
regulation, however some utilities have also engaged in EE because of
funding opportunities, their own internal corporate sustainability policies,
and to retain or win new customers. There are several examples where
utilities have undertaken EE in response to a need to urgently deal with
rising demand or capacity constraints, notably in Thailand and South
Africa. In the remarkable voluntary energy conservation savings
achieved in Japan after the Fukushima nuclear disaster in March 20114
4 How Japan Replaced Half its Nuclear Capacity With Efficiency.
http://www.greentechmedia.com/articles/read/how-japan-replaced-half-its-nuclear-capacity-with-
efficiency

68 | P a g e E n e r g y E f f i c i e n c y i n B u i l d i n g s
the main role undertaken by utilities was the provision of information on
electricity consumption and supply capacity.5
Utilities have a revenue model based on the sale of electricity, and
therefore have little motivation to reduce energy consumption.
Accordingly in the absence of capacity constraints, very high energy
prices (i.e. as is the case in Malaysia – plenty of capacity and low energy
prices), or substantial incentives, “soft” utility driven energy efficiency
activities – such as information campaigns – have had negligible impact.
Through Utility Energy Efficiency Obligations (UEEOs) which create
annual energy efficiency targets regulators have attempted to create a
framework that can reward utilities for saving energy. California is likely
the most successful model, with a UEEO scheme in operation now since
2004. In Denmark utilities have successfully set up ESCOs to capture
this opportunity. For a UEEO to operate effectively over a long period,
utilities need to be willing to adopt new business models or divisions to
be able to decouple their revenue streams from electricity sales.
Accordingly, as is the case with many EE policies, sustained strong
governance, administration, measurement, verification and enforcement
is necessary for policy success, and utilities need to be willing to strongly
engage in a competitive EE marketplace.
5 Environmental Action Plan by the Japanese Electric Utility Industry, 2012,
http://www.fepc.or.jp/english/library/environmental_action_plan/__icsFiles/afieldfile/2013/03/27/action
plan_E_2012.pdf

69 | P a g e E n e r g y E f f i c i e n c y i n B u i l d i n g s
A criticism of UEEO schemes is that even though a UEEO may create
an incentive mechanism for saving energy, ultimately they want to sell
more power. When setting up a scheme an important choice is to
whether to give the energy savings obligation to a utility, or to set up a
dedicated energy “energy efficiency generator” to take on an annual
savings obligation.
WHAT IS A UTILITY ENERGY EFFICIENCY
OBLIGATION?
A Utility Energy Efficiency Obligation (UEEO) places on obligation on a
utility to reduce the consumption of energy.
For example, a utility might be obliged to source 2% of its annual energy
supply from energy savings.
Utility energy efficiency obligations are also known as:
White Certificate Schemes.
Energy Saving Certificates
Energy Efficiency Resource Standards (EERS)
Energy Savings Obligations (ESOs)
Energy Savings Schemes
Energy Saving Initiative Schemes
Energy Company Obligation
By setting annual energy savings targets UEEO schemes can be very
effective in generating large energy savings. In California energy
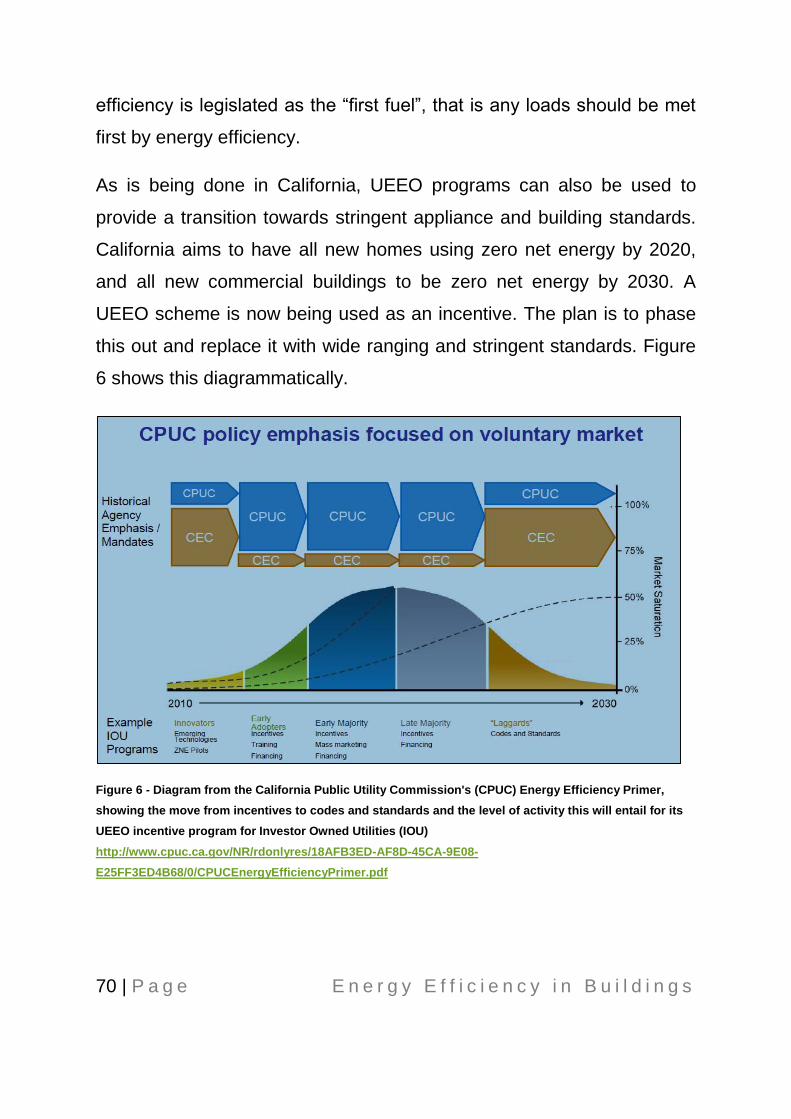
70 | P a g e E n e r g y E f f i c i e n c y i n B u i l d i n g s
efficiency is legislated as the “first fuel”, that is any loads should be met
first by energy efficiency.
As is being done in California, UEEO programs can also be used to
provide a transition towards stringent appliance and building standards.
California aims to have all new homes using zero net energy by 2020,
and all new commercial buildings to be zero net energy by 2030. A
UEEO scheme is now being used as an incentive. The plan is to phase
this out and replace it with wide ranging and stringent standards. Figure
6 shows this diagrammatically.
Figure 6 - Diagram from the California Public Utility Commission's (CPUC) Energy Efficiency Primer,
showing the move from incentives to codes and standards and the level of activity this will entail for its
UEEO incentive program for Investor Owned Utilities (IOU)
http://www.cpuc.ca.gov/NR/rdonlyres/18AFB3ED-AF8D-45CA-9E08-
E25FF3ED4B68/0/CPUCEnergyEfficiencyPrimer.pdf

71 | P a g e E n e r g y E f f i c i e n c y i n B u i l d i n g s
WHERE ENERGY EFFICIENCY SCHEMES ARE
USED
UEEOs are used by several European countries (eg Italy, France,
Demark, the UK, Poland), roughly half of the states in the United States,
in four Australian states, in China and in Brazil.
The European Union Energy Efficiency Directive (2012) mandates that
all EU-28 countries are legally obliged to achieve a certain amount of
final energy savings by 2020. A range of mechanisms are required, one
of which is the obligation to use energy efficiency obligation schemes or
other targeted policy measure.6
India has developed a roadmap for the rollout of an EUUO.7
The required savings to be achieved by each country via a UEEO is
1.5% of the average energy sales over 2010 to 2012, for each year from
2014 to 2020.
Further information on some of the schemes used elsewhere include:
Australia: state of Victoria (pop 5m)
o Information for the general public:
http://www.switchon.vic.gov.au/how-can-i-take-charge-of-my-
power-bill/energy-saver-incentive
6 European Commission, Energy Efficiency Directive.
http://ec.europa.eu/energy/efficiency/eed/eed_en.htm
7 Preparing a Roadmap for Implementing Energy Efficiency Portfolio Obligation in India.
http://www.shaktifoundation.in/cms/uploadedImages/product-DSM.pdf
72 | P a g e E n e r g y E f f i c i e n c y i n B u i l d i n g s
o Scheme administration (for use by scheme participants),
including the register of energy efficiency certificates and
links to scheme legislation: www.veet.vic.gov.au
Australia: state of NSW (pop 7m ?)
o This scheme, which commenced in 2009, had annual targets
increase from 0.4% of sales up to 4% of sales in 2014, then
remaining at 4% through to 2020. Cumulatively this will give
a 34% savings by 2020. http://www.ess.nsw.gov.au/Home
USA: state of California (pop 37m)
o Californian has a mature and comprehensive EE program,
much of it delivered through utilities. The target is a 17%
saving by 2020 from 2004.
http://www.cpuc.ca.gov/PUC/energy/Energy+Efficiency/
USA: state of Vermont (pop 0.6m)
o Efficiency Vermont administers a fund collected from an
additional charge on energy bills. This is then used to
provide rebates on EE products.
http://www.efficiencyvermont.com/About-Us/Energy-
Efficiency-Initiatives
Brazil (pop 200m)
o This scheme has an annual allocation of 0.5% to EE
o English (but significantly out of date):
http://www.aneel.gov.br/area.cfm?idArea=262
o Portuguese: http://www.aneel.gov.br/area.cfm?idArea=27

73 | P a g e E n e r g y E f f i c i e n c y i n B u i l d i n g s
UK (pop 63m)
o https://www.ofgem.gov.uk/environmental-
programmes/energy-companies-obligation-eco
Portugal (pop 11m)
o This paper on the Portuguese system has a good approach
to ensure deemed savings are not over-estimated.
http://www.ure.gov.pl/download/1/6013/Portugueseenergyeffi
ciencyregulatoryprogramPPECPedroVerdelho.pdf
WHAT SORT OF ACTIVITIES ARE UNDERTAKEN
TO GENERATE SAVINGS FROM UEEOS?
Savings can be generated from either “standard” measures where the
savings are deemed (i.e. estimated) or project measures which require
measurement and verification of the savings achieved.
Some examples of activities include:
Efficient Water heating
Efficient Heating and cooling
Weather proofing and insulation
Efficient Lighting
Standby power controllers
Efficient appliances, such as televisions, refrigerators, clothes
dryers

74 | P a g e E n e r g y E f f i c i e n c y i n B u i l d i n g s
Efficient Pool pumps
Efficient refrigerated display cabinets
Efficiency refrigerator fans
Efficient motors
Metered baseline for commercial and industrial (any activity can
be implemented, providing savings can be measured)
An example of how a white certificate scheme can be used to foster the
uptake of high efficiency appliances is shown below. This example
demonstrates how deeming the savings, and bringing the lifetime
savings forward, can be used to create a substantial incentive. It also
shows how a white certificate scheme can build on energy labelling and
MEPS for appliances.

75 | P a g e E n e r g y E f f i c i e n c y i n B u i l d i n g s
Figure 7 - Example of white certificates applied to purchase of a high efficiency air conditioner
HOW UEEOS WORK
UEEO schemes can work as either market based schemes (white
certificate schemes) or as schemes that are not market based.
Market based white certificate scheme
As shown in figure 8, a market based scheme is one where tradable
certificates are generated from the implementation of energy-saving
Example: white certificates applies to the
purchase of a high efficiency air
conditioner.
Make certificates available for any
aircon unit with a star rating of 5,
based on the COP vs the MEPS
COP.
Installing a high efficiency 5 kWr
split system air conditioner with a
COP of 4.1 (vs MEPS at 2.36).
Would save approx 4.4 MWh over
a 10 year lifetime*. This equates to
4 certificates.
If the certificate price was MYR
120, this could be used to offer a
discount of up to MYR 480 on the
unit
The owner would save MYR 1,700
over the lifetime of the unit in
reduced electricity costs (at MYR
0.40/kWh)
*Deeming assumption: Unit is operated
for 2,000 hours/year with a 30% load
factor, for 10 years. Overall discount
factor for uncertainty is 81%. (0.9 x 0.9)

76 | P a g e E n e r g y E f f i c i e n c y i n B u i l d i n g s
measures. Energy retailers are required to purchase a certain number of
certificates each year and surrender these to the regulator. Retailers
pass on the cost of certificate purchase to energy users. Each certificate
will either be equivalent to 1 MWh of electricity saved (Europe, USA) or
one tonne of carbon pollution that has been avoided (Australia).
Figure 8 - How a white certificate scheme works. Note some of the terminology: Energy retailers are also
known as obliged entities. An Accredited Certificate Creator is also known as an Accredited Person or an
Accredited Certificate Provider

77 | P a g e E n e r g y E f f i c i e n c y i n B u i l d i n g s
Figure 9 Portion of a commercial electricity bill, NSW, Australia, showing how a range of environmental
charges are passed on to consumers, including the white certificate charge.
Certificates are generated when energy-savings measures are
implemented in accordance with the rules of the scheme. White
certificates can only be created by regulator-accredited parties.
Certificates are created by implementing measures that have been
approved by the regulator. Schemes often have a wide range of
measures that can be implemented, and industry can propose new
measures.
In many schemes savings for many of the energy saving activities are
deemed rather than measured, for ease of administration. Where a
deemed methodology is used, the lifetime savings are also deemed
upfront. Therefore, for example, a high efficiency air conditioner that is
deemed to save 1 tonne of GHG emissions annually as compared with a
standard efficiency air conditioner, and has an expected lifetime of 10
Environmental charges on a commercial
electricity bill, NSW:
LRET – Large (>100 kW) renewable
energy certificate
SRES – Small (<100 kw) renewable
energy certificate
Carbon charge – carbon price levied on
the generator passed through to the
consumer
NSW Energy Savings Scheme – EE White
Certificate

78 | P a g e E n e r g y E f f i c i e n c y i n B u i l d i n g s
years, would generate 10 certificates on installation (assuming 1
certificate equates to 1 tonne).
White certificate schemes are market-based. That is the price of
certificates sold to utilities is set by negotiation between the seller and
the buyer. Being a market-based scheme, the measures that are most
cost-effective are implemented in favour of those that are less cost-
effective.
The government may set a cap on the certificate price and will determine
the annual quota that the market needs to produce. In a deregulated
market each energy retailer will be assigned a quota commensurate with
its market share. In a monopoly market the single retailer would need to
redeem all certificates. A cap is important to provide price stability to the
scheme.
Energy efficiency obligation schemes – not market based
A scheme that is not market based is similar to above. Rather than
certificates, fixed rebate amounts might be provided for a range of
measures selected by the regulator.
Other scheme models
Other models may place the obligation to generate savings on either a
state agency (rather than a utility) or a purpose created “energy
efficiency utility” as has been done in Vermont.
In India the Perform, Achieve Trade (PAT) scheme is similar to a UEEO,
but does not oblige utilities. Rather large energy intensive industry is

79 | P a g e E n e r g y E f f i c i e n c y i n B u i l d i n g s
mandated to generate savings, and the obligation is on each individual
enterprise. Enterprises can trade their savings amongst each other,
however the overall savings target must be met. 478 plants have been
targeted, representing 54% of total energy consumed in India.8
PLUS, MINUS, INTERESTING OF UEEO
Plus
Key benefits of UEEO schemes include:
Provide a mechanism for public financing of EE
Drives large energy savings
Effective at driving savings in existing buildings
The benefits are inclusive, and not just limited to the wealthy
Provides an incentive for utilities to engage in EE
Can complement and leverage other initiatives, such as labelling
and MEPS
Provides market demand that stimulates the growth of ESCOs and
other EE product and service providers.
Is target driven
8 International Review of Trading Schemes for Energy Savings and Carbon Emissions Reduction,
Report Commissioned by the World Bank, Ricardo-AEA, September 2013.
http://www.thepRM.org/system/files/documents/International%20Review%20of%20Certificate%20Tra
ding%20Schemes%20v4%20final%20agreed.pdf

80 | P a g e E n e r g y E f f i c i e n c y i n B u i l d i n g s
When targets are set high (> 1 million certificates/year) then this drives
considerable investment in energy efficiency. For example, the state of
Victoria currently has an annual target of 5.4 million certificates. At a
market price per certificate approaching $20, this is equal to a annual
investment of around $100m. Considering that white certificates typically
do not cover the full cost of the energy efficiency measure, and require
additional private investment, the annual investment arising from
certificates is also leveraging substantial additional private investment.
As identified in discussion paper 1, considerable investment is required
to realise large energy savings. White certificates scheme can leverage
private investment. How much private investment can they leverage?
One experienced EE policy maker has identified that public funding for
EE may be matched by private at a ratio of between 1:3 and 1:49 ,
although evidence for this was not provided.
Early results from California showed in the residential sector that rebates
of $2,500 were typical for a single family residential energy upgrades
averaging in cost of around $13,00010. This shows leverage of roughly
1:4. However, in the same report, it was also reported that EE programs
9 Richard Cowart, Energy Savings Obligations, Global Experience, Lessons Learned, Jan 2012.
http://www.iea.org/media/workshops/2012/pepdeebrussels/CowartSession1InternationalTrendsinener
gysavingsobligations.pdf
10 The Limits of Financing for Energy Efficiency, Borgeson, M., ZiRMing, M., Goldman, C., Lawrence
Berkeley National Laboratory, 2012. http://www.aceee.org/files/proceedings/2012/data/papers/0193-
000155.pdf

81 | P a g e E n e r g y E f f i c i e n c y i n B u i l d i n g s
which have been successful in reaching large markets have offered
incentives of 50% or more of the total cost.
My “gut feel” personal experience from operating an energy services
company over twelve years in Melbourne, Australia, would concur with
this, that incentives have to be proportionally large to attract private
investment.
The prior Malaysian experience with rebates could also inform this.
Factors that will influence the amount of leverage would include:
The extent to which energy costs are perceived to be high to very
high. Note that price shocks can create this perception (use to
enhance the scheme’s effectiveness, and a reason for making the
scheme high in price).
The capital available to invest in EE. This is related to the cash
reserves held by an individual or business. The wealthy are in a
better position to invest.
The extent to which the purchase provides non-monetary benefits,
such as status.
Typically many of the measures in UEEO schemes “deem” forward the
life-time carbon savings for the energy saving activity being implemented
to provide an up-front discount. Where this discount is large, this
encourages the up-take of energy saving measures.
There is evidence that UEEOs are much more effective than many other
policies in driving the retrofit uptake of energy efficiency measures in

82 | P a g e E n e r g y E f f i c i e n c y i n B u i l d i n g s
existing buildings. For example, in the state of Victoria Australia, the
(deemed) carbon savings from this state’s white certificate schemes far
exceed the savings achieved by other state government energy
efficiency policies, such as the state government greener government
buildings program (where state government departments and agencies
are required to implement an energy performance contract). As they are
market based mechanisms they drive competition resulting in lower
prices for consumers. In the U.S. UEEO obligations along with MEPS
have been identified as the key policy measure that has begun to
decouple energy consumption from GDP.11
Compared with household solar PV systems, residential white certificate
schemes are much more “democratic” in that for many measures only a
small investment will be required by the household to attract the co-
investment provided by the white certificate scheme. An example would
be subsidised lighting. This opens up the benefits of a white certificate
scheme to poorer households, and doesn’t limit it to only those who can
afford a substantial up-front capital investment.
In de-regulated markets white certificates can help energy retailers “de-
couple” their income from energy sales. This provides an incentive for
utilities to engage in EE.
11 Why is Electricity Use No Longer Growing, American Council for an Energy Efficient Economy,
2014, http://www.aceee.org/white-paper/low-electricity-growth

83 | P a g e E n e r g y E f f i c i e n c y i n B u i l d i n g s
UEEO schemes can be used to complement a range of other policies,
such as:
Labelling and MEPS
ESCO financing
Building performance disclosure
For residential and commercial building sectors energy efficiency has
traditionally failed to gain much tracking without heavy government
subsidies. UEEOs break down a range of barriers and can result in EE
delivering long-hoped for savings.
Minus
Negatives of an UEEO scheme can be:
Price increases on electricity bills may not be welcome. On the
other hand the government is moving towards subsidy
rationalisation, and a UEEO is an effective way of undertaking
subsidy rationalisation, as it actually provides more benefit to
consumers than subsidies do.
Establishing a robust scheme which enables effective market
competition requires considerable effort to establish and
administer. It is a relatively complex mechanism that requires
considerable effort to educate and inform scheme participant
about, and to enforce the following of the schemes rules. However
as a rapidly developing country Malaysia certainly has the
expertise to manage this if it is appropriately resourced.

84 | P a g e E n e r g y E f f i c i e n c y i n B u i l d i n g s
There may be significant volatility in certificate prices. If deeming
or measurement of savings is not done accurately, the scheme
may not deliver cost-effective carbon abatement. Malaysia can
learn from the experience elsewhere, and by investing in robust
M&V avoid this problem
If the scheme is very successful, the utilities with obligation under
the scheme may disengage due to lost revenue from electricity
sales. But with Malaysia’s electricity use growing strongly, a UEEO
would slow the rate of growth, not cause an absolute decline in
revenues. Alternatively a purpose created “energy efficiency
generator” utility could be established.
The establishment of a white certificate scheme requires considerable
effort, in informing and educating stakeholders, identifying suitable
activities, developing deeming methods, setting up administrative and
data management arrangements, and in ensuring that verification can
and is done effectively. Effective resourcing of scheme administration
and management is essential to its success.
Interesting
Utilities need to be willing to develop new business models or divisions
that deliver energy efficiency, so as to be able to profit from a UEEO.
Certificate schemes have the potential to trade with other market based
measures. If a certificate is based on one MWh of electricity saved, it
can be converted to a carbon equivalent using the emissions factor
applicable at that time.

85 | P a g e E n e r g y E f f i c i e n c y i n B u i l d i n g s
Trading could possibly go beyond Malaysia’s borders.
DESIGNING A UEEO
The steps in designing a UEEO are summarised below12:
1. Establish the sectoral coverage of the energy obligation
2. Identify the obligated parties
3. Define the obligation clearly and specifically
4. Prescribe adequate penalties for non-compliance
5. Describe who may be accredited to carry out energy efficiency
projects to meet the obligation
6. Define the energy efficiency measures that will be eligible for
meeting the obligation
7. Define how energy savings will be counted and validated
8. Define the source of funding
9. Require and effective measurement and verification (M&V)
program
10. Adjust obligations at regular intervals.
These are discussed in the Malaysian context further below.
12 Regulatory Mechanisms to Enable Energy Provider Delivered Energy Efficiency, March 2012,
Regulatory Assistance Project, http://www.raponline.org/document/download/id/4872

86 | P a g e E n e r g y E f f i c i e n c y i n B u i l d i n g s
APPLICABILITY TO MALAYSIA
General suitability
UEEOs are a method of attracting significant investment into EE and can
help create a strong ESCO capacity by creating market demand.
As discussed above many UEEOs rely on the implementation of
measures whose savings have been deemed. The development of these
“standard measures” for use in a UEEO could also be used to facilitate
other proposed measures already being considered, such as for
example accounting for the extra cost of a home loan to ensure highly
efficient air conditioners are installed.
UEEO schemes are essentially self-funding, and require no investment
of general government revenue.
Electricity subsidies
Malaysia has clearly recognised that in the long term energy subsidies
are unsustainable. The use of a white certificate scheme provides a
politically acceptable way of a reduction in subsidies. Government could
argue that “yes, the price of electricity has gone up, but this is being
used to subsidise energy efficiency measures available to all
consumers”. It is appropriate to link the tariff charge increase associated
with a UEEO to Malaysia’s subsidy rationalisation program.
There is anecdotal evidence that the relatively small feed in tariff charge
has not created a consumer backlash. So it appears politically

87 | P a g e E n e r g y E f f i c i e n c y i n B u i l d i n g s
acceptable to add another small environmental charge to electricity bills
to enable the implementation of a UEEO.
On the other hand, with only gradual small increases in electricity prices,
the “rebound” effect is more likely.
An example of a rebound effect would be the replacement of an
inefficient “window ratter” air conditioner with a COP of say 2, with a high
efficiency split system with a COP of 4. The new air conditioner would
use half of the energy of the old and cost half as much to run each hour.
The occupant may then chose to run the air conditioner more often,
increasing the homes comfort, and offsetting some of the total energy
savings that would have been achieved had the new air conditioner only
been operated for the same amount of time as the old air conditioner.
There is evidence that rapid increases in electricity prices foster
behaviour change to reduce electricity use, and reduce the “rebound”
effect. A World Bank study identified “Get the pricing right” as one of five
key success factors for EE, and provides the example of how price
shocks from the removal of subsidies have been effective in driving
decreased energy use in Poland and Lithuania.13
Its is therefore proposed that over the first three years the scheme start
with modest targets to enable industry and government to gain familiarity
with the scheme and to ensure smooth administration. However, from
13 Energy Efficiency – Lessons Learned from Success Stories, World Bank, 2013.
http://documents.worldbank.org/curated/en/2013/01/17597865/energy-efficiency-lessons-learned-
success-stories

88 | P a g e E n e r g y E f f i c i e n c y i n B u i l d i n g s
year’s four to eleven the target should increase rapidly. If accompanied
with the further removal of subsiside to create a price shock its
effectiveness will be improved.
Why not start off big?
Malaysia recognises that its energy efficiency performance to date could
be improved on. And globally the profile of energy efficiency is rising.
There is increasing pressure for Malaysia to get some “quick wins” from
energy efficiency.
However rushing to start a UEEO that very quickly generates large
savings could backfire:
Malaysia does not have a history of public administration of large
amounts of EE funding. The UEEO will create a large funding
source.
The administrative complexity and expense of getting a smoothly
running UEEO scheme established should not be underestimated.
It is much more complex than a Feed In Tariff. Some of this
complexity comes from:
Ensuring that chances for scheme fraud are minimised whilst
keeping the procedures easy to follow so as to not deter the
generation of certificates. This can be very challenging. For
example, with respect to the sale of high efficiency appliances,
various opportunities for fraud exist: falsification of model
numbers/serial numbers, creation of phantom customer, reselling
overseas, etc.

89 | P a g e E n e r g y E f f i c i e n c y i n B u i l d i n g s
Ensuring that deemed energy savings are accurate. This has been
a key weakness of at least one international scheme 14 . For
example, for an air conditioner, it is easy to determine the power
savings at full load based on the Coefficient of Performance (COP)
of the unit. However to determine the energy savings relies on
understanding the loading factor and hours of use. Is the air
conditioner the only one in the house? Or is it going into the guest
bedroom that is only used one month a year? What is a
comfortable temperature for the occupants of the house and how
heavily is the aircon loaded when in use? This can only be done
accurately by sampling a statistically significant sample for a
statistically significant period of time, which is expensive and time
consuming.
Establishing a database to enable the proper recording,
verification and trading of certificates; register of accredited
persons; dissemination of scheme rules and any changes to those
rules
14 The Victorian scheme in Australia had very high deeming factors for standby power controllers
(SPCs), such that they could be installed for free. SPCs flooded the scheme, accounting for around
80% of certificates from 2010 to 2012. However there was a good body of evidence that the savings
were “phantom”. The administrator eventually recognised this, and slashed the deeming factor in
October 2013. Unfortunately by then the market was saturated with SPCs, it was a case of being too
late. Poor deeming from the start, coupled with a lack of resourcing to enable agile and responsive
scheme administration, lead to the scheme operating poorly for a three year period. Unfortunately the
whole scheme now has a cloud over its future. A change of state government means that the new
government is now questioning the value of the scheme.
90 | P a g e E n e r g y E f f i c i e n c y i n B u i l d i n g s
Extensive industry consultation by those industries impacted by
the scheme and from where accredited persons are likely to come
from. For example, this would include the retailers of appliances.
Training and awareness raising; engaging with those who will
likely be accredited persons.
The energy efficiency industry could be characterised as immature
in Malaysia. It will require a lot of effort to educate and inform the
wide range of potential providers of EE service providers who
could benefit from a UEEO.
There is some evidence from the SAVE scheme that getting the
administrative arrangements and correct functioning of the
scheme right will take some time. Starting off with a high charge
from the start, if the scheme has teething problems, may create an
industry and public backlash against the scheme.
White certificates could also potentially even provide a long term
pathway for the retirement of feed in tariffs, and adoption of a single
certificate system that essentially becomes a single way of valuing the
carbon savings achieved by Malaysian renewable energy supply and
energy efficiency projects.
Timing
The chart below shows suggested timing should Malaysia chose to
introduce a UEEO scheme

91 | P a g e E n e r g y E f f i c i e n c y i n B u i l d i n g s
Figure 10 Possible timing of a UEEO scheme in Malaysia
Note the following key elements of this suggested time line:
A long lead time of nearly 3 years. This is to allow for very through
scheme design, building on global experience so as to minimise
the chance of repeating mistakes from elsewhere (such as over-
deeming), and also developing an on-line platform that will enable
much of the scheme administration via smart phone. Once
Malaysia decides to proceed, a key initial task will be developing a
comprehensive start up plan for this period.
Training is an important element that needs to be well resourced.
Training will predominantly be for accredited persons. It should not
just occur before the scheme starts, but over the first three years
to encourage new entrants. Training can likely scale back from
year four on.
Scheme formally endorsed by cabinet as
part of the 11th Malaysian plan
Scheme design
Amendment of the Electricity Supply Act
to make provision for the scheme
Stakeholder engagement, define energy
saving measures to use at start
Develop scheme rules
Conduct training
Development and testing of database
and on-line platform for scheme admin
Final preparations prior to scheme
launch
Scheme introduction: first 3 years.
Scheme expansion
Scheme is “Business as Usual” / / … / / …
Transition away from the scheme as
standards and regulations toughen …
2020 2021 2027 20282015 2016 2017 2018 2019 2039…
…
… … 2037 20382033 2034
92 | P a g e E n e r g y E f f i c i e n c y i n B u i l d i n g s
A possible system design for Malaysia
Below is a rough outline of how the design elements outlined earlier
might play out in Malaysia. Its suggested that the UEEO scheme in
Malaysia be a white certificate system.
Establish the sectoral coverage of the energy obligation
Option 1: To cover commercial and residential users of electricity.
However it may be difficult to stop industrial or other sectors
participating. Additionally many energy users, such as SMEs, may not
know if they are classified as commercial or industrial.
Option 2: To cover all electricity users in Malaysia. This would simplify
scheme administration. It would also then be able to be used to
incentivise industrial EE, which may have the potential to generate large
savings.
The modelling below is based on option 2.
Identify the obligated parties
Parties obliged to surrender certificates each year in accordance with the
target, or the “obligated entity”:
Option 1: The three electricity companies: Tenega Nasional, Sabah
Electricity and Sarawak Electricity. This has the benefit of encouraging
the power utilities to think of EE as a “fuel”, possibly as the “first fuel” as
is done in California. Additionally it is easy for the utilities to
communicate with customers and can provide information about the

93 | P a g e E n e r g y E f f i c i e n c y i n B u i l d i n g s
program and how incentives can be accessed either printed on or
attached to electricity bills. It also provides an incentive for the utilities to
reduce electricity consumption.
Option 2: A purpose created “energy efficiency generator.” The
advantage is no loss of focus, whereas utilities have multiple priorities,
such as reliability of supply, asset maintenance, etc. Additionally a
purpose created energy efficiency generator has no motivation to sell
more electricity.
Option 2 is only used in Vermont, with a population of 0.6m. If the
scheme wants to build on learning from elsewhere, it might be better to
pursue option 1, where there is a much greater body of experience.
Scheme administration and enforcement
One of the admin agencies under KeTTHA. Whilst the EC has
responsibility for EE, SEDA possibly have more appetite.
The administration and enforcement agency should be clearly separate
from the obligated entity(ies) required to surrender certificates to as to
enable “arms length” scheme administration.

94 | P a g e E n e r g y E f f i c i e n c y i n B u i l d i n g s
Define the obligation clearly and specifically
The obligation would be comprised of:
A long timeframe for the scheme, likely in the vicinity of 20 years,
with the option of extending it. Long time frames are a key element
of successful schemes.15
One certificate = 1 MWh (as Malaysia’s emissions factor is
changing, setting 1 certificate to 1 tonne CO2-e would require
annual or bi-annual adjustment of the number of certificates
created by each activity, which would confuse the market and
create unnecessary administrative work)
Certificates shall only be created on evidence that the energy
saving product or activity is installed (so as to avoid the creation of
“phantom” energy savings, or exploitation of the scheme)
An annual target as to number of certificates that need to be
surrendered.
Target to start low and be increased every year during the first
three years of the program to gradually introduce to industry and
the public, and to iron out any administration difficulties. The target
then to ramp up through to 2028, when 18 million certificates need
15 Policies for Energy Provider Delivered Energy Efficiency, IEA, 2012.
http://www.iea.org/publications/freepublications/publication/PEPDEEBrusselsWorkshopReport_FINAL
-1.pdf

95 | P a g e E n e r g y E f f i c i e n c y i n B u i l d i n g s
to be generated. Through from 2028 to 2037 the annual target
then remains at 18 million certificates.
The price in the scheme to be fixed for the first two to four years of
operation.16
A maximum certificate ceiling price should be set (to avoid
stockpiling)
Prescribe adequate penalties for non-compliance
Any shortfall in certificates surrendered by the obligated entity(ies) would
be penalised at the maximum ceiling price for each certificate short for
the first 5% shortfall, then increase at an escalating rate.
In the first year the penalty would be relaxed, then tightened up over the
following year.
For those accredited to carry out EE projects to meet the obligation
penalties will vary from:
1. Warning letter on minor breach.
2. Withdrawal of accreditation for a more serious breach or repeated
minor breaches.
3. Criminal prosecution in the event of deliberate fraud, as identified
by the scheme administrator.
16 As recommended under the heading “Pros and cons of tradability” in Policies for Energy Provider
Delivered Energy Efficiency, IEA, 2012.
http://www.iea.org/publications/freepublications/publication/PEPDEEBrusselsWorkshopReport_FINAL
-1.pdf

96 | P a g e E n e r g y E f f i c i e n c y i n B u i l d i n g s
Describe who may be accredited to carry out energy efficiency
projects to meet the obligation
Any person may be accredited. Anyone accredited shall be required to
attend training, pass an examination, and make a statutory declaration
to follow the rules of the scheme. They will also be required to participate
in audits.
Define the energy efficiency measures that will be eligible for
meeting the obligation
EE measures eligible for meeting the obligation shall be:
Year 1: High efficiency (5 star +) versions of all MEPS liable
appliances (currently split system air-con, fridges, fans, TVs),
lighting upgrades, plus a small number of industry nominated
measures during early stakeholder consultation on scheme design.
Years 2 to 6: Additional administrator or industry nominated
measures.
Any measures introduced after year 1 to be finalised no less than 6
months before the next year, to enable sufficient time for industry
training.
All measures will need to have robust Measurement and Verification to
ensure that the savings achieved are real. For deemed measures
typically around 18 months to 2 years should be allowed to do this.

97 | P a g e E n e r g y E f f i c i e n c y i n B u i l d i n g s
Define how energy savings will be counted and validated
Energy savings will be counted on the date of certificate surrender,
however the final number of certificates created annually will be subject
to an annual audit prior to being recognised.
Each measure implemented will receive preliminary validation at the time
of certificate creation via the smart phone app; with random sampling,
phone validation and physical inspections providing final validation.

98 | P a g e E n e r g y E f f i c i e n c y i n B u i l d i n g s
Table 7 Lifecycle of a white certificate
Activity Who is involved When this occurs
Certificate
creation
The energy user: assigns
the savings to the
accredited person.
The accredited person:
creates the certificate(s)
based on the savings.
Scheme administrator:
audits the correct creation
of certificates.
Either:
For deemed savings: When the energy
efficiency measure is installed and the
energy user assigns the deemed savings to
the accredited person, and the accredited
person registers the certificate(s).
For measured savings: When the M&V
report is complete to measure actual
savings and the energy user assigns the
deemed savings to the accredited person,
and the accredited person registers the
certificates.
Certificate
purchase
The accredited person:
sells this certificate
The obliged entity:
purchases the certificate
This is a market based transaction and will
occur when both the seller and buyer have
agreed on the certificate price.
Certificates
surrender
The obliged entity:
surrenders the certificate
The administrator:
Receives the certificate
then extinguishes it so that
it can no longer be used.
Also does an annual audit.
At least once annually, as determined by the
scheme’s rules.

99 | P a g e E n e r g y E f f i c i e n c y i n B u i l d i n g s
Define the source of funding
The scheme will be funded by an additional charge on electricity bills for
all users consuming > 300 kWh/month. Initially set at 0.2 sen/kWh, it will
rise at 0.1 sen/year over the second and third years. After the first three
years, the annual increase will then be 0.2 sen, with this increase
continuing until the 11th year (2028) when it will reach 2 sen/kWh, and
then remain at 2 sen/kWh.
The charge would need to cover:
The cost of certificate purchase by the obligated entity(ies)
The administration cost
Early costs associated with scheme establishment
An ongoing margin for government to fund other EE or RE policies
such as training, information campaigns, administration of MEPS,
etc.
A margin for the obligated entity(ies). The margin should be
sufficient to create incentive to the obligated entity(ies) to meet the
annual quota.
The charge would need to deliberately exclude the costs incurred
by the obligated entity(ies) in meeting any shortfall in their
obligations, so that there is also a strong dis-incentive for failing to
meet obligations. This should be structured so that say any
shortfall of 10% or greater in meeting the annual target creates an
overall loss for the obligated entit(ies)

100 | P a g e E n e r g y E f f i c i e n c y i n B u i l d i n g s
Require an effective measurement and verification (M&V)
program
For appliances savings will be deemed forward over the lifetime of the
unit. Savings to be based on a nominal appliance lifetime and based on
the difference between the annual energy consumption of the appliance
and that of a 2 star appliance that is at the MEPS cut-off level. The
lifetime for the purposes of deeming shall be the lesser of ten years or
the known appliance lifetime. A discount factor shall be applied to
account for uncertainty (discount factor to be no greater than 0.9)
Other activities will have either deemed savings or measured savings.
Calculation of deeming values should require the undertaking of trials
and measurement of actual savings, undertaken in accordance with the
International Performance Measurement and Verification Protocol
(IPMVP) to verify the lifetime benefit, using sample sizes that provide
80% certainty that the deemed savings are within plus/minus 20% of
actual. As discussed earlier a key flaw of at least one scheme has been
poor deeming which has created phantom savings.
Any measurement of savings for other activities will need to be based on
the International Performance Measurement and Verification Protocol
(IPMVP) with the aim of achieving 80% certainty that measured savings
are within plus/minus 20% of actual.
In all cases a discount factor of no greater than 0.9 shall be applied to
account for uncertainty. For example one of the factors to consider when
developing a discount factor could be that a new high efficiency air

101 | P a g e E n e r g y E f f i c i e n c y i n B u i l d i n g s
conditioner purchased under the scheme could go into a new apartment
that remained unoccupied for a long time.17
Adjust obligations at regular intervals.
The scheme will have a major review after 2 years. There will be a minor
review 4 years from commencement, and a major review 6 years from
commencement, at which point the timing of further reviews will be
decided.
Modelled savings achieved by a UEEO
The graphs below shows the savings, costs, benefits achieved by a
UEEO which operates for 20 years, based on a range of assumptions
following the graphs. Beware of assumptions
These graphs are indicative only, to aid in the assessment of whether a
UEEO will be implemented in Malaysia or not. Note modelling done for
the purpose of full scheme design (beyond the scope of BSEEP) may
produce a different set of number. Beware – assumptions can be
dangerous!
Note that the savings continue for another 10 years after the scheme
ends.
17 Portugal has used discount factors as low as 0.2, where savings are highly dependent on consumer
behaviour and consumers have an alternative to the EE equipment supplied. Portuguese energy
efficiency regulatory program (PPEC),
http://www.ure.gov.pl/download/1/6013/PortugueseenergyefficiencyregulatoryprogramPPECPedroVer
delho.pdf

102 | P a g e E n e r g y E f f i c i e n c y i n B u i l d i n g s
Figure 11 Malaysia's projected energy consumption, BAU and with a white certificate scheme.
The scheme would grow such that by 2034 electricity consumption
would be 9% below BAU.
-
50,000,000
100,000,000
150,000,000
200,000,000
250,000,000
20
18
20
19
20
20
20
21
20
22
20
23
20
24
20
25
20
26
20
27
20
28
20
29
20
30
20
31
20
32
20
33
20
34
20
35
20
36
20
37
Elec
tric
ty C
on
sum
pti
on
(M
Wh
)
Malaysia's projected electricity consumption, BAU and with a UEEO
Sum of Malaysia expected annual electricity consumption, BAU, assume linear growth to 2030, than a halving of thegrowth rate (MWh)*
Sum of Malaysia annual electrictity consumption after UEEO taken into account (MWh)
-
2
4
6
8
10
12
14
16
18
20
20
18
20
19
20
20
20
21
20
22
20
23
20
24
20
25
20
26
20
27
20
28
20
29
20
30
20
31
20
32
20
33
20
34
20
35
20
36
20
37
An
nu
al e
lect
rici
ty s
avin
gs (
mill
ion
MW
h),
an
nu
al G
HG
sa
vign
s (m
illio
n t
on
nes
CO
2-e
)
Projected annual electricity savings and GHG savings
Sum of Annual electricity savings (compared with year zero),million MWh
Sum of Annual GHG savings (million tonnes CO2-e)

103 | P a g e E n e r g y E f f i c i e n c y i n B u i l d i n g s
Figure 12 Projected annual electricity and GHG savings
By 2037 near 14 million tonnes of GHG would be being saved annually.
Overall he scheme is expected to save around 250 million MWh and 190
million tonnes of GHG.
Figure 13 Revenue raised by scheme and how it is distributed
By 2028 the scheme would:
Be providing employment for an estimated 13,000 people
Be providing RM 1.7b annually to directly fund EE measures
Over the scheme lifetime additional funds would be generated which
could be allocated to further stimulate EE and RE in Malaysia through:
Information, awareness raising and education
-
500
1,000
1,500
2,000
2,500
3,000
3,500
20
18
20
19
20
20
20
21
20
22
20
23
20
24
20
25
20
26
20
27
20
28
20
29
20
30
20
31
20
32
20
33
20
34
20
35
20
36
20
37
An
nu
al r
even
ue
(RM
mill
ion
)
Revenue raised by the scheme and where it goes
Sum of Surplus revenue for other EE/RE policy (RM million)
Sum of Revenue to scheme administrator (RM million)
Sum of Revenue to obligated entity(ies) (RM million)
Sum of Revenue to accretited persons (RM million)
Sum of Revenue to actually fund the EE measure (RM million)

104 | P a g e E n e r g y E f f i c i e n c y i n B u i l d i n g s
Funding retrofits of government buildings
Providing training
Providing funds for the expansion of MEPS and associated
administration, training and awareness raising costs.
Funding other policies not listed above.
Over the 20 years the scheme would provide over RM 4 billion in surplus
funds to government to invest in EE/RE. It would provide close to RM 25
billion in direct funding to EE. ESCOs and other accredited persons
would be expected to make RM 6 billion from the scheme, which would
help create a vibrant and strong EE industry in Malaysia. The obligated
entity(ies) would receive around RM 3 billion in revenue, which should
be more than adequate to cover the costs of personal required to
manage the trading of certificates. The administrator would get about
RM 1.6 billion in revenue.

105 | P a g e E n e r g y E f f i c i e n c y i n B u i l d i n g s
Figure 14 Costs and benefits to consumers
If the scheme were discontinued after 2036, benefits would continue to
flow to consumers. The overall expected value of electricity savings is
RM 100 billion, at a cost to consumers of RM 40 billion, leaving them RM
60 billion better off.
Modelling assumptions
Assumptions can be very dangerous, and its highly risky to assume they
are correct. Notes are made below on the various assumptions.
Assumptions used in the modelling presented above
That the scheme starts on 1 January 2018.
-
1,000
2,000
3,000
4,000
5,000
6,000
7,000
8,000
20
18
20
19
20
20
20
21
20
22
20
23
20
24
20
25
20
26
20
27
20
28
20
29
20
30
20
31
20
32
20
33
20
34
20
35
20
36
20
37
An
nu
al c
ost
s, b
enef
its
(RM
mill
ion
)
Costs and benefits to consumers
Sum of Value of electricity savings to consumers, MR million
Sum of Cost to consumers of tariff increase, MR million

106 | P a g e E n e r g y E f f i c i e n c y i n B u i l d i n g s
That in the absence of a UEEO Malaysia’s total electricity
consumption over the period 2018 to 2037:
Continues to grow at a rate of 4.26 million MWh/year (the same
average growth rate from 1990 to 2012) through to 2030. Based
on Energy Commission data at http://meih.st.gov.my/statistics
accessed March 2014.
From 2030 the rate of growth slows to half that.
This assumption seems reasonable, but is not based on any
evidence or any published study of forward electricity use.
An average electricity tariff of RM 0.40 which is stable over the
period. Note in reality tariff’s will rise, which will increase the value
of electricity savings.
One certificate = 1 MWh of electricity saved
An emissions factor of 0.75 tonne CO2-e/MWH (which is constant)
All measures produce deemed savings, with a lifetime of 10 years.
Or, in other words, if deemed savings of 1,000,000 MWh are
achieved in a year, that the actual savings in that year, and in
each of the following 9 years, is 1,000,000 MWh divided by 10 =
100,000 MWh. Note in reality there will likely be a mix of deemed
savings (which will have a range of deeming periods) and metered
savings, which the certificates are not deemed and must be
claimed each year based on metered reductions in electricity use.
The obligation in the first 11 years rises each year. The scheme
starts year 1 with 1 million certificates, 1.5 million in the second
year and 2 million in the third year. After three years it is expected

107 | P a g e E n e r g y E f f i c i e n c y i n B u i l d i n g s
the scheme will be running smoothly, and the target will then rise
by 2 million certificates a year, through to the 11th year when it will
reach 18 million certificates. The obligation will then remain steady
at 18 million certificates a year. Note that this will be determined
in the scheme design.
The charge to consumers starts at 0.2 sen/kWh in year 1, is 0.3
sen/kWh in year 2 and 0.4 sen/kWh in year 3. It then rises at 0.2
sen/kWh/year through to year 11, settling at 2 sen/kWh from then
on. Note that this will be determined in the scheme design.
Figure 15 Number of certificates surrendered, annual tariff charge above BAU
That electricity consumption equivalent to 80% of total Malaysian
electricity consumption is subject to the additional tariff charge. Its
-
1
1
2
2
3
-
2
4
6
8
10
12
14
16
18
20
20
18
20
19
20
20
20
21
20
22
20
23
20
24
20
25
20
26
20
27
20
28
20
29
20
30
20
31
20
32
20
33
20
34
20
35
20
36
20
37
Ad
dit
ion
al t
arif
f ch
arge
s ab
ove
BA
U (
sen
)
NU
mb
er o
f ce
rtif
icat
es s
urr
end
ered
(m
illio
n)
Number of certificates surrendered, additional tariff charge above BAU
Sum of Number of certificates surrendered (million)
Sum of Additional tariff charge (sen) above BAU

108 | P a g e E n e r g y E f f i c i e n c y i n B u i l d i n g s
assumed that this would represent all consumers using over 300
kWh/month. Note – this is a guess. I have no evidence that this is
the case.
That the market certificate price is steady at RM 120. Note.
Experience in the NSW and Victorian schemes in Australia shows
that whilst the price of certificates may be high in the first year or
two of operation, it may then drop considerably as industry
becomes more adept at delivering energy savings cost effectively.
If the certificate price drops, and the additional tariff charge
remains, this will create a large amount of surplus revenue for
government.
That the accredited persons creating certificates keep 20% of the
certificate price for themselves for administration/profit (ie RM 24).
Note – this is a guess. It will be up to each accredited person to
decide how much they want to keep, and how much they want to
pass onto the customer. As a market based mechanism there is
an incentive for accredited persons to minimise their costs to gain
market share. Additionally brokers may enter the market, at
intermediaries between the accredited persons and the obliged
entity(ies); brokers will want a slice of the cake too. The more that
accredited persons/brokers keep for themselves, the less incentive
there will be for consumers to adopt EE. Market forces should
balance it out.
That the administration fee on surrender of certificates starts high
at 20% in the first year, drops to 15% in the second year and 10%
in the third year (providing the administrator a fairly stable income

109 | P a g e E n e r g y E f f i c i e n c y i n B u i l d i n g s
of the first 3 years of around RM 24 million/year, drops to 8% in
year 4, then 1% a year in year’s 5, 6 and 7, and then remains
stable at 5%. Administrator revenue will continue to rise, however,
during the growth period of the scheme, and will then settle at RM
100 million/year. This will provide good levels of funding to provide
training, education, and very importantly to provide robust and
consistent measurement and verification to ensure the integrity of
the scheme. It can also contribute to the development and
maintenance of software and databases needed to effectively
manage the scheme. Note: This will be determined in the scheme
design.
That the obligated entity(ies) have a margin of 10% for admin
expenses. Note: The allowance for obliged entity margin will be
determined in the scheme design.
That revenue of RM 100,000/year will create 1 job in an admin
capacity (eg scheme administrator, administration work accredited
persons need to do, administration expense of the obliged
entities). Note – I have no reports or guidance to validate this
estimate.
That revenue of RM 300,000/year will create 1 EE job (e.g. ESCO
employment, additional employment by
manufactuers/importers/retailers of energy efficient appliances,
etc). Note – I have no reports or guidance to validate this estimate.

110 | P a g e E n e r g y E f f i c i e n c y i n B u i l d i n g s
Figure 16 Cost associated with 1 certificate, based on a certificate price of RM 120. *Note that additionally
the scheme administrator costs would be higher
Enabling Legislation
Possible ways of creating the enabling legislation are:
Incorporate it into the Electricity Supply Act (as has been done in
NSW, Australia)
Create a separate Act (as has been done in Victoria, Australia)
Links to both these pieces of legislation are included at the end of
this document.
If changes were to be made in the Electricity Supply Act a new part VB
could be incorporated into the Act.
0
20
40
60
80
100
120
140
160
Before trading of certificate After trading and onsurrender of certificate
RM
Costs associated with 1 certificate, with a certificate price of RM 120*
Scheme administrator costs
Obliged entity(ies) admin fee
Certificate price
Administration fee charged by accredited persons
Discount to customer

111 | P a g e E n e r g y E f f i c i e n c y i n B u i l d i n g s
Alternatively it could be incorporated in Part VA – Efficient use of
electricity – although a UEEO is substantially different to Part VA, and for
the purposes of clarity it would be better to have it has an entirely new
part.
Synergy with other policies, regulations and thrusts
A UEEO has synergies with a range of other policies and regulations:
Labelling and MEPS. A UEEO can use MEPS to allow certificates
for the purchase of 5 star appliances. This leverages the labelling
system
An energy efficiency rating tool for buildings. Improvements in
performance based on the rating tool could be used to award
certificates.
A national EE energy consumption database. This adds value to a
UEEO by facilitating measurement and verification of savings. For
example, if a lighting upgrade was undertaken and certificates
claimed under a UEEO for the upgrade, the actual drop in
electricity consumption at the site where the upgrade was
undertaken could be identified from a national energy consumption
date based. With appropriate database design, this could be used
to tune the methods used to calculate savings.
Building energy performance standards. Certificates could be used
to incentivise performance that was measured to be better than
the standard.

112 | P a g e E n e r g y E f f i c i e n c y i n B u i l d i n g s
Energy savings at large facilities (i.e. those facilities subject to the
Efficient Manager of Electrical Energy regulations) – based on
reductions in energy use certificates could be generated.
Promotion of ESCOs. ESCOs could create certificates from a
range of activities
Enabling of mortgages for EE in housing. The deeming
methodologies used under the scheme could be used as the basis
by which financial institutions can calculate the amount they can
lend for different EE features (such as high efficiency air
conditioning).
Need to allocate resources to analysing the data and fine tuning
policies
Examples of the level of incentive created by a UEEO
These example provide an idea of how a UEEO can incentivise the
uptake of energy efficiency. In a competitive market these measures
would be competing against other to sell certificates to the obligated
entity(ies), which may lower the certificate price.
In all cases the measures that can be implemented by the scheme need
to be approved by the regulator, industry should be given an option once
a year to put forward new measures.
All assumptions stated above with respect to electricity price, emissions
factor, certificate price, fee charged by the accredited person etc apply
to these examples. Its also assumed that in each deemed case an
overall uncertainty factor of 0.81 (0.9 x 0.9) applies

113 | P a g e E n e r g y E f f i c i e n c y i n B u i l d i n g s
Air conditioner upgrade (deemed method)
Refer to figure 7 The discount passed onto the consumer would be RM
384. A very high efficiency 5 star unit, such as the one shown in the
example, is estimated to cost RM 800 more than a 2 star unit. Over the
lifetime of the AC the consumer will be RM 1330 better off.
Shop lighting change (deemed method)
Assume a boutique shop in a shopping centre goes from halogen
downlights consuming 70 watts to LED downlights consuming 14 watts.
Assume lifetime of LED lamps is 25,000 hours. Assume shop is open for
7 days a week, 12 hours a day, closed for 5 days/year. Its estimated that
the lighting upgrade without certificates will cost RM250 per lamp
(installed), or for ten lamps a total of RM 2,500.
For ten lamps 11 certificates are created, creating a discount of RM
1056. Lifetime energy savings are worth RM 4,540. Over the lifetime of
the LED lamps the shop owner will be RM 3,090 better off.
Office fluorescent lighting change (deemed method)
Assume an office fitted with 1200mm T8 fluorescent fittings using
magnetic ballasts (most common form of lighting in offices over 7 years
old). Assume office lights are on 5 days a week for 10 hours a day, 50
weeks a year. Lights are replaced with LED tubes. Assume lifetime of
LED lamps is 25,000 hours. Its estimated that the lighting upgrade
without certificates will cost RM90 per lamp (installed), or for 100 lamps
a total of RM 9,000.

114 | P a g e E n e r g y E f f i c i e n c y i n B u i l d i n g s
For one hundred lamps 43 certificates are created, creating a discount of
RM 4,128. Lifetime energy savings are worth RM 17,000. Over the
lifetime of the LED lamps the office tenant will be RM 12,100 better off.
Building re-commissioning (metered method)
Assume a 30,000 m2 office building with a Building Energy Intensity
(BEI) index over the last three years averaging 250 kWh/m2/year.
Assume re- commissioning costs RM 300,000, and over the 12 months
following the recommissioning the BEI is 215 kWh/m2/year. There are
no changes to building use or occupancy.
1050 certificates are created, providing a discount of RM 100,800. The
energy savings over the 12 months are worth RM 420,000, and the
building owner is RM 220,800 better off.
Under the metered method certificates can only be claimed annually
once the savings have been measured. The rules of the scheme will
determine the number of years for which an annual claim can be made,
with measurement of actual savings still required each year.
Industrial process upgrade (metered method / expert assessment /
then deemed)
A factory is upgrading its old equipment. As all modern equipment is
more efficient than the old, energy savings are going to be realised in
any case. An industrial energy efficiency expert suggests, however, that
rather than spend RM 10m on the upgrade, an additional RM 1m more
should be spent on equipment that will use 15% less electricity than the

115 | P a g e E n e r g y E f f i c i e n c y i n B u i l d i n g s
equipment the company was originally proposing. The company decides
to go ahead with the new equipment.
Under the rules of the scheme, after the installation of the new
equipment an independent Certified Measurement and Verification
Professional with industrial experience examines the site. He identifies
firstly that the new equipment is much more efficient than the old. He
also does further research into the proposed cheaper equipment, and
does a detailed site examination and data logging. He carefully
calculates that the high efficiency equipment is using 13% less electricity
than the cheaper equipment would have used. The saving is 500 MWh
over 12 months, equivalent to 500 certificates a year.
The new equipment has an expected lifetime of 20 years. A uncertainty
factor of 0.5 is applied (the business may not be around in 20 years),
resulting in 5,000 certificates in total. This provides a discount of RM
480,000, with the energy savings over 10 years worth RM 2m.
This final measure is an illustration of how checks and balances might
be needed, and the challenge in creating scheme rules that are fair
whilst minimising the chance of fraud. It may be the case that a measure
such as this is only introduced after the scheme is well established and
good measurement and verification skills and methods exist.
A leadership opportunity
By adopting a UEEO Malaysia has the opportunity to lead the way in SE
Asia in being the first to adopt this emerging policy measure.

116 | P a g e E n e r g y E f f i c i e n c y i n B u i l d i n g s
Over the last three years smart phones have become ubiquitous and by
the time the scheme starts the clear majority of Malaysians are likely to
own a smart phone. Malaysia has the opportunity to use smart phones
linking through to a web-based database to facilitate the administration
of the scheme, and which reduces the time spent on administrative tasks
by all participants in the scheme. To the best of my knowledge this is not
being done anywhere else yet.
By linking through to a national EE consumption database, which would
be populated directly from meter data collected by the three electrical
utilities Malaysia would also be leading the way globally.
By using certificates as a central policy about which forms the basis of
incentives across industry, buildings and appliances, and even
potentially to RE, Malaysia has the opportunity to demonstrate how
UEEO can be leveraged in a way that reduces duplication of effort and
uses the force of the market to deliver least cost reduction of energy
related carbon emissions.
If, however, there is not strong commitment to a sustained, long term
UEEO and if scheme design and development, governance,
administration, measurement, verification, evaluation and enforcement is
not well undertaken or not well resourced a UEEO should not be
implemented. It is a complex measure that is likely to be a costly failure
in the absence of strong commitment and resourcing.

117 | P a g e E n e r g y E f f i c i e n c y i n B u i l d i n g s
APPLIANCE AND EQUIPMENT
STANDARDS & LABELLING
SUMMARY
Standards and Labelling (S&L) of appliances and equipment is widely
recognised as being a highly cost-effective EE policy measure. S&L is
the most widely used EE policy measure globally.
Malaysia, via a 2013 amendment to the Electricity Supply Act, restricts
the sale of domestic equipment, low voltage equipment usually sold
directly to the public, and low voltage equipment that does not require
special skills in its operation, unless approved by the Energy
Commission. It stipulates that in order to be approved a number of high
energy using residential appliances need to meet certain minimum
energy performance requirements (MEPS) and have an energy
efficiency label, as determined by the EC.
The EC is now planning to expand the scope of coverage.
In the APEC region S&L is widely used. However this is little consistency
between programs, and in some countries the focus appears to be on
appliances that use relatively little energy compared with major items of
equipment used in buildings which could provide much greater economic
benefit with mandatory S&L requirements.
International experience shows that the Measurement, Verification and
Evaluation (MV&E) of S&L programs is often a weak link in such

118 | P a g e E n e r g y E f f i c i e n c y i n B u i l d i n g s
programs. Even relatively small percentage failure rates in compliance
can result in significant lost savings. Sufficient resourcing of MV&E
provides an outstanding return on investment and reduces the likelihood
of product being dumped in Malaysia.
Its suggested that Malaysia have four areas of policy focus around S&L:
1. Additional products for the expansion of S&L should be selected
based on their economic benefit. This means creating a new
mechanism to enable MEPS to expand from just a residential
appliance focus, where a Certificate of Approval (COA) applies, to
also covering equipment used in the commercial and industrial
sectors, without the need for a COA.
2. The roll out of additional products should happen in accordance
with a long term plan, which needs to be developed.
3. Malaysia should be better resourcing its capacity to administer and
enforce compliance with standards and labelling regulations,
including establishing a dedicated department to do this.
4. Malaysia can continue to play a role in harmonisation, particularly
around testing standards. As a small country that exports air
conditioners Malaysia has more to win than lose out of
harmonisation.
PURPOSE OF THIS DOCUMENT
Malaysia is committed to Standards and Labelling (S&L) of appliances
and equipment, and is planning to expand the range of products subject
to mandatory S&L requirements. The purpose of this document to

119 | P a g e E n e r g y E f f i c i e n c y i n B u i l d i n g s
examine global experience with S&L and to provide suggestions for the
expansion of S&L whilst also learning from international best practice.
STANDARDS AND LABELLING IN MALAYSIA
Malaysia introduced Minimum Energy Performance Standards (MEPS)
in 2013, as an amendment18 to the electricity supply regulations 1994.
After a 1 year transitionary period, enforcement of MEPS is legislated
from April 2014. The Demand Side Management unit of the Energy
Commission is responsible for MEPS.
MEPS applies to refrigerators, fans, air conditioners and televisions and
lamps. Labelling is now also required by the EC for refrigerators, fans,
air conditioners and televisions. Voluntary labelling was first introduced
in 2005, and removed at the end of 2012.
Whilst during the voluntary labelling period Malaysia had both an
endorsement and comparative label, it is now using a comparative label
only.
18 Electricity Supply Act 1990, Electricity (Amendment) Regulations 2013,
http://www.st.gov.my/images/article/polisi/regulation_suruhanjaya/20130503_P_U__A_151-
PERATURAN_-_PERATURAN_ELEKTRIK_PINDAAN_2013.pdf

120 | P a g e E n e r g y E f f i c i e n c y i n B u i l d i n g s
Figure 17 - Malaysian Energy Labels
GLOBAL AND REGIONAL EXPERIENCE WITH
MEPS
MEPS was introduced nearly 40 years ago in California in response to
the oil crisis at the time.
Progressively tightened MEPS standards in California resulted in a 75%
reduction in energy use in refrigerators over a 30 year period.19
Equipment labelling and MEPS are now used widely globally. The table
below shows the application of labelling and MEPS in the APEC region20
19 Energy-Efficiency Labels and Standards: A guidebook for appliances, equipment and lighting.
Collaborative Labeling and Appliance Standards Program (CLASP), 2005.
Comparison Label Endorsement Label
(discontinued)

121 | P a g e E n e r g y E f f i c i e n c y i n B u i l d i n g s
Table 8 Application of labelling and MEPS in APEC
Country Voluntary labels Mandatory labels MEPS
Brunei
Darusslam
Central AC under consideration
Hong
Kong
Computers, rice cookers, clothes
dryers, ballasts, LED lighting, office
imaging equipment, water coolers,
televisions, hot water heaters, and
petrol-powered vehicles
Room air conditioners,
refrigerators, CFL lamps,
washing machines,
dehumidifiers
Indonesia Refrigerators, heaters, air
conditioners,
CFL lamps Chillers, packaged AC,
lighting systems
Japan Air conditioners, fluorescent lights,
solid state lighting, televisions,
refrigerators and freezers, water
heaters, cooking equipment,
monitors, computers and peripherals,
printers, fax and copy machines,
transformers, heated toilet seats,
No MEPS, but a “Top
Runner” program which is
prescribed by law. All
products in a category have
to reach the performance of
the best product over a
period of time. Covers 23
products
Korea 41 products including induction
motors, boilers, lighting equipment,
insulation, computers, etc.
22 products; air conditioners,
refrigerators, dishwashers,
etc
22 products; air conditioners,
refrigerators, cooktops, etc.
Malaysia Refrigerators, televisions,
fans, air conditioners
Refrigerators, televisions,
fans, air conditioners, lamps
Philippines ACs, refrigerators, freezers,
ballasts, lighting systems,
freezers, lighting. Label
requirements for other light
types developed but not yet
implemented.
ACs, fluorescent and CFL
lamps, lighting systems.
Standards for other light
types developed but not yet
implemented.
20 Using the database at http://www.clasponline.org/Tools/Tools/EconomyFinder

122 | P a g e E n e r g y E f f i c i e n c y i n B u i l d i n g s
Country Voluntary labels Mandatory labels MEPS
Singapore Coffee machines, dishwashers,
televisions,
Refrigerators, air
conditioners, clothes dryers
Air conditioners,
refrigerators,
Taiwan 28 product categories.
ACs, refrigerators, TVs, lamps,
clothes washers & dryers,
monitors, instantaneous gas water
heaters, electric storage tank
water heaters, electric pots, exit
lights and emergency direction
lights, luminaires, etc
Air conditioners,
refrigerators, freezers,
cooktops, dehumidifiers, hot
water heaters,
Air conditioners, water
chillers, refrigerators, central
heaters, fluorescent lamps &
ballasts, chillers (pending
implementation),
dehumidifiers, motors,
ceiling fans, hot water
heaters
Thailand Computers, kettles, microwaves,
rice cookers, central AC, room
AC, washing machine, fluorescent
ballasts, CFL, imaging equipment,
refrigerator, standby power for all
equipment, televisions, miscl. AV
equipment, fans, water heaters.
Also LPG stoves, variable speed
drives, glazing, insulation
Kettles, AC, CFL, motors,
Vietnam imaging machines, televisions, Rice cookers, ACs, washing
machines, fluorescent
ballasts, CFL lighting,
motors, transformers,
refrigerators, ceiling fans
Pending implementation:
refrigerated cabinet
Incandescent lighting,
lighting systems,
Pending implementation: rice
cookers, ACs, washing
machines, fluorescent
ballasts, CFL lighting, HID
lighting, motors, imaging
machines, transformers,
refrigerated cabinet,
televisions, ceiling fans,
water heaters,

123 | P a g e E n e r g y E f f i c i e n c y i n B u i l d i n g s
The Malaysian experience in moving from voluntary labelling to
mandatory labelling and MEPS is not unique, and in the region as a
whole, as is the case globally, S&L programs are expanding to cover a
greater range of appliance and equipment.
On the other hand, the APEC region has not yet take the opportunity to
cut the costs of labelling and MEPS through harmonisation of labels and
MEPS levels.
Reviewing the above it can be seen that almost all countries have labels
or MEPS for refrigerators, air conditioners, televisions and lighting, but
otherwise there is large variation from country to country.
For these common appliances, however, harmonisation has a range of
technical obstacles, due to differences in test procedures, product scope
and definition, key performance characteristics and energy levels.21
The greatest scope for harmonisation is in:
Voluntary use of Energy star labelling, which occurs in several
APEC countries
The adoption of international test standards.
Malaysia has tended to adopt IEC test standards, and recognises the
results from any testing laboratory that is APLAC or ILAC22 approved,
which is an excellent approach.
21 Energy efficiency standards and labelling in Asia, ICF, March 2011.

124 | P a g e E n e r g y E f f i c i e n c y i n B u i l d i n g s
Improving the impact of labelling and MEPS programs
The Survey of market compliance mechanisms for energy efficiency
programs in APEC economies (2012), focussed on labelling and
standards, identified the following key recommendations to improve
compliance:23
Governments and government agencies need to be more aware of
the importance of the establishment and operation of effective
Measurement, Verification and Evaluation (MV&E). More
resources should be invested into MV&E to “ensure the integrity of
their S&L programs”
Operational guidelines that transparently detail MV&E procedures
and are available to stakeholders both facilitate compliance and
reduce misunderstandings and disputes. They should be
accompanied by communications from government that indicate
government is serious about following and implementing the
MV&E procedures, including the levying of penalties for non-
compliance.
Access to competent laboratories is a common problem.
Governments are urged to maintain lists of competent laboratories
22 APLAC: Asia Pacific Laboratory Accreditation Cooperation; ILAC: International Laboratory
Accreditation Cooperation.
23 Survey of market compliance mechanisms for energy efficiency programs in APEC economies,
APEC energy working group expert group on energy efficiency and conservation, May 2012.
http://www.clasponline.org/Resources/Resources/PublicationLibrary/2012/~/media/Files/SLDocument
s/2012/MVEworkshop/APEC-MVEsurvey-FullReport.pdf

125 | P a g e E n e r g y E f f i c i e n c y i n B u i l d i n g s
in the APEC region and make them available to stakeholders,
whilst also agreeing to regularly test the same products in different
laboratories for the purposes of improving test methods and
enhancing collaboration.
Greater coordination of verification testing and sharing of test
results should take place, particularly as there are many common
products traded within APEC. This can both lower costs and
increase the range of eligible products available.
Governments should endeavour to improve their dialogue with
industry.
SUGGESTIONS FOR MALAYSIA
Malaysia is now in the stage of moving out of the transition period for its
initial round of MEPS products, and retailers are gradually coming to
grips with the reality of the new requirements.
Malaysia is clearly committed to standards and labelling, and has taken
due consideration of the costs and benefits. Costs of S&L include the
costs to manufacturers and retailers, costs to consumers of more
expensive products (initially), and the public cost to taxpayers of
program administration. The benefits include reduced energy
consumption, better quality products, greater global competitiveness for
Malaysian industry.
Malaysia’s commitment is evidenced by its plans to introduce additional
products for mandatory labelling and MEPS.
126 | P a g e E n e r g y E f f i c i e n c y i n B u i l d i n g s
For the scheme going forward the following is suggested:
1. Additional products for the expansion of S&L should be selected
based on their economic benefit. This means creating a new
mechanism to enable MEPS to expand from just a residential
appliance focus, where a Certificate of Approval (COA) applies, to
also covering equipment used in the commercial and industrial
sectors, without the need for a COA.
2. The roll out of additional products should happen in accordance
with a long term plan, which needs to be developed.
3. Malaysia should be better resourcing its capacity to administer and
enforce compliance with standards and labelling regulations,
including establishing a dedicated department to do this.
4. Malaysia can continue to play a role in harmonisation, particularly
around testing standards. As a small country that exports air
conditioners Malaysia has more to win than lose out of
harmonisation.
One. Select additional products for S&L based on their
economic benefit
Targeting products that use a lot of energy and where there is
opportunity for cost-effective savings by making them more efficient
provides substantial economic benefit, improving energy security and
reducing GHG emissions.

127 | P a g e E n e r g y E f f i c i e n c y i n B u i l d i n g s
S&L in Malaysia began with a focus on residential appliances, and
initially has targeted those home appliances which use the most energy.
The initial products selected include refrigerators (1 and 2 door only),
single split system wall mounted air conditioners (up to 7.1 kW),
televisions up to 70”, wall, desk, pedestal or ceiling fans, and tubular
fluorescent, compact fluorescent, LED and incandescent lamps.
This targets the main areas or electricity consumption in a home, which
is guesstimated as per the graph below.
Figure 18 Guesstimated average residential daily energy consumption (kWh). In 2012 average daily
consumption was 9 kWh.
Malaysia plans is to expand this to other domestic appliances, including
rice cookers (identified as contributing to peak demand), instantaneous
single phase water heaters (becoming much more popular in Malaysia)
and vacuum cleaners. Washing machines and dryers have been
considered, however the lack of domestic testing capability means that
this is no longer considered.

128 | P a g e E n e r g y E f f i c i e n c y i n B u i l d i n g s
Residential energy use, however, only accounts for 21% of Malaysian
electricity consumption with commercial (33%) and industrial (45%) the
main users. The expansion of MEPS to cover equipment used in the
commercial and industrial sectors is therefore recommended.
Figure 19 Malaysia’s Electricity Consumption, 2012
Commercial buildings include offices, schools, health care facilities,
shopping centres, shops, hotels, restaurants, etc.
In many of these buildings, such as offices, shopping centres and hotels,
the bulk of commercial electricity consumption is for air conditioning and
ventilation.

129 | P a g e E n e r g y E f f i c i e n c y i n B u i l d i n g s
Figure 20 - Guestimated average office daily electricity consumption
The industrial sector in Malaysia is comprised of oil and gas
exploration, steel, cement, automotive, electrical and electronics
manufacturing, food production. These use energy in very different
ways, and so far no study has been done to breakdown industrial energy
consumption by sector or identify the major energy users in each sector.
Common across all sectors will be the use of electric motors, lighting –
much of which will be High Intensity Discharge (HID), lighting and
possibly the use of compressed air.
The food sector, along with supermarkets and food service businesses,
will use refrigeration.
Obvious candidates for MEPS are therefore:
Commercial air conditioning and ventilation
Electric motors
Air compressors

130 | P a g e E n e r g y E f f i c i e n c y i n B u i l d i n g s
Commercial and industrial refrigeration
Further opportunities can be identified by analysis of energy
consumption data and site surveys/audits of different sectors to identify
the items of equipment that use more energy.24
The table below estimates the potential for energy savings in rough
terms across the whole economy
24 For undertaking an economic impact assessment, the use of the Collaborative Labeling and
Appliance Standards Program (CLASP) Policy Analysis Modeling System (PAMS) could be
considered. This can be used to identify which products can provide the greatest economic benefit,
but relies on accurate data, which it may not be possible to get.

131 | P a g e E n e r g y E f f i c i e n c y i n B u i l d i n g s
Table 9 - Rough estimate of savings potential from S&L for various products
Product category Diversity of those
product types which
contribute to the bulk
of energy use in the
economy
Estimated Economy
wide energy use
Estimated cost
effective savings
potential per unit
Likely relative
overall savings
potential
Air conditioning
(including inbuilt
fans)
Moderate High Moderate to
high
High
Lighting Moderate Moderate to high Moderate* Moderate
Electric motors Moderate Extremely high.
Likely to account for
over 50% of
electricity use
Low** Low to moderate***
Electronics (TVs,
computers, power
supplies, etc)
Moderate to High Low to moderate Moderate to
high
Low to Moderate
Refrigeration High Moderate Moderate Low to Moderate
Windows# High Moderate Moderate Low to Moderate
Air compressors Moderate Low to Moderate Low to moderate Low
Cooking equipment High Low to moderate Low to moderate Low
Hot water heating Low Low Low Very low
# Windows are considered with respect to the impact they have on air-conditioning loads
* LED lighting makes MEPS for lighting likely to yield more savings than in the past
** Motors will vary in efficiency from around 20% (small shaded pole motors) to over 95%
(large 3 phase motors). Whilst there is very large savings potential from these small motors,
they don’t represent a large portion of total motor energy use.
*** Many of the motors in use in Malaysia will come embedded in imported products, where
the enforcement of MEPS may not be practical.

132 | P a g e E n e r g y E f f i c i e n c y i n B u i l d i n g s
Enabling MEPS for equipment
Currently MEPS in incorporated in the Certificate of Approval (COA)
used to verify the safety and quality standards of new appliances. SIRIM
has been contracted by ST to produce the COA.
Commercial and industrial equipment, such as chillers, don’t need a
COA. A new mechanism should be introduced to enable the application
of MEPS to commercial and industrial equipment. Options for this could
include:
Not requiring any COA, but rather requiring manufacturers,
importers or supplies to undertake:
Testing to prove energy performance
Registration of the product, along with the test results that
demonstrate compliance.
Relying on self-enforcement, with spot checks. If punitive
measures were to be introduced to encourage compliance,
this may need to be regulated.
In addition to the above, requiring a “MEPS only” COA for the
prescribed equipment subject to MEPS. This would require an
amendment to the Energy Commission Act.

133 | P a g e E n e r g y E f f i c i e n c y i n B u i l d i n g s
Tightening MEPS and labelling levels
To facilitate the progressive tightening of MEPS and labelling levels, the
Electricity Supply Act 2013 amendment should be changed to remove
the inclusion of the MEPS energy levels and star rating levels from the
legislation, and to place these rather in regulations managed by the
Energy Commission. This streamlines the process of tightening,
eliminating the time and expense of having to create an amendment in
the Electricity Supply Act each time product standards are tightened.
For the same reason, the legislation could also be amended such that
the Energy Commission can add (and remove) products subject to S&L
requirements through regulation, rather than having to re-legislate.
Accompanying this change would be an amendment to the Energy
Commission Act, giving the EC the power to add or remove products
under L&S requirements and to tighten or change regulation around
existing products.
Two. Roll out appliances to a long term plan
Long term planning can facilitate the uptake of new labelling and MEPS
requirements and provides industry with advance notice, reducing the
possibility that they will be left with non-compliant stock when the
regulations come into effect, and also making enforcement easier.
Ideally a ten year play would be developed, which shows when new
products will be introduced, and when requirements for existing products
will be tightened.

134 | P a g e E n e r g y E f f i c i e n c y i n B u i l d i n g s
Three. Better resource capacity to administer and enforce
S&L
As the transition period during the first year of mandatory S&L drew to a
close it appeared as though compliance with the new regulations would
be slower than expected.
Of crucial importance in the remainder of the 10th Malaysian plan and in
the 11th Malaysian plan will be clearly establishing the authority of the
Energy Commission to ensure high compliance with S&L. As more
products are rolled out the workload will increase, and further resourcing
will be required.
As a rough estimate, full compliance with the current MEPS in any one
year will result in MR 300m of energy savings over the lifetime of the
compliant products.
As the savings are so high, the cost of even a small amount of non-
compliance is very high. Assume for example that sampling of
refrigerators sold finds that on average they use 3% more energy than
that specified by MEPS. If its assumed that 220,000 refrigerators are
sold annually in Malaysia25, and the average consumption is 450 kWh, at
an electricity price of MR 0.40/kWh, the annual cost of the extra energy
25 For Malaysia, assuming 5 people per household, 1 fridge per house, an average lifetime of 15
years, and a population of 28 million.

135 | P a g e E n e r g y E f f i c i e n c y i n B u i l d i n g s
used is RM 1,200,000. (Example adapted from the CLASP MV&E
guidebook).
Poor enforcement of compliance also creates the risk of poor quality and
inefficient products being dumped in Malaysia.
The CLASP Measurement, Verification and Evaluation (MV&E)
guidebook (2010) 26 shows in the figure below how poor levels of
enforcement can erode the credibility and effectiveness of a S&L
program.
Figure 21 – The compliance cicle. From Compliance counts: A practitioners Guidebook on Best Practice
Monitoring, Verification, and Enforcement for Appliance Standards and Labeling. CLASP, 2010.
http://www.clasponline.org/Resources/MVEResources/~/media/Files/SLDocuments/2006-2011/2010-
09_MVEGuidebookSingle.pdf
26 Compliance counts: A practitioners Guidebook on Best Practice Monitoring, Verification, and
Enforcement for Appliance Standards and Labeling. CLASP, 2010.
http://www.clasponline.org/Resources/MVEResources/~/media/Files/SLDocuments/2006-2011/2010-
09_MVEGuidebookSingle.pdf

136 | P a g e E n e r g y E f f i c i e n c y i n B u i l d i n g s
The value of resources allocated to ensure compliance should be based
on the value of non-compliance.
A rough estimate would be that over one year:
If on average there was a 5% non-compliance rate (ie products
that perform at the average level before MEPS was introduced) for
the air conditioners, fridges, televisions and fans that are now
subject to MEPS
This would result in Malaysia consuming an additional 50 GWh
over the lifetime of the units, costing the appliance owners an
additional RM 24m.
If its assumed electricity has an average subsidy of 20%, then the
direct cost to government would be RM 4.8m.
On this basis, and as a rough estimate, it would likely not be
unreasonable to allocate around RM 3m annually over the period 2015
to 2017 for the purposes of administration and MV&E of Malaysia’s S&L
program 27 . This funding should be sufficient to establish rates of
compliance so as to inform future MV&E budgets and to administer
enforcement. Rather than rely on this estimate, a complete M&V budget
should be developed, using the guidance in the CLASP MV&E
guidebook.
27 Roughly allows for the cost of employing say 7 staff, undertaking around 500 to 1,000 verification
tests a year, undertaking say 2,000 store visits a year, and prosecuting 5 to 10 cases of infringement
a year, and commission an expert review after 3 years. Also includes cost of workshops and other
engagement with industry, including development and distribution of guidelines.

137 | P a g e E n e r g y E f f i c i e n c y i n B u i l d i n g s
The development of operational guidelines that transparently detail
MV&E procedures is also recommended.
Finally education and public information around S&L can help create
informed consumer demand for efficient products. A website such as
www.energyrating.gov.au could be set up to aid this.
Four. Participate in harmonisation of S&L in the region
Malaysia is encouraged to continue to participate in harmonisation of
S&L in the region, particularly around products that it exports.
Specifically it’s suggested that this be around testing procedures, such
that the results of tests suited to one country, can be interpreted and
applied to the S&L regime in another country, without having to
undertake additional tests.
SYNERGIES WITH OTHER POLICY MEASURES
A Utility Energy Efficiency Obligation (UEEO) – also known as a
white certificate scheme - is highly synergistic, as S&L can be used as
the basis for deeming factors used when generating certificates from the
purchase of high efficiency appliances.
Equipment S&L has synergies with building energy efficiency
standards. However rather than being additional, equipment S&L and
building EE standards can be viewed as mutual “fail-safe” mechanisms
that improve the overall rate of compliance and thus energy savings.
When modelling the impact of both these policies appropriate discount

138 | P a g e E n e r g y E f f i c i e n c y i n B u i l d i n g s
factors need to be used to account for the redundancy involved in having
two policy measures focussed on the same outcome.
A National building energy efficiency database can contribute to
evaluating the effectiveness of S&L.

139 | P a g e E n e r g y E f f i c i e n c y i n B u i l d i n g s
BUILDING PERFORMANCE
DISCLOSURE
SUMMARY
Mandatory disclosure of building energy performance has been shown
to be effective in reducing energy consumption in commercial buildings.
This is achieved by drawing energy consumption and comparative
performance to building owners, occupiers, tenants and buyers, and
thus providing competitive market advantage to better performing
buildings. In the residential sector energy saving results are less clear,
although there is evidence that property values and rental yields go up
as homes become more efficient.
Malaysia mandatory disclosure could lead to energy savings worth
roughly RM 325 million annually, with the benefit being approximately
seven times the direct compliance costs. GHG savings could reach 0.6
million tonnes annually with 250 people provided with permanent
employment.
Setting up a scheme would take approximately 18 months of preliminary
work prior to launch. Mandatory annual disclosure is initially
recommended for large office tenancies and common property areas in
larger buildings consuming over 1,000 MWh/year. Over five years the
scheme should be tightened to eventually cover all non-industrial
buildings consuming over 200 MWh/year.

140 | P a g e E n e r g y E f f i c i e n c y i n B u i l d i n g s
Existing regulation can be modified to enable building energy
performance disclosure. Excess government revenue from a Utility
Energy Efficiency Obligation (UEEO) or White Certificate scheme could
be used to fund early incentives which would be withdrawn over the first
three to five years. Penalties would drive the necessary compliance to
ensure that the scheme is widely adhered to, which is essential for its
success.
WHAT IS BUILDING PERFORMANCE
DISCLOSURE?
Building performance disclosure and building ratings are two terms that
may be used to characterise a building. However, there is a distinction
between an asset rating and actual operational building energy use.
An asset rating refers to the design features and construction of the
building. This may encompass just “passive” features of the buildings
(such as type of glazing, R rating of insulation in walls, floors and ceiling,
amount of shading) or it may encompass both “passive” and “active”
features of the building such as the type of lighting and light power
density. Ratings often are developed by taking data on the
characteristics of the building, inputting this into modelling software,
which is then used to simulate/estimate what the energy consumption of
the building would be when operated in a “standard” way. Ratings can
be generated for both existing buildings and buildings which have been
designed but not yet built.

141 | P a g e E n e r g y E f f i c i e n c y i n B u i l d i n g s
On the other hand the building operational energy use typically refers to
the actual energy consumption of the building. This may or may not be
normalised for factors such as occupancy, hours of use, etc. via the use
of software that enables a comparative rating with other buildings. At its
simplest level operational building performance is the energy use per
gross square meter of floor area. Alternatively operational energy use
may be split between “base building” and “tenancy”, have a carefully
prescribed description of various exclusions to make when calculating
building area, and enable - assuming appropriate metering
arrangements are present - for different building uses to be accounted
for (e.g. a building which is predominantly an office, but also has shops
and a data centre in it).
Generally practice globally is for residential building performance
disclosure to be undertaken as an asset rating. Possibly this is because
of the considerable variation that may exist in actual operational energy
use, which is highly dependent on the number of occupants and the
hours that the house is in use. For example a three bedroom home with
a single occupant, employed professionally, who travels frequently, is
likely to use less energy than the same home occupied by a family with
two children and the grandparents living in it.
On the other hand, non-residential building performance disclosure of
existing buildings is typically based on the operational energy use. For
non-residential buildings patterns of occupancy are generally much more
consistent than for residential buildings.

142 | P a g e E n e r g y E f f i c i e n c y i n B u i l d i n g s
When developing a building performance assessment tool there are a
wide range of considerations. The Institute for Market Transformation
has compared seventeen building performance assessment systems
and proposes a classification framework for building energy performance
tools. 28 This recommended classification criteria is shown below and
provides a useful framework when considering building performance
disclosure.
28 Comparing Building Energy Performance Measurement – A framework for international energy
efficiency assessment systems. D. Leipziger, May 2013, Institute for Market Transformation.
http://www.imt.org/uploads/resources/files/ComparingBuildingEnergyPerformanceMeasurementFINAL

143 | P a g e E n e r g y E f f i c i e n c y i n B u i l d i n g s
Figure 22 Classification criteria for building energy performance measurement. Comparing Building
Energy Performance Measurement – A framework for international energy efficiency assessment
systems. D. Leipziger, May 2013, Institute for Market Transformation.
http://www.imt.org/uploads/resources/files/ComparingBuildingEnergyPerformanceMeasurementFINAL.p
df

144 | P a g e E n e r g y E f f i c i e n c y i n B u i l d i n g s
A range of ISO standards have now been developed to aid in the
development of methods for the assessment of building energy
performance. ISO 16343:2013 sets out ways of expressing the energy
performance of a building in an energy performance certificate.29 ISO/TR
16344:2012 provides definitions of terms used in determining the energy
performance of buildings.30 ISO 16346:2013 defines procedures used to
assess the energy performance of buildings.31
These standards are so recent that acquiring data on adoption by any
country has not been possible.
WHY DISCLOSE BUILDING PERFORMANCE?
Building performance disclosure is believed to address the information
gap that hinders the uptake of energy efficiency. It is believed to add to
property value, and provide a driver for improving building energy
performance.
29
http://www.iso.org/iso/home/store/catalogue_tc/catalogue_detail.htm?csnumber=56224&commid=534
76
30
http://www.iso.org/iso/home/store/catalogue_tc/catalogue_detail.htm?csnumber=56225&commid=534
76
31
http://www.iso.org/iso/home/store/catalogue_tc/catalogue_detail.htm?csnumber=56226&commid=534
76

145 | P a g e E n e r g y E f f i c i e n c y i n B u i l d i n g s
GLOBAL EXPERIENCE WITH BUILDING
PERFORMANCE DISCLOSURE
Where practiced
Building performance disclosure occurs in various parts of the USA,
across the European Union, and in Australia. Brazil and China also have
systems, but these appear to be more voluntary green building rating
tools for new buildings rather than disclosure of actual measured
performance. 32 In addition to the above, building performance labels
have been developed in a range of other countries and cities, including
Turkey, Tokyo, Shanghai, Canada and South Africa.33
The table below shows the coverage of some of the national systems.
32 Brazil and China also have systems, but these appear to be voluntary and with low uptake. For
Brazil refer to http://www.procelinfo.com.br/main.asp?View={89E211C6-61C2-499A-A791-
DACD33A348F3}. For China it is difficult for this author to determine the coverage of ratings, which
are administered by the Ministry of Housing and Urban-Rural Development (MOHURD –
http://www.mohurd.gov.cn) – for English language commentary refer to
http://www.institutebe.com/InstituteBE/media/Library/Resources/Green%20Buildings/Fact-
Sheet_Green-Building-Ratings_China.pdf
33 http://www.buildingrating.org/content/energy-label-gallery

146 | P a g e E n e r g y E f f i c i e n c y i n B u i l d i n g s
Table 10 Building Energy Rating and Disclosure Policies. The Institute for
Market Transformation.
http://www.imt.org/uploads/resources/files/6.26Int_l_Rating_Policy_FACTSHE
ET_41.pdf
In the USA disclosure has been voluntary, but more state and local
governments are now requiring mandatory performance disclosure. This
includes California and Washington, and the cities of Washington DC,
Austin, New York, Seattle, San Francisco, Philadelphia, Minneapolis and
Boston. In all cases disclosure is via use of the Energy Star Portfolio
Manager, a free on-line software tool developed by the EPA in the
USA.34 Typically disclosure is required annually, encompassing annual
energy use and building characteristics including gross floor area,
operating hours, number of people occupying the building and what the
building is used for. 35 Disclosure is typically mandatory for buildings
34 Energy Star Portfolio Manager. http://www.energystar.gov/buildings/facility-owners-and-
managers/existing-buildings/use-portfolio-manager
35 For example, refer to the City of Boston’s user guide:
http://www.cityofboston.gov/images_documents/Draft%20User%20Guide%203%2021%202014_tcm3
-42713.pdf

147 | P a g e E n e r g y E f f i c i e n c y i n B u i l d i n g s
above a certain size, usually 50,000 square feet (4,645 m2). Depending
on the city/state, building performance data may36 or may not be publicly
available. It is worthwhile to note that data for over 350,000 buildings
has been entered into Energy Star Portfolio Manager.
36 Example of public disclosure - New York City:
http://www.nyc.gov/html/gbee/html/plan/covered_buildings_list.shtml

148 | P a g e E n e r g y E f f i c i e n c y i n B u i l d i n g s
Figure 23 – Sample Energy Star Statement of Energy Performance
In addition to disclosure of building performance some of the US
schemes have required identification of energy saving opportunities. In
New York, for example, an ASHRAE (American Society of Heating,
Refrigeration and Air Conditioning Engineers) accredited assessor is
required to undertake a building audit.

149 | P a g e E n e r g y E f f i c i e n c y i n B u i l d i n g s
The European Union’s Energy Performance of Building Directive 2002
was revised in 2010. As only 1.1% on average of buildings in Europe are
new each year, there is strong focus on existing building stock,
particularly residential. Within this directive is the mandatory disclosure
of energy performance whenever a dwelling is sold or rented, via an
Energy Performance Certificate (EPC). Whilst each country has
prepared their own system, broadly the EPC is based on an examination
of the building by an accredited assessor, who inputs building data into
software in order to generate a rating. This includes data about building
construction (e.g. type of glazing, level of insulation etc.) but does not
necessarily include data on actual energy consumption. It generally also
includes an energy audit. In France the EPC rating must be included in
any advertisement for the property, however in other countries it is only
communicated during the sale or lease transaction.37
The disclosure requirements also stipulate periodic certification of
buildings owned by public authorities and are frequently visited by the
public. An example would be the UK’s Display Energy Certificates
(DECs), which are required for public buildings of greater than 500m2,
and are based on normalised actual energy use.38 For buildings of less
than 1,000 m2 the DEC is valid for 10 years, for buildings of 1,000m2 or
37 Energy Efficiency in Europe – Overview of Policies and Good Practice. European Energy Network,
2013. http://www.buildup.eu/sites/default/files/content/EnR-EEE-Broch-PaP-web.pdf
38 A guide to display energy certificates and advisory reports for public buildings, Department for
Communities and Local Government, December 2012.
https://www.gov.uk/government/uploads/system/uploads/attachment_data/file/51164/A_guide_to_disp
lay_energy_certificates_and_advisory_reports_for_public_buildings.pdf

150 | P a g e E n e r g y E f f i c i e n c y i n B u i l d i n g s
greater it must be renewed annually. The DEC must be displayed in a
prominent position in the building. It is normalised for occupancy and
weather, and certain areas (eg data centres) are excluded from the
assessment. 29 different categories of buildings can be assessed.39
The EU is also developing a voluntary common scheme for the energy
performance of non-residential buildings. This is likely to be based on
technical building details.40 It’s not clear if these technical details will
include operational energy consumption or be limited to an asset
assessment.
The Building Performance Institute Europe has developed a data hub,
which contains statistics and policy information on Europe’s building
stock.41
39 The Government’s methodology for the production of Operational Ratings, Display Energy
Certificates and Advisory Reports, Department for Communities and Local Government, December
2008, https://www.gov.uk/government/uploads/system/uploads/attachment_data/file/7806/998942.pdf
40 Implementing the Energy Performance of Buildings Directive, Featuring Country Reports 2012,
Concerted Action Energy Performance of Buildings, http://www.epbd-ca.org/Medias/Pdf/CA3-BOOK-
2012-ebook-201310.pdf
41 Data Hub for the Energy Performance of Buildings. http://www.buildingsdata.eu/

151 | P a g e E n e r g y E f f i c i e n c y i n B u i l d i n g s
Figure 24 - Display Energy Certificate from the UK.

152 | P a g e E n e r g y E f f i c i e n c y i n B u i l d i n g s
Australia requires mandatory disclosure of building energy performance
for office space exceeding 2000m2 at the time of sale or lease.42 This
includes disclosure of the NABERS rating of base building performance,
a tenancy lighting assessment, and general guidance on energy
efficiency improvements. The NABERS base building assessment is a
rating of actual annual energy use in base building services, which
typically covers all energy use in common areas (lighting, lifts,
escalators) etc and whole of building HVAC (excluding tenant installed
HVAC). It is normalised for climatic zone, occupancy, hours of use and
number of computers. The rating must be displayed on any
advertisement, as shown below.
42 Commercial Building Disclosure: http://www.cbd.gov.au/

153 | P a g e E n e r g y E f f i c i e n c y i n B u i l d i n g s
Figure 25 - Illustration of how the NABERS rating needs to be displayed in advertisements for building
sale or lease
The Building Energy Efficiency Register, showing all buildings that have
been required to comply with the Commercial Building Disclosure Act, is
available for public download.43
Lessons learnt from the international experience
Key lessons learnt from international experience are:
The benefits of residential disclosure are mixed
For non-residential buildings the benefits are more clear
Normalisation makes comparisons meaningful
Operational ratings are more useful than asset ratings.
The benefits of residential disclosure are mixed
The key premise behind residential building performance disclosure is
that it is difficult for a buyer to determine how energy efficient a home
might be and mandatory disclosure addresses this information gap. This
should therefore provide more efficient buildings a market advantage
when it comes to sale or lease.
However in the residential market in Europe and Australia there is mixed
evidence supporting the premise that information on a homes’ energy
performance is perceived as useful by buyers.
43 http://www.cbd.gov.au/registers/cbd-downloadable-data-set

154 | P a g e E n e r g y E f f i c i e n c y i n B u i l d i n g s
A 2011 review of the European Energy Performance Certificate (EPC)
found that “More than one hundred in-depth interviews and a large-scale
survey among more than 3000 homeowners revealed how little impact
the Energy Performance Certificate (EPC) currently has on home
owners’ decision-making.”44
Improvements suggested following this review were to make EPCs more
useful include raising the profile of the EPC (for example my making
EPC disclosure mandatory in advertisements) and making the
information more useful and meaningful (e.g. translating energy
numbers into financial numbers).
On the other hand a 2013 European Commission report based on
literature reviews shows that homes that have a better EPC rating are
worth more and attract higher rentals. Examining several countries, the
report found that in Austria and Belgium homes which had a better EPC
score were worth more, but noted that the EPC was generally not
disclosed before the sale or rental transaction, so therefore was unlikely
to have influenced the buyer’s perception of value. In France and
Ireland, where the EPC is disclosed before sale, there was also a
positive correlation between a good EPC and home sale or rental value.
In the UK, depending on location, the study found that there may or may
not be a correlation between a good EPC and sale or rental value. The
EPC is disclosed before the transaction in the UK. Not with standing
44 Key findings and policy recommendation to improve effectiveness of Energy Performance
Certificates and the Energy Performance of Buildings Directive, IEAL EPBD, December 2011,
http://www.ideal-epbd.eu/download/pap/Final_IDEAL_EPBD_result_oriented_report.pdf

155 | P a g e E n e r g y E f f i c i e n c y i n B u i l d i n g s
these positive findings, the study concludes that EPCs are still not yet
producing the results it is believed they can produce, due to a lack of
visibility of the EPC, particularly at the point of decision making, lack of
understanding of the information in the EPC, and lack of trust in the
information.45 It is also interesting to note that buyers may actually be
able to recognise and reward energy efficient features in a home,
without an EPC, as appears may be the case in Austria and Belgium.
A study on the application of EPCs to existing housing stock in the UK
found that to be effective the EPC should be supported by fiscal
incentives, including direct subsidies for the costs of retrofit, rebates on
council tax and stamp duty, or reduced value added tax on materials
used in renovation.46
In the state of Queensland, Australia, a “sustainability declaration” was
introduced in 2010. This is a compulsory checklist that must be
completed by the seller when selling a home. It also had to be displayed
in the home for potential buyers to see. A 2011 survey however found
45 Bio Intelligence Service, Ronan Lyons and IEEP (2013) Energy performance certificates in
buildings and their impact on transaction prices and rents in selected EU countries, Final report
prepared for European Commission (DG Energy).
http://ec.europa.eu/energy/efficiency/buildings/doc/20130619-
energy_performance_certificates_in_buildings.pdf
46 Energy Certificate in the Energy Performance of Buildings Directive: Effectiveness of the Appliation
on the Existing Housing Stock in the UK, Sunnikka, M., Delft University of Technology.
http://repository.tudelft.nl/assets/uuid:069bae73-22ed-4a02-9d91-ade556ce2a7a/176693.pdf

156 | P a g e E n e r g y E f f i c i e n c y i n B u i l d i n g s
that “a massive 98% of buyers do not ask for a copy of the sustainability
declaration at any time during the sales process.”47
A Massachusetts Institute of Technology (MIT) study in 2012 found that:
… existing approaches to disclosure are fraught with numerous issues,
including a lack of connection to the retrofit process, poor visibility of
ratings, and a lack of balance between transparency for stakeholders
and homeowner privacy. These problems limit the benefits of labelling
for the delivery of energy efficiency.48
A new model is proposed in the MIT study which proposes that:
Home ratings should be both asset and operational based
The costs of undertaking an asset rating should be minimised,
particularly for larger apartment buildings.
The approach to disclosure should maintain privacy
Ratings should be accessible to the right stakeholders at the right
time
Ratings need to be made visible
47 Residential Energy Efficiency and Mandatory Disclosure Practicess, O’Leary, T., University of
South Australia, Jan 2012.
http://www.prres.net/Papers/OLeary_Residential_Energy_Efficiency_Mandatory_Disclosure_Practice.
48 A New Model for Disclosing the Energy Performance of Residential Buildings, Nadkarin N.,
Michaels, H., MIT, March 2012. http://web.mit.edu/energy-
efficiency/docs/EESP_Nadkarni_BuildingPerformanceDisclosure.pdf

157 | P a g e E n e r g y E f f i c i e n c y i n B u i l d i n g s
The labelling program needs to include measures to maintain
stakeholder trust
The labelling should actively connect owners with retrofits
The rating disclosure process should be simple.
This diagram below shows how MIT proposed to integrate these different
criteria to improve the usefulness of home performance disclosure. The
estimated cost is USD $200 per home.

158 | P a g e E n e r g y E f f i c i e n c y i n B u i l d i n g s
Figure 26 MIT model of residential energy performance disclosure

159 | P a g e E n e r g y E f f i c i e n c y i n B u i l d i n g s
Based on the discussion covering Europe, Australia and the USA
residential home disclosure is challenging to get right. There is evidence
that more efficient homes are worth more, but less evidence of
behavioural changes or investment to improve energy performance
being driven by disclosure. There are ongoing efforts in Europe and the
USA to improve the impact of residential performance disclosure.
For non-residential buildings the benefits are more obvious
For non-residential buildings there is greater evidence of the benefits of
building performance disclosure.
The USA’s Energy Star Portfolio Manager, with over 350,000 buildings in
it, has shown that benchmarking via performance disclosure does result
in improved building performance. “In a recent study, EPA found that
buildings that were benchmarked consistently reduced energy use by an
average of 2.4 percent per year, for a total savings of 7 percent [over
three years]. And, buildings that started out as poor performers saved
even more.”49
In the USA the Institute for Market Transformation has identified that
commercial building Energy Star ratings improve rental prices, property
values, and occupancy rates, as shown in the figure below.
49 http://www.energystar.gov/buildings/about-us/how-can-we-help-you/benchmark-energy-
use/benchmarking

160 | P a g e E n e r g y E f f i c i e n c y i n B u i l d i n g s
Figure 27 Benefits of Energy Star labelled buildings, from
http://www.buildingrating.org/sites/default/files/Added%20Value%20of%20ENERGY%20STAR_0.pdf
Of interest in these studies is the large variation in results, indicating that
as is so often the case when it comes to energy efficiency high claims
should probably be treated with caution.
In Australia mandatory disclosure via the Commercial Building
Disclosure Act (CBD) for office space in excess of 2,000 m2 at the time
of sale or lease has been in place since 2010. However prior to this
many buildings undertook voluntary NABERS (National Australia Built
Environment Rating System) ratings. Savings of 9% have been reported

161 | P a g e E n e r g y E f f i c i e n c y i n B u i l d i n g s
for those buildings which have undertaken more than one NABERS
rating.50
Both Portfolio Manager and NABERS are operational ratings.
The New Buildings Institute undertook modelling which found that
operational practices have enormous influence on building energy use.
Modelling of three different buildings showed that best practice can
reduce energy consumption by up to 45% whilst worst practices can
increase consumption by up to 140%. 51 My personal experience in
energy audits of over one thousand non-residential buildings bears this
out; buildings that are very similar in construction (i.e. would achieve
similar asset ratings) may show large differences in energy consumption
due to occupant practices in how energy use in the building is managed
and controlled. On the other hand, buildings that are substantially
different in construction and age may have similar energy use intensities
as a result of operational practices.
An analysis of the publicly available NABERS Commercial Building
disclosure dataset shows that from November 2010 to date (5 June
2014) 638 “base buildings” with more than one rating saved on average
50 Final Report: Quantitative Assessment of Energy Savings from Building Energy Efficiency
Measures, produced by Pitt & Sherry for the Commonwealth of Australia, 2013.
http://www.pittsh.com.au/assets/files/CE%20Showcase/Quantitative%20Assessment%20of%20Buildi
ngs%20Measures.pdf
51 Sensitivity Analysis: Comparing the Impact of Design, Operation and Tenant Behaviour on Building
Energy Performance. New Building Instituted, July 2011.
http://newbuildings.org/sites/default/files/SensitivityAnalysisReport.pdf

162 | P a g e E n e r g y E f f i c i e n c y i n B u i l d i n g s
4% a year. However the 131 “whole building” ratings found an average
annual increase in energy use of 0.5% a year.52
An analysis of Display Energy Certificates, as used in England and
Wales, found that on average the 35,000 public buildings rated annually
reduced energy usage by 2% on average each year.53
Disclosure of operational energy performance reveals the potential for
improvement, particularly when the rating is poor. As the Energy Star
Portfolio Manager experience has shown, buildings which initially have a
poor rating tend to have the greatest improvement in performance over
time when benchmarking is undertaken regularly.
These findings from three different countries shows that buildings which
disclose their energy performance do reduce their energy use over time.
Normalisation makes comparisons meaningful
Normalisation is the adjustment of energy use to enable a fair
comparison between buildings. Key variables considered for
normalisation include weather, type of use, hours of occupancy and
number of occupants.
Normalisation is practiced in all of those countries with building
disclosure obligations. Typically weather normalisation is the most
52 Based on analysis of the public data to 5 June 2014, available at http://www.cbd.gov.au
53 Based on analysis of the public data to 5 June 2014, available at
https://www.gov.uk/government/publications/energy-performance-of-buildings-certificates-in-england-
and-wales-2008-to-2013

163 | P a g e E n e r g y E f f i c i e n c y i n B u i l d i n g s
prominent, however normalisation for type of use, hours of occupancy
and other factors is undertaken. The Energy Star Portfolio Manager for
example normalises for weather (based on the location of the building),
building type, operating hours and occupant density.
Operational ratings are more useful than asset based ratings
David Hsu of the University of Pennsylvania undertook a statistical
analysis of a data set for multi-family buildings in New York City and
found that there are “few, if any, relationships of building systems to
observed energy use” indicating that basing energy performance ratings
on operational energy use was more effective than basing it on an
assessment of the building’s assets or construction.
Asset based ratings were found to cost up to ten times the cost of an
operational rating. “Costs for the annual benchmarking of buildings are
estimated at between USD $500 and $1,500 per building in New York,
and around $1.50 per square meter for auditing.”
His conclusion was that “disclosure laws requiring benchmarking data
may be relatively more useful than engineering audits in explaining the
observed energy performance of existing buildings.”54
Again my experience as an energy auditor bears out this finding. I have
assessed a number of award winning buildings with excellent asset
54 How Much Information Disclosure of Building Performance is Necessary? Hsu., D, Energy Policy,
Vol 64, Jan 2014, pp 263-272, Elseivier.
http://www.sciencedirect.com/science/article/pii/S0301421513008987

164 | P a g e E n e r g y E f f i c i e n c y i n B u i l d i n g s
ratings (“as designed”) but which have had high energy use when
operational and actually performed poorly.
If the end intent of energy efficiency policy is actual energy savings,
leading to increased energy security and reduced GHG emissions, then
operational ratings are far more likely to lead to this outcome than asset
based ratings.
SUGGESTIONS FOR MALAYSIA
It is suggested that Malaysia introduce performance disclosure for larger
buildings based on actual operational energy use.
The form of disclosure shall be in the form of an annual Statement and
Rating of Building Energy Efficiency (SRBEE)
The SRBEE shall be generated by the Energy Commission, through the
(proposed) National Building Energy Consumption Database. A SRBEE
website/portal will be used for the upload of data needed to generate the
rating. The ratings of all buildings subject to the regulation will be
publicly available on the SRBEE website.
Data to be uploaded will include:
Property details (eg address, name of responsible person, etc)
Meter identifiers – the identification numbers (as per energy bills)
of the meters supplying those parts of the building subject to
disclosure.

165 | P a g e E n e r g y E f f i c i e n c y i n B u i l d i n g s
Annual electricity consumption data (by linking to a National
Building Energy Consumption Database it will be possible to have
this data uploaded automatically)
If necessary, one, but no more than two, normalisation factor(s)
specific to the type of building. For example for an office this
normalisation factor would be the building area (m2).
The Building Energy Intensity, as calculated by the Energy
Efficiency Rating Tool.
Certification by an independent assessor that the data uploaded is
true and accurate.
For many buildings the only annual variable will be electricity
consumption, which through linking to a National Building Energy
Consumption Database could be uploaded automatically. So the cost of
ongoing annual compliance could be very low.
A current copy of the SRBEE will need to be displayed at all major
entrances in a prominent position for all buildings subject to the
regulation.
Scope of coverage
The scope is for existing buildings, and should apply to buildings where
the certificate of occupancy was issued 24 months or more ago.
The size and type of building required to comply will initially be as
follows:

166 | P a g e E n e r g y E f f i c i e n c y i n B u i l d i n g s
The common property of any building which is subject to the Strata
Management Act using in excess of 1,000 MWh of electricity
annually; with “common property” and “building” as defined in this
Act. Energy used in common property will typically cover that used
in car parks, recreational areas, lobbies, corridors, lifts, stairs, fire
escapes, entrances and exits, and façade illumination.
Office Tenancies or single-occupant office buildings (including
government tenancies or buildings) using in excess of 1,000 MWh
of electricity annually.
All other non-industrial tenancies or single-occupant buildings of
any sort using in excess of 1,000 MWh of electricity annually.
Over a five year period the scheme would be expanded in two phases:
Phase 1: To expand to include:
- The common property of any building which is subject to the
Strata Management Act using in excess of 500 MWh of
electricity annually.
- Office Tenancies or single-occupant office buildings
(including government tenancies or buildings) using in
excess of 500 MWh of electricity annually.
- All other non-industrial tenancies or single-occupant
buildings of any sort using in excess of 500 MWh of
electricity annually.

167 | P a g e E n e r g y E f f i c i e n c y i n B u i l d i n g s
Phase 2: To expand to include:
- The common property of any building which is subject to the
Strata Management Act using in excess of 200 MWh of
electricity annually.
- Office Tenancies or single-occupant office buildings
(including government tenancies or buildings) using in
excess of 200 MWh of electricity annually.
- All other non-industrial tenancies or single-occupant
buildings of any sort using in excess of 200 MWh of
electricity annually.
Annual disclosure draws operational inefficiencies to the attention of
management and provides an annual scorecard of performance.
For buildings with long lease terms or which are rarely sold
infrequent disclosure will not have the beneficial impact of more
frequent disclosure. The US Energy Star experience highlights that
those buildings which were benchmarked consistently achieved
savings. On the other hand asset ratings, which remain unchanged
if the building is not refurbished or upgraded, do not incentivise
energy savings.

168 | P a g e E n e r g y E f f i c i e n c y i n B u i l d i n g s
The National Property Information Centre (NAPIC) has data on the
number of office buildings, shopping centres, shops and hotels in
Malaysia, as tabled below.55
Table 11 - Estimated number of buildings that would need to comply with
mandatory disclosure requirements
Number of
buildings
Est.
Percent
measure
applies to
Number
liable
Total
energy use
liable
(GWh)
Purpose built office 2,363 100% 2,363 4,367.27
Shopping complex 877 100% 877 3,734.07
Hotel subtotal 2,710 -
Shop 392,304 10% 39,230 2,585.50
Serviced apartment 88 - 11,429.44
Attributable to other commercial buildings not listed
by NAPIC* 28,299 30% 8,490 5,116.47
Residential common property strata titled** 4,746,184 0.5% 23,731 1,918.69
Total buildings 5,573,877 76,779 29,894
*Estimate based on a rough energy balance
**Note this is an uninformed estimate as to the number of residential strata titled buildings
that would need to comply.
55 http://napic.jpph.gov.my/portal/portal/eps/Online%20Services/Publication

169 | P a g e E n e r g y E f f i c i e n c y i n B u i l d i n g s
Expected costs and benefits
Based on the table aboveNAPIC data an estimated 77,000 buildings will
need to comply.
If it is assumed that:
Buildings that comply with the scheme reduce electricity
consumption by 1.5%
It costs RM 3,000 for each building to comply in the first year they
are required to comply. This cost covers the expense of having a
registered engineer or architect certify the metering arrangements
and that the normalisation factors are correct plus any time that the
building manager needs to dedicate to this task.
Compliance costs RM 1,000 per building in the second and all
subsequent years that they are required to comploy56;
Compliance is introduced gradually
Every RM 200,000 spent on compliance creates 1 job.
Then after 10 years:
Annual savings will be RM 360m
Annual compliance costs will be RM 110m
670 people will be employed.
56 Costs are similar to the costs in New York.

170 | P a g e E n e r g y E f f i c i e n c y i n B u i l d i n g s
Due to possible capacity constraints it is unrealistic to expect to be able
to bring all buildings into the scheme in one year, so a phased
introduction is suggested.
Elements of scheme design
With reference to figure 22 are a wide range of considerations involved
when deciding on the design of a performance disclosure system.
The availability and cost of getting data has to be considered against the
benefit the data provides. Application of the 80/20 rule would indicate
that just enough information should be gathered to provide 80%
confidence that the performance disclosure is within the likely actual
performance range. The scheme design needs to decide on the level of
accuracy required. For example the NABERS rating in Australia, which
could be considered a “Rolls Royce” rating system, needs to be
undertaken by an accredited assessor following a complex validation
protocol that ensures a high degree of comparability between ratings.
This however comes at a cost, for a tenancy of 1,500 m2 the cost is
estimated at between $1,000 to $4,000. 57 A lodgement fee of $700
applies for any NABERS rating to be registered.
As indicated above costs are in the range of $500 to $1,500 per building
in New York for the operational rating and $1.50/m2 for the associated
audit. In Australia the cost to a property owner of complying with the
57 http://www.cityswitch.net.au/Nabers/Howmuchdoesitcost.aspx

171 | P a g e E n e r g y E f f i c i e n c y i n B u i l d i n g s
CBD legislation (NABERS rating and lighting audit) is estimated at
between AUD $6,000 to $10,000.58
For Malaysia an operational rating only is suggested, with minimal data
collection. Its estimated that it will be possible to keep the cost of first
year compliance at an average of RM 3,000 or less, then RM 1,000 or
less in subsequent years.
Suggestions for each of the classification criteria presented in figure 22
are listed below:
Consumption quantification: The performance disclosure should be
based on measured, normalised operational performance, only, and not
include any element of an asset rating. Normalisation factors should
depend on building type. For an example, for an office building
normalisation would be based on the area of the building. To keep costs
low initially only one normalisation variable shall be used, which should
still be sufficient to enable a reasonable comparison between buildings.
This should be building area for most if not all types of buildings.
Energy measurement: Should be based on meter readings of energy
delivered to the meter(s), based on utility billing data. Where the rating is
for “base building” or common areas only, then only that consumption
data need be considered.
58 http://cbd.gov.au/get-and-use-a-rating/how-to-get-a-beec

172 | P a g e E n e r g y E f f i c i e n c y i n B u i l d i n g s
Floor area: Gross unconditioned and conditioned floor area is the
easiest to measure, however this may make it challenging to make valid
comparisons between buildings. The Kuala Lumpur City Council has
developed a simple definition of Gross Floor Area that should be
adopted.
Building type: As discussed above initially common areas of large
buildings and office buildings should be required to comply, expanding to
a wider range of building types. Where a building has different types of
usages adjustments may need to be made, depending on energy
metering arrangements and details on floor area.
Comparability metric: For ease of communication the comparison
should also be presented at a statistical relative reference in bands of
usage (e.g. 1 star to 5 star, or A to F) with the halfway point representing
the average for the building type. With references to figures 23 and 24
above it can be seen that figure 24 appears to communicate the most
clearly, and being easier to understand than figure 23.
Energy end use: Whole of building energy use should be considered,
based on metered supply data, rather than trying to break it down by
various end uses (such as lighting, cooling, etc.) for which metered data
is not likely to be available. Where the rating only applies to the base
building, then all consumption on the base building meter should be
included.
With only three electricity utilities in Malaysia, the alignment of
performance disclosure with a national building energy consumption

173 | P a g e E n e r g y E f f i c i e n c y i n B u i l d i n g s
database will facilitate the provision of consumption data that can be
used in determining energy performance of buildings.
The above discussion illustrates some of the complexity involved in
starting up such a scheme and the various considerations that need to
occur.
Voluntary or mandatory?
As presented in the Building Energy Intensity disclosure discussion
paper59 by Kevin Hor of BSEEP and Dr. Gerhard Weihs of SCP-EPU,
mandatory disclosure is recommended. The advantages of mandatory
disclosure are:
Improved effectiveness of labelling. As shown in the discussion
above on EPCs, where ratings are not mandatory the market
impact is reduced substantially.
Economies of scale reduce costs. The costs of assessments could
be expected to drop as market demand for accredited assessors
grows due to competition between assessors.
It is suggested that mandatory disclosure include:
59 Strategic paper for mandating the disclosure of Building Energy Intensity (BEI) for new high rise
(above 5 storey) residential buildings and high rise (above 5 storey) commercial property transactions
in Malaysia, March 2014, Hor K., Weihs G., unpublished.

174 | P a g e E n e r g y E f f i c i e n c y i n B u i l d i n g s
Display of energy performance rating in a prominent position at
building entrances
Energy performance rating be available in a publicly accessible
website
Display of the current energy performance rating in any
advertisement for sale or lease.
Implementation pathway
The following elements need to be considered in determination of the
implementation pathway/timeline:
Detailed scheme design. As outlined above various factors need to be
considered, however it is likely that these could be resolved over a three
to six month period with appropriate industry consultation.
Development or adaption of a database and normalisation tool that
enables cost-effective measurement of operational BEI across a wide
variety of building types.
A separate policy discussion paper has been prepared on Building
Energy Efficiency Assessment Tools
Likely timeline is six to twelve months.
Enabling Regulation. The powers vested in ST under the Electricity
Supply Act (1990) shall be used to oblige utilities to supply the Energy
Commission (EC) with the following data on a quarterly basis for all
buildings subject to the disclosure:

175 | P a g e E n e r g y E f f i c i e n c y i n B u i l d i n g s
Meter identifier / account number
Account name, address, contact details
Consumption data for each month of the quarter.
The Energy Management Regulations 2008 may need to be amended to
allow for ST to collect data for those buildings using less than 3,000
MWh over a six month period.
To mandate the public disclosure of data and for liable buildings to
provide information to produce a SRBEE may also require changes to
the Energy Management Regulations 2008.
Scheme administration. Shall be undertaken by the EC, which will also
administer the National Energy Building Consumption Database and
providing help-desk services in use of the website and portal used to
generate SRBEEs.
A team of roughly ten people would be needed to undertake these
activities. This could be funded through a UEEO.
Scheme introduction. Scheme introduction would involve engaging
with property managers, and commercial real-estate agents to provide
information on the scheme. A transition period could apply before
enforcement was made mandatory.
Scheme tightening. This would be at three and five years after scheme
introduction.

176 | P a g e E n e r g y E f f i c i e n c y i n B u i l d i n g s
Monitoring of results and tuning of policy. The database developed
for the scheme would be accessed for the purpose of monitoring and
tuning of policy. Appropriate resourcing would need to be allocated.
Responsibility
ST
Synergies
Building standards and building performance disclosure are highly
synergistic. There is considerable evidence that building efficiency
standards alone are not effective in realising the full energy saving
potential of such standards. Good operational practices are needed, and
this can be driven by mandatory performance disclosure of actual
operational energy consumption. The synergy is shown in the graphic
below.
Figure 28 - How energy codes and operational energy performance disclosure impact on a buildings
energy use over its lifetime. From Lining Building Energy Codes with Benchmarking and Disclosure
Policies, Global Building Performance Network and Institute for Market Transformation, March 2014.
http://www.imt.org/uploads/resources/files/Linking_Codes_With_Benchmarking.pdf

177 | P a g e E n e r g y E f f i c i e n c y i n B u i l d i n g s
A National building energy efficiency database can benefit greatly
from performance disclosure, and enable the tracking of policy
effectiveness over time whilst also providing insights that many facilitate
the development or tuning of other energy efficiency policies.
A Utility Energy Efficiency Obligation could be used to provide
funding for scheme administration, and in the early years of the scheme
to subsidise the cost of compliance.

178 | P a g e E n e r g y E f f i c i e n c y i n B u i l d i n g s
ENERGY EFFICIENCY RATING TOOLS
FOR BUILDINGS
SUMMARY
Energy efficiency benchmarking tools have been shown to be important
tools enabling mandatory disclosure of building energy performance,
which has been shown to be effective in reducing energy consumption in
commercial buildings.
Buildings can be benchmarked and compared either by an asset rating
or an operational rating.
Operational ratings show how much energy a building actually uses,
which is a function both of how the building is operated and energy
efficiency features incorporated into its design and equipment. Asset
ratings show how much energy the building is expected to use if
operated a certain way.
Operational ratings are preferred for existing non-residential buildings
and the common areas of large residential buildings. Operational ratings
have been proven to drive large energy savings. For example in the
U.S.A’s Energy Star Portfolio Manager, which has over 350,000
buildings benchmarked in it, buildings which have consistently
benchmarked have reduced energy consumption on average by 7%
over a three year period. The use of an operational rating tool is
recommended for Malaysia.

179 | P a g e E n e r g y E f f i c i e n c y i n B u i l d i n g s
Globally the best tool is the Energy Star Portfolio Manager. It can be
used with up to 80 different property types, with 18 broad categories
from banking through to warehouse. With over 350,000 properties
benchmarked by Portfolio Manager, it has been refined to be a fairly
easy to use tool with a large help section.
In selecting an operational rating tool consideration needs to be given to
accuracy, cost and ease of use.
Malaysia can potentially adapt the Building Energy Intensity Tool. This
is currently used to provide asset ratings for office buildings used in the
Green Building Index, but could be adapted to enable an operational
rating. Alternatively it could develop an operational rating tool from
scratch, or else adopt Energy Star Portfolio Manager. This would have
the advantage of being a well-developed tool suited to a wide range of
facility types.
Any tool should be capable of seamless integration with a National
Building Energy Consumption Database.
Stakeholders have not indicated a strong preference for a particular tool,
however the BEI tool is viewed favourably.
WHAT ARE BUILDING ENERGY EFFICIENCY
RATING TOOLS?
Building energy efficiency rating tools are used to compare the energy
efficiency of different buildings.

180 | P a g e E n e r g y E f f i c i e n c y i n B u i l d i n g s
There are broadly two types of rating tools – tools that generate “asset”
ratings, or those that produce “operational” ratings.
Asset ratings use design information about a building, or information
gathered by an assessor about the characteristics of the building that
impact on energy use. Such characteristics may include the amount of
insulation, the type of windows, the lighting power density, etc. This
design information is then entered into software which calculates a
simulated annual energy use, based on certain operating conditions.
Operational ratings are based on actual energy bills for the building.
They are normalised for weather and other parameters such as
operating hours, to enable a comparison between buildings.
Operational ratings show how much energy the building actually uses
which is a function both of how the building is operated and energy
efficiency features incorporated into its design and equipment. Asset
ratings show how much energy the building is expected to use if
operated a certain way.
Asset ratings are generally used for home energy ratings, where there
can be large variation in occupant behaviour, whereas operational
ratings are more commonly used to show how commercial buildings
actually perform, as there is generally less variation in occupant
behaviour.
Operational ratings are technology agnostic, and require no
understanding of the equipment and plant in use in the building or how
the building has been constructed. As such they are usually much

181 | P a g e E n e r g y E f f i c i e n c y i n B u i l d i n g s
cheaper than asset ratings, which rely on understanding the technology
and construction used in the building.
AN ASSET RATING OR AN OPERATIONAL RATING
TOOL?
As discussed in the paper on building performance disclosure,
operational ratings are preferred for existing non-residential buildings
and the common areas of large residential buildings.
Asset ratings cannot show any reduction in building energy consumption
due to operational changes. On the other hand operational ratings
capture this change. Analysis of the large dataset in the USA’s Energy
Star Portfolio Manager (an operational rating tool) shows this. “In a
recent study, EPA found that buildings that were benchmarked
consistently reduced energy use by an average of 2.4 percent per year,
for a total savings of 7 percent [over three years]. And, buildings that
started out as poor performers saved even more.”60
The New Buildings Institute undertook modelling which found that
operational practices have enormous influence on building energy use.
Modelling of three different buildings showed that best practice can
reduce energy consumption by up to 45% whilst worst practices can
60 http://www.energystar.gov/buildings/about-us/how-can-we-help-you/benchmark-energy-
use/benchmarking

182 | P a g e E n e r g y E f f i c i e n c y i n B u i l d i n g s
increase consumption by up to 140%. 61 My personal experience in
energy audits of over one thousand non-residential buildings bears this
out; buildings that are very similar in construction (i.e. would achieve
similar asset ratings) may show large differences in energy consumption
due to occupant practices in how energy use in the building is managed
and controlled. On the other hand, buildings that are substantially
different in construction and age may have similar energy use intensities
as a result of operational practices.
Disclosure of operational energy performance reveals the potential for
improvement, particularly when the rating is poor. As the Energy Star
Portfolio Manager experience has shown, buildings which initially have a
poor rating tend to have the greatest improvement in performance over
time when benchmarking is undertaken regularly.
David Hsu of the University of Pennsylvania undertook a statistical
analysis of a data set for multi-family buildings in New York City and
found that there are “few, if any, relationships of building systems to
observed energy use” indicating that basing energy performance ratings
on operational energy use was more effective than basing it on an
assessment of the building’s assets or construction.
61 Sensitivity Analysis: Comparing the Impact of Design, Operation and Tenant Behaviour on Building
Energy Performance. New Building Instituted, July 2011.
http://newbuildings.org/sites/default/files/SensitivityAnalysisReport.pdf

183 | P a g e E n e r g y E f f i c i e n c y i n B u i l d i n g s
Asset based ratings were found to cost up to ten times the cost of an
operational rating. “Costs for the annual benchmarking of buildings are
estimated at between USD $500 and $1,500 per building in New York,
and around $1.50 per square meter for auditing.”
His conclusion was that “disclosure laws requiring benchmarking data
may be relatively more useful than engineering audits in explaining the
observed energy performance of existing buildings.”62
Again my experience as an energy auditor bears out this finding. I have
assessed a number of award winning buildings with excellent asset
ratings (“as designed”) but which have had high energy use when
operational and actually performed poorly.
If the end intent of energy efficiency policy is actual energy savings,
leading to increased energy security and reduced GHG emissions, then
operational ratings are far more likely to lead to this outcome than asset
based ratings.
INTERNATIONAL EXPERIENCE WITH RATING
TOOLS
The accompanying paper on building performance disclosure provides a
discussion on how different countries assess the energy efficiency
performance of their buildings, with reference to the tools in use.
62 How Much Information Disclosure of Building Performance is Necessary? Hsu., D, Energy Policy,
Vol 64, Jan 2014, pp 263-272, Elseivier.
http://www.sciencedirect.com/science/article/pii/S0301421513008987

184 | P a g e E n e r g y E f f i c i e n c y i n B u i l d i n g s
Rather than repeat this discussion the experience with a range of
different tools from different countries (including Malaysia) is
summarised in the table below.
Note that internationally there are many asset based tools (only a few of
which are listed below) but fewer operational tools.

185 | P a g e
Tool Country Type of tool Basis of rating Main use
Green Building Index Malaysia Asset rating, post
occupancy
operational rating.
Uses the Building Energy Intensity Tool For the calculation of the GBI rating for new
and existing buildings.
Building Energy
Intensity Tool63
Malaysia Primarily an asset
rating, post
occupancy
operational rating
possible.
Characteristics of the building (size, heat transfer
coefficients, amount of glazing, glazing type, shading)
and equipment power densities and efficiencies are
entered which results in the calculation of a simulated
building energy intensity based on air conditioned
building area.
Post occupancy an operational rating can be
generated.
For the calculation of BEI in GBI ratings for
new buildings and confirmation rating in the
first 12 months of operation.
63 http://www.acem.com.my/index.php?option=com_content&task=view&id=65&Itemid=69

186 | P a g e E n e r g y E f f i c i e n c y i n B u i l d i n g s
Tool Country Type of tool Basis of rating Main use
BCA Green Mark64 Singapore Asset rating Characteristics of the building and equipment re
entered which results in the allocation of points for a
green building rating
For the calculation of the Green Mark rating
for new buildings
GreenRE65 Malaysia Asset rating Characteristics of the building and equipment in
relation to MS1525 are entered which results in the
allocation of points for a green building rating (similar
to Green Mark)
For the calculation of the GreenRE rating for
new buildings (an alternate to GBI)
Penarafan Hijau, JKR66 Malaysia Asset rating Used by JKR to assess government
buildings
64 http://www.greenmark.sg/index.html
65 http://greenre.org/wp-content/uploads/2014/01/Design-Ref-Guide-ENRB1.1.pdf
66 http://www.jkr.terengganu.gov.my/v2/index.php?option=com_content&view=article&id=312:program-pengenalan-skim-penarafan-hijau-jabatan-kerja-raya-
malaysia&catid=1:taklimat&Itemid=67

187 | P a g e E n e r g y E f f i c i e n c y i n B u i l d i n g s
Tool Country Type of tool Basis of rating Main use
Green Pass Malaysia Asset and
operational
CIDB have used this tool to undertaken carbon
ratings for government buildings.
Currently Penarafan Hijau and Green Pass are
being combined into a single tool to generate
carbon ratings for a range of building types
Melaka State Menterai
Hijau67
Malaysia
(Melaka)
Tool currently under development
Energy Star Portfolio
manager68
U.S.A.,
Canada
Operational
rating
Annual energy consumption, normalised for weather, hours
of use, occupancy. BEI calculation based on gross floor area
excluding car parking.
Existing buildings: Voluntary ratings and for
compliance with various state and local government
mandatory disclosure regulations
67 Tool still being developed. http://www.melakagreentech.gov.my/
68 http://www.energystar.gov/buildings/facility-owners-and-managers/existing-buildings/use-portfolio-manager

188 | P a g e E n e r g y E f f i c i e n c y i n B u i l d i n g s
Tool Country Type of tool Basis of rating Main use
NABERS69 Australia Operational rating Annual energy consumption, normalised for weather, hours
of use, occupancy and for offices on desktop computer
loads. BEI calculation based on net lettable floor area with
exclusions for areas with different usage types.
Existing buildings: Voluntary ratings and for
compliance with national mandatory
disclosure regulation at time of sale or lease
for spaces larger than 2,000m2.
DEC70 UK, Ireland Operational rating Annual energy consumption, normalised for weather, hours
of use, BEI calculation based on conditioned floor area with
exclusions for areas with different usage types.
Existing public buildings. Mandatory
disclosure every 10 years for buildings of 500
to 1,000 m2, mandatory annual disclosure for
buildings of more than 1,000 m2.
69 www.nabers.com.au
70 http://www.seai.ie/Your_Building/BER/Large_Public_Buildings/DEC_FAQ/Public_buildings_technical_bulletin_Dec_09.pdf

189 | P a g e
Of the operational tools Energy Star Portfolio Manager has had the
greatest development effort. It can be used with up to 80 different
property types, with 18 broad categories from banking through to
warehouse. With over 350,000 properties benchmarked by Portfolio
Manager, it has been refined to be a fairly easy to use tool with a large
help section.
Additionally Portfolio Manager can be used with a range of
manufacturing/industrial building types. Whilst it requires a licenced
Professional Engineer or Registered Architect, in good standing with
working knowledge of building systems to verify the data for the purpose
of certification, there is no need for special certification. This is
substantially different (and thus less expensive) to the UK/Ireland and
the Australian systems, where a specially accredited assessor is
required to undertake the rating.
Also, unlike Australia, there is no requirement to pay a certification fee.
In effect the tool is subsidised, which could explain its very large
voluntary uptake.

190 | P a g e E n e r g y E f f i c i e n c y i n B u i l d i n g s
FACTORS IMPORTANT TO ENERGY EFFICIENCY
BUILDING DISCLOSURE TOOL SELECTION
The tool should enable an operational rating (as discussed in the
paper on building performance disclosure)
The rating should be accurate enough to provide a fair comparison
between buildings of the same type.
The cost of doing the rating should be as low as possible without
compromising accuracy
The tool should be relatively easy to use, so as to minimise the
chance of erroneous ratings
It should be able to integrate with a National Building Energy
Consumption Database, to make it much easier (and therefore
less expensive) to generate a Statement of Rating and Building
Energy Efficiency (SRBEE) for a property.
The tool must be able to be used with a range of building types.
SUGGESTIONS FOR MALAYSIA
Malaysia has no operational rating systems. Options are:
Adapt the BEIT
Develop an operational rating tool from scratch
Adapt one of the operational tools used internationally.
Each of these options is reviewed in the table overleaf.

191 | P a g e E n e r g y E f f i c i e n c y i n B u i l d i n g s
As shown earlier Malaysia has a large number of green building rating
tools. To avoid confusion it is recommended that mechanisms be put in
place so that only one tool can be used to generate operational ratings
for the purposes of mandatory disclosure, and this tool should be
embedded into the National Building Energy Consumption database

192 | P a g e
Option Plus Minus Interesting
Adapt BEIT Construction industry for large buildings already familiar with BEIT
Can enhance the certification of existing buildings after 12 months of
operation.
Easy to incorporate concepts and language familiar to Malaysia.
BEIT is not government owned
Have to develop training and
accreditation material
Currently only suited to office buildings
BEIT is primarily a tool for building
design, not for assessing actual
consumption
Develop an
operational tool
from scratch
Can be fully customised.
Government can have full control.
Easy to incorporate concepts and language familiar to Malaysia.
Easy to incorporate into a National Building Energy Consumption
Database
Not hard to develop
Longer time frame
Have to develop training and
accreditation material
Adapt one of the
operational tools
used
internationally
No need to reinvent the wheel.
Could save years of tool development and enhancement
Possibly (much) less expensive
Training and accreditation material already developed
Possible sovereignty concerns
Less ability to customise to Malaysia

193 | P a g e E n e r g y E f f i c i e n c y i n B u i l d i n g s
Adapt Energy
Star Portfolio
Manager
Very well developed program; the best tool for operational energy use
assessment in the world.
Suited to a wide range of building types so enables mandatory
performance disclosure across a wide range of building types, including
industrial facilities (and encompassing the use of gas and other fuels)
Already uses units familiar to Malaysians (e.g. ft2 rather than m2, BTU)
Energy star welcomes international use of the Portfolio Manager into its
existing database.
Could be used for international benchmarking.
Requires development of a stable long
term agreement with the USA EPA;
less direct control possible of the tool
May be harder to integrate with a
National Building Energy Consumption
Database.
Portfolio Manager is an excellent
tool.
Would the U.S.A. be willing to
license it, with a separate
Malaysian data-set, and give
Malaysia sovereignty over the
data?
Responsibility
ST

194 | P a g e
NATIONAL BUILDING CONSUMPTION
DATABASE
SUMMARY
A National Building Energy Consumption Database (NBECD) enables
the impact of energy efficiency policies to be measured. It can also serve
the additional purpose of providing an administration and regulatory tool
(which is required in any case).
The key objective of Building Sector energy efficiency policy is reduced
energy consumption in buildings, leading to greater national energy
security and reduced GHG emissions, and providing greater
competitiveness in the global marketplace.
However unless policy results are effectively measured and monitored,
tens or hundreds of millions of dollars may be wasted.
The key purpose of an NBECD is to enable traceability of the impact of
energy efficiency measures through to changes in energy consumption,
and to be able to do so with a large data set in order to provide a high
degree of confidence in any findings.
Site address Energy efficiency intervention Reduction in metered
consumption

195 | P a g e E n e r g y E f f i c i e n c y i n B u i l d i n g s
As an ambitious set of building sector EE policies are put forward for the
11th Malaysian plan efficiencies should be sought in program
administration.
A NBECD is an elegant and cost-effective way of doing this.
Failure to adopt an NBECD would result in un-necessary duplication and
inefficiencies, and may make the cause-effect measurement enabled by
an NBECD impossible.
Changes to the Energy Manager Regulations could enable an NBECD,
which would be administered by the Energy Commission. The cost of
establishing an NBECD is roughly estimated at between RM 3m to 5m,
and roughly ten people would be needed to maintain and administer it
on an ongoing basis. This could be funded by a Utility Energy Efficiency
Obligation (UEEO).
A NBECD is synergistic with all EE policy measures that can be
expected to result in a measurable impact on energy use at the level of
an individual meter.
It has very strong synergy with a UEEO and mandatory building
performance disclosure.

196 | P a g e E n e r g y E f f i c i e n c y i n B u i l d i n g s
WHY A NATIONAL BUILDING ENERGY
CONSUMPTION DATABASE?
“You can’t manage what you don’t measure” is a well know saying, but
unfortunately when it comes to energy efficiency policy it is challenging
to apply.
Policy endeavours through either regulation or incentives to direct public
and private activity and investment to achieve outcomes in the public
interest.
However without measurement tools in place it is very hard to assess
the impact of these policies, to ditch ineffective policy and enhance
policy that is producing results.
The key objective of Building Sector energy efficiency policy is reduced
energy consumption in buildings, leading to greater national energy
security and reduced GHG emissions, and providing greater
competitiveness in the global marketplace.
A National Building Energy Consumption Database enables the impact
of these policies to be measured. It can also serve the additional
purpose of providing an administration and regulatory tool (which is
required in any case).

197 | P a g e E n e r g y E f f i c i e n c y i n B u i l d i n g s
A SUGGESTED NBECD FOR MALAYSIA
The structure of a suggested NBECD for Malaysia is shown below,
followed by an explanation of key features.
Figure 29 Structure of a NBECD

198 | P a g e E n e r g y E f f i c i e n c y i n B u i l d i n g s
Data keys
Data keys refer to how data is inter-related. The two most important data
keys are the electricity meter identifier (EMI) and the site address.
The electricity meter identifier is a number that refers to the point of
electricity supply, and never changes. The meter may change. Malaysia
in the future may de-regulate its electricity supply and the account
number may change. But the EMI never changes.
If Malaysia does not currently have an EMI appearing on each electricity
bill, but it has some other form of unchangeable identifier, this should be
the key. If account numbers never change, then this could be the
identifier.
The site address is the building to which electricity is supplied to. This is
where the database administration gets challenging, as one meter may
supply more than one address (think of a school, which has expended to
occupy multiple addresses with multiple buildings but only one electricity
supply meter), or, more commonly, one address may have multiple
meters (again a school is a good example, it may have multiple
electricity supply points and meters to different buildings).
What is ultimately important is that any data entered into the database
can be traced back to a meter whose consumption is expected to reduce
as a result of an activity that has the intent of reducing energy use. This
then enables the tracing of Causes to Effects.

199 | P a g e E n e r g y E f f i c i e n c y i n B u i l d i n g s
Site address Energy efficiency intervention Reduction in metered
consumption
Where there is doubt an NBECD will need active administration to
enable the matching of the address where an energy efficiency
intervention occurred to the meter supplying electricity to the address, or
that part of the address, where the energy saving measure took place.
The gas meter identifier is the third identifier. Electricity is the
predominant form of energy used in buildings, but if the NBECD is to
cover industrial buildings, it needs to be able to track interventions that
are expected to reduce gas consumption.
Complete coverage
The NBECD needs to encompass all activities that reduce metered
energy consumption in buildings. It therefore needs to be able to capture
the impact of policies such as:
A Utility Energy Efficiency Obligation Scheme (UEEO)
Building performance disclosure, via a Statement and Rating of
Building Energy Efficiency
Embedded generation, through the Feed In Tariff
The Efficient Management of Electrical Energy Regulations, which
apply to all large electricity users.
Any other policy, regulation or activity that is expected to change
metered energy consumption in buildings

200 | P a g e E n e r g y E f f i c i e n c y i n B u i l d i n g s
Building Energy Intensity (BEI) calculation
The BEI calculation is undertaken by the Energy Efficiency Rating Tool.
It should link seamlessly to the NBECD to reduce the time and effort
needed to generate a Statement of Rating of Building Energy Efficiency
(SRBEE).
Enables Program Administration
In this second decade of the 21st century there is no excuse for not
making all transactions electronic, and every electronic transaction
needs a database to support it.
Good database design, coupled with easy to use user interfaces that
can be used on computers, tablets and phones, slashes the costs of
transactions, improves accuracy, facilitates audits and provides
traceability.
As an ambitious set of building sector EE policies are put forward for the
11th Malaysian plan efficiencies should be sought in program
administration.
A NBECD is an elegant and cost-effective way of doing this.
Failure to adopt an NBECD would result in un-necessary duplication and
inefficiencies, and may make the cause-effect measurement enabled by
an NBECD impossible.

201 | P a g e E n e r g y E f f i c i e n c y i n B u i l d i n g s
Enables policy to be measured and tuned
A key deficiency in the implementation of EE policies globally is the lack
of measurement of policy effectiveness. A NBECD that is well
administered enables this. Which policies are the most cost effective?
Which policies leverage the most private investment? Which policies
don’t work? Which policies aren’t working well, but can be improved? A
NBECD can enable the answering of all these questions.
For example, under a UEEO many sites might receive lighting upgrades,
and many sites might have high efficiency air conditioners installed.
Which provides the most reliable savings? Should any deeming factors
for lifetime savings be changed? Do the metered savings match the
deemed savings? A NBECD facilitates the answering of these questions.
Developing a NBECD, costs and benefits.
No special regulation needs to be enacted for EC to establish a NBECD.
The Energy Commission would administer the NBECD
Development of the NBECD would likely take 6 to 12 months.
A rough estimate of the cost of developing an NBECD and the
associated portals as outlined above is RM 3m.
Given that several of the EE policies under consideration are likely to
result in expenditure ranging from hundreds of millions through to billions
of Ringgits, an NBECD is inexpensive in relation to the benefit it can
provide as an administration and monitoring tool.

202 | P a g e E n e r g y E f f i c i e n c y i n B u i l d i n g s
Responsibility
ST
AUTHOR’S PERSONAL EXPERIENCE
The key reference for this paper is my personal experience. I believe a
NBECD could be of tremendous long-term benefit to Malaysia in helping
ensure policy effectiveness. Much of the thinking in this paper comes
from my experience in:
Designing and developing energy management databases and
web-based interfaces. I’ve designed and managed the
development of tools for organisations with hundreds of sites to
track their energy and water consumption and carbon footprint.
Energy audits. What are the metering arrangements? Which part
of the site is supplied by which meter?
Measurement and verification. What are the metering
arrangements? What are the variables impacting on energy
usage? Were the savings as estimated?
Analysing large data sets to determine policy impact (and often
finding that the data doesn’t exist, creating a tremendous amount
of extra work often based on tenuous assumptions that can’t be
validated). One policy I evaluated, which did not have a system for
measuring policy impact and then adjusting policy, appeared to be

203 | P a g e E n e r g y E f f i c i e n c y i n B u i l d i n g s
wasting in excess of $50m annually. 71 This could have been
avoided with an NBECD.
Comparing deemed or projected savings and impacts with actual.
The difference can be huge!
I have a great appreciation of the value of energy efficiency data, and
the inefficiency that can arise in the absence of such data.
SYNERGIES WITH OTHER POLICY MEASURES
A NBECD is synergistic with all EE policy measures that can be
expected to result in a measurable impact on energy use at the level of
an individual meter.
It has very strong synergy with a UEEO and mandatory building
performance disclosure.
71 Carbon Policy – How robust measurement and verification can improve policy effectiveness.
Rowse, B., CarbonetiX Pty Ltd., http://www.smashwords.com/books/view/332515

204 | P a g e E n e r g y E f f i c i e n c y i n B u i l d i n g s
ENERGY EFFICIENCY CODES FOR
BUILDINGS
SUMMARY
Effective building codes and standards are one of the most cost effective
ways of achieving large energy savings. For example good passive
design is something that can save large amounts of energy, yet the
opportunity for good passive design is largely lost once the building is
built.
However in Malaysia EE building standards or codes have not been
widely adopted across all 148 municipalities.
In Malaysia MS 1525: Code of Practice on Energy Efficiency and Use of
Renewable Energy for Non-Residential Buildings if complied with limits
maximum energy intensity to around 200 kWh/m2/year. It is referred to
in the 2012 amendment to the Uniform Building By-Laws (UBBL) which
are used to regulate the construction of buildings in Malaysia. However
only one state in Malaysia has gazetted this amendment.
Rather than focus on further enhancing or expanding the scope of EE
building codes and standards, the recommended approach for the 11th
Malaysian plan is to focus on improving the application of the Uniform
Building By Laws (UBBL) across the country and adopting more of the
provisions of MS1525 into the UBBL, whilst also continuing to support
the voluntary application of MS 1525 in the construction of “green”
buildings.

205 | P a g e E n e r g y E f f i c i e n c y i n B u i l d i n g s
Until such point that codes are widely applied, the economies of scale
that result in the construction industry effectively internalising the
additional costs cannot be realised.
The International Energy Agency has developed a ten step process
encompassing the plan-implement-monitor-evaluate process that
addresses these barriers. It is suggested that Malaysia adopt a
consultative process to both review its past achievements and how to
identify how to fully apply this process over the 11th Malaysian plan. This
can include having KPKT raising the awareness of state and local
government of the benefits of mandatory building standards, and the
provision of training to state and local government as to how to manage
compliance.
Once code compliance is widespread, Malaysia can then move to
tighten codes and expand their application. A suggested pathway is that
Malaysia set building energy intensity requirements that lower every five
years such that new buildings use zero net energy by 2040, and that
these be widely communicated to enable industry to prepare
appropriately.
CURRENT BUILDING ENERGY EFFICIENCY CODES
AND PRACTICE IN MALAYSIA
Malaysia has developed a voluntary building energy efficiency standard
for non-residential buildings – MS 1525: Code of Practice on Energy
Efficiency and Use of Renewable Energy for Non-Residential Buildings.
Part of this has been incorporated federally in the Uniform Building By-

206 | P a g e E n e r g y E f f i c i e n c y i n B u i l d i n g s
Laws (UBBL) 2012, however only one state has adopted this as a
mandatory building code.
MS1525 is targeted at commercial buildings, particularly office buildings.
It both provides recommended measures and prescribes energy
performance standards for different elements of the building. For
example it recommends maximum permissible rates for heat transfer
through the building fabric and prescribes maximum lighting power
densities.
No standards exist yet for residential buildings, although these are now
in the early stages of being developed.
Initially developed in 2001, two revisions of MS 1525 have subsequently
occurred – in 2007 (revision 1) and now in 2014 (revision 2). MS1525
has been developed with wide industry consultation
MS1525 and the UBBL
In Malaysia construction practices are regulated by the Uniform Building
By-Laws (UBBL).
At the federal level in 2012 two of the provisions of MS1525 (2007) were
incorporated in the UBBL. Specifically clause 38A Energy efficiency in
buildings was added, which states that:
1. New or renovated non-residential buildings with air-conditioned space
exceeding 4,000 square metres shall be

207 | P a g e E n e r g y E f f i c i e n c y i n B u i l d i n g s
a) designed to meet the requirements of MS 1525 with regards to the
Overall Thermal Transfer Value (OTTV) and the Roof Thermal Transfer
Value (RTTV); and
b) provided with an Energy Management System.72
2. The roof of all buildings, residential and non residential, shall not have
a thermal transmittance U value greater than:
a) 40 W/m2.K for a light weight roof of under 50 kg/m2;
b) 60 W/m2.K for a light weight roof of under 50 kg/m2;
Unless provided with other shading or cooling means.
Whilst this change has been gazetted federally, enforcement of the
UBBL is at the state level, and relies on the state government gazetting
it for it to become mandatory in any state.
Application of the EE provisions in the UBBL
So far only Selangor has gazetted the 2012 amendments to the UBBL,
so with the exception of Selangor the application of EE building
standards is voluntary.
72
http://www.eria.org/events/6.%20UBBL%202012%20Amendments%20on%20EE%20and%20MS152
5%20-%20Ir%20Ahmad%20Izdihar.pdf
208 | P a g e E n e r g y E f f i c i e n c y i n B u i l d i n g s
Various green building rating systems, including the Green Building
Index, GreenRE, tools developed by JKR and by Melaka state refer to
MS1525 and require adherence to its provisions.
This has meant the adoption of MS1525 in the construction of green
buildings. Tax incentives have also stimulated the construction of more
energy efficient buildings.
Its estimated that around 500 Malaysian buildings have incorporated
some or all of the elements of MS1525.73
Note that effective 1 July 2014 the GBI has required mandatory
compliance with Bylaw 38A for buildings wishing to be GBI certified.
Voluntary energy efficient design of new buildings
From 2009 Malaysia has very quickly developed a vibrant green
buildings industry.
The Green Building Index (GBI) reports that 100 million square feet has
now been GBI certified.74
Based on GBI data, GBI certified new non-residential buildings are
estimated to be savings on average around 100 kWh/m2/year, equating
to around 75 kg CO2-e/m2, and energy cost savings of about RM 40/m2
(assuming a tariff of RM 0.40/kWh). Further analysis of GBI data
73 This is the number of buildings registered with the GBI as shown on the GBI website,
www.greenbuildingindex.org
74 As of 10 May 2014.

209 | P a g e E n e r g y E f f i c i e n c y i n B u i l d i n g s
(assuming an average construction cost of RM 3,000/m2) indicates that
on average the additional construction cost to achieve GBI certification is
estimated to be around RM 100/m2, providing a payback of around 2 ½
years.
Why aren’t the use of EE building codes mandatory across
Malaysia?
Two key reasons have been identified for the lack of mandatory uptake.
1. The states have not been convinced of the benefits of application
of the UBBL. For example from the recent major update to the
UBBL (2012), five states have gazetted some of the other
provisions, but only one state, Selangor, has adopted the EE
provisions. Selangor adopted all of the 2012 updates in the UBBL.
KPKT have identified that a convincing argument has not been
presented to the states as to why the EE provisions in the UBBL
should be adopted.
2. Local municipalities in Selangor, however, have not insisted on
compliance with the EE provisions. The reason for this is believed
to be a lack of understanding of the EE provisions and how to
verify that the certifying engineer has ensured compliance with
Clause 38A.

210 | P a g e E n e r g y E f f i c i e n c y i n B u i l d i n g s
THE IMPORTANCE OF BUILDING ENERGY
EFFICIENCY CODES TO ENERGY SECURITY AND
REDUCING ENERGY CONSUMPTION.
The long life of buildings mean that building EE design and construction
codes have a long term impact on a country’s energy consumption, and
thus its long term energy security and carbon emissions.
Good passive design is something that can save large amounts of
energy, yet the opportunity for good passive design is largely lost once
the building is built. Only some elements of passive design – such as
cool roofs - can be cost effectively retrofitted to existing buildings.
Whilst the literature states that there is an opportunity to realise large
savings in buildings when major plant and equipment is replaced at
roughly 15 year cycles, the reality is that generally the key energy using
equipment – that used to ventilate and cool the building, is generally only
refurbished every 25 to 30 years.
And lighting fixtures similarly may only be upgraded on a 20 to 25 year
cycle, not necessarily accompanied by a new lighting design to get the
most advantage from newer more efficient technology.
Replacing equipment out of the normal replacement or retrofit cycle is
generally not cost effective based on energy savings alone.
It is therefore much easier to design in high efficiency into buildings that
it is to retrofit it.

211 | P a g e E n e r g y E f f i c i e n c y i n B u i l d i n g s
In countries with high rates of new construction, such as Malaysia, the
energy efficiency of new buildings is one of the key determinants of the
country’s future energy requirements.
Building codes and Malaysia’s future energy consumption.
Based on Energy Commission data, in 2012 commercial and residential
electricity consumption (presumably of which all is used by buildings),
represented 54% of national electricity consumption.
The same data set shows that the number of commercial and residential
consumers tripled between 1990 and 2012. If this trend continues, by
2031 the number of consumers will be double those of 2014.

212 | P a g e E n e r g y E f f i c i e n c y i n B u i l d i n g s
This strong growth in the number of consumers, if continues, means that
building standards around EE have a substantial forward impact if they
are widely implemented.
If for example Malaysia was to have building standards adopted and in
use, that set maximum allowable Building Energy Intensity (BEI) targets
as per table 12 below, then the cumulative effect on total building sector
electricity consumption by 2040 would be a reduction in annual usage of
20% compared with no standards, saving RM 8 billion and 16 million
tonnes of greenhouse gas annually.75
75 Rough estimate based on electricity consumption continuing to grow in line with the historical trend.

213 | P a g e E n e r g y E f f i c i e n c y i n B u i l d i n g s
Table 12 - Suggested future BEI targets for new buildings
Year compliance
required from
Maximum Building Energy Intensity
(kWh/m2/year)
2014 200 (achieved by compliance with MS1525
revision 2, 2014)
2020 150
2025 100
2030 50
2035 25
2040 0 net energy consumption.
However up to 2012, it would appear that energy efficient building
standards have had negligible measurable impact on building sector
electricity consumption in Malaysia. This highlights the key challenge of
using building standards to drive energy savings, which is getting the
standards applied.
So what has been achieved internationally, and what is international
best practice that Malaysia can learn from?

214 | P a g e E n e r g y E f f i c i e n c y i n B u i l d i n g s
GLOBAL EXPERIENCE WITH BUILDING ENERGY
EFFICIENCY STANDARDS
Energy efficiency standards for buildings are a widely applied globally,
and have been used since 1946. The maps below show the coverage for
new residential and non-residential buildings.
Figure 30 - Building codes for new residential buildings. From Modernising Building Energy Codes, IEA,
2013.
http://www.iea.org/publications/freepublications/publication/PolicyPathwaysModernisingBuildingEnergy
Codes.pdf

215 | P a g e E n e r g y E f f i c i e n c y i n B u i l d i n g s
Figure 31 Building codes for new non-residential buildings. From Modernising Building Energy Codes,
IEA, 2013.
http://www.iea.org/publications/freepublications/publication/PolicyPathwaysModernisingBuildingEnergy
Codes.pdf
Some of the global experience with Building EE standards is tabled
below

216 | P a g e E n e r g y E f f i c i e n c y i n B u i l d i n g s
Table 13 - Some of the global experience with Building EE standards
Country Summary of experience Key lessons learned
China Over two decades there has
been persistent effort to raise
standards. The incremental
costs of EE buildings have now
been largely internalised as
they are now accepted as
common practice.
Nationally conducted building
inspections by the central
government achieved a
reported 80% compliance rate
in major cities in 2008
An effective compliance regime ensures that industry moves
to EE construction as the norm.
However on the other hand in medium and small cities
compliance is believed to be much lower, with less effort at a
central level to ensure compliance.
Key factors important in China have been:
A standardised systems of compliance and enforcement.
Broad capacity of the construction industry to adopt EE
practices.
Widely available EE construction materials.
Ability and willingness to pay for the additional costs of
achieving compliance.
Capacity and motivation of local govt to enforce building
codes (possibly through the power that central government
can exert, e.g. by withholding funding).

217 | P a g e E n e r g y E f f i c i e n c y i n B u i l d i n g s
Country Summary of experience Key lessons learned
Mexico Developed a mandatory building code in
2001 but has largely failed to implement it as
local governments have failed to included it
in their building regulations.
Mexico is now trying to force compliance
through its nationally funded low-cost
housing program, requiring mandatory
compliance in order for funding to be
released. It is hoped that this experience
will help state and local governments will
become more familiar with the standard
and thus more willing to include them in
their local regulations.
Australia Residential energy construction standards
based on an asset rating have been effective
at reducing heating energy, but to date have
had less impact on cooling energy.
A key success factor has been strong
industry engagement and awareness and
very high levels of scheme compliance in
building design. Compliance costs are
included in the cost of obtaining a building
permit, making financing of compliance
largely self funding.
On the other hand, verification of
compliance in actual construction has not
been as robust as it has elsewhere (eg
California) and the design intent has not
necessarily been achieved. For example
insulation has been poorly installed.
Stronger enforcement to ensure that
buildings are compliant when they are
built, not just when they are designed,
would lead to higher savings.
Additionally it was nearly ten years from
introduction of standards before a review
of the actual measurable impact on home
performance was undertaken. As a result
some of the problems with compliance in
construction practices are now much
harder to resolve.

218 | P a g e E n e r g y E f f i c i e n c y i n B u i l d i n g s
Country Summary of experience Key lessons learned
Denmark Demark has had EE building
codes in place since 1961, when
the standard was set at 350
kWh/m2/year. The standard was
tightened in 1979, 1994, and every
five years since 2006. The current
standard (2010) is 55
kWh/m2/year, and by 2020 will be
10 kWh/m2/year. Refer to the
figure below.
A key feature of the Danish
approach has been to develop a
long term plan and clearly
communicate this to industry. So,
for example, builders already know
what the standard will be in 2020.
However Demark too has had
challenges with compliance. For
example a survey in 2000 found
that in 43% of the surveyed
houses insulation was missing on
internal pipes and water tanks.
Compliance is a challenge
everywhere!
Figure 32 Energy requirements in the Danish building code over time. From Modernising Building Energy
Codes, IEA, 2013.
http://www.iea.org/publications/freepublications/publication/PolicyPathwaysModernisingBuildingEnergy
Codes.pdf

219 | P a g e E n e r g y E f f i c i e n c y i n B u i l d i n g s
References:
Data in the table above is from the author (Australia) and otherwise from
these two publications, which are both highly recommended:
Mainstreaming Building Energy Efficiency Codes in Developing
Countries – Global Experiences and Lessons from Early Adopters.
World Bank Working Paper No. 204, World Bank, 2010,
http://www.esmap.org/sites/esmap.org/files/WP_204_GBL_Mainstr
eaming%20Building%20Energy%20Efficiency%20Codes%20in%2
0Developing%20Countries_Overview_1.pdf
Modernising Building Energy Codes, IEA, 2013.
http://www.iea.org/publications/freepublications/publication/PolicyP
athwaysModernisingBuildingEnergyCodes.pdf
Two key themes from the international experience are:
1. Ensuring compliance with standards is a challenge globally,
applying to both developed and developing countries. There are
many reasons for this, ranging for lack of capacity or interest at the
local government level, absence of a clear, unwavering
commitment over time at the central level, a lack of strong capacity
to enforce any construction standard, and a lack of finance.
2. Mandatory standards, however, are necessary, if high efficiency
buildings are to overcome the market barriers. “Removing or
lowering the market barriers to delivery of more energy efficient
buildings requires government intervention through mandatory

220 | P a g e E n e r g y E f f i c i e n c y i n B u i l d i n g s
building EE codes. There have been no exceptions, even in the
most developed economies in the world.”76 These market barriers
are:
- When a building purchase is made, the cost of providing
energy to the building is generally not an important factor in
the purchase decision, especially where energy costs are
subsidised. Its hare to convince the market of the financial
benefits of an energy efficient building.
- The “split incentive” – that is it costs the developer more to
build an EE building, but the developer doesn’t enjoy the
benefit of the lower energy bills that result.
- Lack of information and knowledge about EE, and EE
technologies, in the construction industry.
- The added complexity of designing and constructing a
building that is more energy efficient. For example, chilled
beams are much more complex than a fixed air system.
76 Mainstreaming Building Energy Efficiency Codes in Developing Countries – Global Experiences
and Lessons from Early Adopters. World Bank Working Paper No. 204, World Bank, 2010,
http://www.esmap.org/sites/esmap.org/files/WP_204_GBL_Mainstreaming%20Building%20Energy%2
0Efficiency%20Codes%20in%20Developing%20Countries_Overview_1.pdf

221 | P a g e E n e r g y E f f i c i e n c y i n B u i l d i n g s
SUGGESTED PATHWAY FOR EE BUILDING
STANDARDS GOING FORWARD IN MALAYSIA.
Malaysia has not been successful in ensuring widespread compliance
with building standards. On the other hand, for more prestigious
buildings industry has voluntarily adopted the use of MS1525, as this
sector of the market recognises and rewards green buildings.
The pathway forward needs to address the lack of compliance, whilst
also trying to enhance and support the voluntary uptake of standards
such as MS1525.
From a policy perspective a two phased approach is suggested:
First: enhance compliance with the EE provisions of the UBBL
Second: Once compliance becomes the norm, then tighten EE building
codes on a regular basis.
One. Enhance compliance with the EE provisions of the
UBBL.
The global experience shows that common reasons for the lack of codes
application are:
Lack of capacity: whether this be government capacity to promote
codes, administer their implementation and enforce compliance, or
industry technical capacity whether in design or construction.
Large elements of the construction industry that cannot see the
benefits of code compliance.

222 | P a g e E n e r g y E f f i c i e n c y i n B u i l d i n g s
Failure to get both building buyers to value energy efficiency and
developers to see the value in making buildings more efficient.
The International Energy Agency has developed a ten step process
encompassing the plan-implement-monitor-evaluate process that
addresses these barriers. It is suggested that Malaysia adopt a
consultative process to apply this process over the 11th Malaysian plan.
These steps and corresponding actions are replicated from the IEA
guidance in the figure below.

223 | P a g e E n e r g y E f f i c i e n c y i n B u i l d i n g s
Figure 33 IEA recommended building energy code policy pathway. From Modernising Building Energy
Codes, IEA, 2013.
http://www.iea.org/publications/freepublications/publication/PolicyPathwaysModernisingBuildingEnerg
yCodes.pdf

224 | P a g e E n e r g y E f f i c i e n c y i n B u i l d i n g s
Whilst Malaysia may have already implemented some of these actions,
more comprehensive implementation will improve outcomes. For
example, by clearly defining governance structures and institutional
arrangements at the federal, state and local government levels, with
consultation across these levels of government when developing these
structures.
An important part of steps 2 and 3 is to identify funding mechanisms,
including from complementary policies. One way of doing this could be
to create mechanisms to bring forward the operational cost savings to
the time of design and construction, which address the split incentive
discussed earlier. For example certificates from a Utility Energy
Efficiency Obligation could be used to achieve this. International
experience shows that including a levy in the cost of building approvals
can cover the cost of administrating and enforcing compliance.
The tax incentives for green buildings could also continue. However it is
recommended that they become more stringent over time. One way of
doing this could be to “raise the bar” for which the tax incentive apply.
For example, if tax incentives now are available when a building is
designed to achieve 150 kWh/m2/year, moving forward this threshold
could go to 125 kWh/m2/year, then 100 kWh/m2/year, and so on. By
clearly defining in advance a schedule for the changing of thresholds
industry has plenty of lead time to be prepared for progressively
tightening requirements.
The stakeholder consultation on 9 June 2014 identified that a key reason
for low uptake by state and local governments was that the benefits of

225 | P a g e E n e r g y E f f i c i e n c y i n B u i l d i n g s
compliance with Clause 38A of the UBBL had not been clearly
presented. It was suggested that:
A compelling case for the adoption of standards be put forward
KPKT then present this at its twice annual meetings with the state
governments and annual meetings with local authorities.
On the basis that the cost of a building increases by 1% in order to
comply with MS1525, and that this saves 50 kWh/year on average, the
energy savings provide a payback on the additional cost of around 1 ½
years. This is a compelling argument for states to gazette these
standards.
Stakeholders have also identified the need to provide training to state
and local government. Such training should focus on the process of
application of the standard, and how to ensure that the consulting
engineer has verified compliance.
Incentives for states could be provided on the condition that the EE
provisions be incorporated into the state UBBL as follows:
Direct financial transfers, for the purpose of employing personnel
to administer and enforce the use of standards, provided use of
the standard is made m.
Training for staff in enforcement.
Enhancing compliance, including greater state take-up of the EE
provisions in their building codes is recommended as being the key
focus for building codes in the 11th Malaysian plan.

226 | P a g e E n e r g y E f f i c i e n c y i n B u i l d i n g s
Two: tighten EE building codes on a regular basis and
expand their application to residential buildings
Once compliance is the norm then effort can be put into making new
buildings progressively more energy efficient.
Many developed countries now have ambitious long term plans to
reduce the energy use of new buildings.
In the EU, 28 countries have committed to new residential buildings
being “near zero energy” from 31 December 2020. The directive
2010/31/EU also requires that after 31 December 2018 new public
buildings are nearly zero energy.77
California’s target is for all residential buildings to use zero net energy by
2020, and all commercial buildings to use zero net energy by 2030.78
Malaysia intends to become a developed country by 2020, at the end of
the 11th Malaysian plan. It is recommended that it too set a pathway for
all new buildings to be zero net energy buildings by 2040, and could
then look to increase standards stringency every five years in line with
this. A suggested timeline is:
77 http://www.epbd-ca.eu/themes/nearly-zero-energy
78 http://www.cpuc.ca.gov/NR/rdonlyres/041CB347-6AA8-4EE7-AE3C-
324B4A3F0A98/0/ZNE_Action_Plan_June_2011_Update.pdf

227 | P a g e E n e r g y E f f i c i e n c y i n B u i l d i n g s
Table 14 - Pathway to making buildings use zero net energy
Year Building Energy Intensity (BEI),
kWh/m2
Now 200
2020 150
2025 100
2030 50
2035 25
2040 0
Over the period to 2020 it can also expand EE building codes to
residential buildings.
Responsibility
KPKT
SYNERGIES WITH OTHER POLICY MEASURES
Building codes have strong synergy with disclosure of building
operational performance.
There is considerable evidence that building efficiency standards alone
are not effective in realising the full energy saving potential of such

228 | P a g e E n e r g y E f f i c i e n c y i n B u i l d i n g s
standards. Good operational practices are needed, and this can be
driven by mandatory performance disclosure of actual operational
energy consumption. The synergy is shown in the graphic below.
Figure 34 - How energy codes and operational energy performance disclosure impact on a buildings
energy use over its lifetime. From Lining Building Energy Codes with Benchmarking and Disclosure
Policies, Global Building Performance Network and Institute for Market Transformation, March 2014.
http://www.imt.org/uploads/resources/files/Linking_Codes_With_Benchmarking.pdf
A National building energy consumption database can be used to
compare the design intent of new buildings with actual performance. For
example if by the application of MS1525 a building is expected to use
150 kWh/m2/year, this can be compared with actual operational
performance. This can then facilitate the development and tuning of
standards and codes.
A Utility Energy Efficiency Obligation (UEEO) could be used to
provide an up-front incentive for developers to build energy efficient
buildings. Based on actual operational performance, over the first (five?)
years of a building’s life, the developer could be provided annually with
energy efficiency certificates for sale on the UEEO market.

229 | P a g e E n e r g y E f f i c i e n c y i n B u i l d i n g s
ENERGY EFFICIENT TECHNOLOGIES /
CONSTRUCTION METHODS FOR NEW
BUILDINGS
SUMMARY
The Building Sector Energy Efficiency Project has developed a range of
policy papers examining opportunities to drive energy efficiency in
buildings.
Support for the rollout of specific technologies is a policy measure that
has been successfully used in a range of countries, including Malaysia
with its support of chiller upgrades under the SAVE program.
With Malaysia’s high rate of new construction energy efficient
technologies or construction methods that deliver energy savings can
have a large long-term impact.
Any technology or construction method supported must deliver energy
savings, have market acceptance, be capable of being delivered, be
effectively introduced and then eventually mandated through standards.
An alternative to this approach is to set performance standards, and
leave it up to the market to choose which technologies to adopt to meet
those targets.
Should Malaysia wish to set up a program to support the rollout of
specific technologies or construction methods in new buildings, this

230 | P a g e E n e r g y E f f i c i e n c y i n B u i l d i n g s
could be best done by setting up a long term program in CIDB, with base
funding of around RM 500,000 annually. A Utility Energy Efficiency
Obligation could be used to provide incentives to early adopters of the
technologies.
INTERNATIONAL EXPERIENCE
The supporting of the rollout of specific technologies is a reasonably
common policy measure.
Examples of some of the successful international experience include:
Malaysia: Support for the upgrade of chillers more than 15 years
old, under the SAVE program. SEDA, the program administrator,
reported good uptake of the SAVE incentive for chillers.
Belarus. Support for the replacement of inefficient boilers with new,
high efficiency boilers. Over a period of 20 years Belarus has more
than halved its energy intensity, with the boiler replacement
program playing an important role in the savings achieved.
Australia: Mandated lighting power density standards for new
residential buildings have supported the rollout of high efficiency
residential lighting, notably LED, substituting inefficient halogen
down-lighting that would otherwise have been used. Note that
whilst this policy hasn’t specified that LED lighting must be used,
this has been one of its impacts.

231 | P a g e E n e r g y E f f i c i e n c y i n B u i l d i n g s
KEY SUCCESS FACTORS
The technology or construction method must:
Deliver energy savings
Have market acceptance
Have an industry with capacity to deliver
Be effectively introduced
Move to mandatory application through building standards.
Deliver energy savings
Any new technology or construction method introduced should deliver
meaningful energy and or carbon savings.
Have market acceptance
The critical success factor is winning industry acceptance of the new
technologies / construction methods.
Anything that can either reduce costs or else alternatively cost-effectively
improve quality will be seriously considered.
Technologies or construction methods that do not provide any lifetime
ROI will not be accepted, except possibly for low volume high-end
construction.

232 | P a g e E n e r g y E f f i c i e n c y i n B u i l d i n g s
Have an industry with capacity to deliver
There must be capability to deliver the new technology or construction
method, encompassing:
Manufacture: Can it be manufactured locally, or easily imported
from overseas? Is the capacity available to meet demand? Can
manufacturing be easily established? Are the necessary raw
materials, skills and tooling readily available?
Supply: Are the logistics of supply feasible (e.g. distance from
factory, ease of transportation, ease of storage)?
Installation: Do the skills exist for proper installation?
Commissioning: Is commissioning required, and do the skills exist
to enable this?
Be effectively introduced
Elements important to successfully introducing a new technology or
technique include:
A high profile, well-respected champion
Adoption and promotion by industry bodies
High profile rollout
Skills development

233 | P a g e E n e r g y E f f i c i e n c y i n B u i l d i n g s
Move to mandatory application through building standards
So that a new technology or construction method becomes the norm its
application should eventually be mandated through building standards.
WHAT SHOULD THE FOCUS BE ON?
The requirements for commercial and residential buildings are different.
Commercial buildings
The passive design guidelines developed by BSEEP identify that for
commercial buildings the very largest contributors to energy use are:
Lighting energy: Representing 34% of building energy use when
the heat load generated by lighting is taken into account
Small power energy (i.e. plug loads), representing 31% of building
energy use when the heat load is taken into account.
Air handling fan energy, representing 14% of building energy use
when the heat load is taken into account.
Solar heat gain, representing just under 10% of building energy
use.
Dehumidification, representing just under 10% of building energy
use.
Note that these percentages should be considered as indicative only

234 | P a g e E n e r g y E f f i c i e n c y i n B u i l d i n g s
Based on this analysis, for commercial buildings the focus of new
technologies or construction methods should be on:
Reducing lighting energy use, by:
o Better use of daylighting
o Good controls to ensure that the use of powered lighting is
minimised in response to daylighting
o High efficiency lighting, comprised of the lighting design,
selection of luminaire, and light source.
Reducing plug loads. This is unfortunately largely outside of the
control of the building designer and builder. Timed power outlets,
that switch off at certain times of day to reduce standby energy can
make a small contribution.
Reducing air handler fan energy use. Achieved by:
o Design of cooling system (flow rates, temperatures, duct
design, air distribution design, fan selection, filter selection)
o Design to distribute cold by refrigerant or water, and not air.
Reducing solar heat gain. Achieved by:
o Shading
o Window selection
o Window size and orientation
Reducing dehumidification loads. Achieved by:
o Control of air volumes / air quality
235 | P a g e E n e r g y E f f i c i e n c y i n B u i l d i n g s
Residential buildings
No detailed analysis has been undertaken of the largest contributors to
energy use.
For buildings with air conditioning (around say 50% of Malaysian homes,
and growing), the largest contributors to energy use will likely be:
Plug loads (fridge, TV etc)
Solar heat gain
Conductive heat gain (terrace homes)
Hot water (if any)
Lighting
Dehumidification
Based on this, for residential buildings the focus of new technologies or
construction methods should be on:
Reducing plug loads. This is unfortunately largely outside of the
control of the building designer and builder.
Reducing solar heat gain. Achieved by:
o Shading
o Window selection
o Window size and orientation
Reducing conductive heat gain (terrace homes). Achieved by:
o Roof insulation

236 | P a g e E n e r g y E f f i c i e n c y i n B u i l d i n g s
o Wall insulation
Reducing hot water energy use. Achieved by:
o Solar hot water
Reducing lighting energy use, by:
o Better use of daylighting
o High efficiency lighting, comprised of the lighting design,
selection of luminaire, and light source.
Reducing dehumidification loads. Achieved by:
o Lockout on lowest temperature room can be cooled to. Eg.
Say 23 degrees. Would need to be programmed into the air
conditioner / air conditioner would need to be capable of
having this programmed.
Likely technologies/construction methods
Based on the above analysis areas of focus for new
technologies/construction methods can be identified.
Incremental vs step change
Incremental improvements are more likely to be accepted than step
changes. Step changes which disrupt existing supply chains will attract
strong opposition from the existing supply chain, and may be hampered
by lack of skills.
Incremental improvement
237 | P a g e E n e r g y E f f i c i e n c y i n B u i l d i n g s
Improved use of passive design features such as shading and
orientation to maximise daylighting.
Improved lighting and lighting control
Improved cooling system design and efficiency
Improved glazing
Improved ventilation control
Electrical design/installation to provided timed power outlets
Solar hot water (terrace homes)
Roof insulation
Rooftop solar PV
Improved sealing
Step changes
Insulated walls
Low concrete construction
Building integrated solar PV
Solar hot water (high rise)
Night purge / night cooling
Possible innovation opportunities
The dimming of a single LED light source is relatively easy to
achieve. Dimming of lights in a commercial building in response to
changes in daylight is more complex, as the amount of dimming

238 | P a g e E n e r g y E f f i c i e n c y i n B u i l d i n g s
required can vary, and is not yet something that has been done in
an affordable way. A great innovation opportunity!
Improved glazing. Single glazing with a hard low emissivity coating
performs much better than the single glazing used in most
buildings in Malaysia. With increasing demand costs should lower.
Building shading. Present practice means that shading elements
are expensive. There could be opportunities to use different
materials to cut costs / improve cost-benefit.
Solar PV. The installed cost of rooftop solar PV is extremely high
in Malaysia (e.g. double that of Australia and Germany). The
mandatory use of solar PV in new buildings could drive innovation
to reduce costs by creating a competitive market.
Night purge / night cooling. Malaysia has around 6 hours a day on
average where the ambient dry-bulb temperature is a very
comfortable 24OC. However little use of this is made to cool
buildings. Changing the way that buildings are cooled to make
better use of low night time temperatures could provide valuable
savings to commercial buildings. Further innovation that can
overcome the nuisance of mosquitos and outside noise also
makes this applicable to residential buildings.
Malaysia’s climate is such that solar hot water can be provided
without the need for any electric boosting. Low cost solar hot water
innovations from China could be adapted.
Changed construction techniques to provide low-concrete
construction and wall insulation for terrace homes.
239 | P a g e E n e r g y E f f i c i e n c y i n B u i l d i n g s
SUGGESTED POLICY PATHWAY
Malaysia has an active green building community which is keen to
reduce the energy consumption and environmental footprint of new
buildings. Support for specific technologies/construction techniques
could be provided through CIDB as follows, with the same process
followed for each technology:
1. Identify the preferred technology / construction technique.
2. Identify the extent to which this is currently being used in Malaysia
3. Identify the barriers to use
4. Develop interventions to overcome the barriers with industry
5. Help early adopters in industry use the technology/construction
technique
6. Promote the results of this and develop guidelines
7. Run training courses
8. Provide targeted incentives to achieve high awareness and
adoption
9. Monitor results.
For example, table 15 below shows how this process would be applied
to glazing:

240 | P a g e E n e r g y E f f i c i e n c y i n B u i l d i n g s
Table 15 Example of the process of promoting the use of a particular
technology or construction technique: improved glazing
Identify the preferred technology /
construction technique.
Single glazing with a hard low emissivity coating
Identify the extent to which this is
currently being used in Malaysia
Relatively low
Identify the barriers to use Cost, availability, window manufacturer and designer awareness
Develop interventions to overcome the
barriers with industry
Cost: Discuss scale, cost and availability issues with local glazing
and window manufacturers. Provide tax incentives or similar to
enable tooling up for low-e glazing manufacture if required.
Awareness: Run a campaign targeting all window manufacturers
and building designers.
Help early adopters in industry use the
technology/construction technique
Support a number of case study buildings, both residential and
non-residential. Data log temperature and power consumption. Do
a comparison with/without low-e glazing
Promote the results of this and develop
guidelines
Develop guidelines, run training workshops, target all window
manufacturers and building designers.
Run training courses Run hands on training workshops, targeting municipalities
representing 80% of Malaysian new building activity.
Provide targeted incentives to achieve
high awareness and adoption
Provide incentives over say a 3 year period for the use of low-e
glazing. (For example, through a Utility Energy Efficiency
Obligation) Then after 5 years make use of low-e glazing
mandatory (in MS1525)
Monitor results. Monitor results through a National Building Energy Consumption
Database.
Administration
A small division could be set up in CIDB to run this program over a
period of say 20 years, helping drive Malaysia to having all new

241 | P a g e E n e r g y E f f i c i e n c y i n B u i l d i n g s
buildings using zero net energy by 2040, by progressively introducing a
range of different technologies and construction techniques.
Staff employed in this division would include:
Manager
Engineer, technology evaluation and assessment
Training Coordinator
Promotion / Case study developer
Timeline
A timeline of around 10 years could be considered reasonable from first
introduction of a new technology or construction technique through to
when it is made mandatory.
Funding
Excluding incentives, which could be funded by a Utility Energy
Efficiency Obligation, funding of approximately RM 500,000 annually
could drive program administration and outreach.

242 | P a g e E n e r g y E f f i c i e n c y i n B u i l d i n g s
ENERGY PERFORMANCE
REQUIREMENTS FOR GOVERNMENT
BUILDINGS
SUMMARY
There are a large number of countries which have energy performance
requirements for government buildings. These range from construction
standards more stringent than those which apply to other buildings, to
reporting publicly on energy consumption, through to achieving high
operational performance.
It is suggested that Malaysia require:
The mandatory compliance for new or refurbished government
buildings with JKRs performance requirements (which go beyond
that required by MS1525).
Mandatory annual public reporting on energy consumption of
existing buildings
A requirement to improve the energy performance of existing
buildings, enabled by both:
o A requirement for Ministries to employ energy managers and
implement energy planning activities in accordance with ISO
50001
o Energy Performance Contracts of government buildings.

243 | P a g e E n e r g y E f f i c i e n c y i n B u i l d i n g s
Compliance requirements would be enforced by JKR, the reporting and
improvement requirements by the Energy Commission, aided by the
Ministry of Finance.
Presently core federal government buildings79 are roughly estimated to
use RM 80m of electricity annually, and across the 22,300 government
buildings annual energy costs are estimated at RM 1.9b. A well
implemented policy has the potential to reduce energy consumption in
government buildings by 10% over the first three years with a payback of
around three years, including administration costs. Subsequent
additional savings in future years will more than cover the costs of
compliance.
In addition to the budgetary benefits this policy will build up capacity in
reporting on and reducing building energy use, and can be used to
support the implementation of building performance disclosure, the
development of a National Building Energy Reporting Database and the
introduction of mandatory standards of all buildings.
These benefits will not be realised without effective policy
implementation. This requires enhancing the authority of the EC to
collect performance data and require performance improvements, and
capacity building and effective resourcing of government building energy
managers to enable timely reporting and effective building operations to
reduce energy use.
79 Office buildings only

244 | P a g e E n e r g y E f f i c i e n c y i n B u i l d i n g s
This measure is highly synergistic with building standards, performance
disclosure, and a national building energy consumption database, as
outlined in the three policy discussion papers addressing each of these.
It could also be expanded to require government department and
agencies to enter into energy performance contracts. This would give
large savings and aid in building up an ESCO industry in Malaysia.
ENERGY PERFORMANCE REQUIREMENTS FOR
GOVERNMENT BUILDINGS
Energy performance requirements for government buildings enable
government to lead by example in EE. This can build capacity in the
development and operation of energy efficient buildings. They also can
be of significant beneficial impact on government budgets through
reduced energy bills.
Performance requirements can either be specified in terms of
prescriptive requirements, or in terms of actual energy performance.
Prescriptive requirements
Prescriptive requirements outline either requirements for building design
and construction or in operation. Some examples of prescriptive
requirements are:
A requirement that a building be designed to achieve a thermal
transmittance value be below a certain level, as is specified in
MS1525.

245 | P a g e E n e r g y E f f i c i e n c y i n B u i l d i n g s
An operational requirement might be that the temperature be set at
a certain level. E.g. in Malaysia there is a high level directive that
government buildings should have the temperature set to 24OC.
Another form of prescriptive requirement would be to require the
implementation of an Energy Performance Contract.
Actual energy performance
Standards around actual energy performance prescribe the maximum
amount of energy that a building can use. This could be represented as
either an actual value (eg 150 kWh/m2/year) or as a rating (eg a
minimum 4 star rating), where the rating is based on actual performance
but also normalised to the building (eg normalisation based on hours of
occupancy).
INTERNATIONAL EXPERIENCE
Internationally many countries have performance requirements for public
buildings. Some of these are briefly outlined below:
In Singapore new government buildings in certain areas need to
achieve Green Mark Gold or better.80
In the USA “Forty seven states have energy efficiency requirements for
state-owned or funded public buildings that go beyond the state energy
code”81 These are varied and include:
80 http://www.bca.gov.sg/EnvSusLegislation/Environmental_Sustainability_Legislation.html

246 | P a g e E n e r g y E f f i c i e n c y i n B u i l d i n g s
LEED requirements for new or renovated buildings
Requirements to meet ASHRAE standards
Requirements to meet Green Globe or Energy Star requirements.
In Australia, the NSW state government requires that government
buildings over 1,000 m2 are required to achieve and maintain “where
cost effective” a NABERS rating of at least 4.5 stars.82
In the state of Victoria all state government departments and agencies
have been required to enter into an Energy Performance Contract for
buildings representing 90% of their energy use.
In Korea new public or renovated public buildings larger than 3,000 m2
are required to incorporate at least 10% renewable energy, rising to 20%
by 2020. New buildings are required to meet the highest standard in
energy performance certification. Public buildings larger than 10,000 m2
are required to propose an ESCO project.83
In Europe EU28 countries are required to undertake performance
ratings of large public buildings not less than once very ten years, under
the Energy Performance of Buildings Directive (EPBD). The rating needs
to be publicly displayed.
81 http://www.ncsl.org/research/energy/energy-efficiency-requirements-for-public-buildings.aspx
82 http://www.environment.nsw.gov.au/government/nabers.htm
83 Energy Policies of IEA Countries: Republic of Korea, 2012 Review. IEA.

247 | P a g e E n e r g y E f f i c i e n c y i n B u i l d i n g s
“By 2018, all new public buildings must be near zero energy and all
existing public buildings over 500 m² must be certified and display
certificates (from 2015 this demand will cover all public buildings of more
than 250 m²)”84
The UK has gone beyond the European requirements, requiring the
annual renewal of the Display Energy Certificate for public buildings of
above 1,000 m2.
84 Energy Performance Certification of Buildings, IEA, 2010.

248 | P a g e E n e r g y E f f i c i e n c y i n B u i l d i n g s
Figure 35 - Display Energy Certificate from the UK.

249 | P a g e E n e r g y E f f i c i e n c y i n B u i l d i n g s
MALAYSIAN EXPERIENCE
Malaysia has used government buildings to demonstrate good EE
practice, notably the LEO, GEO and Diamond buildings.
Malaysia has a directive in place that government buildings have their
air-conditioning set to deliver air at 24 OC.
The extent of uptake of this policy is unknown. In some buildings, such
as the JKR office or the EPU building, this policy is not being adhered to,
with temperatures of around 20 OC.
This reflects a common challenge with directives and standards – unless
mechanisms are put in place to enable or enforce compliance then
uptake may be patchy. Any approach imposing performance
requirements on buildings need to ensure that there are adequate
mechanisms and resources in place to enable this.
105 federal government buildings are required to report on their energy
use to the Energy Commission (EC) under the Efficient Management of
Electrical Energy Regulation (EMEER) 2008. However this information is
not reported publicly.
With respect to new buildings, there are not yet any special requirements
for new government buildings.

250 | P a g e E n e r g y E f f i c i e n c y i n B u i l d i n g s
SUGGESTIONS FOR MALAYSIA
Three suggestions for Malaysia are:
The mandatory compliance for new or refurbished government
buildings with JKRs design requirements
Mandatory annual public reporting on energy consumption of
existing buildings
A requirement to improve the energy performance of existing
buildings, enabled by dedicated energy managers using MS-ISO
50001.
Mandatory compliance with JKRs design requirements
JKRs design requirements go beyond that of MS1525 in incorporation of
energy efficiency features that enable lowered operational energy use.
Adoption by government will help industry development and pave the
way for MS1525 requirements to eventually be tightened.
It is recommended that standards for new or refurbished government
buildings then be tightened every five years, with notice of the new
requirements issued three years in advance.

251 | P a g e E n e r g y E f f i c i e n c y i n B u i l d i n g s
Mandatory annual public reporting on energy consumption of
existing buildings
This will help government identify poorly performing buildings and target
these with more efficient operational practices.
Making disclosure of performance public will provide both an example to
the general public, and provide a motivator for buildings to improve their
performance.
Improvements to operational practices can provide very good paybacks,
and make a contribution to reduced government expenditure on
electricity.
New buildings would need to begin mandatory annual public reporting
two years after the date of issue of the certificate of occupancy. This
would be additional motivator for good design and construction practices
and compliance with MS1525 during construction, as new buildings that
performed poorly would like attract public scrutiny.
A requirement to improve the energy performance of existing
buildings
Once government buildings have identified their energy use, there can
then be a requirement to improve their performance. The level of
improvement would depend on the normalised energy intensity reported.
Those with poor performance would be required to achieve the greatest
improvement.

252 | P a g e E n e r g y E f f i c i e n c y i n B u i l d i n g s
To enable this it is suggested that all ministries be required to employ an
energy manager, tasked with developing an Energy Management Plan,
and having the organisation adopt MS-ISO 50001.
Any public disclosure of building performance could show the
performance in the previous two years (as is done in the UK). This would
provide further motivation for performance improvement.
Malaysia could also look into requiring the implementation of Energy
Performance Contracts (EPC) in government buildings. Buildings could
be selected either on their size (as done in Korea) or departments and
agencies could be required to implement an EPC for buildings
representing 90% of their energy use (as done in Victoria, Australia).
However, the implementation of EPCs in the absence of an overall
Energy Management Plan is not recommended. An Energy
Management Plan ensures that there is strong corporate support and
awareness of energy efficiency; where an EPC or other energy saving
initiatives are implemented without this support the results can be sub-
optimal.
Implementing these suggestions
Initially it would only be possible to target federal buildings. However the
implementation could be undertaken in a transparent fashion that would
enable states to replicate the requirements, should they so choose.
At present the Department of Public Works (JKR), within the Ministry of
Works, is generally responsible for new government buildings or major

253 | P a g e E n e r g y E f f i c i e n c y i n B u i l d i n g s
refurbishments, although individual ministries may decline this
assistance. Data on the energy consumption of some public buildings is
now collected by the Energy Commission (EC).
This arrangement could continue, with JKR tasked with the ensuring
compliance for new buildings or refurbishments, and the EC responsible
for ensuring government reporting and improvements in existing
buildings.
The authority of the EC would need to be enhanced to enable it to
collect data, which could be achieved through changes to the Efficient
Management of Electrical Energy Regulations 2008.
The Ministry of Finance could play a role in:
(a) Instructing department and agencies to get JRK approval for new
building designs, as a condition for the provision of funds.
(b) Assisting the EC enforce the requirement that government
buildings reduce their energy use, by setting operational energy
budgets based in line with EC nominated improvement targets.
Reporting procedures and templates would also need to be developed.
The EC would likely need additional resources to enable effective
administration and compliance.
Good inter-agency collaboration is important to enable high levels of
compliance and implementation.

254 | P a g e E n e r g y E f f i c i e n c y i n B u i l d i n g s
Likely costs and benefits
For new buildings the life-cycle costs of energy efficient buildings are
clearly established.
Similarly performance disclosure fosters cost-effective improvements to
building performance. Requiring annual improvement forces cost-
effective savings opportunities to be identified and implemented.
Based on representations that many Malaysian buildings now use 250 to
300 kWh/m2/year, for the existing government building stock an overall
reduction in energy use of 10% after three years with an overall payback
of three years would not be an unreasonable expectation for a well
implemented policy.
On the basis that federally Malaysia has 648,000 m2 of federal office
buildings85, that the average energy intensity is 250 kWh/m2/year, and
that the average tariff is RM 0.50/kWh, then annual expenditure on
electricity consumption is around 81m RM.
An annual 10% saving is around RM 8m, and corresponds to 12,000
tonnes of greenhouse gas emissions being saved annually.
Resourcing costs for policy implementation would likely be in the vicinity
of RM 4m annually, as follows. Note these figures are indicative only and
a proper budget would need to be drafted
85 Totalling the data from the list of federal buildings at http://www.kkr.gov.my/en/node/31328. The
details of the types of buildings on this list is not clear. Presumably these are only office buildings.

255 | P a g e E n e r g y E f f i c i e n c y i n B u i l d i n g s
Training and funding of government energy managers: RM
2,500,000
Additional resources to the EC: RM 1,000,000
Additional resources to JKR: RM 500,000
Total RM 4,000,000
If after three years the policy was saving RM 8m annually, the costs of
policy implementation would easily be covered. Savings could potentially
be applied to assist states introduce similar requirements for their
buildings.
SYNERGIES WITH OTHER POLICY MEASURES
This measure is highly synergistic with building standards, performance
disclosure, and a national building energy consumption database, as
outlined in the three policy discussion papers addressing each of these.
Government adoption of performance requirements could be used to
introduce performance disclosure and a national building energy
consumption database.

256 | P a g e E n e r g y E f f i c i e n c y i n B u i l d i n g s
ENABLING ESCO DELIVERED
PROJECTS
SUMMARY
Malaysia’s Green Technology Financing Scheme has RM 3.5b of
funding available as a loan guarantee for projects that reduce energy
consumption, including building energy efficiency retrofit projects that
provide guaranteed savings and are delivered by Energy Services
Contractors (ESCOs).
However no ESCO projects have yet been implemented through this
fund. Some of the reasons for this are:
Very little experience and familiarity in Malaysia with such projects
The lack of standard process and contracts
Financial risk is considered as high by financiers
To kick start the languishing ESCO industry in Malaysia a four pronged
approach is recommended to reduce actual and perceived risk. Direct
government loan funding is one element in this approach. By making the
government the client and guarantor of the finance, third party risk is
eliminated.
However, more than this is needed. Government should commit to
undertaking a certain number of contracts each year, to build up ESCO
capability. A standard process for undertaking contracts should be
developed. Standard contracts need to be readily available. And skills

257 | P a g e E n e r g y E f f i c i e n c y i n B u i l d i n g s
need to be developed in undertaking investment grade energy audits,
project management of integrated energy efficiency retrofit projects, and
measurement and verification.
To illustrate the need for a multipronged approach the experience of the
starting of the ESCO industry in Australia is presented, which began in a
large way with the Greener Government Buildings Program in the state
of Victoria.
ESCOS – LIMITED BY A FUNDING CONSTRAINT?
Energy Services Contractors (ESCOs) offer large energy users the
opportunity to save energy and be cash-flow positive from the start,
through the delivery of an Energy Performance Contract (EPC) - see
figure below. But this all depends on the ESCO being able to source
funding.
Energy User
Financier
Energy
Services
Contractor
(ESCO)
Finances the
EE works
Repays
the loan
Pays for the
works
Implements
the works
Guarantees the
savings

258 | P a g e E n e r g y E f f i c i e n c y i n B u i l d i n g s
Figure 36 – How an energy performance works. By guaranteeing the savings an ESCO can deliver energy
savings that are cash flow positive to the energy user from the start.
Unfortunately where EPCs are not common practice, ESCOs generally
find it difficult to find financing. Some reasons for this are:
Limited or no previous experience from financial institutions in
funding ESCO projects
Banks and other financial institutions see either the ESCO or the
energy user as a credit risk. Typically performance contracts run
from 7 to 10 years. If either the ESCO or energy user becomes
insolvent over this period the financier may not be able to recoup
their costs.
Contract values may be small relative to the work involved in
establishing a contract. For example a $2m contract, whilst this
may be sizeable to a local ESCO, to a bank that funds construction
projects its relatively small.
Lack of standard contracts, leading to high transaction costs.
Lack of capacity to independently verify savings
Insufficient expertise in a bank or financial institution to assess the
level of risk
A large part of a project’s cost is unrecoverable if the event of
default. For example, an upgrade to a building management
system (a typical ESCO project) will typically have well over half of
the costs unrecoverable, as it is a bespoke solution.
Unavailability of insurance products to cover the risk.

259 | P a g e E n e r g y E f f i c i e n c y i n B u i l d i n g s
This financing deadlock means that many energy efficiency projects may
not be implemented. And it can be difficult for an ESCO market to
develop when neither banks or ESCOs have much experience.
Is breaking the financing deadlock enough to kick-start the
industry?
One way of breaking the deadlock might be for government to provide
direct loan funding to ESCOs for the implementation of performance
contract on government buildings.
Essentially the government (although most likely different
ministries/departments) becomes both the client to the ESCO and the
financier. This essentially means there is no third party risk.
Whilst there is still an element of risk, the risk is reduced compared with
the alternate model based on a consultant undertaken energy audit.
In China the ESCO industry was kick started when large state owned
enterprises used their own balance sheets as loan guarantees and the
IFC and World Bank provided financing guarantees through commercial
banks. And in Korea the Korea Energy Management Corp provides loan
funding through commercial financial institutions. In 2012 it had USD

260 | P a g e E n e r g y E f f i c i e n c y i n B u i l d i n g s
175m of ESCO financing budgeted; the interest rate is low at around 2%
to 3%.86
Under the energy audit model, an energy auditor is contracted to identify
and quantify energy savings opportunities. The energy user may then
chose to project manage the works implementation directly, or even
contract the auditor to do this. However the auditor bears no financial
responsibility for ensuring that savings are achieved.
Unfortunately auditors can get it wrong, and it’s the energy user who
bears the cost of this. A study by Texas A&M when evaluating the work
of pre-qualified energy auditors five years after projects had been
implemented found that measured cost savings on average, across 24
projects, were 25.1% lower than estimated. In some cases, savings were
as little as 5.5% as what was estimated! 87
Under a performance contract, the ESCO takes the financial
responsibility for any shortfall in savings, thus reducing the risk of a
savings shortfall.
In Australia two states have set up programs using direct government
loan funding for performance contracts.
86 International Experience in ESCO Financing, Khanna A., World Bank.
http://www.eesl.co.in/Website/Portals/0/NCSL_Presentations/Ashish-International-experience-on-
ESCO-financing.pdf
87 As reported in Investment Grade Energy Audit: Making Smart Energy Choices, 2004, Hansen S. &
Brown J., The Fairmont Press Inc.

261 | P a g e E n e r g y E f f i c i e n c y i n B u i l d i n g s
The Victorian Greener Government Buildings Program (GGBP) used
zero interest funding from the Department of Treasury and Finance to
finance state government departments and agencies for the
implementation of energy performance contracts. A panel of pre-
selected ESCOs88 competed to deliver the greatest savings with a seven
year payback, using a standard contract.
This first project in this program was for the Department of Treasury and
Finance itself. When this proved successful it was encompassed to
involve the whole of government. All state government departments and
agencies were mandated to implement EPCs under the GGBP for
buildings representing 90% of their energy consumption by 2018.
Over its first three years the program identified savings worth AUD $32m
annually, with an investment of $180m.89
The process for any one project is shown in the flow chart below:
88 The author operated a local Australian ESCO on the GGBP panel. Admission to the panel was
based on experience in delivering energy efficiency upgrades, the CVs of staff members, and a
independent financial assessment of balance sheet strength.
89 Greener Government Buildings Performance Report 2009-2012, Department of Treasury and
Finance. http://www.dtf.vic.gov.au/files/4373c9c9-8b25-46cb-b4f0-a1d300f43933/Greener-
Government-Buildings-Performance-Report2009-2012.doc

262 | P a g e E n e r g y E f f i c i e n c y i n B u i l d i n g s
Figure 37 - How Energy Performance contracts are implemented by ESCOS in the Victorian Greener
Government Buildings Program

263 | P a g e E n e r g y E f f i c i e n c y i n B u i l d i n g s
This flow chart illustrates several key elements of a successful
ESCO/EPC program
A clear, unambiguous process
Standard contracts (both for the DFS and the EPC)
A clearly staged approach
Mechanisms to avoid unscrupulous ESCOs “gaming” the tender
process.
It should also be observed that from the time of issuing of the EOI
through to the certificate of completion has typically taken in the vicinity
of 3 to 4 years. Whilst robust, this is a relatively complex procedure to
follow, requires ESCOs to have strong balance sheets due to the initial
very poor cash flow, and requires departments and agencies to
adequately resource the assistance ESCOs need whilst tendering, and
to the selected ESCO whilst preparing the DFS.
By March 2014 under this program energy efficiency upgrade works
were either being undertaken or had been completed for twelve projects.
A further 12 projects were in the Detailed Feasibility Stage. The largest
project, from a university, is worth AUD $98m, covers 90 buildings and
involves two ESCOs.90
The state of New South Wales has a similar model. 21 projects have
been financed with an investment of $50m.
90 http://www.rmit.edu.au/thinkgreen/supp

264 | P a g e E n e r g y E f f i c i e n c y i n B u i l d i n g s
Enabling the success of these programs has been:
The commitment by government to the EPC process.
The development and use of standard contracts and processes.
Capacity building in Measurement and Verification. Over 100
people in Australia are now Certified Measurement and Verification
Professionals (CMVP).
Strong technical capacity in the Department of Treasury and
Finance, who has administered the program.
Leading up to the introduction of these programs, several local
ESCOs had already gained substantial experience in investment-
grade energy audits and project implementation of relatively
complex integrated energy efficiency retrofits, and were thus able
to compete effectively with the multi-national ESCOs in the
program.
This illustrates that while government financing from Treasury is an
important part of the program, there are many other factors important to
the success of ESCO implemented projects.
On the other hand in the US, a much more mature ESCO market,
government funding contributes to the execution of around 30% of
ESCO projects.91
91 Current size and remaining market potential of the US Energy Service Company Industry. LBNL,
2013. http://emp.lbl.gov/sites/all/files/lbnl-6300e_0.pdf

265 | P a g e E n e r g y E f f i c i e n c y i n B u i l d i n g s
As practiced in Korea and Australia, government financing enables EPC
projects. China is an example of where non-bank financing has kick
started an ESCO industry.
SUGGESTED APPROACH IN MALAYSIA
At present Malaysia has a Green Technology Financing Scheme with
RM 3.5b of funding. This is private bank funding, with a government
guarantee. However ESCOs have not yet tapped into this funding.
The fact that even with a loan guarantee there have been no projects is
indicative of other barriers – such as the lack of a market and lack of
experience.
Similarly on the client side Malaysia has very limited experience in the
integrated energy efficiency retrofit projects that characterise ESCO
projects.
A multi-pronged approach with four components is recommended to
address these barriers:
1. Maintaining the loan guarantee with at least RM 500m of the
guarantee earmarked for ESCO projects,
2. Creating a market for ESCOs by encouraging government to enter
into EPCs or equivalent to improve the energy performance of
existing government buildings. This could be facilitated by:
a. Enhancing the credibility of the ESCO panel, by creating a
“EPC grade ESCO”, based on both demonstrated technical

266 | P a g e E n e r g y E f f i c i e n c y i n B u i l d i n g s
capability in the delivery of EE upgrades and a balance sheet
assessment of the ability to honour any guarantee.
b. Implementing a set number of projects each year
3. Development of standard process for undertaking contracts.
4. Skills development in:
a. Investment grade energy audits and detailed feasibility
studies
b. Project management of integrated energy efficiency retrofit
projects.
c. Measurement and verification
Based on the Australian experience it would also appear that a
reasonably long time frame should be allowed to get energy users and
ESCOs to the point where commercial funders are willing to get
involved.
Considering the lack of experience of Malaysia ESCOs, it is
recommended to start with relatively small EPC projects (say up to RM
5m). Over the 11th Malaysian plan projects could be gradually scaled up,
with say an overall objective of providing at least RM 200m in ESCO
loan guarantees for EPCs in government buildings.

267 | P a g e E n e r g y E f f i c i e n c y i n B u i l d i n g s
SYNERGIES WITH OTHER POLICY MEASURES
A National building energy efficiency database can be used to help
identify government buildings that can be put through performance
contracts delivered by ESCOs.
A Utility Energy Efficiency Obligation (UEEO) could also be
harnessed by ESCOs, and enable them to deliver larger savings without
increasing the value of a performance contract.

268 | P a g e E n e r g y E f f i c i e n c y i n B u i l d i n g s
HOUSING MORTGAGES THAT ENABLE
EE
SUMMARY
Housing mortgages that enable more energy efficient homes have been
effective in Germany and Japan, have had a minor benefit in Estonia
and the USA, and have not yet been effective in the UK.
In Germany large interest rate subsidies, and grants based on the value
of interest rate savings, are being used to retrofit buildings as part of an
ambitious national energy conservation program. Japan offers long term
mortgages with small interest rate cuts, with roughly a 20% take up.
Estonia has a focus on apartment buildings via loan guarantees, loans,
and grants, but relatively low uptake.
The mixed international experience means that great care should be
taken when developing a green loans program to ensure that it is
effective.
With low energy prices and a climate that requires less energy to provide
comfortable conditions, can energy efficient housing mortgages be
effective in Malaysia? However the non-financial benefit of improved
comfort also needs to be considered.
Energy efficient housing mortgages may appeal to wealthier home
owners who use a lot of energy. A green loan that is added onto a

269 | P a g e E n e r g y E f f i c i e n c y i n B u i l d i n g s
conventional housing loan, used to pay for energy saving features such
as insulation in a low-rise home, may be effective.
One of the more cost-effective retrofits for existing low-rise homes is the
installation of insulation in the ceiling. A loan product could be developed
to promote this.
Developers could be offered low interest financing on the additional cost
of complying with MS1525 in residential buildings.
If Malaysia was to adopt a Utility Energy Efficiency Obligation,
alternatively methods could be developed to incentivise energy
efficiency in new and existing homes and buildings. This may be more
efficient administratively.
THE INTERNATIONAL EXPERIENCE
The international experience in EE housing loans is mixed. Large, long
term programs that have had uptake from a large number of homes can
be found in Germany and Japan; both of these originating from post war
reconstruction banks. Estonia has a modest program of loan
guarantees, loans and grants. In the US there is a long running program
of energy efficient loans but it has had low uptake. The UK’s Green
Deal, which recently started, has had little success to date. And in
Australia a Green Loans program targeting residential energy efficiency
upgrades was a AUD$175m disaster.

270 | P a g e E n e r g y E f f i c i e n c y i n B u i l d i n g s
Germany
Germany, has a long running home thermal retrofit loan and grants
program, operational since 1996. The German development bank, KfW
offers low interest loans and grants for energy efficiency thermal
upgrades and new construction, supported by the Federal Ministry of
Transport, Building and Urban Affairs, though its Energy Efficient
Rehabilitation and Energy Efficient Construction Programs.
For new homes loans of up to €50,000 are offered at low interest rates
(starting at 1.4%) and with repayment bonuses of up to €10,000 when
the loan is taken out to achieve energy savings of over 45%. A minimum
savings of 30% has to be achieved to be eligible, with the greatest
support provided for a savings of 60%, as compared with a new home
built to the mandatory energy efficiency standards. 92
For refurbishments either a loan of up to €75,000 at an interest rate of
1%, or a grant of up to €18,750 is available.
A certified expert is required to review any plans prior to project
approval. 93
92 Energy efficiency in Germany – Status & Perspectives. Grewe H.,
http://www.gaccny.com/fileadmin/ahk_gaccny/Consulting/Green_Corner/Energy_Efficiency_2013_2/H
artmut_Grewe.pdf
93 Financial Incentives for Energy Efficiency Retrofits in Buildings, ACEEE, 2012,
http://www.aceee.org/files/proceedings/2012/data/papers/0193-000422.pdf

271 | P a g e E n e r g y E f f i c i e n c y i n B u i l d i n g s
This program has also created a large number of jobs, in 2010 345,000
“promoted jobs” arose from the program, 94 although this figure could be
an overestimate.
Funding has also been significant, over 2006 to 2013 around €9.3b of
public funds went into the program. In 2010 around €0.8b was allocated.
This funding has come from general federal government funds, but in
the future will come from the Energy and Climate Fund, based on carbon
certificate revenues and power plant duties.
Loans are provided through retail banks, who are permitted to add up to
0.75% to the interest rate to cover their risks and costs, as shown in the
figure below.
94 Financing energy efficiency in buildings, Doubrava R., Directorate-General for Energy Efficiency,
http://archive.housingeurope.eu/archive.housingeurope.eu/uploads/file_/Roman%20Doubrava%20Fin
ancing%20energy%20efficiency%20in%20buildings.ppt

272 | P a g e E n e r g y E f f i c i e n c y i n B u i l d i n g s
Figure 38 - How the German Energy Efficient Rehabilitation and Energy Efficient Construction Programs
work. From Financing energy efficiency in buildings: an international review of best practice and
innovation. Guertler P., and Royston S., Association for the Conservation of Energy, 2013.
http://www.eceee.org/all-news/press/2013/2013-10-22/WEC-EEC-Final
What have the energy savings been? A rough estimate would be that in
2010 savings were about 40kWh of heating energy/m2 on average,
taking into account “pre-bound” effects (that is homes actually use less
energy than estimated before refurbishment and “re-bound” effects
(occupants may chose to make the home more comfortable than it was
pre-refrofit). 95 A number of reports have suggested that government
investment has been more than repaid by taxes from the increased
construction activity arising from the loans.
95 Based on Evaluating the evaluations: Evidence from energy efficiency programs in Germany and
the UK. Elsevier, Energy and Buildings 62 (2013), Rosenow J.,
http://www.academia.edu/5296057/Evaluating_the_evaluations_Evidence_from_energy_efficiency_pr
ogrammes_in_Germany_and_the_UK
273 | P a g e E n e r g y E f f i c i e n c y i n B u i l d i n g s
An estimated 80% of the 40million buildings in Germany were built
before 1979.96 Between 2001 and 2011 around 2.1million homes had
energy efficiency improvement work funded through loans.97
Germany aims to reduce energy consumption by 20% in 2020 compared
with 2008, and is clearly making a large investment to achieve this goal.
However it is believed that investment in these loans needs to be around
five times higher than it actually is, to achieve the target.
Financial incentives via loans and subsidies are one of three core
elements of Germany’s energy efficiency focus, the other two being:
A binding legal framework that imposes energy performance
improvements on buildings and the increased use of renewable
energy by electricity suppliers
Awareness raising to change energy behaviour, including through
the issue of Energy Performance Certificates for homes.
96 Energy saving programs in Germany: an unsung success story. http://www.electrical-
efficiency.com/2011/08/energy-saving-programs-in-germany-an-unsung-success-story/
97 Financing energy efficiency in buildings: an international review of best practice and innovation.
Guertler P., and Royston S., Association for the Conservation of Energy, 2013.
http://www.eceee.org/all-news/press/2013/2013-10-22/WEC-EEC-Final

274 | P a g e E n e r g y E f f i c i e n c y i n B u i l d i n g s
Japan
Japan’s Flat 35 Mortgage program promotes the adoption of “quality”
home in Japan, including energy efficiency. Flat 35 mortgages are linked
to the home achieving an overall thermal efficiency standard, and
provide a flat interest rate for 35 years. There are two levels of interest
rate subsidies for homes that go beyond the minimum standards, those
homes achieving the highest thermal efficiency standards are provided a
government funded reduction in interest rate of 0.3% for ten years.
Those achieving the next level of thermal efficiency receive an interest
rate reduction of 0.3% for five years. To be eligible for a Flat 35 loan a
certificate issued by a qualified surveyor or assessor needs to be
issued.98
The majority of loans go to new construction. Half of the 150,000 loans
issued in 2011 were for those which went beyond the minimum EE
standard.
In Japan there are no mandatory home energy efficiency standards. The
flat 35 mortgage program encourages the uptake of voluntary standards.
98 Financing energy efficiency in buildings: an international review of best practice and innovation.
Guertler P., and Royston S., Association for the Conservation of Energy, 2013.
http://www.eceee.org/all-news/press/2013/2013-10-22/WEC-EEC-Final

275 | P a g e E n e r g y E f f i c i e n c y i n B u i l d i n g s
Estonia
In Estonia the KredEx program established in 2001 is perceived as a
successful model. KredEx is a credit and export guarantee fund, a
revolving fund that supports energy efficiency projects, amongst other
measures.
It supports EE in three ways:
Loan guarantees:
o Housing loan guarantees, which decrease the down payment
requirements, eligible to certain sections of society. It applies
to both the purchase and renovation of homes.
o Apartment building loan guarantees, covering up to 75% of
the loan amount, for renovation works to existing apartments.
Typically targeting those disadvantaged when it comes to
accessing normal bank financing.
Loans:
o Apartment building renovation loans, where no collateral is
required. A precondition for this is an energy audit. Typically
targeting those disadvantaged when it comes to accessing
normal bank financing.
Grants:
o Apartment reconstruction grant. A grant of up to 15% is
available for energy savings of at least 20% for apartment
buildings up to 2,000 m2 is size, or 30% if the building is
larger. Additionally a Building energy label “E” must be

276 | P a g e E n e r g y E f f i c i e n c y i n B u i l d i n g s
obtained. Larger grants are available if an energy label “D” or
“C” can be achieved.
o Energy audit, building design and expert evaluation grant, for
apartment associations planning to rennovate their buildings,
covering 50% of eligible costs.
The program aims to improve the thermal performance of buildings, as
also supports renewable energy such as solar thermal or solar PV.
With funding of around $100m to kick start the program, it now has a
perpetuating revolving fund for the loan guarantee and loan component
of the program, with a state guarantee attached to loan funds provided
through the program.
Over 2 ½ years to 2013 €21m was made available in grant funding.
Some of this funding came from the sale of Kyoto carbon credits to
Luxemburg.
For the three years to 2012 renovation loan funds of €49m were made.
Loan guarantee payments of €291,000 were made in 2011.
Uptake of the program has not been as strong as expected.
By 2011 Grants had been provided to:
o 266 apartment buildings
o 1,038 energy audit grants for apartment buildings
391 loan agreements for apartments were entered into between
2009 to 2011

277 | P a g e E n e r g y E f f i c i e n c y i n B u i l d i n g s
Around 14,000 housing loan guarantees were provided from 2000
to 2011
583 apartment loan guarantees were provided between 2004 and
201199
There is little data available on savings that have been achieved.
Program start up took around 2 years.
USA - Energy Efficiency Mortgages
In the US Energy Efficiency Mortgages are available from a number of
lenders. These are based based on a home energy rating undertaken by
an accredited Home Energy Rating System Provider. The home rating
either provides an indication of how efficient a home already is, and the
financial benefit this provides or identifies the cost and benefit of
improving the home’s performance (for an Energy Improvement
Mortgages). The maximum amount available is no more than 5% of the
home’s value, in some cases less.100
Available since 1992, a 2012 review found that “despite widespread
availability, few borrowers have participated in these programs.”
Possible reasons identified included low awareness, high transaction
99 Financing energy efficiency in buildings: an international review of best practice and innovation.
Guertler P., and Royston S., Association for the Conservation of Energy, 2013.
http://www.eceee.org/all-news/press/2013/2013-10-22/WEC-EEC-Final
100 http://www.energystar.gov/index.cfm?c=mortgages.energy_efficient_mortgages

278 | P a g e E n e r g y E f f i c i e n c y i n B u i l d i n g s
costs, and lack of incentives for lenders to market these products. 101
Another apparent reason is the limited availability of such loans.
On the other hand, a 2013 review found that mortgage holders of single
family homes that were energy efficient (as rated by Energy Star) were:
(a) Less likely to default, with default risk around 32% lower.
(b) Less likely to pre-pay their mortgage.102
This review was prepared in part to demonstrate to lenders that making
available more energy efficiency loan products could be seen as a solid
investment. The review identified other barriers such as “transactional
complexity, poorly developed lender guidance, limited benefit for lenders
and lack of consumer information”
However its still too early to see if improvement efforts will have any
impact on the low uptake of energy efficiency mortgages in the U.S.
Green home loans – UK and Australia
The UK’s “green deal” project which commenced at the start of 2013
appears to also have problems with loan uptake. After energy
101 Borrowing to save energy: An assessment of energy-efficiency financing programs. Palmer K.,
Walls M., Geradden T., Resources for the Future, 2012. http://www.rff.org/RFF/Documents/RFF-Rpt-
Palmeretal%20EEFinancing.pdf
102 Home energy efficiency and mortgage risks, Institute for Market Transformation, 2013.
http://www.imt.org/uploads/resources/files/IMT_UNC_HomeEEMortgageRisksfinal.pdf

279 | P a g e E n e r g y E f f i c i e n c y i n B u i l d i n g s
assessments of over 70,000 households just 12 houses had taken a
loan.103 Reasons for poor uptake appear to be the amount of paperwork
householders need to process, a relatively high interest rate (7%) with
unattractive terms, and industry fragmentation in the delivery of upgrade
services.
In Australia a government supported “green loans” program operating
from 2008 to 2010 was a AUD $175m failure. The program provided a
$10,000 interest free loan based on an energy audit of the property, also
provided free of charge. Government reviews found “significant and
extensive administrative failings in relation to the program’s design and
administration.”104 Loan uptake was very low. Around 360,000 home
assessments were undertaken, but only around 1,000 loans awarded. In
various discussions I held with assessors who undertook audits in the
program, another barrier was the relatively long payback of measures
identified in the program. At the time Australia did not have the high
electricity tariff’s it now has.
103 As reported in the Guardian. http://www.theguardian.com/money/green-living-
blog/2013/sep/22/green-deal-energy-saving-offer
104 Green Loans Program, Australian National Audit Office, 2010. http://www.environmental-
auditing.org/Portals/0/AuditFiles/Australia_f_eng_Green%20Loans%20Program.pdf

280 | P a g e E n e r g y E f f i c i e n c y i n B u i l d i n g s
Discussion of the international experience
The international experience is clearly mixed. Both Germany and Japan
have large programs that are engaging a large portion of the market,
possibly around 20% in Japan and higher in Germany. However as
reviews of these programs point out, both programs originate from post
war reconstruction banks, and operate in countries with long term
experience in the reconstruction / repair of buildings.
The Estonian experience is perhaps of most interest to Malaysia, as
Estonia is likely more similar to Malaysia than the other countries. It has
a specific target of apartment buildings. It also seeks to make financing
available where otherwise a bank could see the credit risk as too high.
However, the program, despite being in operation since 2001, has only
provided a small number of loans and a relatively small number of loan
guarantees.
Clearly the failure in Australia (trying to do too much too soon with poor
administration and long paybacks) and the poor success in England (too
much red-tape?) to date are cautionary.
SUITABILITY TO MALAYSIA
The bulk of the schemes examined have been based on thermal
performance for cold climates.
Using the concept of “degree days” the likely benefit of thermal
performance upgrades can be very roughly approximated. To
understand the concept of degree days, consider a day where the

281 | P a g e E n e r g y E f f i c i e n c y i n B u i l d i n g s
average temperature was 28 OC. With respect to a temperature of 25 OC,
that day would be considered to have 3 cooling degree days.
The table below shows the heating and cooling degree days for a major
city in each of the three more successful case studies given above.105
The bases of 18 OC and 25 OC have been used for heating and cooling
respectively as these could be considered as the temperatures where
either home space heating or home space cooling might first per
operated.106
105 Five year averages, using data from www.degreedays.net, accessed 2 May 2013.
106 Many people consider whether to use heating or cooling in their home in terms of the cost of
heating or cooling. Whilst 18OC may be considered “cold” or 25OC “hot” the reality is that these
temperatures are likely considered as “mild” by poor and middle income householders. I remember
attending a conference in 2004 where a case study on insulating retrofits from the South Island of
New Zealand was presented. Very little energy was saved. The reason? Instead of warming their
houses to 11 or 12 OC, after the retrofits homeowners took them up to a more comfortable
temperature of 15 or 16 OC – using the same amount of energy. Prior to the upgrades they couldn’t
afford, or didn’t perceive the benefit, of making their houses warmer, worth the cost. Subsequent
studies have shown that the main benefits of this program have been in improved health.

282 | P a g e E n e r g y E f f i c i e n c y i n B u i l d i n g s
Table 16 - Degree days in various locations
Where Heating degree
days – Base
18OC
Cooling
degree days –
Base 25OC
Total degree
days
Germany -
Frankfurt
2950 N/A 2950
Japan - Osaka 1600 300 1900
Estonia - Tallinn 4500 N/A 4500
Malaysia - KL N/A 1200 1200
What this table doesn’t capture is the impact of direct and indirect radiant
heat, but it does indicate that improving the thermal performance of a
building in Malaysia would likely provide less energy benefit than it
would in Japan, and almost certainly less benefit than it would in
Estonia.
Another consideration when it comes to cooling buildings vs heating
buildings is the efficiency of the device providing heating or cooling.
Typically in Europe heating is from either gas or oil, combusted in a
boiler with an efficiency of between 70% to 90% and a system efficiency
in the order of 40% to 70%. In Malaysia cooling comes from an air
conditioner, typically with a likely efficiency (based on electrical energy
in) of around 250%. So it requires much less metered energy to deliver
one MJ of cooling energy in Malaysia as it does to deliver 1 MJ of
heating energy in say Estonia.

283 | P a g e E n e r g y E f f i c i e n c y i n B u i l d i n g s
Finally, Malaysia’s relatively cheap electricity tariff’s need to be
considered.
The combination of (a) a less harsh climate (b) high efficiency of
electricity powered air conditioners compared with fuel fired heaters and
(c) low electricity tariff means that the financial benefit to an householder
in Malaysia of home thermal improvements may not be that high as
compared with benefits experienced elsewhere. On the other hand, the
improved comfort benefits cannot be discounted.
Any scheme Malaysia might consider should also therefore go beyond
just thermal performance, but also look at renewable energy and
potentially lighting.
What could realistically be financed through a housing
mortgage
The table below shows what can be likely realistically be financed in
Malaysia through a housing mortgage. Typically these would need to be
fixtures that remain with the home and that have a long life.
Approximately half of the homes in Malaysia are apartments and half
terrace or stand alone homes. For apartments it is more cost effective to
focus on the whole building, rather than individual elements.
Measures that reduce water or hot water use, such as low flow taps or
showerheads, could also be considered, but are typically too low in
value to be seriously considered with respect to the paper-work involved

284 | P a g e E n e r g y E f f i c i e n c y i n B u i l d i n g s
in a loan. Similarly the upgrade of individual light fixtures in an existing
home can’t really be considered as practical under a loan program.
Note that savings can be very hard to estimate, and depend enormously
on occupant behaviour. For example, does each member of a family of 5
have a hot shower every day? In this case installing a low-flow
showerhead will have a very good payback. But a household which
never has hot showers there won’t be a return in energy savings.
Similarly some measures, such as the application of a window film to
reduce radiant heat gain, may improve comfort but not necessarily save
much energy because the occupant simply doesn’t use the AC much.

285 | P a g e E n e r g y E f f i c i e n c y i n B u i l d i n g s
Table 17 - Possible energy efficiency measures that could be funded by a
mortgage or loan
Terrace / stand alone Apartment
New Roof insulation or cool roof
High effcy AC
High effcy hot water system
High efficiency lighting
Glazing upgrade
Solar PV
Wall insulation *
Shading elements*
Building orientation / window position*
Wall insulation**
Glazing upgrade**
Shading elements**
Cool external surfaces**
High effcy AC
High effcy lighting
High effcy hot water system
Existing Roof insulation or cool roof
Solar PV
Shading
Window films
AC upgrade***
Hot water system upgrade***
Window films
AC upgrade***
Hot water system upgrade***
*Items such as wall insulation, a design that provides improved energy performance (eg
through better cross flow ventilation) or shading elements may not be possible in all cases,
and will depend on construction details, such as the type of wall construction and site
limitations.
** Depending on the flexibility of the construction contractor, custom elements that don’t
apply to all apartments may not be possible to incorporate in a new home. The whole
building would likely need to incorporate these elements

286 | P a g e E n e r g y E f f i c i e n c y i n B u i l d i n g s
*** Depending on how long this equipment is operated for, it may only be economic to install
high efficiency equipment when the existing equipment is in the process of being replaced
anyway.
Likely benefits, costs and economic viability
Benefits are challenging to estimate, as the same measures applied to
identical homes might yield very different savings, depending on
occupant behaviour.
Two identical neighbouring apartments can have large variation in their
energy use depending on number of occupants, number of appliances,
perceptions of comfort, time spent at home, etc.
In general, the higher the income the higher the consumption: bigger
house, more air conditioners, bigger TV, has hot water vs doesn’t have
hot water, etc.
An analysis of Energy Commission data shows that the average
Malaysian residential electricity consumer uses 3.3 MWh of electricity
annually (2012), or around 9 kWh/day. In 1997 the average residential
consumer used 6 kWh/day, and the rate of annual increase is around
3% per year.
There is little data available on how this energy is consumed. The table
below provides a rough estimate:

287 | P a g e E n e r g y E f f i c i e n c y i n B u i l d i n g s
Table 18 - Rough estimate of where energy is consumed in an
"average"Malaysian household in 2012.
Electrical Load Estimated average
daily energy
consumption (kWh)
Refrigerator 2
Lighting 1
Cooking 0.5
Television, radio, other plug loads 1.5
Cooling – fans and air
conditioning
4
Many of the energy upgrades that could be funded by a mortgage or a
loan would decrease the cooling energy use. There is no doubt that
cooling energy use will grow in future years as more people either install
their first, or their second or third air conditioner. But in the table above
shows that in the “average” Malaysian home air conditioning energy use
could be lower than expected.
For existing buildings
If we assume a typical “deep” retrofit is able to reduce electricity
consumption by 1/3rd – or 3 kWh/day on average, the savings, at an
average tariff rate of MR 0.40/kWh, would be worth MR438/year.

288 | P a g e E n e r g y E f f i c i e n c y i n B u i l d i n g s
What would the cost of a deep retrofit be? Possibly in the order of MR
10,000, or higher.107
Clearly the economic cost-benefit is poor for the “average” existing
home. Even if a home cut its consumption by 50%, for an average home
the simple payback would still be over 15 years.
But for a small number of homes that use a lot of energy, a retrofit could
make economic sense. And this number of homes is set to increase as
the use of air conditioning continues to grow.
A higher tariff would reduce the gap between benefits and costs
For new buildings
For new buildings the benefit to cost ratio would likely be higher, as
costs can may be lower. For example it’s cheaper to buy a cool roof with
pre-treated tiles or steel sheeting than it is to clean then paint an existing
roof.
Its more than just finance
Access to finance could be a barrier to homes becoming more efficient in
Malaysia. However poor financial payback (particularly for retrofits), is
also a barrier.
107 This estimate is based solely on “gut feel” and experience, but not in Malaysia.

289 | P a g e E n e r g y E f f i c i e n c y i n B u i l d i n g s
Possible pathways for Malaysia
The discussion above indicates that getting energy efficient mortgages
to work in Malaysia could be challenging. Reflecting on the international
experience suggestions are, should Malaysia choose to pursue this
policy option:
Make financing available at reduced interest rates to developers of
new apartment buildings that incorporate air conditioning of say
larger than 2,000 m2 that adopt MS1525. This will likely provide a
reasonable return (reduced energy bills for apartment dwellers) on
the investment made (cost of funding the reduced interest rate). It
could also possibly pave the way for the eventual introduction of
mandatory standards for residential buildings.
Provide a green loan at reduced interest rate for the additional cost
of of homes (terrace or apartment) that incorporate a number of
prescribed elements (eg cool roof/roof insulation for terrace
homes, air conditioner that has a star rating of 5 for both terrace
homes and apartments)
Use a Utility Energy Efficiency Obligation scheme to encourage
the uptake of high efficiency home appliances, particularly air
conditioners, but don’t provide any concessional mortgage
financing. Look for ways of incorporating measures such as cool
roofs, insulation, etc into a UEEO. This saves administrative effort,
with no need for a special loan program.
Have very strong enforcement of labelling and MEPS. In addition
to air-conditioning, likely future areas of home energy consumption

290 | P a g e E n e r g y E f f i c i e n c y i n B u i l d i n g s
growth will come from televisions (more of them, bigger);
computers, tablets, home networks; more gadgets and appliances.
Improving the home’s thermal performance via a mortgage or loan
has no impact on the consumption of these devices.
Responsibility
Ministry of Finance working with ST.
SYNERGIES WITH OTHER POLICY MEASURES
Building standards can achieve the same impact of this policy
measure. However low-interest finance or similar can encourage the
uptake of these standards
Appliance and equipment standards and labelling also reduce
household electricity consumption. Measures that reduce thermal loads,
funded through a mortgage or loan can further reduce consumption.
A Utility Energy Efficiency Obligation may be synergistic, but could
also result in “double dipping”. For example if a developer is able to
access low interest financing through installing high efficiency air
conditioners, and also getting access to cheaper air conditioners
because of the UEEO, then a double subsidy is in effect. Any scheme
design ideally would try to avoid this.

291 | P a g e E n e r g y E f f i c i e n c y i n B u i l d i n g s
CAPACITY BUILDING FOR EE IN
BUILDINGS
SUMMARY
Strong capacity in any sector depends on market demand and the extent
to which the market demands leading performance.
As demand for building sector EE in Malaysia picks up, it is suggested
the Malaysia develop an over-arching approach to systematic wide
capacity building in EE that integrates over time with the training sector.
It’s suggested that Malaysia:
Allocate responsibility to the Ministry of Education, and establish a
Malaysian Training Centre for Energy and Water Efficiency
Look at capacity developing in governance, industry, and the
training sector
Ensure consistency of resourcing for the governance of EE – a key
challenge internationally
Focus not just on enhancing technical skills, but ensure that there
is capacity in policy, law, finance, management, measurement,
verification and evaluation
Foster international collaboration for the development of capacity,
so as to learn from and avoid the mistakes of other countries when
introducing new policies

292 | P a g e E n e r g y E f f i c i e n c y i n B u i l d i n g s
Tap into a wide range of internationally provided training and e-
learning in EE.
CAPACITY BUILDING
Malaysia has developed strong capability in building engineering, but
without a large market for energy efficiency services much of this skill
has not been applied to energy efficiency projects.
The effective implementation of building sector energy efficiency policy
requires capabilities across a range of skills, including:
Policy specific expertise, for example:
o Standards and Labelling (S&L)
o Utility Energy Efficiency Obligations (UEEO)
o Building Standards
o Mandatory reporting
Policy promotion
Public administration
Energy/carbon accounting
Project management
Measurement, Verification and Evaluation (MV&E)
Technical capacity in energy efficient:
o Building design

293 | P a g e E n e r g y E f f i c i e n c y i n B u i l d i n g s
o Building construction
o Building operation
o HVAC design and operation
o Lighting design and operation
o Retrofits to the building envelope/shell
o Appliances
o IT equipment
Energy efficient procurement
Energy efficiency financing
Training and development
Energy audits
Delivery of integrated energy efficiency retrofit projects.
Capacity in governance, capacity in implementation
There are two broad areas where the effective implementation of EE
requires good capacity: in governance and in implementation.

294 | P a g e E n e r g y E f f i c i e n c y i n B u i l d i n g s
Governance
EE governance cuts across a wide range of areas, as illustrated in the
figure below.
Figure 39 Areas of energy efficiency governance. From Energy Efficiency Governance Handbook, 2nd ed,
IEA, 2010
Implementation
Implementation of EE projects typically requires a wide range of skill
areas. Consider, for example, the retrofit of a 50,000 m2 hospital with a
budget of $5m. This is a complex project requiring design, supervisory,
implementation and trades skills in:
Financing
Contract development and negotiation

295 | P a g e E n e r g y E f f i c i e n c y i n B u i l d i n g s
Construction project management
Scheduling and coordination – the hospital can’t be shut down
when the chiller is replaced.
General lighting
Hospital lighting (special lighting for the detection of cyanosis in
certain parts of the hospital, including some corridors)
HVAC
Hospital HVAC (special filtration and pressurisation requirements
for certain parts of the hospital)
Steam and laundry processes
Building automation and control
Occupational health and safety
Measurement and verification
Countries such as Singapore and Australia have developed industry-
based certifications to manage integrated energy efficiency retrofit
projects, which cover an integration of the broad range of skills needed
to manage building retrofits to make them more efficienty.

296 | P a g e E n e r g y E f f i c i e n c y i n B u i l d i n g s
INTERNATIONAL EXPERIENCE IN SYSTEMATIC
CAPACITY BUILDING
The international experience broadly can be categorised as being
piecemeal. Two examples are provided, covering governance and
industry.
A more systematic approach is to use a qualifications framework or to
map skills to this framework. Over time formal capacity building then
becomes embedded. The Australian experience is discussed.
Capacity building for government
A review of US federal State Energy Program, a grant program providing
states with founding to support EE and RE activities, found capacity
building focussed on the following key areas:108
Policy, regulatory and legislative skills
Technical skills
Team building collaboration
Professional skills
Essentially this form of capacity building was identified as “learn by
doing”.
108 The state energy program: Building energy efficiency and renewable energy capacity in the states,
Oak Ridge National Laboratory, 2010.
http://energy.gov/sites/prod/files/2014/01/f7/sep_capacity_building_report_6-30-10.pdf

297 | P a g e E n e r g y E f f i c i e n c y i n B u i l d i n g s
Variations in funding from year to year were identified as a key constraint
to institutionalising effective EE capacity in the state government level.
Over a period of 25 years in one state, Connecticut, the number of staff
employed in state government EE programs went as high as 83, and as
low as 2. Clearly as positions have been made redundant in response to
changing funding levels capacity has been lost.
Australia has also had a “boom or bust” cycle of government capacity in
EE.
A key lesson from the US and Australia is that consistency of funding is
very important for building long term capacity in government to deliver
EE policies.
Industry capacity building
Across a wide range of countries, including Malaysia, there has been
significant progress in developing the capacity to design and deliver
large energy efficient buildings. This has largely been driven by industry
associations following the example of LEED (Leadership in Energy and
Environmental Design) and developing rating tools for green buildings.
In Malaysia the Green Building Index has played a key role in
developing this capacity.
Similarly energy manager accreditations, developed by industry – often
in response to government requirements – build some preliminary
capacity. Globally the Certified Energy Manager accreditation offered by
the Association of Energy Engineers is the most common, with over
10,000 individuals certified. Countries such as India and Malaysia have

298 | P a g e E n e r g y E f f i c i e n c y i n B u i l d i n g s
developed their own accreditations which are similar. Typically
accreditation is achieved by attending a short course then sitting an
exam. Eligibility to be accredited is based on a certain number of years
of prior experience in an energy related role, typically as an engineer.
The bulk of industry accreditation globally are “light”. That is they are
essentially an introductory level qualification, based on a short course.
Deep capacity tends to be developed by experience.
Capacity building within a qualifications framework
Many countries, including Malaysia109, have qualifications frameworks, in
Malaysia these cover three broad sectors: skills, vocational and training,
and higher education.
Training institutions can collaborate with industry to develop new
qualifications, and fit them into the qualifications framework.
Any individual qualification needs to be carefully described with respect
to the competency, and evidence of competency.110 Once qualifications
are developed and described, one or more training institutions can then
offer the qualification.
109
http://www.mqa.gov.my/portal2012/dokumen/MALAYSIAN%20QUALIFICATIONS%20FRAMEWORK
_2011.pdf
110 The Australian qualifications framework in the vocational area is a good example.
www.training.gov.au

299 | P a g e E n e r g y E f f i c i e n c y i n B u i l d i n g s
Qualifications can, if well designed and appropriately resourced, develop
capacity beyond a superficial level.
Developing an industry potentially worth billions of dollars annually
would ideally effectively map skills into qualifications frameworks, which
can be used to build industry in the long term.
In Australia the Australian Institute of Refrigeration, Air Conditioning and
Heating (AIRAH) developed a post-graduate diploma in Energy Efficient
Building Operations and incorporated it into the national qualifications
framework. Unfortunately demand for this training was low, and the high
annual cost of maintaining registration as a training organisation has
meant that AIRAH is now discontinuing the offering of this qualification.
On the other hand, also in Australia, the National Electrical and
Communications Association (NECA) also developed energy efficiency
training for electricians, largely focussed on lighting, under this
framework. This training course has been very popular and has now run
for many years.
SUGGESTIONS FOR MALAYSIA
Malaysia has the opportunity to learn from this international experience,
and develop an over-arching approach to systematic wide capacity
building in EE that integrates over time with the training sector.
Capacity that is developed needs to align with the particular policies that
are chosen. Consistency of policy and resourcing over a long time

300 | P a g e E n e r g y E f f i c i e n c y i n B u i l d i n g s
period is essential to enable the experience on which deep capacity is
built.
A Malaysian Training Centre for Energy and Water Efficiency could be
established to lead this.
Several dot-point suggestions are made below covering governance,
industry, the training sector and e-learning
Developing capacity in governance
Develop long term resourcing plans
Identify stable funding sources that are independent of central
budgets
Ensure that the capacity built is not just technical, but covers
policy, legal, financial, managerial, measurement verification and
evaluation.
Learn from the international experience in each of the policy areas
selected:
o Pick a country which has effectively implemented a policy,
and develop bi-lateral cooperation.
o Put sufficient effort into detailed policy design so as to avoid
making the mistakes other countries have typically made
when introducing a new policy
o Ensure adequate and consistent resourcing.

301 | P a g e E n e r g y E f f i c i e n c y i n B u i l d i n g s
Developing capacity in industry
Support capacity development where the work actually is, not
where it is hoped that the work is.
Align capacity with policy
Require demonstrated competency to access incentives
Developing capacity in the training sector
Develop a long term framework
Get EE incorporated into a wide range of vocational qualifications
including (but not limited to):
o Electrician (lighting, motors)
o Air conditioning mechanics (across almost all areas of air
conditioning)
o Plumbers (solar hot water)
o Automation qualifications (building management systems)
At the university level develop a regional framework with
neighbouring countries
Create demand: Make accreditation a pre-requisite to engage in
certain activities
Copy the international experience, form international alliances
E-learning
Tap into some of the capacity building programs developed or
being developed internationally.

302 | P a g e E n e r g y E f f i c i e n c y i n B u i l d i n g s
o Association of Energy Engineers http://www.aeecenter.org
o Efficiency valuation organisation http://www.evo-world.org
o Massive Open Online Courses (MOOCs) – eg
www.coursera.org
o Graduate and post-graduate training in EE:
http://airah.trainingvc.com.au/
http://www.energystar.gov/buildings/training
https://www.greenedu.com/energy-efficiency-training
http://www2.schneider-
electric.com/sites/corporate/en/products-
services/training/energy-university/energy-
university.page
https://cleanenergysolutions.org/training
Institutional arrangements
The Ministry of Education could take on overall responsibility for
ensuring capacity development activities are implemented.
A Malaysian Training Centre for Energy and Water Efficiency could be
established to lead this.
BSEEPs active and passive technical guidelines are some of the
resources that could be used in training.

303 | P a g e E n e r g y E f f i c i e n c y i n B u i l d i n g s
INCENTIVES FOR EE IN BUILDINGS
SUMMARY
Many energy efficiency measures for buildings are cost negative from a
macro-economic perspective, however these are not implemented for a
variety of reasons. Incentives and regulations are used to overcome
these barriers. Whilst regulation is widely considered to be more
effective than incentives, if well designed, incentives can have a useful
impact on reducing energy use.
Well designed and implemented incentives can be used to either (a)
smooth the transition to regulation or (b) create economies of scale that
can help create new markets and drive down costs.
For example in Malaysia tax incentives for green buildings have played a
key role in creating a market for green buildings, and in building up
capacity to deliver such buildings.
Incentives that appear to be appropriate for Malaysia include:
Continuation of tax incentives for green buildings, with the aim of
progressively tightening the performance requirements before the
tax incentives apply.
A Utility Energy Efficiency Opportunities Scheme
Financial incentives that usher in the mandatory reporting of
building energy use

304 | P a g e E n e r g y E f f i c i e n c y i n B u i l d i n g s
Grants to assist state governments support the uptake of EE
building standards.
Capacity building, by addressing the barriers to ESCOs and also
providing support for capacity in building sector EE more broadly.
WHY INCENTIVES?
Anyone with experience in energy efficiency will know that apparent
economic rational behaviour rarely occurs. Economic rational theory
assumes that people and organisations will make decisions that are
cost-effective in the long term.
The McKinsey cost curve – something once considered essential in
virtually every conference paper on the economics of carbon abatement
– starkly shows that energy efficiency is supposed to make rationale
economic sense. Items below zero on the y axis (on to the left of the
curve) are considered to have a “negative” cost of abatement. Many of
these are energy efficiency measures.

305 | P a g e E n e r g y E f f i c i e n c y i n B u i l d i n g s
Figure 40 - sample McKinsey cost curve
The reality is that whilst apparently making macro-economic sense,
many energy efficiency opportunities are not implemented, for a variety
of reasons.
Regulation and incentives are therefore needed to drive the uptake of
EE.
In almost all countries, regulation has been favoured over incentives.
The World Energy Council explains this well:
Regulations are more powerful than traditional incentives to transform
the market, because they do not leave any choice for consumers.
Incentives are often weak because they depend on the behaviour

306 | P a g e E n e r g y E f f i c i e n c y i n B u i l d i n g s
change of millions of consumers who essentially lack the information and
resources to act. However, the impact of regulation depends on their
effective enforcement.111
However well designed and implemented incentives can have a useful
impact on reducing energy use.
How to best use incentives
Incentives are best used to either:
(a) Provide a transition to regulation; or
(b) Create economies of scale or critical mass.
Transition to regulation
As has been done in Malaysia with standards and labelling, incentives
can aid the transition to regulated EE. The SAVE scheme provided an
incentive for consumers to buy more efficient appliances, and for
manufacturers and retailers to adopt voluntary labelling and supply more
efficient products.
Another example from Australia would be the Green Building Fund – a
stimulatory incentive that was used to aid the introduction of the
Commercial Building Disclosure (CBD) legislation.
111 World Energy Perspective: Energy efficiency policies: what works and what does not, World
Energy Council, 2013.

307 | P a g e E n e r g y E f f i c i e n c y i n B u i l d i n g s
Under the Green Building Fund a grant equal to 50% of capital costs
was provided to large office buildings which increased their NABERS
rating by at least 2 stars. This lifted the number of buildings with
NABERS ratings, and developed industry capacity in managing and
delivering energy efficient refurbishments of large office buildings.
The stimulus might have been overly generous however, and had the
highest uptake from organisations with large portfolios of grade A office
space, who could realise higher rental returns by improving their
NABERS ratings. These organisations could probably also be
considered as capable of undertaking these upgrades without support.
Nonetheless it did help a market transformation that added value to
energy efficient buildings, and aided industry acceptance of the CBD
legislation.
Another example would be the long term Californian pathway to reduce
home energy use. In the current decade incentives, through a Utility
Energy Efficiency Obligation, are stimulating investment to improve
home performance. In the next decade, however, these incentives will
be phased out and replaced with regulation.
Create economies of scale or critical mass
Well implemented incentive programs drive down the costs of energy
efficiency by creating a vibrant and competitive domestic market.
A fairly successful example of this is the incentives for household solar
PV in Australia, starting in 2007. Early federally provided up-front

308 | P a g e E n e r g y E f f i c i e n c y i n B u i l d i n g s
discounts based on renewable energy certificates (RECs) and generous
state feed-in tariffs created large demand.
At first a “feeding frenzy” was created as solar providers jumped on the
band wagon; the incentives initially were overly generous.
However policy makers were reasonably quick to react. Over a five year
period the stimulatory multiplier of five on the RECs was reduced to one
(a reduction in up-front subsidies of 80%), and state feed in tariffs were
wound back, making the industry more competitive.
Table 19 - Solar PV subsidies 2009 vs 2014, Melbourne, Australia, for a 2kW
solar PV system
Year 2009 2014
Up front subsidy $9,600 $1,350
Net feed in tariff $0.60/kWh $0.08/kWh
Installed price to
customer
$5,600 $3,000
With over 15,000 people now employed in the solar PV industry
Australia is now one of the cheapest countries in the world to install a
solar PV system, even though the country itself is not a manufacturer of
PV modules. Feed in tariff’s could now be considered as “negative” by
some commentators (that is the value of the feed in tariff is not much
above the cost of centralised electricity generation, and well below the
retail price of electricity). The figure below provides an indication of the
low pricing that is making solar PV is now so popular in Australia, with
309 | P a g e E n e r g y E f f i c i e n c y i n B u i l d i n g s
13% of households now with a solar PV system and this number growing
at around 2% per year. Australia is now close to the point where
subsidies for solar could be completely withdrawn and the market would
survive.
This transition has been aided by solar module prices which have
plummeted (now approaching $0.60/watt); however the industry large
enough to be highly competitive and installation costs have also
dropped.

310 | P a g e E n e r g y E f f i c i e n c y i n B u i l d i n g s
Figure 41 - A solar offer, Australia, 4 May 2014. The industry is highly competitive, with the installed cost
of a 3 kW system in this advertisement costing just AUD $1/watt (MR 3/watt). The subsidy on the 3 kW
system based on the renewable energy certificates is around $2,000, meaning that the installed cost,
without subsidies, is around AUD 1.67 (MR 5) per watt. Without any subsidy at all, for an average
household, this 3 kW system with a low net feed in tariff of just $0.08/kWh would have a payback of 7
years (daily output and annual savings in the advertisement are exaggerated) and represents an
excellent long term investment.
This example shows how a combination of domestic subsidies creating
domestic competition, and very strong international growth in demand

311 | P a g e E n e r g y E f f i c i e n c y i n B u i l d i n g s
pushing down prices, have worked together. In retrospect the policy has
worked well, although this strategic approach of developing a vibrant
and competitive local industry to take advantage of falling PV module
prices might not have been so obvious when the policies were first
implemented
TYPES OF INCENTIVES
Broadly speaking, there are two types of incentives:
- Fiscal incentives
- Financial incentives
Fiscal incentives
Fiscal incentives, such as tax breaks, are often used to promote energy
efficiency. Forms of fiscal incentives include:
Tax breaks, covering:
o Import tax
o Income tax
o Sales tax
o Accelerated depreciation tax allowances
Taxes on inefficient equipment
Carbon taxes or prices

312 | P a g e E n e r g y E f f i c i e n c y i n B u i l d i n g s
Financial incentives
Financial incentives include:
Subsidies
Soft loans
Grants
Effective deployment of incentives
As discussed above incentives are best used either as a transition to
regulation, or as a way of building economies of scale. The effective
deployment of incentives includes:
Providing clear signals to the market in advance; having a long
term pathway to follow
Ensure sufficient resourcing of the administration of incentives
Having clear processes in place for measurement, verification and
evaluation (MV&E)
Clear market signals with a long term pathway
Without clear signals to the market and a long term pathway either a
boom or bust cycle may result, or the roll out of the incentive may have
unintended consequences.
An example would be the fiscal incentive of carbon pricing in Australia
(although many may phrase this as regulation rather than an incentive!).
This was designed has a long term policy measure to be the cornerstone

313 | P a g e E n e r g y E f f i c i e n c y i n B u i l d i n g s
of Australia’s greenhouse gas abatement activities through to 2050. The
first three years was designed as a transitionary period, employing a
fixed carbon price and generous exclusions to trade exposed industries.
However this policy did not have bi-partisan support, and a change in
government meant the likely repeal of the carbon pricing legislation in
July 2014, just two years after it came into force.
The consequence of this is that the scheme has been less effective in
persuading the large emitters with liability under the scheme to make
long term investments to reduce their carbon footprint.
Adequate resourcing of administration
Adequate resourcing of the administration of any incentive is essential to
ensure that policy objectives are achieved. An example of where
resourcing has been inadequate also come from Australia.
In 2007 a new government announced a “Green Loans” program worth
$300m. This program aimed to promote EE residential retrofits, by
providing free home assessments and then access to green home loans
of up to AUD $10,000. The program was to be rolled out very quickly.
The large program size meant that very quickly thousands of individuals
sought accreditation as home assessors under the program. Home
assessments were undertaken by visiting the home and uploading
information about the home into online software. The software would
then come up recommendations with estimates of costs and benefits for
a range of EE measures.

314 | P a g e E n e r g y E f f i c i e n c y i n B u i l d i n g s
Unfortunately the software was poorly developed, and assessments
were taking months to be processed. Additionally the flood or assessors
meant that the initial budget was spent very quickly, meaning that
assessors who were slow in getting accredited (which cost around
$3,000) were unable to get work out of the program.
The program was eventually quietly closed after $175m had been spent.
Only 1,000 homes took up home loans under the program.
An audit of the program found poor administration and inexperienced
administration staff the key reason for its failure. Other reasons could be:
A rushed roll out (contributing to the poor administration)
A lack of MV&E to pick up problems and act on them quickly. With
this program it appears as though the entire premise of the
program was wrong – the premise being that lack of financing was
a key barrier to the improvement of home energy efficiency – as
evidenced by the low number of loans issued.
Have clear processes in place for MV&E
Without adequate MV&E an incentive may not be achieving the desired
objective.
Another Australian example is provided illustrating what not to do. The
Victorian Utility Energy Efficiency Obligation (UEEO) white certificate
scheme did not effectively engage in measurement and verification of
savings achieved by the installation of Standby Power Controllers
(SPCs) which dominated the scheme from 2011 to 2013. As a result a

315 | P a g e E n e r g y E f f i c i e n c y i n B u i l d i n g s
market distortion was created, delivering “phantom” energy savings.
Rather than least cost abatement being achieved, poor MV&E meant the
program was delivering high cost energy savings.
Many of the examples above illustrate failings. This is deliberate – it is
hard to get incentives right.
MALAYSIAN EXPERIENCE WITH INCENTIVES
Malaysia has deployed a range of incentives to drive energy efficiency in
buildings, described below.
Tax breaks for green buildings
From October 2009 tax breaks have been provided for green buildings.
This program is scheduled to end in December 2014.
The tax breaks are:
A tax exemption on the income equivalent to the additional cost of
achieving certification under the Green Building Index (GBI). This
applies to both new buildings and existing buildings.
A stamp duty exemption on the additional amount required to
achieve GBI certification when a building is first sold.
In the absence of any reports, the benefit of these tax incentives is very
roughly estimated as shown in table 20 below. Note that as of 15 June
2014 there were a total of 235 building certified under GBI, either
completed (very few) or undergoing construction, with a total of
9,660,000 m2 for floor space. Of these 50 buildings are likely to be

316 | P a g e E n e r g y E f f i c i e n c y i n B u i l d i n g s
completed by the end of 2014. There are a further 303 buildings which
are registered under GBI but are either in the design or construction
stage and are yet to be certified.
Table 20 - Estimated benefit of tax incentives – assuming 50% of GBI
registered or certified buildings benefit from the tax incentives.
As of 15 June 2014
Numbers below for the 50% of GBI registered or certified
buildings which are estimated to have benefited from tax
incentives.
Buildings likely to
be completed by
end of 2014
Certified Bldgs -
either completed
or with ongoing
construction
Registered buildings
in the
design/construction
stage not yet certified
Area (sq m) m2
1,000,000
4,800,000 6,200,000
Annual CO2 reduction t CO2-e
50,000
234,000 301,000
Annual kWh savings kWh 70,000,000
310,000,000 400,000,000
Annual cost savings to building users RM 30,000,000
130,000,000 160,000,000
Additional cost of green building RM
100,000,000
470,000,000 610,000,000
Number of jobs created RM
170
780 1,020

317 | P a g e E n e r g y E f f i c i e n c y i n B u i l d i n g s
Table 20 assumes:
That the tax incentives are the trigger for half of the GBI buildings
certified to date.
Based on data on the GBI website, as of 15 June 2014
Estimates for buildings likely to be completed by the end of 2014
and registered buildings are based on those figures for certified
buildings, on a pro-rata basis (235 certified buildings, estimated 50
buildings to be completed this year, 303 registered buildings not
yet certified)
An emissions factor of 0.747 (kg CO2-e/kWh)
An overall average electricity cost of RM 0.40/kWh:
An average cost of just under RM 100/m2 to achieve certification
That it costs RM 600,000 to create one job in the construction
industry.
The cost to government of these tax incentives is unknown.
Note that the above figures are annual saving figures. Lifetime saving
figures can be calculated by multiplying by the expected average
building lifespan.
The SAVE program
The SAVE program provided a rebate of RM 100 on 5 star air
conditioners, up to RM 200 on 5 star fridges, and RM 200/refrigerative

318 | P a g e E n e r g y E f f i c i e n c y i n B u i l d i n g s
tonne for new chillers used to replace chillers more than 15 years old. It
ran from 2011 through to December 2012.
It was part of the Entry Point Project 9 (EPP9) of the Economic
Transformation Program.
The program was well subscribed and used all the allocated funding of
RM 45 million. A project review undertaken by SEDA (who also
administered the program) identified that the lifetime savings achieved
by the program were estimated at 1,320 GWh, with the lifetime value of
energy savings estimated at RM 382 million.
Effectiveness of these incentive programs.
Both the tax incentives and the SAVE rebate appear to have been
effective in driving energy efficiency. Whilst both the GBI numbers and
the SEDA numbers are estimates of savings, not measurements of
actual savings achieved, even if the savings were substantially over-
estimated the results still show the excellent financial returns to the
economy generated by investment in energy efficiency.
The magnitude of savings from both programs, if combined, should be
generating savings of over 400 MWh annually once those buildings
which have received tax incentives are operational, or around 0.7% of
building sector annual electricity consumption.
With data on building sector electricity consumption only available till the
end of 2012, it is not possible to observe whether these programs have
caused a slow down in the trend of ever-increasing building energy use

319 | P a g e E n e r g y E f f i c i e n c y i n B u i l d i n g s
or not. A National Building Energy Consumption Database would make it
much easier to identify savings.
Nonetheless it is clear that these programs have been effective, and
their continuation in one form or another is recommended. Tax breaks
for green buildings should remain. And a more permanent version of the
SAVE scheme could be introduced via a Utility Energy Efficiency
Obligation.
SUGGESTIONS FOR MALAYSIA GOING FORWARD
Malaysia should adopt a strategic approach that uses incentives to
either transition to regulation or to build up local capacity to a strong
level.
The tax breaks for green buildings may have already achieved this to
some extent. Evidence of increased local competitiveness is now the
competition between the two rating systems – GBI and GreenRE.
Additionally it appears as though now a building with the entry level of
GBI certification now costs no more than a normal building. However
industry has indicated that the tax breaks have played a key role in
stimulating demand for green buildings, and should remain.
Suggested areas to focus incentives are on are tabled below:

320 | P a g e E n e r g y E f f i c i e n c y i n B u i l d i n g s
Table 21 - Suggested areas to focus incentives on
Incentive Purpose Details
Tax breaks for
green buildings
Build a market for
green buildings,
create capacity in
delivery of
buildings, aid the
transition and
uptake of standards
Continue existing tax breaks, gradually making
the performance levels for which tax breaks
apply more stringent over time. The staging
should be based on revisions of MS1525, with
the tax breaks available for building which
achieve a BEI at least 25% below that expected
for a building which complies with MS1525. For
example, over RMK11 25% below MS1525
would be a BEI of nominally around 150
kWh/m2/year. Other green building rating tools
should also be eligible for the tax break, on the
basis of actual BEI post-occupancy.
Area
adjustment for
green buildings
Build a market for
green buildings,
create capacity in
delivery of
buildings, aid the
transition and
uptake of standards
Allow additional gross floor area (1% to 2%)
beyond the limit of normal planning controls for
green buildings that are eligible for tax breaks.
It would be up to local governments to allow
this.
Tax breaks for
new energy
efficient
apartment
bldgs.
Transition to EE
construction
standards, aid the
uptake of standards
Once a residential standard (similar to MS1525)
is introduced, tax breaks should apply for
buildings that achieve a BEI at least 25% below
this standard.

321 | P a g e E n e r g y E f f i c i e n c y i n B u i l d i n g s
Incentive Purpose Details
Utility energy
efficiency
obligation
(UEEO)
Support the uptake
of Standards and
Labelling, aid in the
development of an
ESCO industry.
Will be the main form of subsidy provided, and
funded via a small additional charge on the
electricity bill. Needs strong administration and
MV&E to work well. Is a stable long term
financing mechanism that drives energy
savings and long term economic benefit.
Incentives for
reporting of
building
performance
Aid the transition to
mandatory
reporting of building
energy
performance
Incentives could start with a payment for
compliance, moving to a no fee arrangement on
lodgement (an effective subsidy), through to
cost recovery through lodgement fees. Initially a
fund of RM10 million could be established to
enable owners to pay consultants as required to
meet compliance. Once the fund is exhausted
reporting should become mandatory. The
incentive could be in the form of a cash rebate
like the SAVE scheme, issued on satisfactory
compliance, which could be enabled through a
UEEO. Alternatively a tax break may be
considered.
Capacity
building of the
ESCO industry.
Build an ESCO
industry whilst
improving the
performance of
government
buildings
Incentive needs to go beyond financing, to
require government to commit to implementing
a certain number of Energy Performance
Contracts annually, which will build up ESCO
capacity. The development of standard
processes and contracts for governments to
use to procure energy savings through Energy
Performance Contracts will help too.

322 | P a g e E n e r g y E f f i c i e n c y i n B u i l d i n g s
The accompanying policy discussion papers explore these measures in
more detail. with the exception of grants to state governments to
support EE, discussed below
Funding of incentives
Malaysis aims to reduce the government budget deficit to zero by 2020;
it was 3.9% in 2013, and the aim is to gradually reduce it year on year to
2020.112
Any incentive programs need to bear this in mind, and endeavour to
minimise any negative impact on the government budget. A UEEO
scheme can potentially contribute to the financing of EE incentives.
Monitoring, reporting and impact assessment scheme.
The monitoring, reporting and impact assessment (MRIA) of each
incentive can be monitored as tabled below. Additionally KeTTHA to
host an annual meeting of government stakeholders (MoF, KPKT, JKR,
ST) to discuss and report on progress.
112 http://www.bloomberg.com/news/2014-02-13/malaysia-s-budget-deficit-shrinks-more-than-
government-targeted.html

323 | P a g e E n e r g y E f f i c i e n c y i n B u i l d i n g s
Table 22 - Monitoring, Reporting and Impact Assessment Scheme
Incentive Monitoring, reporting and impact assessment (MRIA)
Tax breaks for green
buildings
M: Require all buildings which intend to claim tax breaks to register at the design
stage, and provide an indication of the expected claim date and claim amount.
Establish a database for all buildings which intend to claim, and use it to track their
progress (intent to claim, claim, impact assessment). R: MoF to prepare an annual
report of registered and claimed buildings and provided to KeTTHA. IA: Use a
National Building Energy Consumption Database (NBECD) to verify savings and
identify impact of program. Note that IA can only be realistically determined from 2
years post occupancy and beyond. Undertaken by KeTTHA
Area adjustment for
green buildings
M: Request local government’s to provide to MoF on an annual basis a list of
buildings for which area adjustments have been claimed. R: MoF to provide an
overall list on an annual basis to KeTTHA. IA: Use the NBECD to verify performance
of these new buildings and verify impact. Undertaken by KeTTHA
Tax breaks for new
energy efficient
apartment bldgs.
MRIA: As per tax breaks for green buildings.
Utility energy efficiency
obligation
M: Measurement and Verification (M&V) is a very important element of the scheme
design to ensure that the savings achieved are accurately estimated. This is to be
undertaken applying the principles of the International Performance Measurement
and Verification Protocol (IPMVP) with the aim of achieving 80% certainty that
measured savings are within plus/minus 20% of actual. R: The UEEO administrator
(ST) to prepare an annual report to KeTTHA on the impact of the scheme. IA: To be
based on the M&V report prepared annually by ST, cross checked against the
NBECD. Undertaken by ST.
Incentives for reporting
of building
performance
M: ST to include in the NBECD a field which tracks which buildings have
claimed/been provided with the incentive. R: ST to provide an annual report to
KeTTHA. IA: To be determined using the NBECD, undertaken by KeTTHA.

324 | P a g e E n e r g y E f f i c i e n c y i n B u i l d i n g s
Incentive Monitoring, reporting and impact assessment (MRIA)
Capacity building of
the ESCO industry.
M: Monitor number of Energy Performance Contracts (EPCs) are delivered by
ESCOs to improve the performance of government buildings vs the annual target.
R: ST to prepare an annual report to KeTTHA. IA: Use the M&V reports produced as
part of the EPCs, cross checked against the NBECD. To be undertaken by ST.
Grants to state
governments to
support EE
M: MoF or KPKT to manage a database recording grants issued to state and local
governments. R: MoF/KPKT to prepare an annual report to KeTTHA. IA: Measured
by the number of local and state governments which are requiring mandatory use of
the EE provisions of the UBBL.