o689 - core · pondok pengawal. tindakan semacam mi boleh menyebabkan proses menjadi lebih kompleks...
TRANSCRIPT
EASY MAP A ROUTE MAP ADVISER - FOR UNIVERSITY MALAYSIA PAILANG
(EZMAP-UMP)
MADmAB BINTI OTIIMAN
A report submitted in partial fulfilment of the requirements for the award
of the Bachelor of Computer Science (Software Engineering)
Faculty of Computer Systems & Software Engineering
University Malaysia Pahang (UMP)
MAY 2011
PERPUSTAKAAN UNIVERSITI MALAYSIA PAHANG
No. Perolehan No. Panggian O689
Trikh
ABSTRAK
Tujuan utama kajian mi adalah untuk menjelajah dalam penemuan pusat laluan terpendek dengan
menggunakan algoritma Dijkstra. UPS akan menunjukkan tempa tyang telah dipilih tetapi ada
batasan untuk tempat-tempat yang tidak termasuk dalam UPS. Penelitian mi kemudian dilakukan
di UMP yang ditujukan untuk mahasiswa barn, kakitangan baru dan pelawat UMP's yang ingln
mencari pusat laluan terpendek. Saat mi, tidak ada sistem yang dapat menentukan jalan
terpendek dalamUMP. Jadi, mereka menggunakan sistem manual dengan mencari peta UMP di
pondok pengawal. Tindakan semacam mi boleh menyebabkan proses menjadi lebih kompleks
jika mereka ingin membuat proses pendaftaran atau bertemu seseorang selama masa yang telah
ditetapkan.Oleh itu, kajian mi menawarkan sistem yang dapat membantu para pelajar barn,
kakitangan barn dan pelawat dalam menemukan laluan terpendek yang telah diiiustrasikan
menggunakan peta graft dengan dua stesen. Secara khusus, kajian mi menggunakan SDLC
(Waterfall model) dalam rangka untuk mengembangkan mudah Peta University Malaysia Pahang
(EZMAP-UMP). Sistem mi adalah perkhidmatan aplikasi web yang dibangunkan menggunakan
NetBeans6.9.1 dan MySql.lJntuk mengumpul makium balas pelanggan, kaji selidik telah
digunakan.Pembemt setiap soalan dikira untuk menganalisis jawapan dari para
peserta.Keputusan kajian menunjukkan bahawa responden bersetuju bahawa EZMAP-UMP
mampu dalain penemuan pusat laluan terpendek antara dua stesen dengan betul.Selain itu, kajian
mi akan membantu pekerja barn dan pengunjung UMP's yang ingin mencari pusat laluan
terpendek yang diilustrasjkan menggunakan peta grafik antara dua stesen. Penelitian lebih lanjut
dapat dilakukan untuk meningkatbn system dengan mengembangkan lebih mesra pengguna dan
berjalan di monitor shin sentuh(1280 X800) pixel. Membina semula peta grafik dan menambah
penunjuk arah yang dihasilkan secara automatik ke stesen tertentu akan sangat meningkatkan
prestasi system dalam menghasilkan suatu sistem yang optimum dan fleksibel.Peningkatan juga
boleh dilakukan dalam mengintegrasikan dengan peranti seperti UPS dan lain-lain.
ix
TABLE OF CONTENTS
CHAPTER TITLE PAGE
ABSTRACT Vii
ABSTRAK
TABLE OF CONTENTS x
LIST OF TABLES xiii
LIST OF FIGURES xiv
LIST OF SYMBOL xvi
LIST OF APPENDICES xvii
IINTRODUCTION 1-4 1.1 Introduction 1 1.2 Problem Statement 2 1.3 Objective 3 1.4 Scope Project 3 1.5 Organization of the Thesis 4
2 LITERATURE REVIEW / 5-25 2.1 Introduction 5
2.2 Current System 7 2.3 Studies on Existing System 8
2.3.1 Google Maps 9 2.3.2 Traditional Map-Matching Algorithm 9 2.3.3 Advantages & Disadvantages of Google Maps 10
2.4 Related Algoriththlproblems 11 2.4.1 Greedy Algorithm 12
2.4.1.1 Kruskal's Algorithm 13 2.4.1.2 Prim's Algorithm 13
X
xi
2.4.1.3 liijkstra's Algorithm 13 2.4.2 Differences between Prim's, Kruskal's and Dijkstra's 14
Algorithm 2.5 Methodology Approach 16
2.5.1 The purpose of SDLC 16 2.6 Development Tools 17
2.6.1 Net Beans 6.9.1 17 2.6.2.1 Advantages of Net Beans 6.9.1 17
2.6.2 MySQL 18 2.6.2.1 Advantages of MySQL 18
2.6.3. Auto Cad 20 2.6.3.1 Advantages of Auto Cad 20
2.7 Propose Prototype 22 2.7.1 Advantages ofDijkstra's Algorithm 22
2.7.1.1 ShortestPath Algorithm (Dijkstra's algorithm) 23 2.7:2 The Proposed Method! Approach 25
3 METHODOLOGY 26-39 3.1 Introduction 26 3.2 SDLC Waterfall Model 27
3.2.1 Justification of Chosen Methodology 28 3.3 Feasibility 30 3.4 Analysis 30 3.5 Design 31
3.5.1 Data Collection 32 3.5.1.1 Defining Edges 32 3.5.1.2 Defining Nodes/Vertexes/Station 33
3.6 Implementation 35 3.6.1 System 1equirement 36 3.6.1.1 Hardware Requirement 36 3.6.1.2 Software Requirement 37
3.7 Testing 37 3.8 Maintainance 39
/
4 IMPLEMENTATION 40-48 4.1 Introduction 40 4.2 Development of Interface 41 4.3 Database Architecture 41 4.4 Development of System 43
4.4.1 Coding for retrieve the data from dburmap database 44 (Station)
xfl
4.4.2 Coding to set the station to station cost (Length) 45 4.4.3 Coding for find the shortest path and minimum cost 46
(Length). 4.4.4 Coding for display the result (Length) 47 4.4.5 Coding for display the result (Image) 48
5 RESULT AND DISCUSSION 49-56 5.1 Introduction 49 5.2 Testing Result 50 5.3 Result Analysis 50 5.4 Constraints 55 5.4.1 Development constraints 55
5.4.1.1 Technical Knowledge 55 5.4.1.2 Server Down 55 5.4.1.3 System Constrains 56
6 CONCLUSION 57-58 6.1 Summary 57
6.2 Future Research 58
REFERENCES, 59 APPENDICES 61
TABLE NO.
TITLE PAGE
LIST OF TABLES
XI,'
2.1 Advantages and Disadvantages of Google Map
2.2 Differences between Prim's, Kruskal's and Dijkstra's Algorithm
2.3 Comparisons of Methodology Approaches
2.4 Strength and Weakness of SDLC
3.1 Database design for Station Info
3.2 Database design for Path Info
3.3 Database design for Rule Info
3.4 Hardware specification
3.5 Software specification
10 14
15 16 33 33 33 36 37
LIST OF FIGURES
FIGURE NO. TITLE PAGE
2.1 Flow Chart for User Solve their Problem 8 2.2 Dijkstra's Algorithm which is based on Sequential Search 24 3.1 SDLC Waterfall Hierarchies 28 3.2 SDLC Model for EZMAP- University Malaysia Pahang 29
Route Map Adviser 3.3 Use case of User Module 34 3.4 Use case of Admin Module 35 3.5 Flowchart for find the best route for user 38 4.1 Data for each station and administrator 42 4.2 Source code for connection to dburmap database 43 4.3 SQL command for update data to dburmap database 43 4.4 Coding for retrieve the data from dburmap database 44
(Station) 4.5 Coding to set the station to station cost (Length) 45 4.6 Coding for find the shortest path and minimum cost 46
(Length). 4.7 Coding for display the result (Length) 47 4.8 Coding for display the result (image) 48 5.1 The main interface EZMAP-UMP that deployed in 50
windows operating system 5.2 Shows for every services interface for user to define their 51
return route.
xiv
5.3 Shows for every services interface for user to define their 51 return route.
5.4 The admin interface need to login before use admin 52 module
5.5 The validation interface for wrong password and 52 username for admin module that deployed in windows operating system
5.6 The validation interface for successful login for admin 53 module that deployed in windows operating system
5.7 shows the menu interface for admin module that deployed 53 in windows operating system
5.8 The insert interface for admin module that deployed in 54 windows operating system
5.9 The update interface for admin module that deployed in 54 windows operating system
xv
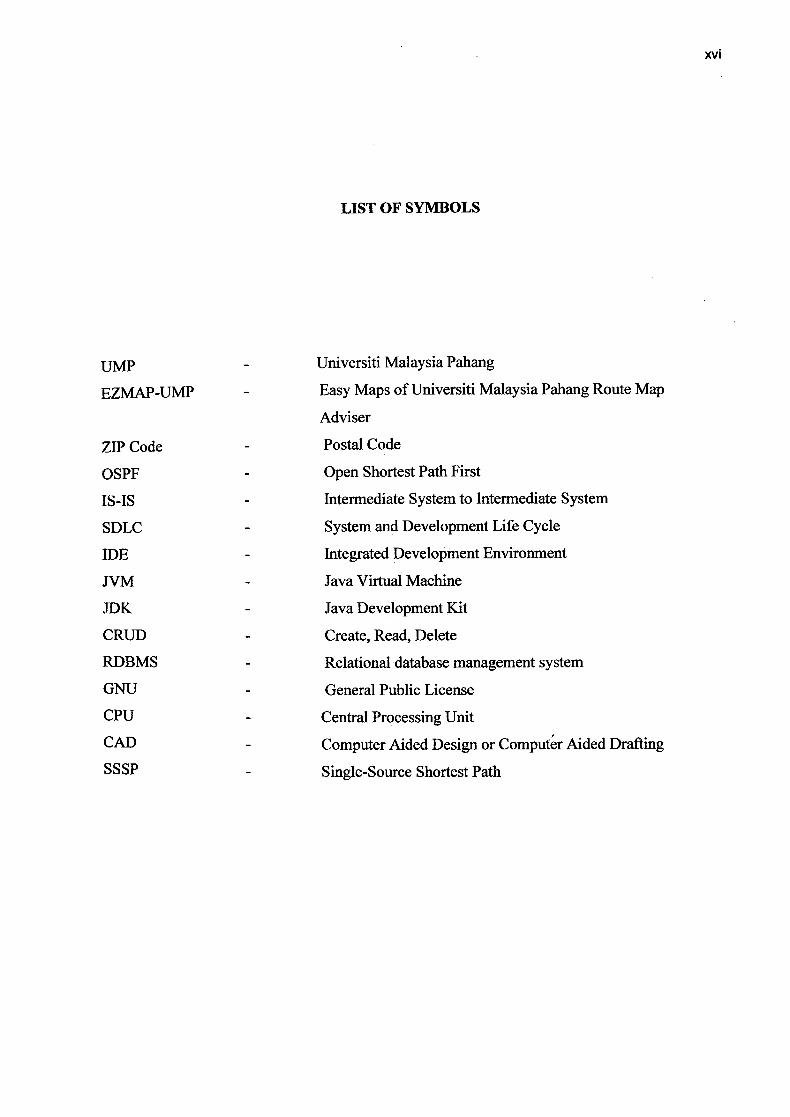
LIST OF SYMBOLS
UMP - Universiti Malaysia Pahang
EZMAP-UMP - Easy Maps of Universiti Malaysia Pahang Route Map
Adviser
ZIP Code - Postal Code
OSPF - Open Shortest Path First
IS-IS - Intermediate System to Intermediate System
SDLC - System and Development Life Cycle
IDE - Integrated Development Environment
JVM - Java Virtual Machine
JDK - Java Development Kit
CRUD - Create, Read, Delete
RDBMS - Relational database management system
GNU - General Public License
CPU - Central Processing Unit
CAD - Computer Aided Design or Computer Aided Drafting
SSSP - Single-Source Shortest Path
xvi
LIST OF APPENDICES
Appendix Title Page
A Gantt Chart 62
B EZMAP-UMP Data 63
C Testing Result 68
D Survey Questions 70
E User Manual 72
xvii
CHAPTER 1
INTRODUCTION
1.1 Introduction
A map is a visual representation of an area, a symbolic depiction highlighting
a relationship between elements of that space such as objects, regions, and themes.
Many maps are static two-dimensional, geometrically accurate or approximately
accurate representations of three-dimensional space, while others are dynamic or
interactive, even three-dimensional. Although most commonly used to depict
geography, maps may represent any space, real or imagined, without regard
to context or scale.
As mentioned before, the map is used as a guide or a conductor way when it
is come in place that did not well known or there are exists rules inside the place. In
order to know the location or the suitable ways user need a map to guide them.
However there are some constrains that makes user activities cannot be done such as
time limitation. -
Easy Map a Route Map Adviser- for UMP (EZMAP) is a standalone
application system that develops specifically for student, staff and UMP'S visitors to
advise the all of them to explore liMp (University Malaysia Pahang) area by using
the shortest route path. Current practice use manual process to identify the
3
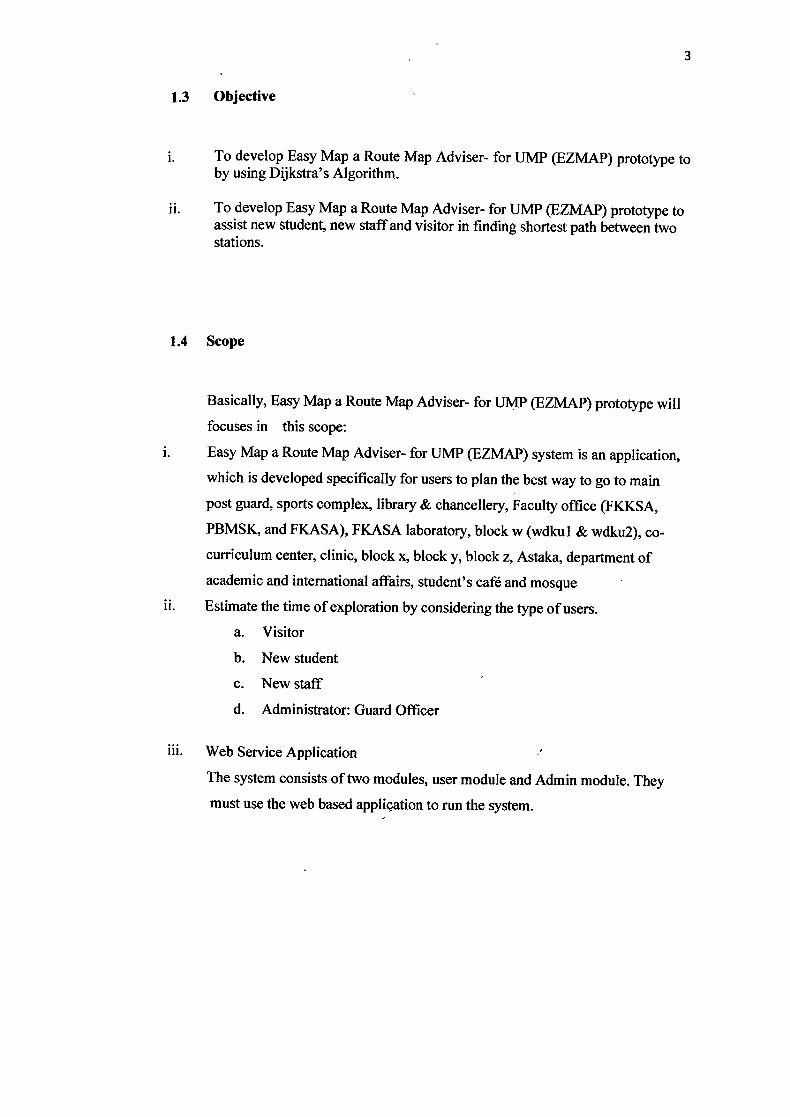
1.3 Objective
i. To develop Easy Map a Route Map Adviser- for UMP (EZMAP) prototype to by using Dijkstra's Algorithm.
ii. To develop Easy Map a Route Map Adviser- for liMP (EZMAP) prototype to assist new student, new staff and Visitor in finding shortest path between two stations.
1.4 Scope
Basically, Easy Map a Route Map Adviser- for liMP (EZMAP) prototype will
focuses in this scope:
Easy Map a Route Map Adviser- for UMP (EZMAP) system is an application,
which is developed specifically for users to plan the best way to go to main
post guard, sports complex, library & chancellery, Faculty office (FKKSA,
PBMSK, and FKASA), FKASA laboratory, block w (wdkul & wdku2), co-
curriculum center, clinic, block x, block y, block z, Astaka, department of
academic and international affairs, student's café and mosque
ii. Estimate the time of exploration by considering the type of users.
a. Visitor
b. New student
c. New staff
d. Administrator: Guard Officer
Web Service Application
The system consists of two modules, user module and Admin module. They
must use the web based application to run the system.
4
iv. Data
The range of data that is used in the system is from main post guard until sports
complex, library & chancellery, Faculty office (FKKSA, PBMSK, and
FKASA), FKASA laboratory, block w (wdkul & wdku2), co-curriculum
center, clinic, block x, block y, block z, Astaka, department of academic and
international affairs, student's café and mosque. The UMP's Map data came
from Department of Development & Property Management of UMP.
1.5 Organization of the Thesis
This thesis consists of six (6) chapters. Chapter 1 will provide a brief
overview of the entire project including objective of the project, scope and problem
statement.
Chapter 2 briefly explains about manual process of the EZMAP-UMP and
background of the project studied. The other aspects that will be discussed are the
comparison between the prototype system and the existing application.
Chapter 3 also details out the system development life cycle besides software
and hardware specification that are needed for this project development.
Chapter 4 explains about implementations that are required to develop the system.
Chapter 5 will describes the output of the EZMAP-UMP System, there are
some constrains in completing the project, the result and recommendations to further
this research of the system.
Chapter 6 is about consisting of five chapters which each chapter describes
the process in developing the project.
CHAPTER 2
LITERATURE REVIEW
2.1 Introduction
Route maps, which depict a path from one location to another, are one of the
most common forms of graphic communication. Although creating a route map may
seem to be a straightforward task, the underlying design of most route maps is quite
complex. Map makers use a variety of cartographic generalization techniques including
distortion, simplification, and abstraction to improve the clarity of the map and to
emphasize the most important information. Decisions are often evaluated on the basis of
the quality processes. [5]
A route map defines which of the routes from the specified routing protocol are
allowed to be redistributed into the target. routing process. Route-maps have many
features in common with widely known access control lists. These are some of the traits
common to both mechanisms. [8
They are an ordered sequence of individual statements, and each has a permit or
denies result. Evaluation of route-maps consists of a list scan, in a predetermined order,
and an evaluation of the criteria of each statement that matches. A list scan is aborted
once the first statement match is found an action associated with the statement match is
performed. They are generic mechanism criteria matches and match interpretation are
dictated by the way they are applied. The same route-map applied to different tasks
might be interpreted differently. [8]
In the context of University Malaysia (UMP) , which is emphasize on
Technology and Engineering, the application of up-to-date information system to assist
each of the parties become highest priority. Due to the development and expansion of
UMP, the route map getting more complicated form day to day.
The increasingly numbest of new unit, Department and Road has been
contributing to problem of finding the shortest route from main post guard until sports
complex, library, chancellery, block w (wdkul & wdku2) and clinic. Fail to find the
specific location in the specific time mean more time will be consumed. Thus, the Easy
Map a Route Map Adviser- for UMP (EZMAP) application can carry and gather useful
information for delivery to user and perform other useful functions to deal with the
travel.
Route calculation is the most important part of EZMAP-UMP application. In
present Dijkstra's Algorithm, this algorithm will solves all shortest path since this case
study will suggest only one probability of pathway.
7
2.2 Current system
For current situation, new student, new staff and UMP's visitor who wants to
explore Ump's area and to search the shortest route path through the manual system
needs to find the map of UMP at the post guard or inside the UMP's portal. After get the
map, mostly user meet the guard or the staff or the senior students in UMP to ask about
the map and ask at them which is the shortest path that they can choose in order to
reduce the time consuming. The guard or the staff or the senior students in UMP will
give their suggestion and recommend to the user for the shortest path that suitable for
them. Nevertheless, there is existing some problems, when the information had given
have multiple ways which is the user need to choose the best way by using their
assumption.
Normally, each of them will give different suggestion thus; it will make them
confuse to choose the shortest path.
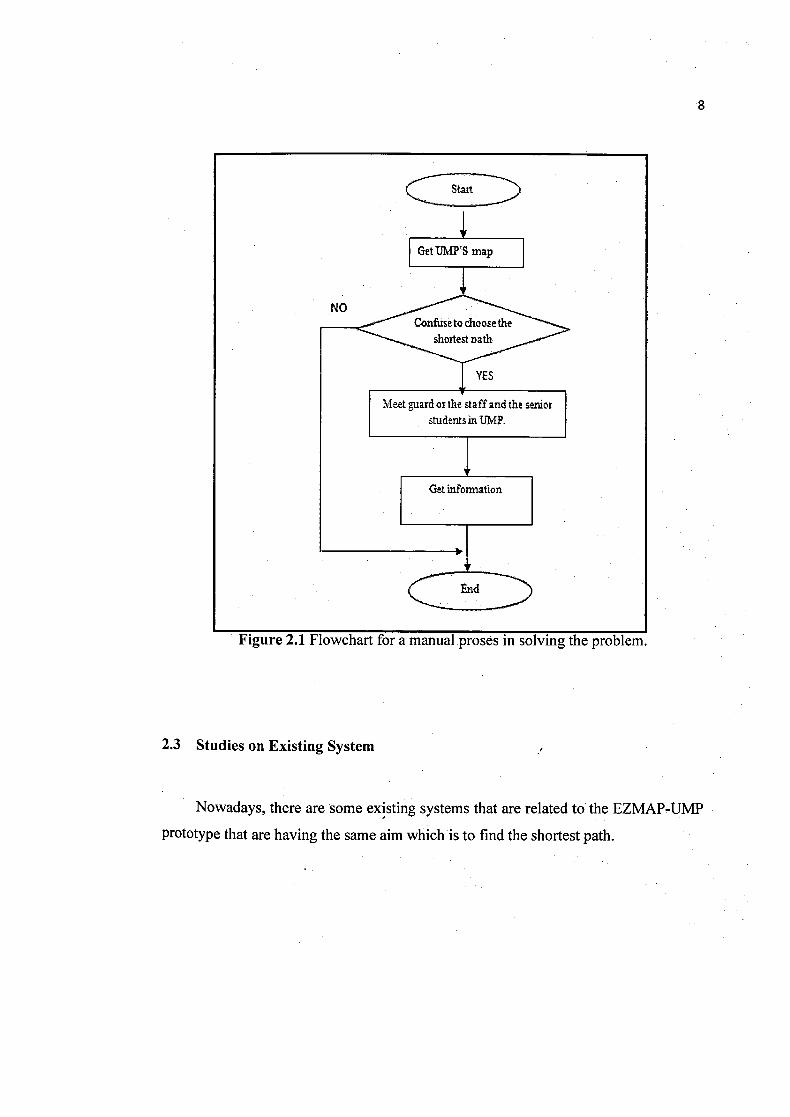
Figure 2.1 shows the flowchart for visitors when solving their problem. After get the
map, most of them will confuse to choose the best shortest path. Then, all of them will
meet guard or the staff or the students in UMP to help them.
Get DMP'S map
NOConfiise to choose the
YES
• _
Meet guard or the staff and the senior students in UMP.
Get infomation
Figure 2.1 Flowchart for a manual proses in solving the problem.
2.3 Studies on Existing System
Nowadays, there are some existing systems that are related to the EZMAP-UMP
prototype that are having the same aim which is to find the shortest path.
8
9.
2.3.1 Google Maps
There is having an example of computerized system that has built like Google
Maps. These systems build with same purpose that is for changing from manual to
practical system and easy to analyze data of the system. While using this system user
need to type in any unique place into the search, such as an address, a business name,
an airport code.
The resulting map will show options on the right-hand side with little balloon
indicators. Then, the user will zoom in the map on the left side or by using plus and
minus buttons. In addition, the system will zoom in for comprehensive street maps.
including almost every street name. Furthermore, obtaining directions to or from a
location is easy by using the indicator balloon. For example, type in a type of
business like "pizza" and a ZIP Code and Google Maps will locate nearby options.
2.3.2 Traditional map-matching algorithms
There is another example of traditional map-matching algorithms mainly use
two methods which are the incremental method and the global method. Both of them
have advantages and disadvantages Of themselves while the. global map-matching
algorithm produces better matching results, the incremental algorithm produces
results of lower quality. All things . considering the two traditional algorithms, this
paper proposes a heuristic map-matching algorithm.' by using vector-based
recognition. [2]
Firstly, the algorithm use; the heuristic search method which is similar to A*
algorithm, and it makes use of geometric operation to form the restriction, and make
the comparison between the vector formed with the vehicular GPS points and the
special road network to heuristically search and select the vehicular possible
traveling routes. Secondly, it globally compares the vehicular every possible route by
calculating the map-matching weight, and then chooses the optimal one. The. result -
10
of testing demonstrates the efficiency of the algorithm both at accuracy and
computational speed when handling the large-scale data of GPS tracking data even
under the complex road network conditions. [2] -
2.3.3 Advantages and disadvantages of Google Maps
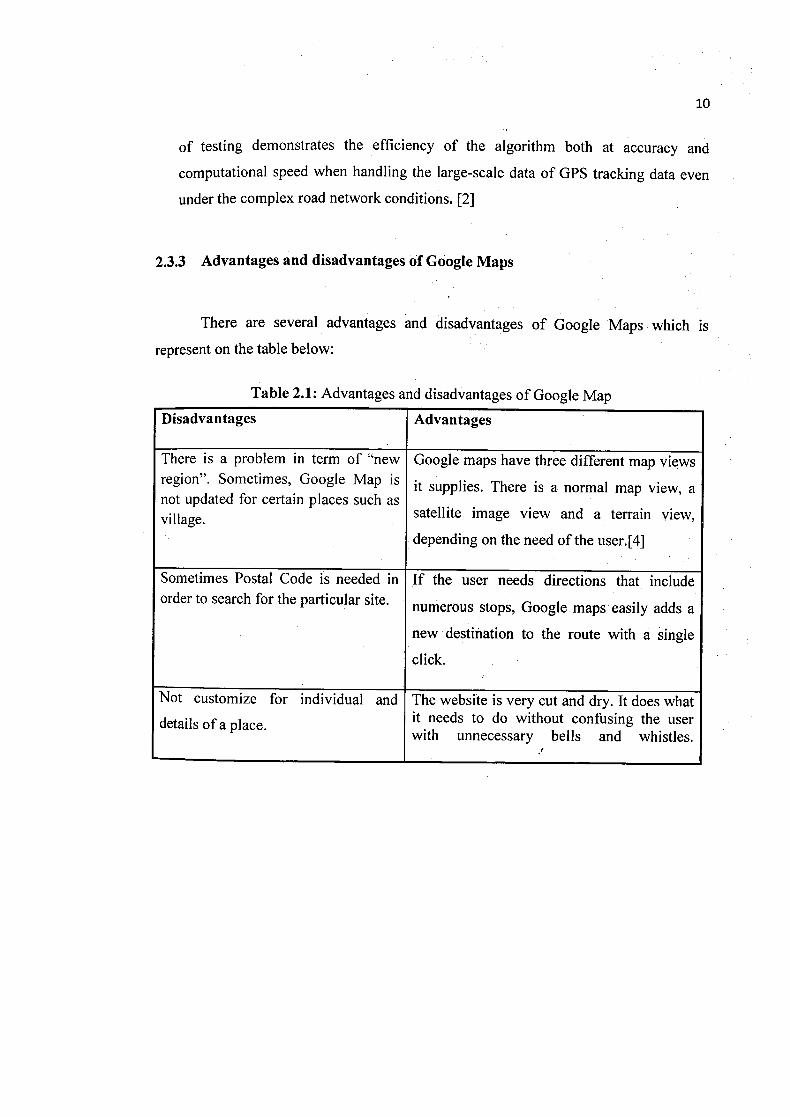
There are several advantages and disadvantages of Google Maps which is
represent on the table below:
Table 2.1: Advantages and disadvantages of Google Map
Disadvantages Advantages
There is a problem in term of "new Google maps have three different map views region". Sometimes, Google Map is it supplies. There is a normal map view, a not updated for certain places such as village. satellite image view and a terrain view,
depending on the need of the user.[4]
Sometimes Postal Code. is needed in If the user needs directions that include order to search for the particular site. numerous stops, Google maps easily adds a
new destination to the route with a single
click.
Not customize for individual and The website is very cut and dry. It does what
details of a place. it needs to do without confusing the user with unnecessary bells and whistles.
I
11
2.4 Related Algorithm! Problems
The functionality of Dijkstra's original algorithm can be extended with a variety
of modifications. For example, sometimes it is. desirable to present solutions which are
less than mathematically optimal. To obtain a ranked list of less-than-optimal solutions,
the optimal solution is first calculated. A single edge appearing in the optimal solution is
removed from the graph, and the optimum solution to this new graph is calculated. Each
edge of the original solution is suppressed in turn and a new shortest-path calculated.
The secondary solutions are then ranked and presented after the first optimal solution.
[1]
Dijkstra's algorithm is usually the working principle behind link-state routing
protocols, OSPF and IS-IS being the most common ones. [11]
Unlike Dijkstra's algorithm, the Bellman-Ford algorithm can be used on graphs
with negative edge weights, as long as the graph contains no negative cycle reachable
from the source vertex s. (The presence Of such cycles means there is no shortest path,
since the total weight becomes lower each time the cycle is traversed.)[l 1]
The A* algorithm is a generalization of Dijkstra's algorithm that cuts down on
the size of the sub graph that must be explored, if additional information is available that
provides a lower bound on the "distance" to the target. This approach can be viewed
from the perspective of linear programming there is a natural linear program for
computing shortest paths, and solutions to its dual linear program are feasible if and only
if they form a consistent heuristic (speaking roughly, since the sign conventions differ
from place to place in the literature). This feasible dual /consistent heuristic defines •a
nonnegative reduced cost and A* is essentially running Dijkstra's algorithm with these
reduced costs. If the dual satisfies the weaker condition of admissibility, then A* is
instead more akin to the Bellman-Ford algorithm. [10]
12
The process that underlies Dijkstra's algorithm is similar to the greedy process
used in Prim's algorithm. Prim's purpose is to find a minimum spanning tree for a graph.
2.4.1 Greedy Algorithm
A greedy algorithm is any algorithm that follows the problem solving meta
heuristic of making the locally optimal choice at each stage with the hope of finding the
global optimum.
Greedy algorithms mostly (but not always) fail to find the globally optimal
solution, because they usually do not operate exhaustively on all the data. They can
make commitments to certain choices too early which prevent them from finding the
best overall solution later. For example, all known greedy coloring algorithms for
the graph coloring problem and all other NP-complete problems do not consistently find
optimum solutions. Nevertheless, they are useful because they are quick to think up and
often give good approximations to the optimum. [7]
If a greedy algorithm can be proven to yield the global optimum for a given
problem class, it typically becomes the method of choice because it is faster than other
optimization methods like dynamic programming. Examples of such greedy algorithms
are Kruskal's algorithm and Prim's algorithm for finding minimum spanning
trees, Dijkstra's algorithm for finding single-source shortest paths, and the algorithm for
finding optimum Huffman trees. [7]
Greedy algorithms appear in network routing as well. Using greedy routing, a
message is forwarded to the neighboring node which is "closest" to the destination. The
notion of a node's location (and hence "closeness") may be determined by its physical
location, as in geographic routing used, by ad-hoc networks. Location may also be an
entirely artificial construct as in small world routing . anci distributed hash table. [7]
13
2.4.1.1 Kruskal's algorithm
Kruskal's algorithm is an algorithm in graph theory that finds a minimum
spanning tree for a connected weighted graph. This means it finds a subset of
the edges that forms a tree that includes every vertex, where the total weight of all the
edges in the tree is minimized. If the graph is not connected, then it finds a minimum
spanning forest (a minimum spanning tree for each connected component). Kruskal's
algorithm is an example of a greedy algorithm. [13]
2.4.1.2 Prim's algorithm
Prim's algorithm is an algorithm that finds a minimum spanning tree for
a connected weighted undirected graph. This means it finds a subset of the edges that
forms a tree that includes every vertex, where the total weight of all the edges in the tree
is minimized. Prim's algorithm is an example of a greedy algorithm. [13]
2.4.1.3 Dijkstra's Algorithm
Dijkstra's algorithm is called the single-source shortest path. It is also known as
the single source shortest path problem. It computes length of the shortest path from the
source to each of the remaining vertices in the graph. The single source shortest path
Problem can be described as follows:
Let G= {V, E} be a directed weighted graph with V having the set of vertices.
The special vertex s in V, where s is the source and let for any edge e in B, Edge cost (e)
is the length of edge e. All the weights in the graph should be non-negative. Before
going in depth about Dijkstra's algorithm let's talk in detail about directed-weighted
graph. Directed graph can be defined as an ordered pair G: (V,E) with V is a set,
14
whose elements are called vertices or nodes and E is a set of ordered pairs of vertices,
called directed edges, arcs, or arrows. Directed graphs are also known as digraph. [3]
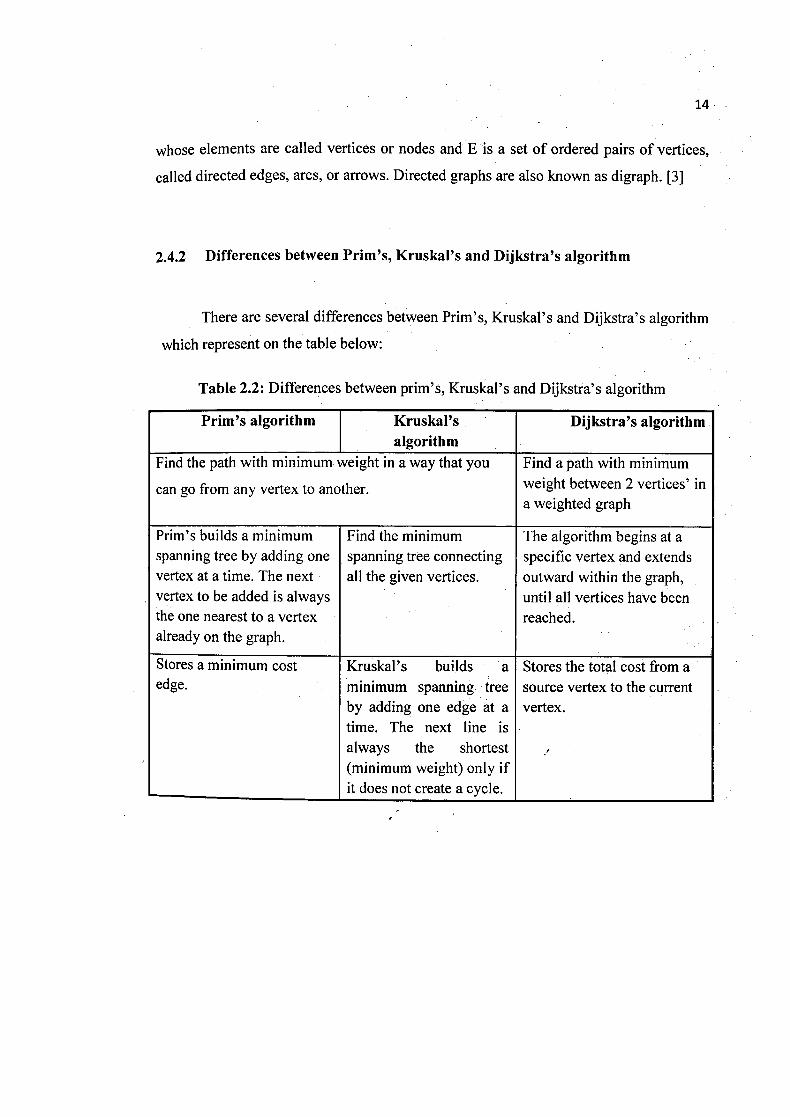
2.4.2 Differences between Prim's, Kruskal's and Dijkstra's algorithm
There are several differences between Prim's, Kruskal' s and Dijkstra' s algorithm
which represent on the table below:
Table 2.2: Differences between prim's, Kruskal's and Dijkstra's algorithm
Prim's algorithm Kruskal's Dijkstra's algorithm algorithm
Find the path with minimum weight in a way that you Find a path with minimum
can go from any vertex to another. weight between 2 vertices' in a weighted graph
Prim's builds a minimum Find the minimum The algorithm begins at a spanning tree by adding one spanning tree connecting specific vertex and extends vertex at a time. The next all the given vertices, outward within the graph, vertex to be added is always until all vertices have been the one nearest to a vertex reached. already on the graph.
Stores a minimum cost Kruskal's builds a Stores the total cost from a edge. minimum spanning tree source vertex to the current
by adding one edge at a vertex. time. The next line is always the shortest (minimum weight) only if it does not create a cycle.
15
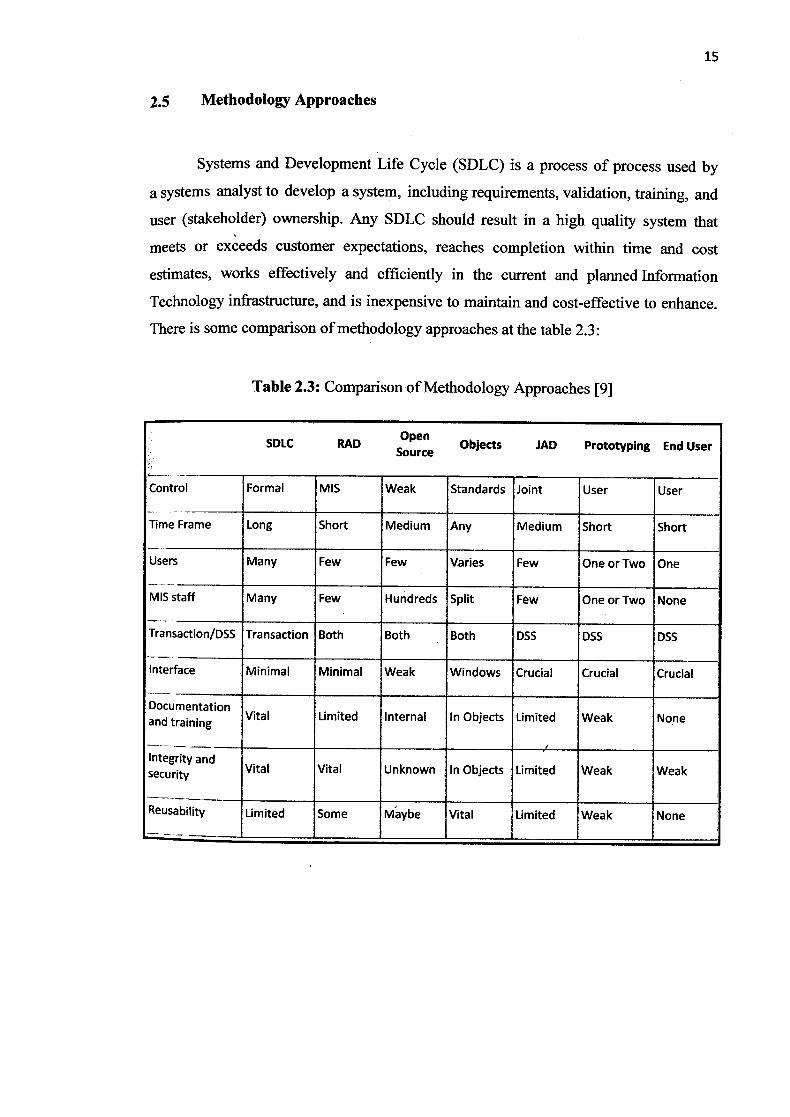
2.5 Methodology Approaches
Systems and Development Life Cycle (SDLC) is a process of process used by
a systems analyst to develop a system, including requirements, validation, training, and
user (stakeholder) ownership. Any SDLC should result in a high quality system that
meets or exceeds customer expectations, reaches completion within time and cost
estimates, works effectively and efficiently in the current and planned Information
Technology infrastructure, and is inexpensive to maintain and cost-effective to enhance.
There is some comparison of methodology approaches at the table 23:
Table 2.3: Comparison of Methodology Approaches [9]
SDLC RAD OpenObjects lAD Prototyping End User Source
Control Formal MIS Weak Standards Joint User User
Time Frame Long Short Medium Any Medium Short Short
Users Many Few Few Varies Few One or Two One
MIS staff Many Few Hundreds Split Few One or Two None
Transaction/DSS Transaction Both Both Both DSS DSS DSS
Interface Minimal Minimal Weak Windows Crucial Crucial Crucial
Documentation and training Vital Limited Internal In Objects Limited Weak None
Integrity and security Vital Vital Unknown In Objects Limited Weak Weak
Reusability Limited Some Maybe Vital Limited Weak None