malaysia : bilangan ternakan, 2016 … pdf/perancangan...negeri kerbau lembu kambing bebiri babi...
TRANSCRIPT
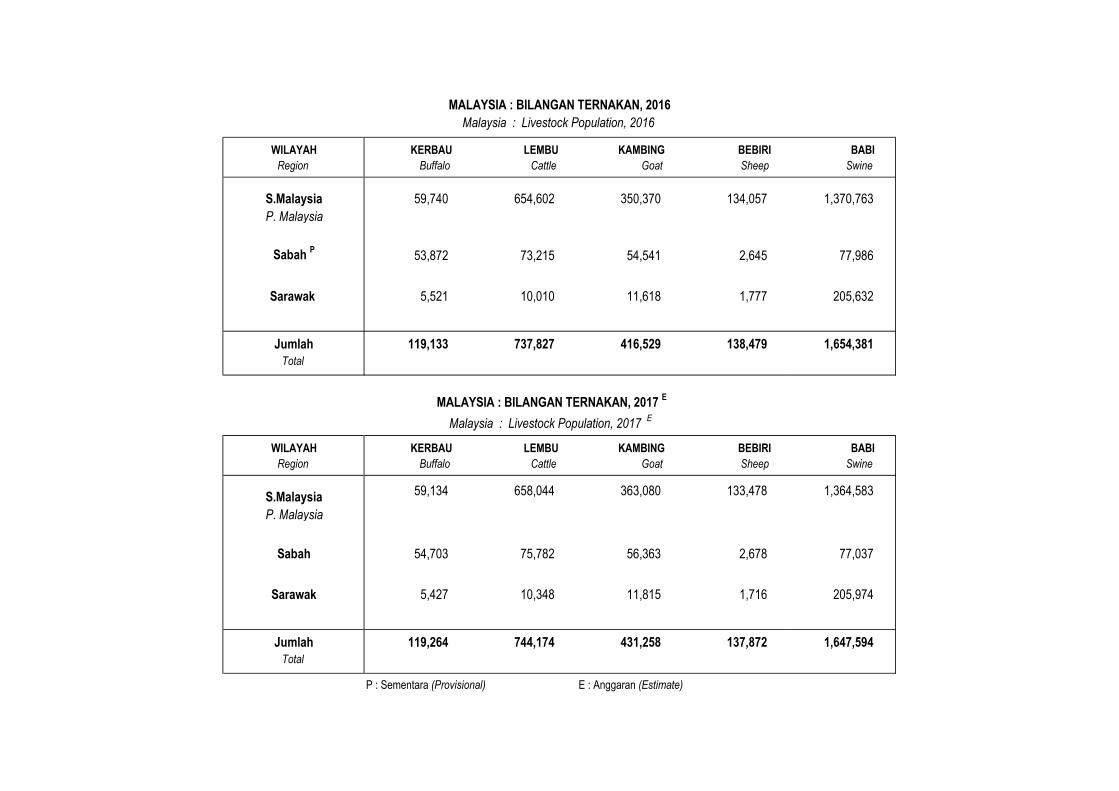
MALAYSIA : BILANGAN TERNAKAN, 2016
Malaysia : Livestock Population, 2016
WILAYAH KERBAU LEMBU KAMBING BEBIRI BABI
Region Buffalo Cattle Goat Sheep Swine
S.Malaysia 59,740 654,602 350,370 134,057 1,370,763
P. Malaysia
Sabah P
53,872 73,215 54,541 2,645 77,986
Sarawak 5,521 10,010 11,618 1,777 205,632
Jumlah 119,133 737,827 416,529 138,479 1,654,381
Total
MALAYSIA : BILANGAN TERNAKAN, 2017 E
Malaysia : Livestock Population, 2017 E
WILAYAH KERBAU LEMBU KAMBING BEBIRI BABI
Region Buffalo Cattle Goat Sheep Swine
S.Malaysia 59,134 658,044 363,080 133,478 1,364,583
P. Malaysia
Sabah 54,703 75,782 56,363 2,678 77,037
Sarawak 5,427 10,348 11,815 1,716 205,974
Jumlah 119,264 744,174 431,258 137,872 1,647,594
Total
P : Sementara (Provisional) E : Anggaran (Estimate)
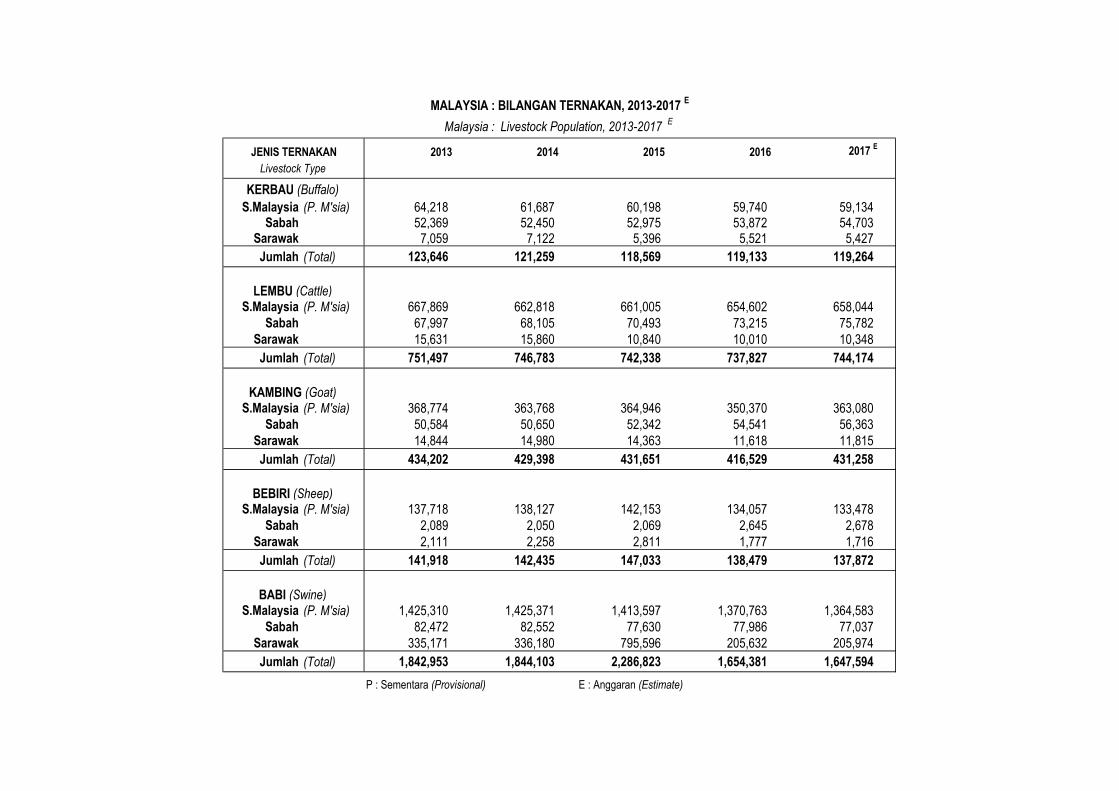
MALAYSIA : BILANGAN TERNAKAN, 2013-2017 E
Malaysia : Livestock Population, 2013-2017 E
JENIS TERNAKAN 2013 2014 2015 2016 2017 E
Livestock Type
KERBAU (Buffalo)
S.Malaysia (P. M'sia) 64,218 61,687 60,198 59,740 59,134Sabah 52,369 52,450 52,975 53,872 54,703
Sarawak 7,059 7,122 5,396 5,521 5,427
Jumlah (Total) 123,646 121,259 118,569 119,133 119,264
LEMBU (Cattle)S.Malaysia (P. M'sia) 667,869 662,818 661,005 654,602 658,044
Sabah 67,997 68,105 70,493 73,215 75,782
Sarawak 15,631 15,860 10,840 10,010 10,348
Jumlah (Total) 751,497 746,783 742,338 737,827 744,174
KAMBING (Goat)S.Malaysia (P. M'sia) 368,774 363,768 364,946 350,370 363,080
Sabah 50,584 50,650 52,342 54,541 56,363
Sarawak 14,844 14,980 14,363 11,618 11,815
Jumlah (Total) 434,202 429,398 431,651 416,529 431,258
BEBIRI (Sheep)S.Malaysia (P. M'sia) 137,718 138,127 142,153 134,057 133,478
Sabah 2,089 2,050 2,069 2,645 2,678
Sarawak 2,111 2,258 2,811 1,777 1,716
Jumlah (Total) 141,918 142,435 147,033 138,479 137,872
BABI (Swine)S.Malaysia (P. M'sia) 1,425,310 1,425,371 1,413,597 1,370,763 1,364,583
Sabah 82,472 82,552 77,630 77,986 77,037
Sarawak 335,171 336,180 795,596 205,632 205,974
Jumlah (Total) 1,842,953 1,844,103 2,286,823 1,654,381 1,647,594
P : Sementara (Provisional) E : Anggaran (Estimate)
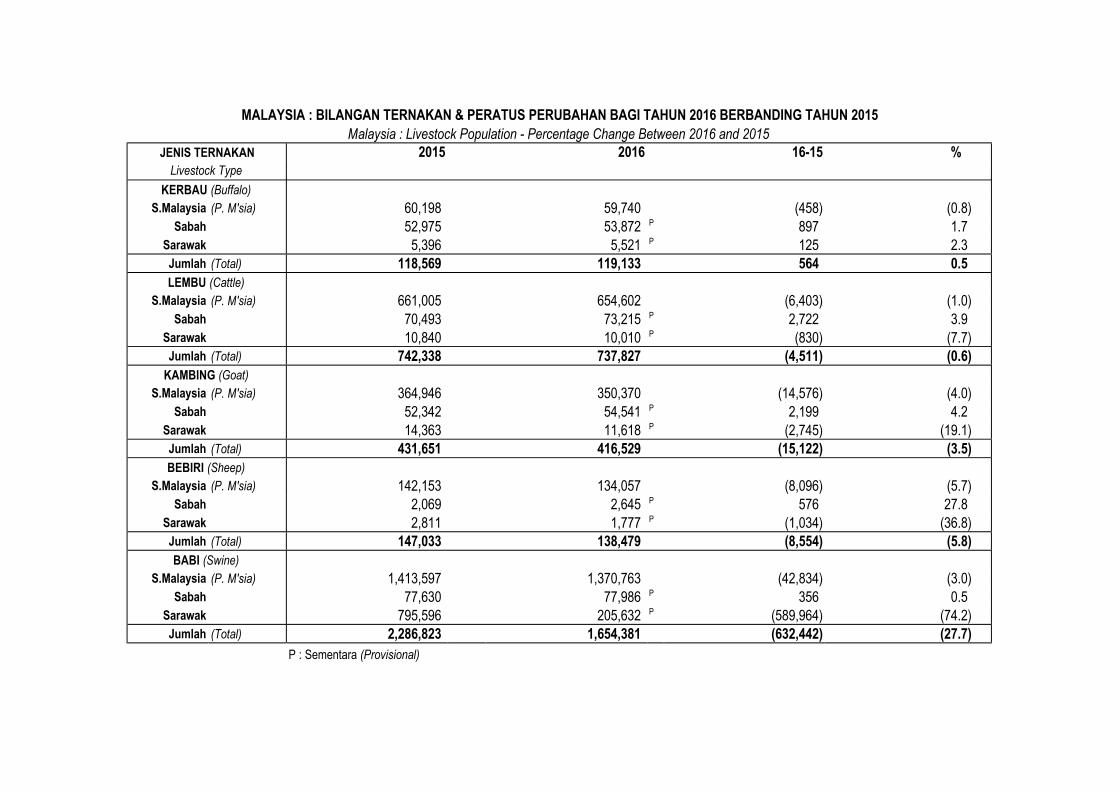
MALAYSIA : BILANGAN TERNAKAN & PERATUS PERUBAHAN BAGI TAHUN 2016 BERBANDING TAHUN 2015
Malaysia : Livestock Population - Percentage Change Between 2016 and 2015
JENIS TERNAKAN 2015 2016 16-15 %
Livestock Type
KERBAU (Buffalo)
S.Malaysia (P. M'sia) 60,198 59,740 (458) (0.8)
Sabah 52,975 53,872 P 897 1.7
Sarawak 5,396 5,521 P 125 2.3
Jumlah (Total) 118,569 119,133 564 0.5
LEMBU (Cattle)
S.Malaysia (P. M'sia) 661,005 654,602 (6,403) (1.0)
Sabah 70,493 73,215 P 2,722 3.9
Sarawak 10,840 10,010 P (830) (7.7)
Jumlah (Total) 742,338 737,827 (4,511) (0.6)
KAMBING (Goat)
S.Malaysia (P. M'sia) 364,946 350,370 (14,576) (4.0)
Sabah 52,342 54,541 P 2,199 4.2
Sarawak 14,363 11,618 P (2,745) (19.1)
Jumlah (Total) 431,651 416,529 (15,122) (3.5)
BEBIRI (Sheep)
S.Malaysia (P. M'sia) 142,153 134,057 (8,096) (5.7)
Sabah 2,069 2,645 P 576 27.8
Sarawak 2,811 1,777 P (1,034) (36.8)
Jumlah (Total) 147,033 138,479 (8,554) (5.8)
BABI (Swine)
S.Malaysia (P. M'sia) 1,413,597 1,370,763 (42,834) (3.0)
Sabah 77,630 77,986 P 356 0.5
Sarawak 795,596 205,632 P (589,964) (74.2)
Jumlah (Total) 2,286,823 1,654,381 (632,442) (27.7)
P : Sementara (Provisional)
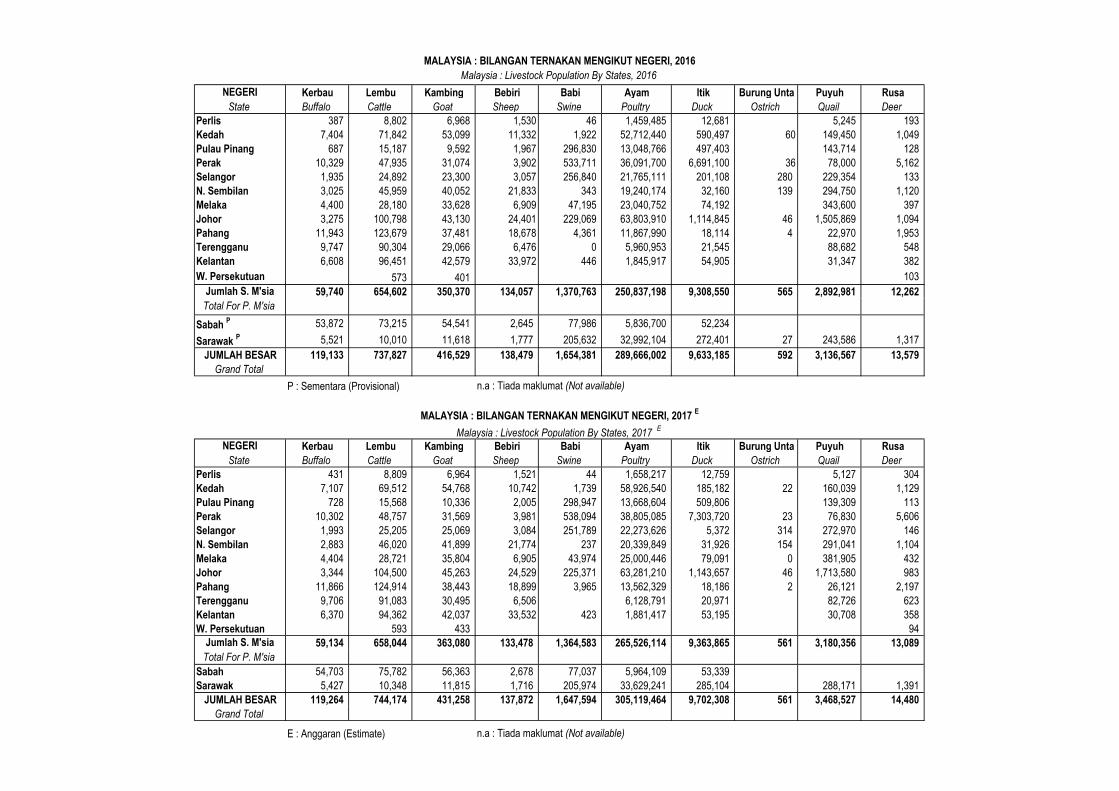
MALAYSIA : BILANGAN TERNAKAN MENGIKUT NEGERI, 2016
Malaysia : Livestock Population By States, 2016
NEGERI Kerbau Lembu Kambing Bebiri Babi Ayam Itik Burung Unta Puyuh Rusa
State Buffalo Cattle Goat Sheep Swine Poultry Duck Ostrich Quail Deer
Perlis 387 8,802 6,968 1,530 46 1,459,485 12,681 5,245 193
Kedah 7,404 71,842 53,099 11,332 1,922 52,712,440 590,497 60 149,450 1,049
Pulau Pinang 687 15,187 9,592 1,967 296,830 13,048,766 497,403 143,714 128
Perak 10,329 47,935 31,074 3,902 533,711 36,091,700 6,691,100 36 78,000 5,162
Selangor 1,935 24,892 23,300 3,057 256,840 21,765,111 201,108 280 229,354 133
N. Sembilan 3,025 45,959 40,052 21,833 343 19,240,174 32,160 139 294,750 1,120
Melaka 4,400 28,180 33,628 6,909 47,195 23,040,752 74,192 343,600 397
Johor 3,275 100,798 43,130 24,401 229,069 63,803,910 1,114,845 46 1,505,869 1,094
Pahang 11,943 123,679 37,481 18,678 4,361 11,867,990 18,114 4 22,970 1,953
Terengganu 9,747 90,304 29,066 6,476 0 5,960,953 21,545 88,682 548
Kelantan 6,608 96,451 42,579 33,972 446 1,845,917 54,905 31,347 382
W. Persekutuan 573 401 103
Jumlah S. M'sia 59,740 654,602 350,370 134,057 1,370,763 250,837,198 9,308,550 565 2,892,981 12,262
Total For P. M'sia
Sabah P 53,872 73,215 54,541 2,645 77,986 5,836,700 52,234
Sarawak P 5,521 10,010 11,618 1,777 205,632 32,992,104 272,401 27 243,586 1,317
JUMLAH BESAR 119,133 737,827 416,529 138,479 1,654,381 289,666,002 9,633,185 592 3,136,567 13,579
Grand Total
P : Sementara (Provisional) n.a : Tiada maklumat (Not available)
MALAYSIA : BILANGAN TERNAKAN MENGIKUT NEGERI, 2017 E
Malaysia : Livestock Population By States, 2017 E
NEGERI Kerbau Lembu Kambing Bebiri Babi Ayam Itik Burung Unta Puyuh Rusa
State Buffalo Cattle Goat Sheep Swine Poultry Duck Ostrich Quail Deer
Perlis 431 8,809 6,964 1,521 44 1,658,217 12,759 5,127 304
Kedah 7,107 69,512 54,768 10,742 1,739 58,926,540 185,182 22 160,039 1,129
Pulau Pinang 728 15,568 10,336 2,005 298,947 13,668,604 509,806 139,309 113
Perak 10,302 48,757 31,569 3,981 538,094 38,805,085 7,303,720 23 76,830 5,606
Selangor 1,993 25,205 25,069 3,084 251,789 22,273,626 5,372 314 272,970 146
N. Sembilan 2,883 46,020 41,899 21,774 237 20,339,849 31,926 154 291,041 1,104
Melaka 4,404 28,721 35,804 6,905 43,974 25,000,446 79,091 0 381,905 432
Johor 3,344 104,500 45,263 24,529 225,371 63,281,210 1,143,657 46 1,713,580 983
Pahang 11,866 124,914 38,443 18,899 3,965 13,562,329 18,186 2 26,121 2,197
Terengganu 9,706 91,083 30,495 6,506 6,128,791 20,971 82,726 623
Kelantan 6,370 94,362 42,037 33,532 423 1,881,417 53,195 30,708 358
W. Persekutuan 593 433 94
Jumlah S. M'sia 59,134 658,044 363,080 133,478 1,364,583 265,526,114 9,363,865 561 3,180,356 13,089
Total For P. M'sia
Sabah 54,703 75,782 56,363 2,678 77,037 5,964,109 53,339
Sarawak 5,427 10,348 11,815 1,716 205,974 33,629,241 285,104 288,171 1,391
JUMLAH BESAR 119,264 744,174 431,258 137,872 1,647,594 305,119,464 9,702,308 561 3,468,527 14,480
Grand Total
E : Anggaran (Estimate) n.a : Tiada maklumat (Not available)
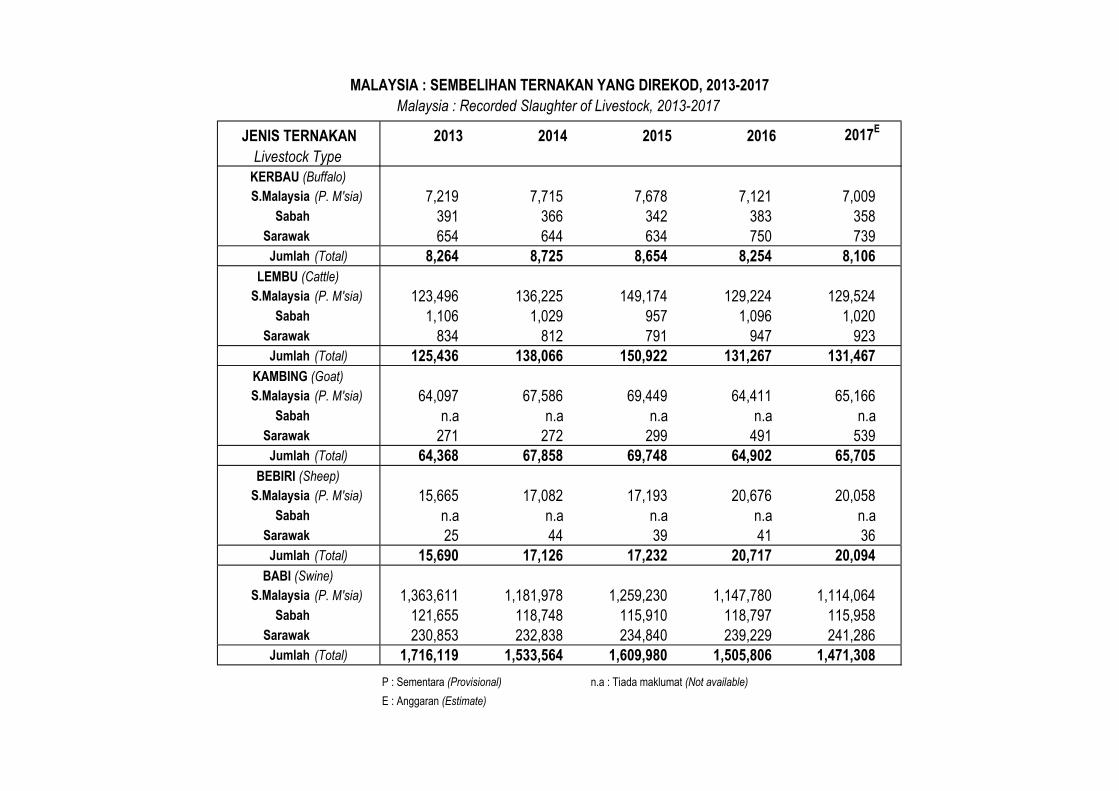
MALAYSIA : SEMBELIHAN TERNAKAN YANG DIREKOD, 2013-2017
Malaysia : Recorded Slaughter of Livestock, 2013-2017
JENIS TERNAKAN 2013 2014 2015 2016 2017E
Livestock Type
KERBAU (Buffalo)
S.Malaysia (P. M'sia) 7,219 7,715 7,678 7,121 7,009
Sabah 391 366 342 383 358
Sarawak 654 644 634 750 739
Jumlah (Total) 8,264 8,725 8,654 8,254 8,106
LEMBU (Cattle)
S.Malaysia (P. M'sia) 123,496 136,225 149,174 129,224 129,524
Sabah 1,106 1,029 957 1,096 1,020
Sarawak 834 812 791 947 923
Jumlah (Total) 125,436 138,066 150,922 131,267 131,467
KAMBING (Goat)
S.Malaysia (P. M'sia) 64,097 67,586 69,449 64,411 65,166
Sabah n.a n.a n.a n.a n.a
Sarawak 271 272 299 491 539
Jumlah (Total) 64,368 67,858 69,748 64,902 65,705
BEBIRI (Sheep)
S.Malaysia (P. M'sia) 15,665 17,082 17,193 20,676 20,058
Sabah n.a n.a n.a n.a n.a
Sarawak 25 44 39 41 36
Jumlah (Total) 15,690 17,126 17,232 20,717 20,094
BABI (Swine)
S.Malaysia (P. M'sia) 1,363,611 1,181,978 1,259,230 1,147,780 1,114,064
Sabah 121,655 118,748 115,910 118,797 115,958
Sarawak 230,853 232,838 234,840 239,229 241,286
Jumlah (Total) 1,716,119 1,533,564 1,609,980 1,505,806 1,471,308
P : Sementara (Provisional) n.a : Tiada maklumat (Not available)
E : Anggaran (Estimate)
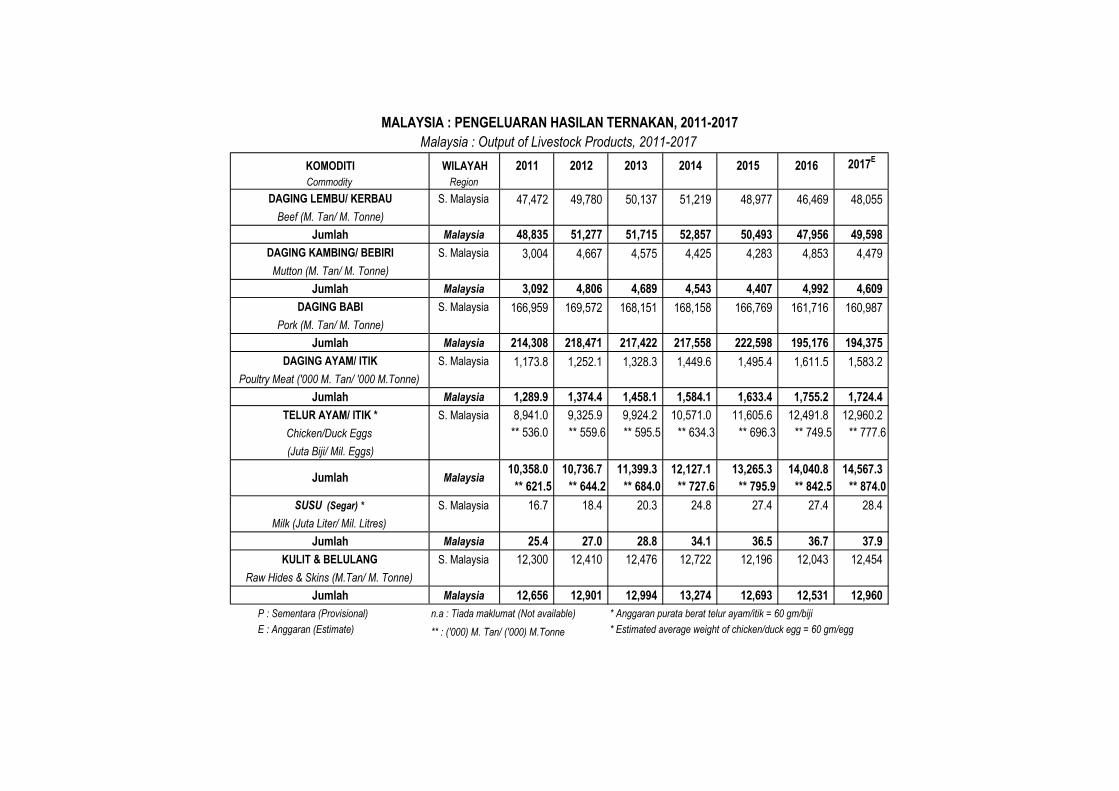
MALAYSIA : PENGELUARAN HASILAN TERNAKAN, 2011-2017
Malaysia : Output of Livestock Products, 2011-2017
KOMODITI WILAYAH 2011 2012 2013 2014 2015 2016 2017E
Commodity Region
DAGING LEMBU/ KERBAU S. Malaysia 47,472 49,780 50,137 51,219 48,977 46,469 48,055
Beef (M. Tan/ M. Tonne)
Jumlah Malaysia 48,835 51,277 51,715 52,857 50,493 47,956 49,598
DAGING KAMBING/ BEBIRI S. Malaysia 3,004 4,667 4,575 4,425 4,283 4,853 4,479
Mutton (M. Tan/ M. Tonne)
Jumlah Malaysia 3,092 4,806 4,689 4,543 4,407 4,992 4,609
DAGING BABI S. Malaysia 166,959 169,572 168,151 168,158 166,769 161,716 160,987
Pork (M. Tan/ M. Tonne)
Jumlah Malaysia 214,308 218,471 217,422 217,558 222,598 195,176 194,375
DAGING AYAM/ ITIK S. Malaysia 1,173.8 1,252.1 1,328.3 1,449.6 1,495.4 1,611.5 1,583.2
Poultry Meat ('000 M. Tan/ '000 M.Tonne)
Jumlah Malaysia 1,289.9 1,374.4 1,458.1 1,584.1 1,633.4 1,755.2 1,724.4
TELUR AYAM/ ITIK * S. Malaysia 8,941.0 9,325.9 9,924.2 10,571.0 11,605.6 12,491.8 12,960.2
Chicken/Duck Eggs ** 536.0 ** 559.6 ** 595.5 ** 634.3 ** 696.3 ** 749.5 ** 777.6
(Juta Biji/ Mil. Eggs)
10,358.0 10,736.7 11,399.3 12,127.1 13,265.3 14,040.8 14,567.3
** 621.5 ** 644.2 ** 684.0 ** 727.6 ** 795.9 ** 842.5 ** 874.0
SUSU (Segar) * S. Malaysia 16.7 18.4 20.3 24.8 27.4 27.4 28.4
Milk (Juta Liter/ Mil. Litres)
Jumlah Malaysia 25.4 27.0 28.8 34.1 36.5 36.7 37.9
KULIT & BELULANG S. Malaysia 12,300 12,410 12,476 12,722 12,196 12,043 12,454
Raw Hides & Skins (M.Tan/ M. Tonne)
Jumlah Malaysia 12,656 12,901 12,994 13,274 12,693 12,531 12,960
P : Sementara (Provisional) n.a : Tiada maklumat (Not available) * Anggaran purata berat telur ayam/itik = 60 gm/biji
E : Anggaran (Estimate) ** : ('000) M. Tan/ ('000) M.Tonne * Estimated average weight of chicken/duck egg = 60 gm/egg
MalaysiaJumlah
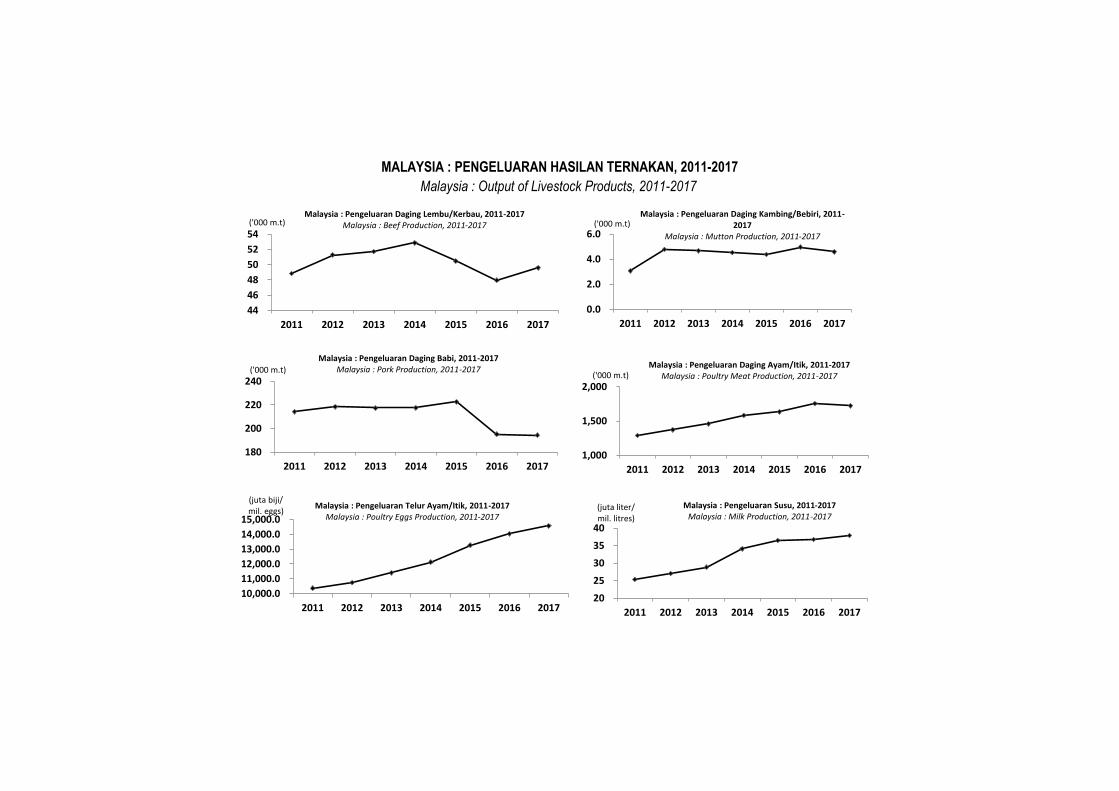
MALAYSIA : PENGELUARAN HASILAN TERNAKAN, 2011-2017
Malaysia : Output of Livestock Products, 2011-2017
150
200
250
2005 2006 2007 2008 2009 2010 2011
('000 m.t)Malaysia : Pengeluaran Daging Babi, 2005-
2014Malaysia : Pork Production, 2005-2014
-
4,000.0
8,000.0
12,000.0
2005 2006 2007 2008 2009 2010 2011
(juta biji/mil. eggs)
Malaysia : Pengeluaran Telur Ayam/Itik, 2005-2014
Malaysia : Poultry Eggs Production, 2005-2014
44
46
48
50
52
54
2011 2012 2013 2014 2015 2016 2017
('000 m.t)Malaysia : Pengeluaran Daging Lembu/Kerbau, 2011-2017
Malaysia : Beef Production, 2011-2017
180
200
220
240
2011 2012 2013 2014 2015 2016 2017
('000 m.t)
Malaysia : Pengeluaran Daging Babi, 2011-2017Malaysia : Pork Production, 2011-2017
1,000
1,500
2,000
2011 2012 2013 2014 2015 2016 2017
('000 m.t)Malaysia : Pengeluaran Daging Ayam/Itik, 2011-2017
Malaysia : Poultry Meat Production, 2011-2017
10,000.0
11,000.0
12,000.0
13,000.0
14,000.0
15,000.0
2011 2012 2013 2014 2015 2016 2017
(juta biji/mil. eggs)
Malaysia : Pengeluaran Telur Ayam/Itik, 2011-2017Malaysia : Poultry Eggs Production, 2011-2017
20
25
30
35
40
2011 2012 2013 2014 2015 2016 2017
(juta liter/mil. litres)
Malaysia : Pengeluaran Susu, 2011-2017Malaysia : Milk Production, 2011-2017
0.0
2.0
4.0
6.0
2011 2012 2013 2014 2015 2016 2017
('000 m.t)Malaysia : Pengeluaran Daging Kambing/Bebiri, 2011-
2017Malaysia : Mutton Production, 2011-2017
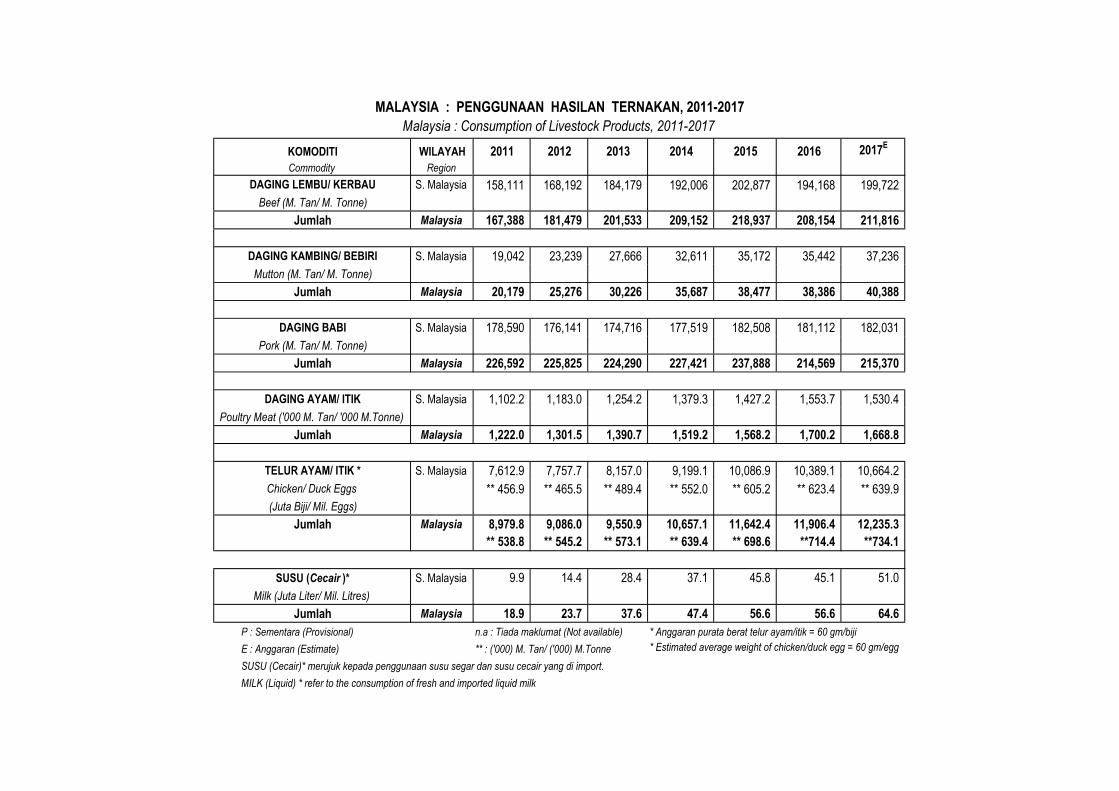
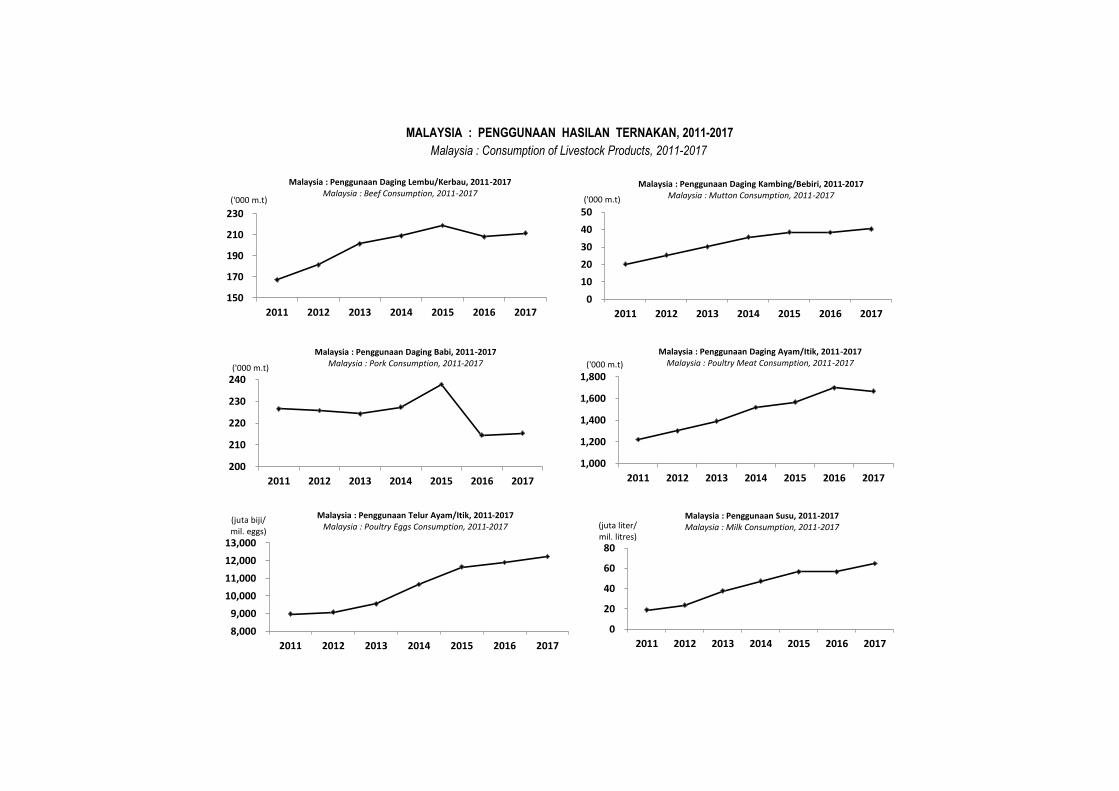
MALAYSIA : PENGGUNAAN HASILAN TERNAKAN, 2011-2017
Malaysia : Consumption of Livestock Products, 2011-2017
KOMODITI WILAYAH 2011 2012 2013 2014 2015 2016 2017E
Commodity Region
DAGING LEMBU/ KERBAU S. Malaysia 158,111 168,192 184,179 192,006 202,877 194,168 199,722
Beef (M. Tan/ M. Tonne)
Jumlah Malaysia 167,388 181,479 201,533 209,152 218,937 208,154 211,816
DAGING KAMBING/ BEBIRI S. Malaysia 19,042 23,239 27,666 32,611 35,172 35,442 37,236
Mutton (M. Tan/ M. Tonne)
Jumlah Malaysia 20,179 25,276 30,226 35,687 38,477 38,386 40,388
DAGING BABI S. Malaysia 178,590 176,141 174,716 177,519 182,508 181,112 182,031
Pork (M. Tan/ M. Tonne)
Jumlah Malaysia 226,592 225,825 224,290 227,421 237,888 214,569 215,370
DAGING AYAM/ ITIK S. Malaysia 1,102.2 1,183.0 1,254.2 1,379.3 1,427.2 1,553.7 1,530.4
Poultry Meat ('000 M. Tan/ '000 M.Tonne)
Jumlah Malaysia 1,222.0 1,301.5 1,390.7 1,519.2 1,568.2 1,700.2 1,668.8
TELUR AYAM/ ITIK * S. Malaysia 7,612.9 7,757.7 8,157.0 9,199.1 10,086.9 10,389.1 10,664.2
Chicken/ Duck Eggs ** 456.9 ** 465.5 ** 489.4 ** 552.0 ** 605.2 ** 623.4 ** 639.9
(Juta Biji/ Mil. Eggs)
Jumlah Malaysia 8,979.8 9,086.0 9,550.9 10,657.1 11,642.4 11,906.4 12,235.3
** 538.8 ** 545.2 ** 573.1 ** 639.4 ** 698.6 **714.4 **734.1
SUSU (Cecair )* S. Malaysia 9.9 14.4 28.4 37.1 45.8 45.1 51.0
Milk (Juta Liter/ Mil. Litres)
Jumlah Malaysia 18.9 23.7 37.6 47.4 56.6 56.6 64.6
P : Sementara (Provisional) n.a : Tiada maklumat (Not available) * Anggaran purata berat telur ayam/itik = 60 gm/biji
E : Anggaran (Estimate) ** : ('000) M. Tan/ ('000) M.Tonne * Estimated average weight of chicken/duck egg = 60 gm/egg
SUSU (Cecair)* merujuk kepada penggunaan susu segar dan susu cecair yang di import.
MILK (Liquid) * refer to the consumption of fresh and imported liquid milk
MALAYSIA : PENGGUNAAN HASILAN TERNAKAN, 2011-2017
Malaysia : Consumption of Livestock Products, 2011-2017
150
170
190
210
230
2011 2012 2013 2014 2015 2016 2017
('000 m.t)
Malaysia : Penggunaan Daging Lembu/Kerbau, 2011-2017Malaysia : Beef Consumption, 2011-2017
0
10
20
30
40
50
2011 2012 2013 2014 2015 2016 2017
('000 m.t)
Malaysia : Penggunaan Daging Kambing/Bebiri, 2011-2017Malaysia : Mutton Consumption, 2011-2017
200
210
220
230
240
2011 2012 2013 2014 2015 2016 2017
('000 m.t)
Malaysia : Penggunaan Daging Babi, 2011-2017Malaysia : Pork Consumption, 2011-2017
1,000
1,200
1,400
1,600
1,800
2011 2012 2013 2014 2015 2016 2017
('000 m.t)
Malaysia : Penggunaan Daging Ayam/Itik, 2011-2017Malaysia : Poultry Meat Consumption, 2011-2017
8,000
9,000
10,000
11,000
12,000
13,000
2011 2012 2013 2014 2015 2016 2017
(juta biji/mil. eggs)
Malaysia : Penggunaan Telur Ayam/Itik, 2011-2017Malaysia : Poultry Eggs Consumption, 2011-2017
0
20
40
60
80
2011 2012 2013 2014 2015 2016 2017
(juta liter/mil. litres)
Malaysia : Penggunaan Susu, 2011-2017Malaysia : Milk Consumption, 2011-2017
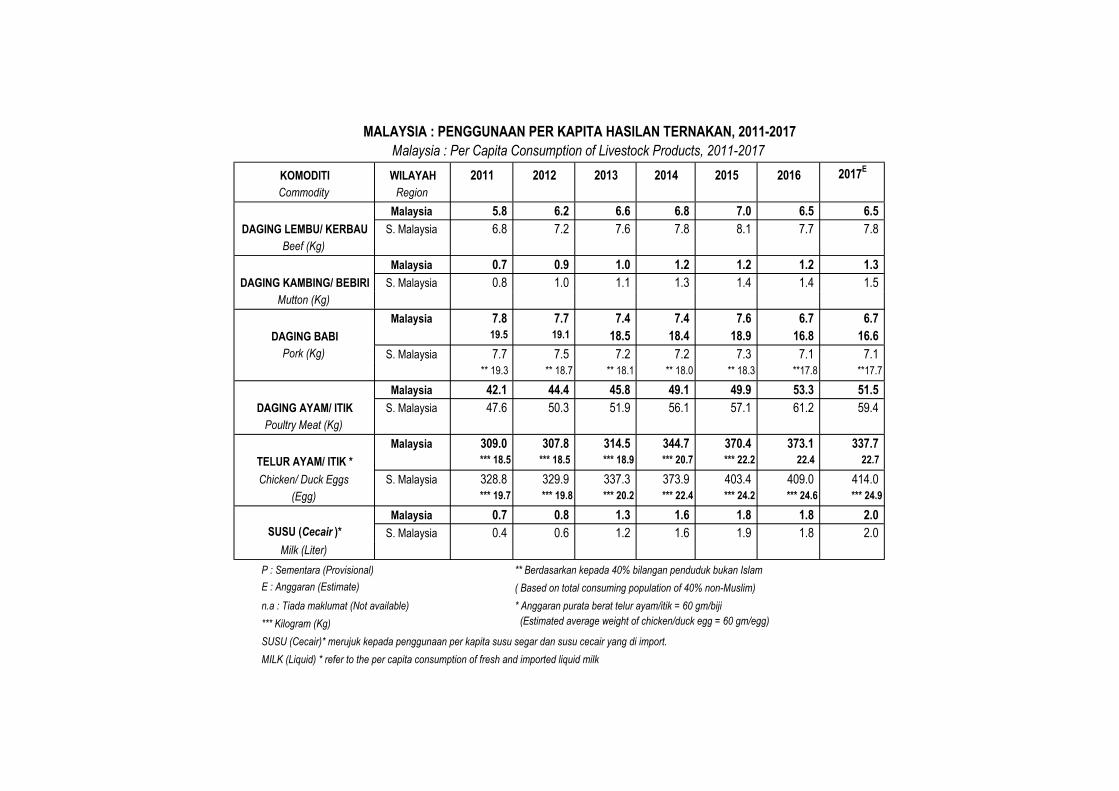
MALAYSIA : PENGGUNAAN PER KAPITA HASILAN TERNAKAN, 2011-2017
Malaysia : Per Capita Consumption of Livestock Products, 2011-2017
KOMODITI WILAYAH 2011 2012 2013 2014 2015 2016 2017E
Commodity Region
Malaysia 5.8 6.2 6.6 6.8 7.0 6.5 6.5
DAGING LEMBU/ KERBAU S. Malaysia 6.8 7.2 7.6 7.8 8.1 7.7 7.8
Beef (Kg)
Malaysia 0.7 0.9 1.0 1.2 1.2 1.2 1.3
DAGING KAMBING/ BEBIRI S. Malaysia 0.8 1.0 1.1 1.3 1.4 1.4 1.5
Mutton (Kg)
Malaysia 7.8 7.7 7.4 7.4 7.6 6.7 6.7
DAGING BABI 19.5 19.1 18.5 18.4 18.9 16.8 16.6
Pork (Kg) S. Malaysia 7.7 7.5 7.2 7.2 7.3 7.1 7.1
** 19.3 ** 18.7 ** 18.1 ** 18.0 ** 18.3 **17.8 **17.7
Malaysia 42.1 44.4 45.8 49.1 49.9 53.3 51.5
DAGING AYAM/ ITIK S. Malaysia 47.6 50.3 51.9 56.1 57.1 61.2 59.4
Poultry Meat (Kg)
Malaysia 309.0 307.8 314.5 344.7 370.4 373.1 337.7
TELUR AYAM/ ITIK * *** 18.5 *** 18.5 *** 18.9 *** 20.7 *** 22.2 22.4 22.7
Chicken/ Duck Eggs S. Malaysia 328.8 329.9 337.3 373.9 403.4 409.0 414.0
(Egg) *** 19.7 *** 19.8 *** 20.2 *** 22.4 *** 24.2 *** 24.6 *** 24.9
Malaysia 0.7 0.8 1.3 1.6 1.8 1.8 2.0
SUSU (Cecair )* S. Malaysia 0.4 0.6 1.2 1.6 1.9 1.8 2.0
Milk (Liter)
P : Sementara (Provisional) ** Berdasarkan kepada 40% bilangan penduduk bukan Islam
E : Anggaran (Estimate) ( Based on total consuming population of 40% non-Muslim)
n.a : Tiada maklumat (Not available) * Anggaran purata berat telur ayam/itik = 60 gm/biji
*** Kilogram (Kg) (Estimated average weight of chicken/duck egg = 60 gm/egg)
SUSU (Cecair)* merujuk kepada penggunaan per kapita susu segar dan susu cecair yang di import.
MILK (Liquid) * refer to the per capita consumption of fresh and imported liquid milk
MALAYSIA : PENGGUNAAN PER KAPITA HASILAN TERNAKAN, 2011-2017
Malaysia : Per Capita Consumption of Livestock Products, 2011-2017
0
5
10
2004 2005 2006 2007 2008 2009 2010
(kg)
Malaysia : Penggunaan Per kapita Dg. Lembu/Kerbau, 2004-2013
Malaysia : Per capita Consumption of Beef, 2004-2013
6
7
8
2004 2005 2006 2007 2008 2009 2010
(kg)
Malaysia : Penggunaan Per kapita Dg. Babi, 2004-2013
Malaysia : Per capita Consumption of Pork, 2004-2013
0
200
400
2004 2005 2006 2007 2008 2009 2010
(biji/eggs)
Malaysia : Penggunaan Per kapita Telur Ayam/Itik, 2004-2013
Malaysia : Per capita Consumption of Poultry Eggs, 2004-2013
5
6
7
8
2011 2012 2013 2014 2015 2016 2017
(kg)
Malaysia : Penggunaan Per kapita Dg. Lembu/Kerbau, 2011-2017
Malaysia : Per capita Consumption of Beef, 2011-2017
0.0
0.5
1.0
1.5
2011 2012 2013 2014 2015 2016 2017
(kg)
Malaysia : Penggunaan Per kapita Dg. Kambing/Bebiri, 2011-2017
Malaysia : Per capita Consumption of Mutton, 2011-2017
6
7
8
2011 2012 2013 2014 2015 2016 2017
(kg)
Malaysia : Penggunaan Per kapita Dg. Babi, 2011-2017Malaysia : Per capita Consumption of Pork, 2011-2017
40
45
50
55
2011 2012 2013 2014 2015 2016 2017
(kg)
Malaysia : Penggunaan Per kapita Dg. Ayam/Itik, 2011-2017Malaysia : Per capita Consumption of Poultry Meat, 2011-2017
250
300
350
400
2011 2012 2013 2014 2015 2016 2017
(biji/eggs)Malaysia : Penggunaan Per kapita Telur Ayam/Itik,
2011-2017Malaysia : Per capita Consumption of Poultry Eggs,
2011-2017
1
2
3
4
2011 2012 2013 2014 2015 2016 2017
(liter)
Malaysia : Penggunaan Per kapita Susu, 2011-2017Malaysia : Per capita Consumption of Milk, 2011-2017
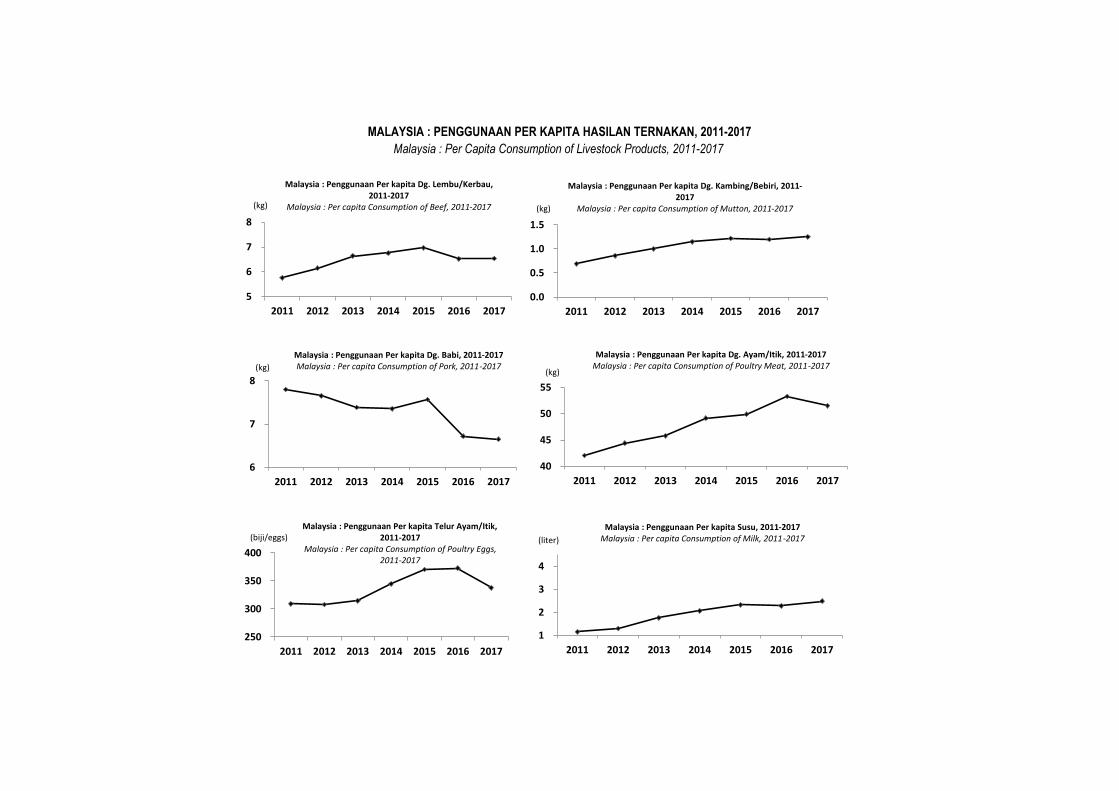
MALAYSIA : KADAR SARADIRI HASILAN TERNAKAN (%), 2011-2017
Malaysia : Self-Sufficiency In Livestock Products (%), 2011-2017
KOMODITI WILAYAH 2011 2012 2013 2014 2015 2016 2017E
Commodity Region
DAGING LEMBU/ KERBAU Malaysia 29.17 28.26 25.66 25.29 23.06 23.04 23.42
Beef S. Malaysia 30.02 29.60 27.22 26.68 24.14 23.93 24.06
DAGING KAMBING/ BEBIRI Malaysia 15.32 19.01 15.51 12.73 11.45 13.00 11.41
Mutton S. Malaysia 15.77 20.08 16.54 13.57 12.18 13.69 12.03
DAGING BABI Malaysia 94.58 96.74 96.94 95.66 93.57 90.96 90.25
Pork S. Malaysia 93.49 96.27 96.24 94.73 91.38 89.29 88.44
DAGING AYAM/ ITIK Malaysia 105.55 104.88 104.85 104.27 104.16 103.24 103.33
Poultry Meat S. Malaysia 106.50 105.84 105.91 105.09 104.78 103.72 103.45
TELUR AYAM/ ITIK Malaysia 115.35 118.17 119.35 113.79 113.99 117.93 119.06
Chicken/ Duck Eggs S. Malaysia 117.45 120.21 121.67 114.91 115.06 120.24 121.53
SUSU (Cecair )* Malaysia 134.09 114.14 76.60 71.96 64.40 64.86 58.67
Milk S. Malaysia 167.98 127.98 71.55 66.79 59.87 60.91 59.19
P : Sementara (Provisional) n.a : Tiada maklumat (Not available)
E : Anggaran (Estimate)
SUSU (Cecair)* merujuk kepada kadar saradiri susu segar dan susu cecair yang di import.
MILK (Liquid) * refer to the self-sufficiency of fresh and imported liquid milk
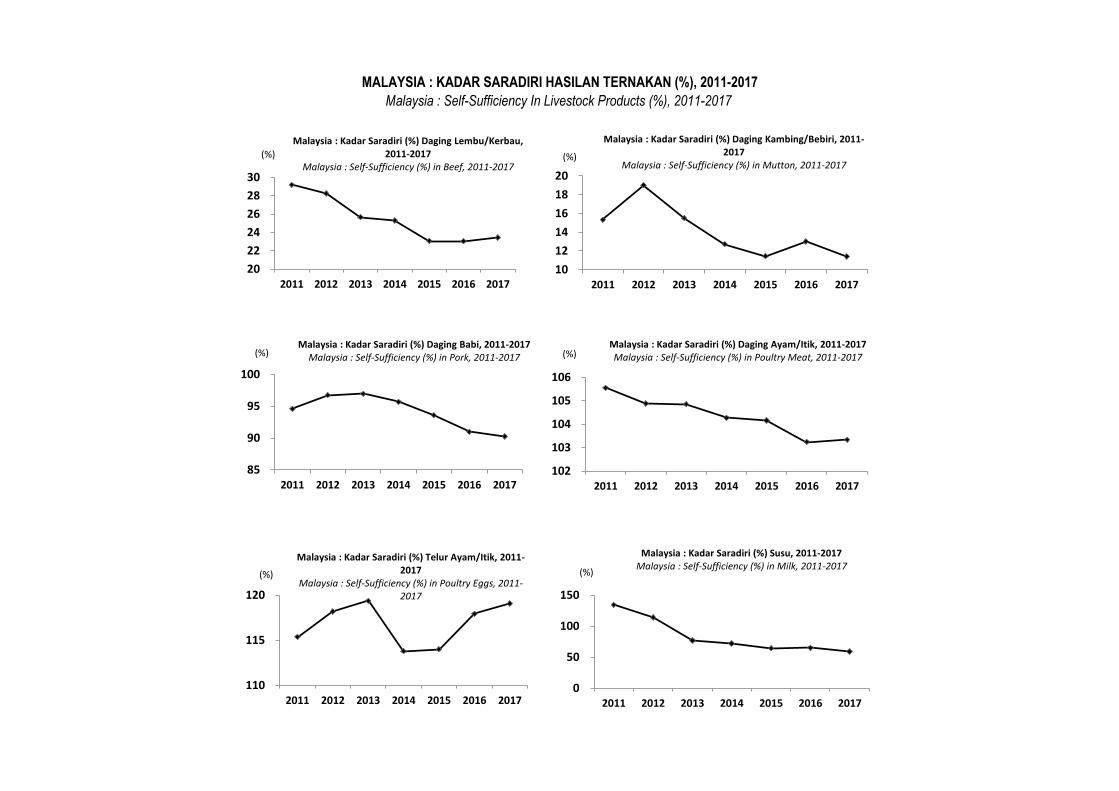
MALAYSIA : KADAR SARADIRI HASILAN TERNAKAN (%), 2011-2017
Malaysia : Self-Sufficiency In Livestock Products (%), 2011-2017
20
22
24
26
28
30
2011 2012 2013 2014 2015 2016 2017
(%)
Malaysia : Kadar Saradiri (%) Daging Lembu/Kerbau, 2011-2017
Malaysia : Self-Sufficiency (%) in Beef, 2011-2017
10
12
14
16
18
20
2011 2012 2013 2014 2015 2016 2017
(%)
Malaysia : Kadar Saradiri (%) Daging Kambing/Bebiri, 2011-2017
Malaysia : Self-Sufficiency (%) in Mutton, 2011-2017
85
90
95
100
2011 2012 2013 2014 2015 2016 2017
(%)Malaysia : Kadar Saradiri (%) Daging Babi, 2011-2017
Malaysia : Self-Sufficiency (%) in Pork, 2011-2017
102
103
104
105
106
2011 2012 2013 2014 2015 2016 2017
(%)Malaysia : Kadar Saradiri (%) Daging Ayam/Itik, 2011-2017Malaysia : Self-Sufficiency (%) in Poultry Meat, 2011-2017
110
115
120
2011 2012 2013 2014 2015 2016 2017
(%)
Malaysia : Kadar Saradiri (%) Telur Ayam/Itik, 2011-2017
Malaysia : Self-Sufficiency (%) in Poultry Eggs, 2011-2017
0
50
100
150
2011 2012 2013 2014 2015 2016 2017
(%)
Malaysia : Kadar Saradiri (%) Susu, 2011-2017Malaysia : Self-Sufficiency (%) in Milk, 2011-2017
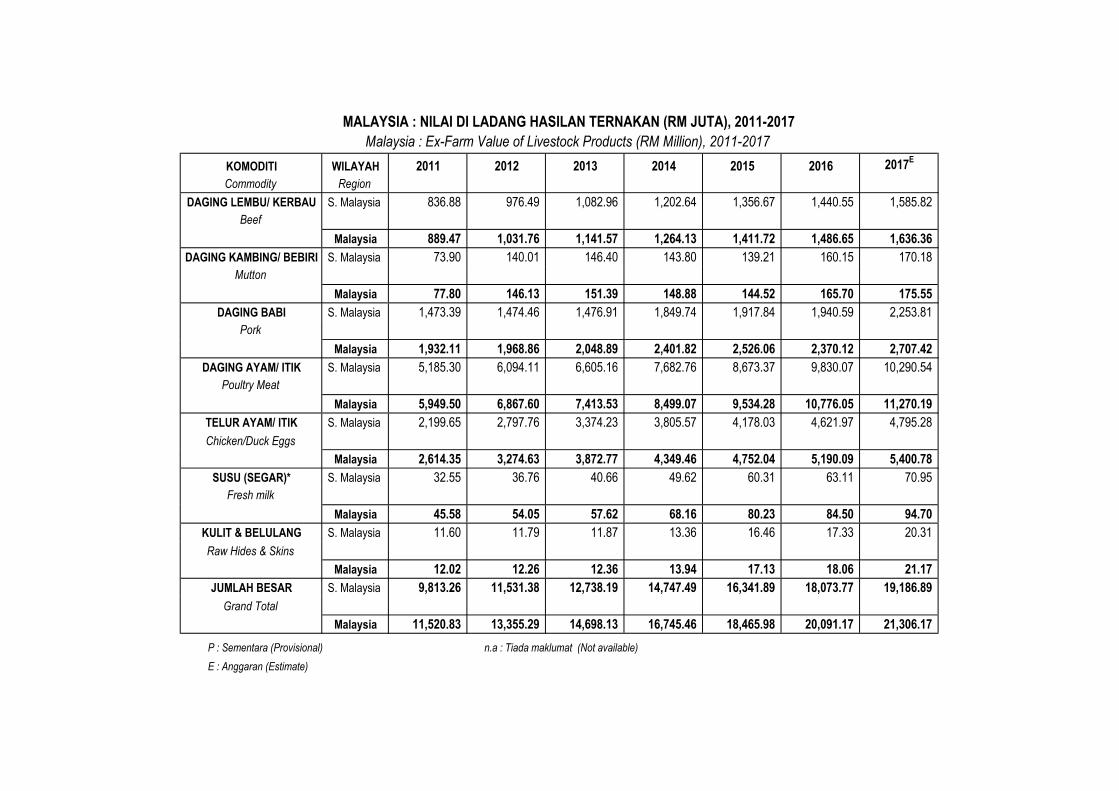
MALAYSIA : NILAI DI LADANG HASILAN TERNAKAN (RM JUTA), 2011-2017
Malaysia : Ex-Farm Value of Livestock Products (RM Million), 2011-2017
KOMODITI WILAYAH 2011 2012 2013 2014 2015 2016 2017E
Commodity Region
DAGING LEMBU/ KERBAU S. Malaysia 836.88 976.49 1,082.96 1,202.64 1,356.67 1,440.55 1,585.82
Beef
Malaysia 889.47 1,031.76 1,141.57 1,264.13 1,411.72 1,486.65 1,636.36
DAGING KAMBING/ BEBIRI S. Malaysia 73.90 140.01 146.40 143.80 139.21 160.15 170.18
Mutton
Malaysia 77.80 146.13 151.39 148.88 144.52 165.70 175.55
DAGING BABI S. Malaysia 1,473.39 1,474.46 1,476.91 1,849.74 1,917.84 1,940.59 2,253.81
Pork
Malaysia 1,932.11 1,968.86 2,048.89 2,401.82 2,526.06 2,370.12 2,707.42
DAGING AYAM/ ITIK S. Malaysia 5,185.30 6,094.11 6,605.16 7,682.76 8,673.37 9,830.07 10,290.54
Poultry Meat
Malaysia 5,949.50 6,867.60 7,413.53 8,499.07 9,534.28 10,776.05 11,270.19
TELUR AYAM/ ITIK S. Malaysia 2,199.65 2,797.76 3,374.23 3,805.57 4,178.03 4,621.97 4,795.28
Chicken/Duck Eggs
Malaysia 2,614.35 3,274.63 3,872.77 4,349.46 4,752.04 5,190.09 5,400.78
SUSU (SEGAR)* S. Malaysia 32.55 36.76 40.66 49.62 60.31 63.11 70.95
Fresh milk
Malaysia 45.58 54.05 57.62 68.16 80.23 84.50 94.70
KULIT & BELULANG S. Malaysia 11.60 11.79 11.87 13.36 16.46 17.33 20.31
Raw Hides & Skins
Malaysia 12.02 12.26 12.36 13.94 17.13 18.06 21.17
JUMLAH BESAR S. Malaysia 9,813.26 11,531.38 12,738.19 14,747.49 16,341.89 18,073.77 19,186.89
Grand Total
Malaysia 11,520.83 13,355.29 14,698.13 16,745.46 18,465.98 20,091.17 21,306.17
P : Sementara (Provisional) n.a : Tiada maklumat (Not available)
E : Anggaran (Estimate)
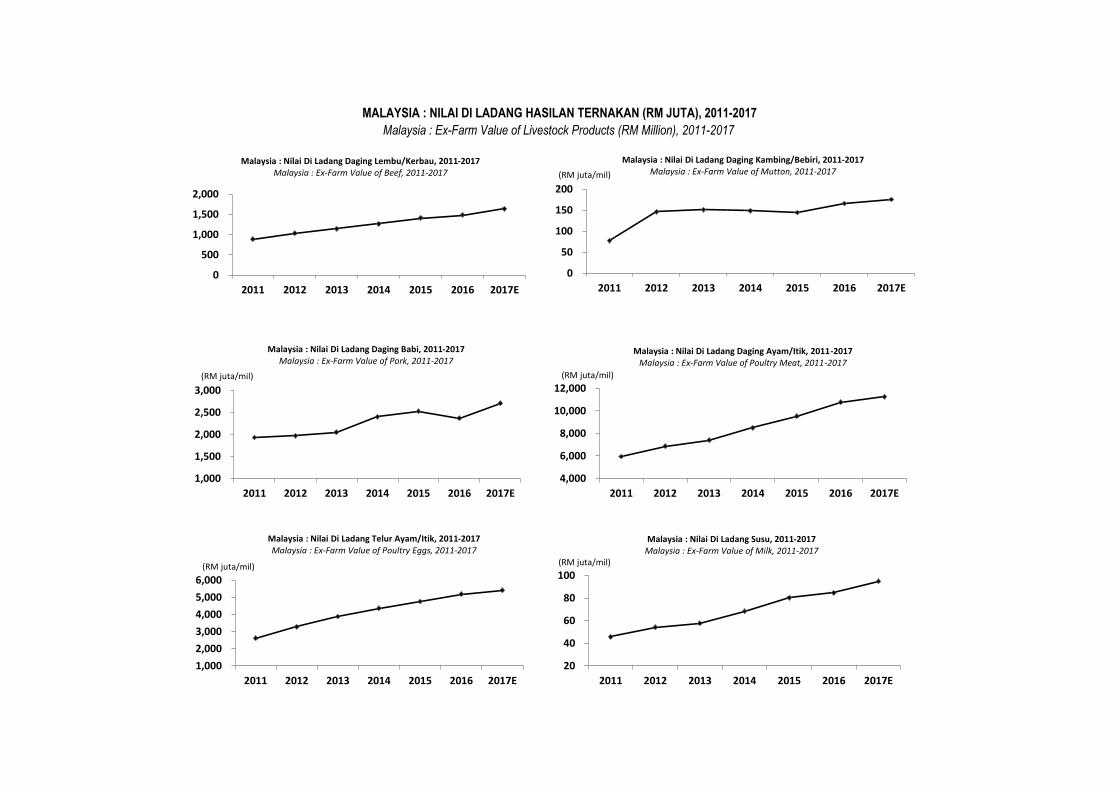
MALAYSIA : NILAI DI LADANG HASILAN TERNAKAN (RM JUTA), 2011-2017
Malaysia : Ex-Farm Value of Livestock Products (RM Million), 2011-2017
0
500
1,000
1,500
2,000
2011 2012 2013 2014 2015 2016 2017E
Malaysia : Nilai Di Ladang Daging Lembu/Kerbau, 2011-2017Malaysia : Ex-Farm Value of Beef, 2011-2017
0
50
100
150
200
2011 2012 2013 2014 2015 2016 2017E
(RM juta/mil)
Malaysia : Nilai Di Ladang Daging Kambing/Bebiri, 2011-2017Malaysia : Ex-Farm Value of Mutton, 2011-2017
1,000
1,500
2,000
2,500
3,000
2011 2012 2013 2014 2015 2016 2017E
(RM juta/mil)
Malaysia : Nilai Di Ladang Daging Babi, 2011-2017Malaysia : Ex-Farm Value of Pork, 2011-2017
4,000
6,000
8,000
10,000
12,000
2011 2012 2013 2014 2015 2016 2017E
(RM juta/mil)
Malaysia : Nilai Di Ladang Daging Ayam/Itik, 2011-2017Malaysia : Ex-Farm Value of Poultry Meat, 2011-2017
1,000
2,000
3,000
4,000
5,000
6,000
2011 2012 2013 2014 2015 2016 2017E
(RM juta/mil)
Malaysia : Nilai Di Ladang Telur Ayam/Itik, 2011-2017Malaysia : Ex-Farm Value of Poultry Eggs, 2011-2017
20
40
60
80
100
2011 2012 2013 2014 2015 2016 2017E
(RM juta/mil)
Malaysia : Nilai Di Ladang Susu, 2011-2017Malaysia : Ex-Farm Value of Milk, 2011-2017