wilayah kerbau lembu kambing bebiri babi …...negeri kerbau lembu kambing bebiri babi ayam itik...
TRANSCRIPT
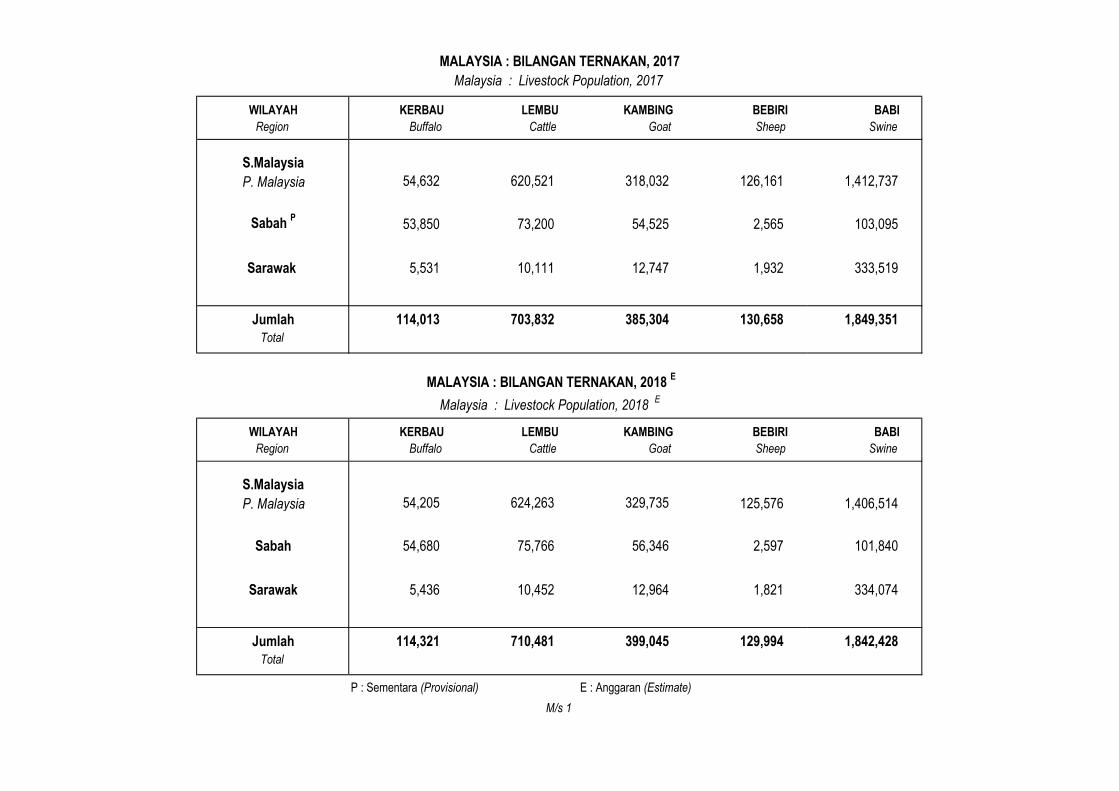
MALAYSIA : BILANGAN TERNAKAN, 2017
Malaysia : Livestock Population, 2017
WILAYAH KERBAU LEMBU KAMBING BEBIRI BABI
Region Buffalo Cattle Goat Sheep Swine
S.Malaysia
P. Malaysia 54,632 620,521 318,032 126,161 1,412,737
Sabah P
53,850 73,200 54,525 2,565 103,095
Sarawak 5,531 10,111 12,747 1,932 333,519
Jumlah 114,013 703,832 385,304 130,658 1,849,351
Total
MALAYSIA : BILANGAN TERNAKAN, 2018 E
Malaysia : Livestock Population, 2018 E
WILAYAH KERBAU LEMBU KAMBING BEBIRI BABI
Region Buffalo Cattle Goat Sheep Swine
S.Malaysia
P. Malaysia 54,205 624,263 329,735 125,576 1,406,514
Sabah 54,680 75,766 56,346 2,597 101,840
Sarawak 5,436 10,452 12,964 1,821 334,074
Jumlah 114,321 710,481 399,045 129,994 1,842,428
Total
P : Sementara (Provisional) E : Anggaran (Estimate)
M/s 1
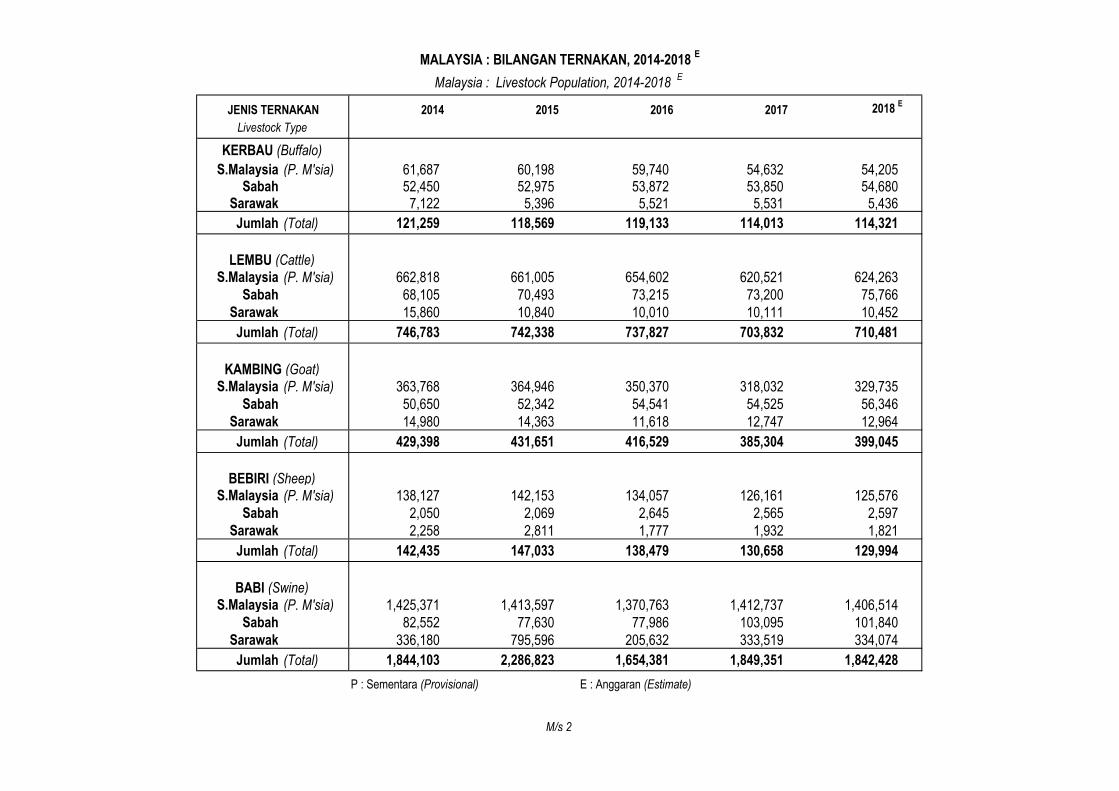
MALAYSIA : BILANGAN TERNAKAN, 2014-2018 E
Malaysia : Livestock Population, 2014-2018 E
JENIS TERNAKAN 2014 2015 2016 2017 2018 E
Livestock Type
KERBAU (Buffalo)
S.Malaysia (P. M'sia) 61,687 60,198 59,740 54,632 54,205Sabah 52,450 52,975 53,872 53,850 54,680
Sarawak 7,122 5,396 5,521 5,531 5,436
Jumlah (Total) 121,259 118,569 119,133 114,013 114,321
LEMBU (Cattle)S.Malaysia (P. M'sia) 662,818 661,005 654,602 620,521 624,263
Sabah 68,105 70,493 73,215 73,200 75,766
Sarawak 15,860 10,840 10,010 10,111 10,452
Jumlah (Total) 746,783 742,338 737,827 703,832 710,481
KAMBING (Goat)S.Malaysia (P. M'sia) 363,768 364,946 350,370 318,032 329,735
Sabah 50,650 52,342 54,541 54,525 56,346
Sarawak 14,980 14,363 11,618 12,747 12,964
Jumlah (Total) 429,398 431,651 416,529 385,304 399,045
BEBIRI (Sheep)S.Malaysia (P. M'sia) 138,127 142,153 134,057 126,161 125,576
Sabah 2,050 2,069 2,645 2,565 2,597
Sarawak 2,258 2,811 1,777 1,932 1,821
Jumlah (Total) 142,435 147,033 138,479 130,658 129,994
BABI (Swine)S.Malaysia (P. M'sia) 1,425,371 1,413,597 1,370,763 1,412,737 1,406,514
Sabah 82,552 77,630 77,986 103,095 101,840
Sarawak 336,180 795,596 205,632 333,519 334,074
Jumlah (Total) 1,844,103 2,286,823 1,654,381 1,849,351 1,842,428
P : Sementara (Provisional) E : Anggaran (Estimate)
M/s 2
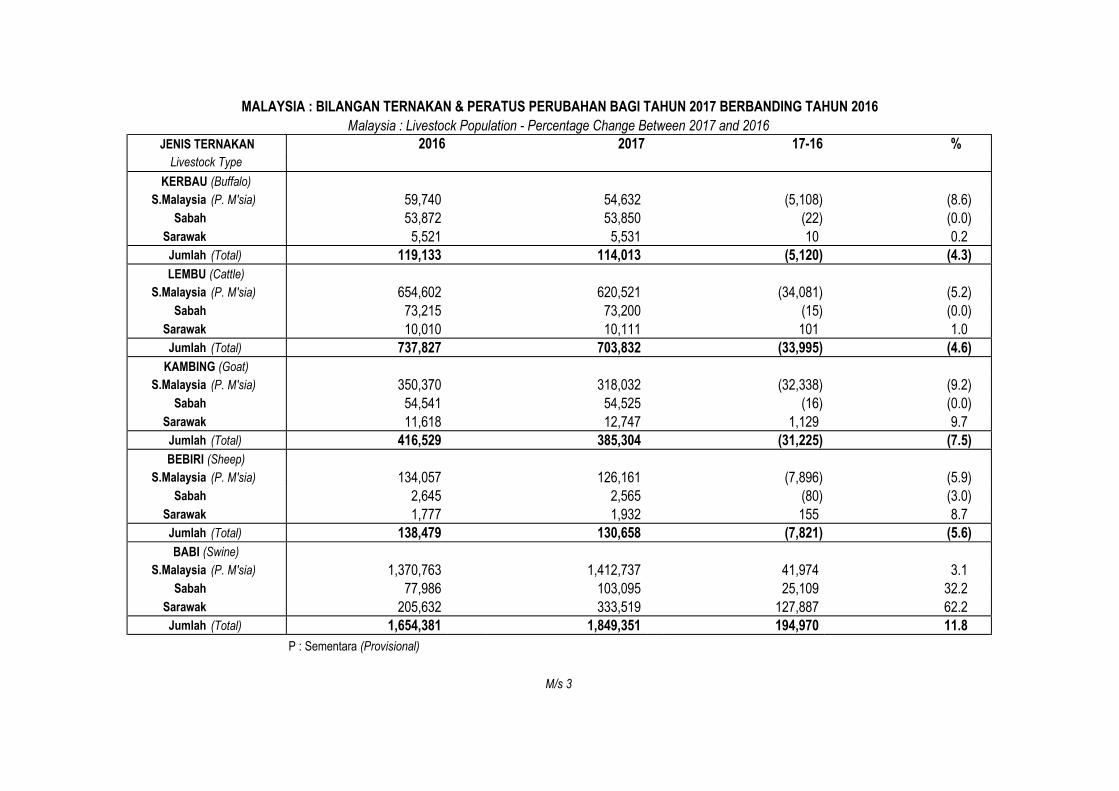
MALAYSIA : BILANGAN TERNAKAN & PERATUS PERUBAHAN BAGI TAHUN 2017 BERBANDING TAHUN 2016
Malaysia : Livestock Population - Percentage Change Between 2017 and 2016
JENIS TERNAKAN 2016 2017 17-16 %
Livestock Type
KERBAU (Buffalo)
S.Malaysia (P. M'sia) 59,740 54,632 (5,108) (8.6)
Sabah 53,872 53,850 (22) (0.0)
Sarawak 5,521 5,531 10 0.2
Jumlah (Total) 119,133 114,013 (5,120) (4.3)
LEMBU (Cattle)
S.Malaysia (P. M'sia) 654,602 620,521 (34,081) (5.2)
Sabah 73,215 73,200 (15) (0.0)
Sarawak 10,010 10,111 101 1.0
Jumlah (Total) 737,827 703,832 (33,995) (4.6)
KAMBING (Goat)
S.Malaysia (P. M'sia) 350,370 318,032 (32,338) (9.2)
Sabah 54,541 54,525 (16) (0.0)
Sarawak 11,618 12,747 1,129 9.7
Jumlah (Total) 416,529 385,304 (31,225) (7.5)
BEBIRI (Sheep)
S.Malaysia (P. M'sia) 134,057 126,161 (7,896) (5.9)
Sabah 2,645 2,565 (80) (3.0)
Sarawak 1,777 1,932 155 8.7
Jumlah (Total) 138,479 130,658 (7,821) (5.6)
BABI (Swine)
S.Malaysia (P. M'sia) 1,370,763 1,412,737 41,974 3.1
Sabah 77,986 103,095 25,109 32.2
Sarawak 205,632 333,519 127,887 62.2
Jumlah (Total) 1,654,381 1,849,351 194,970 11.8
P : Sementara (Provisional)
M/s 3
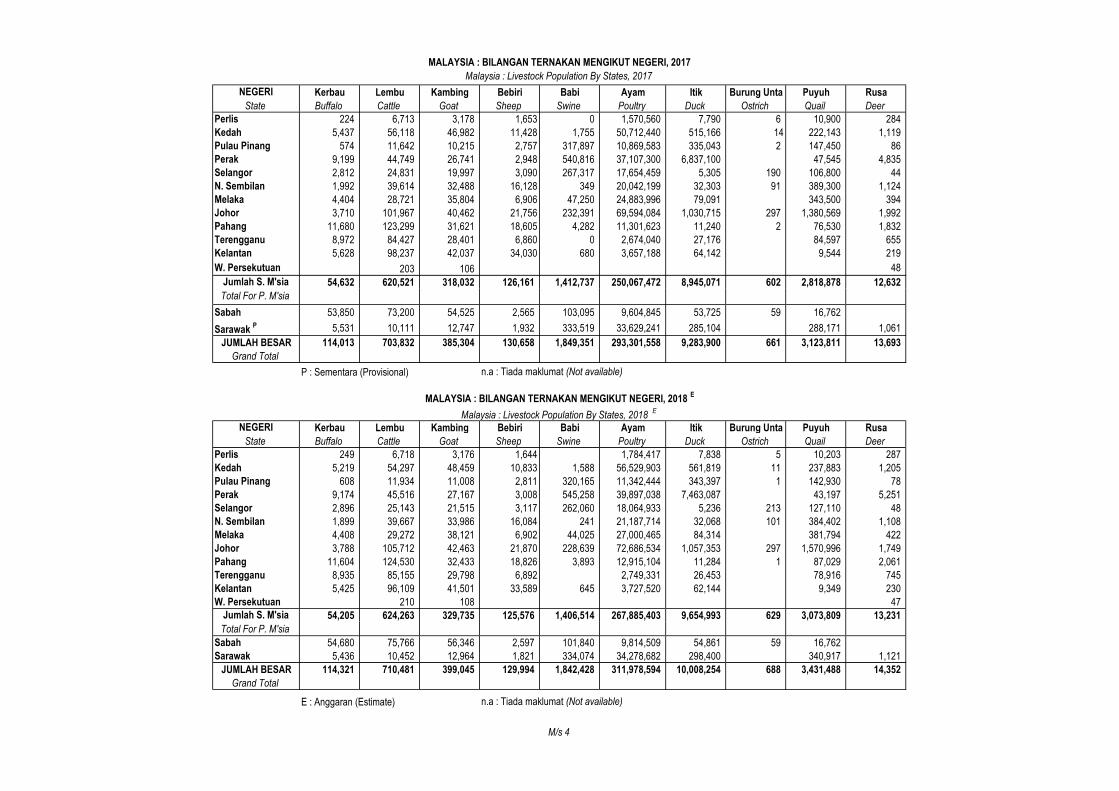
MALAYSIA : BILANGAN TERNAKAN MENGIKUT NEGERI, 2017
Malaysia : Livestock Population By States, 2017
NEGERI Kerbau Lembu Kambing Bebiri Babi Ayam Itik Burung Unta Puyuh Rusa
State Buffalo Cattle Goat Sheep Swine Poultry Duck Ostrich Quail Deer
Perlis 224 6,713 3,178 1,653 0 1,570,560 7,790 6 10,900 284
Kedah 5,437 56,118 46,982 11,428 1,755 50,712,440 515,166 14 222,143 1,119
Pulau Pinang 574 11,642 10,215 2,757 317,897 10,869,583 335,043 2 147,450 86
Perak 9,199 44,749 26,741 2,948 540,816 37,107,300 6,837,100 47,545 4,835
Selangor 2,812 24,831 19,997 3,090 267,317 17,654,459 5,305 190 106,800 44
N. Sembilan 1,992 39,614 32,488 16,128 349 20,042,199 32,303 91 389,300 1,124
Melaka 4,404 28,721 35,804 6,906 47,250 24,883,996 79,091 343,500 394
Johor 3,710 101,967 40,462 21,756 232,391 69,594,084 1,030,715 297 1,380,569 1,992
Pahang 11,680 123,299 31,621 18,605 4,282 11,301,623 11,240 2 76,530 1,832
Terengganu 8,972 84,427 28,401 6,860 0 2,674,040 27,176 84,597 655
Kelantan 5,628 98,237 42,037 34,030 680 3,657,188 64,142 9,544 219
W. Persekutuan 203 106 48
Jumlah S. M'sia 54,632 620,521 318,032 126,161 1,412,737 250,067,472 8,945,071 602 2,818,878 12,632
Total For P. M'sia
Sabah 53,850 73,200 54,525 2,565 103,095 9,604,845 53,725 59 16,762
Sarawak P 5,531 10,111 12,747 1,932 333,519 33,629,241 285,104 288,171 1,061
JUMLAH BESAR 114,013 703,832 385,304 130,658 1,849,351 293,301,558 9,283,900 661 3,123,811 13,693
Grand Total
P : Sementara (Provisional) n.a : Tiada maklumat (Not available)
MALAYSIA : BILANGAN TERNAKAN MENGIKUT NEGERI, 2018 E
Malaysia : Livestock Population By States, 2018 E
NEGERI Kerbau Lembu Kambing Bebiri Babi Ayam Itik Burung Unta Puyuh Rusa
State Buffalo Cattle Goat Sheep Swine Poultry Duck Ostrich Quail Deer
Perlis 249 6,718 3,176 1,644 1,784,417 7,838 5 10,203 287
Kedah 5,219 54,297 48,459 10,833 1,588 56,529,903 561,819 11 237,883 1,205
Pulau Pinang 608 11,934 11,008 2,811 320,165 11,342,444 343,397 1 142,930 78
Perak 9,174 45,516 27,167 3,008 545,258 39,897,038 7,463,087 43,197 5,251
Selangor 2,896 25,143 21,515 3,117 262,060 18,064,933 5,236 213 127,110 48
N. Sembilan 1,899 39,667 33,986 16,084 241 21,187,714 32,068 101 384,402 1,108
Melaka 4,408 29,272 38,121 6,902 44,025 27,000,465 84,314 381,794 422
Johor 3,788 105,712 42,463 21,870 228,639 72,686,534 1,057,353 297 1,570,996 1,749
Pahang 11,604 124,530 32,433 18,826 3,893 12,915,104 11,284 1 87,029 2,061
Terengganu 8,935 85,155 29,798 6,892 2,749,331 26,453 78,916 745
Kelantan 5,425 96,109 41,501 33,589 645 3,727,520 62,144 9,349 230
W. Persekutuan 210 108 47
Jumlah S. M'sia 54,205 624,263 329,735 125,576 1,406,514 267,885,403 9,654,993 629 3,073,809 13,231
Total For P. M'sia
Sabah 54,680 75,766 56,346 2,597 101,840 9,814,509 54,861 59 16,762
Sarawak 5,436 10,452 12,964 1,821 334,074 34,278,682 298,400 340,917 1,121
JUMLAH BESAR 114,321 710,481 399,045 129,994 1,842,428 311,978,594 10,008,254 688 3,431,488 14,352
Grand Total
E : Anggaran (Estimate) n.a : Tiada maklumat (Not available)
M/s 4
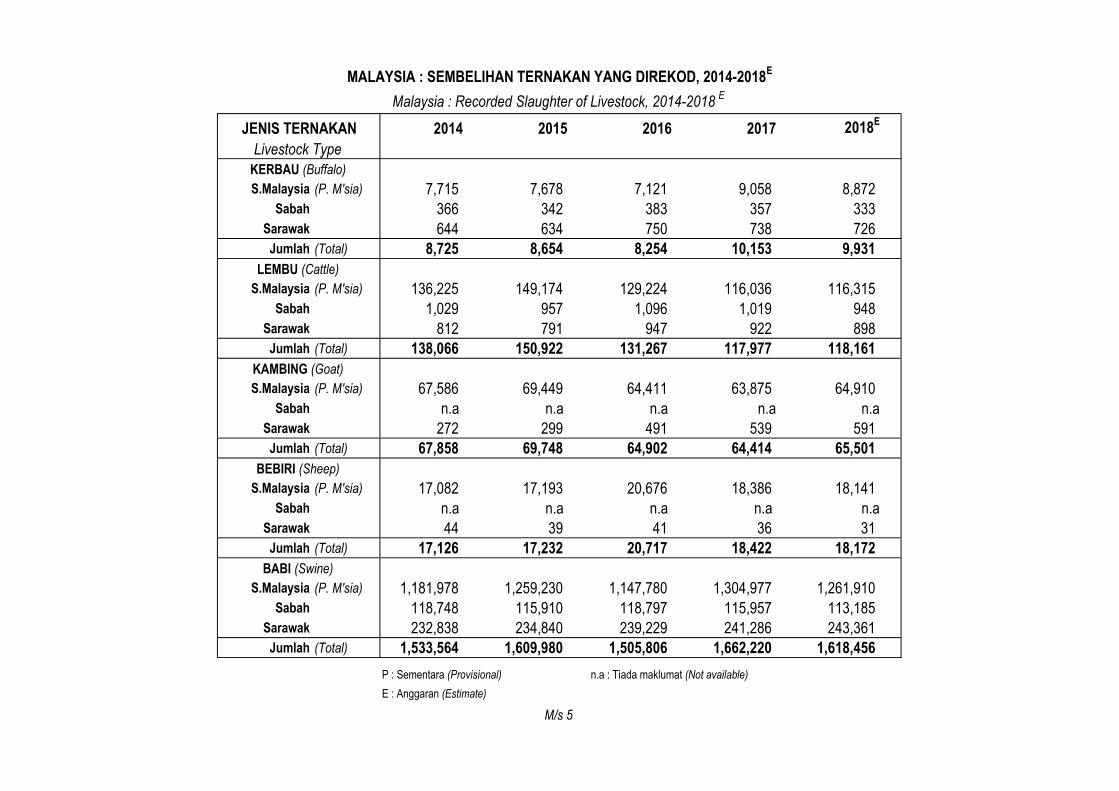
MALAYSIA : SEMBELIHAN TERNAKAN YANG DIREKOD, 2014-2018E
Malaysia : Recorded Slaughter of Livestock, 2014-2018E
JENIS TERNAKAN 2014 2015 2016 2017 2018E
Livestock Type
KERBAU (Buffalo)
S.Malaysia (P. M'sia) 7,715 7,678 7,121 9,058 8,872
Sabah 366 342 383 357 333
Sarawak 644 634 750 738 726
Jumlah (Total) 8,725 8,654 8,254 10,153 9,931
LEMBU (Cattle)
S.Malaysia (P. M'sia) 136,225 149,174 129,224 116,036 116,315
Sabah 1,029 957 1,096 1,019 948
Sarawak 812 791 947 922 898
Jumlah (Total) 138,066 150,922 131,267 117,977 118,161
KAMBING (Goat)
S.Malaysia (P. M'sia) 67,586 69,449 64,411 63,875 64,910
Sabah n.a n.a n.a n.a n.a
Sarawak 272 299 491 539 591
Jumlah (Total) 67,858 69,748 64,902 64,414 65,501
BEBIRI (Sheep)
S.Malaysia (P. M'sia) 17,082 17,193 20,676 18,386 18,141
Sabah n.a n.a n.a n.a n.a
Sarawak 44 39 41 36 31
Jumlah (Total) 17,126 17,232 20,717 18,422 18,172
BABI (Swine)
S.Malaysia (P. M'sia) 1,181,978 1,259,230 1,147,780 1,304,977 1,261,910
Sabah 118,748 115,910 118,797 115,957 113,185
Sarawak 232,838 234,840 239,229 241,286 243,361
Jumlah (Total) 1,533,564 1,609,980 1,505,806 1,662,220 1,618,456
P : Sementara (Provisional) n.a : Tiada maklumat (Not available)
E : Anggaran (Estimate)
M/s 5
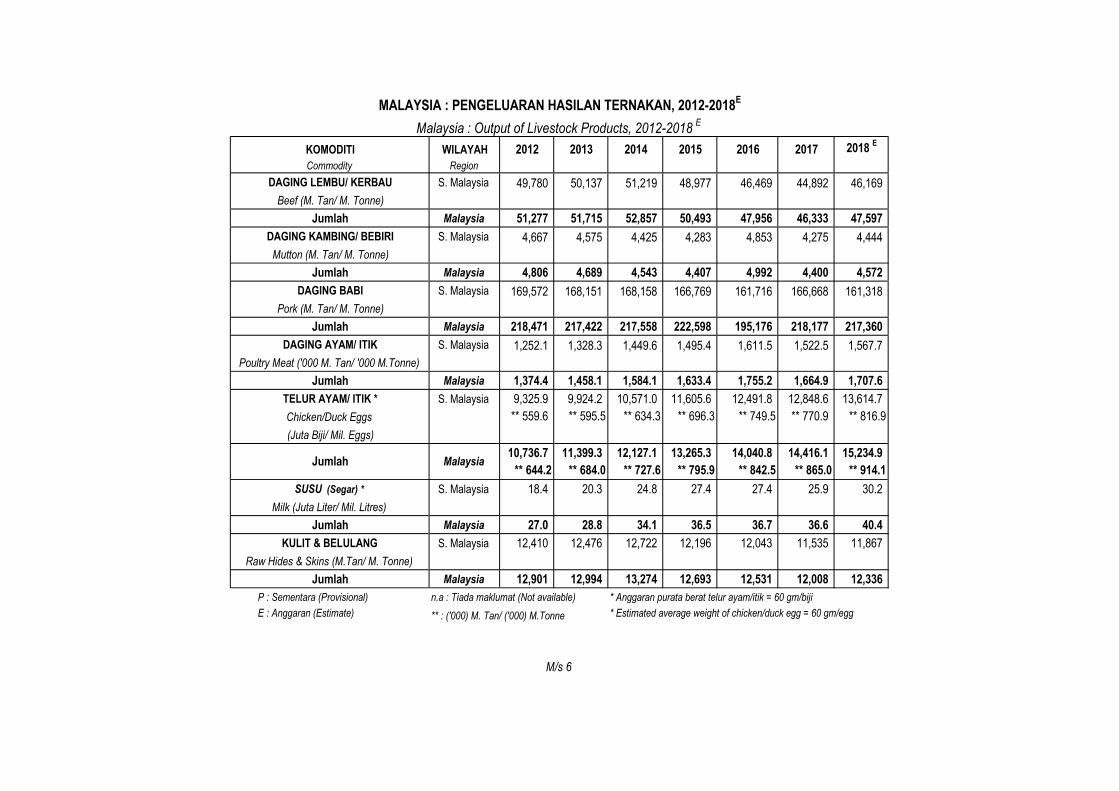
MALAYSIA : PENGELUARAN HASILAN TERNAKAN, 2012-2018E
Malaysia : Output of Livestock Products, 2012-2018E
KOMODITI WILAYAH 2012 2013 2014 2015 2016 2017 2018 E
Commodity Region
DAGING LEMBU/ KERBAU S. Malaysia 49,780 50,137 51,219 48,977 46,469 44,892 46,169
Beef (M. Tan/ M. Tonne)
Jumlah Malaysia 51,277 51,715 52,857 50,493 47,956 46,333 47,597
DAGING KAMBING/ BEBIRI S. Malaysia 4,667 4,575 4,425 4,283 4,853 4,275 4,444
Mutton (M. Tan/ M. Tonne)
Jumlah Malaysia 4,806 4,689 4,543 4,407 4,992 4,400 4,572
DAGING BABI S. Malaysia 169,572 168,151 168,158 166,769 161,716 166,668 161,318
Pork (M. Tan/ M. Tonne)
Jumlah Malaysia 218,471 217,422 217,558 222,598 195,176 218,177 217,360
DAGING AYAM/ ITIK S. Malaysia 1,252.1 1,328.3 1,449.6 1,495.4 1,611.5 1,522.5 1,567.7
Poultry Meat ('000 M. Tan/ '000 M.Tonne)
Jumlah Malaysia 1,374.4 1,458.1 1,584.1 1,633.4 1,755.2 1,664.9 1,707.6
TELUR AYAM/ ITIK * S. Malaysia 9,325.9 9,924.2 10,571.0 11,605.6 12,491.8 12,848.6 13,614.7
Chicken/Duck Eggs ** 559.6 ** 595.5 ** 634.3 ** 696.3 ** 749.5 ** 770.9 ** 816.9
(Juta Biji/ Mil. Eggs)
10,736.7 11,399.3 12,127.1 13,265.3 14,040.8 14,416.1 15,234.9
** 644.2 ** 684.0 ** 727.6 ** 795.9 ** 842.5 ** 865.0 ** 914.1
SUSU (Segar) * S. Malaysia 18.4 20.3 24.8 27.4 27.4 25.9 30.2
Milk (Juta Liter/ Mil. Litres)
Jumlah Malaysia 27.0 28.8 34.1 36.5 36.7 36.6 40.4
KULIT & BELULANG S. Malaysia 12,410 12,476 12,722 12,196 12,043 11,535 11,867
Raw Hides & Skins (M.Tan/ M. Tonne)
Jumlah Malaysia 12,901 12,994 13,274 12,693 12,531 12,008 12,336
P : Sementara (Provisional) n.a : Tiada maklumat (Not available) * Anggaran purata berat telur ayam/itik = 60 gm/biji
E : Anggaran (Estimate) ** : ('000) M. Tan/ ('000) M.Tonne * Estimated average weight of chicken/duck egg = 60 gm/egg
MalaysiaJumlah
M/s 6
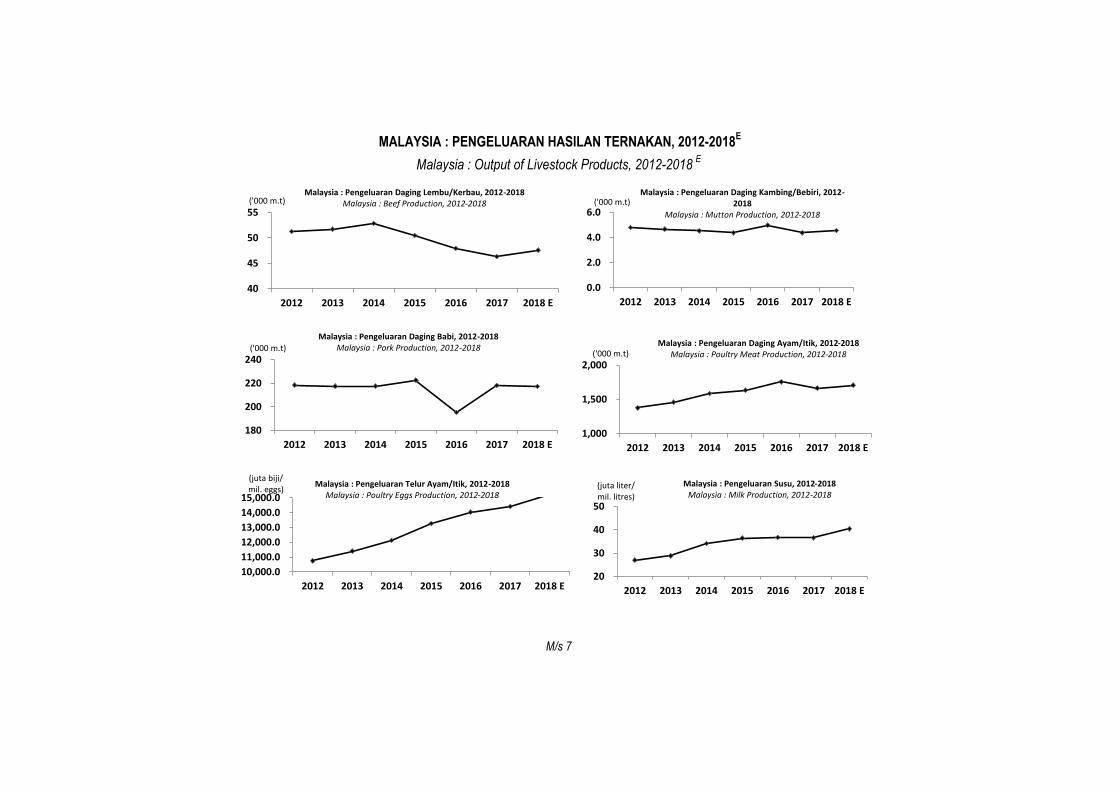
MALAYSIA : PENGELUARAN HASILAN TERNAKAN, 2012-2018E
Malaysia : Output of Livestock Products, 2012-2018E
M/s 7
150
200
250
2005 2006 2007 2008 2009 2010 2011
('000 m.t)Malaysia : Pengeluaran Daging Babi, 2005-
2014Malaysia : Pork Production, 2005-2014
-
4,000.0
8,000.0
12,000.0
2005 2006 2007 2008 2009 2010 2011
(juta biji/mil. eggs)
Malaysia : Pengeluaran Telur Ayam/Itik, 2005-2014
Malaysia : Poultry Eggs Production, 2005-2014
40
45
50
55
2012 2013 2014 2015 2016 2017 2018 E
('000 m.t)Malaysia : Pengeluaran Daging Lembu/Kerbau, 2012-2018
Malaysia : Beef Production, 2012-2018
180
200
220
240
2012 2013 2014 2015 2016 2017 2018 E
('000 m.t)
Malaysia : Pengeluaran Daging Babi, 2012-2018Malaysia : Pork Production, 2012-2018
1,000
1,500
2,000
2012 2013 2014 2015 2016 2017 2018 E
('000 m.t)Malaysia : Pengeluaran Daging Ayam/Itik, 2012-2018
Malaysia : Poultry Meat Production, 2012-2018
10,000.0
11,000.0
12,000.0
13,000.0
14,000.0
15,000.0
2012 2013 2014 2015 2016 2017 2018 E
(juta biji/mil. eggs)
Malaysia : Pengeluaran Telur Ayam/Itik, 2012-2018Malaysia : Poultry Eggs Production, 2012-2018
20
30
40
50
2012 2013 2014 2015 2016 2017 2018 E
(juta liter/mil. litres)
Malaysia : Pengeluaran Susu, 2012-2018Malaysia : Milk Production, 2012-2018
0.0
2.0
4.0
6.0
2012 2013 2014 2015 2016 2017 2018 E
('000 m.t)Malaysia : Pengeluaran Daging Kambing/Bebiri, 2012-
2018Malaysia : Mutton Production, 2012-2018
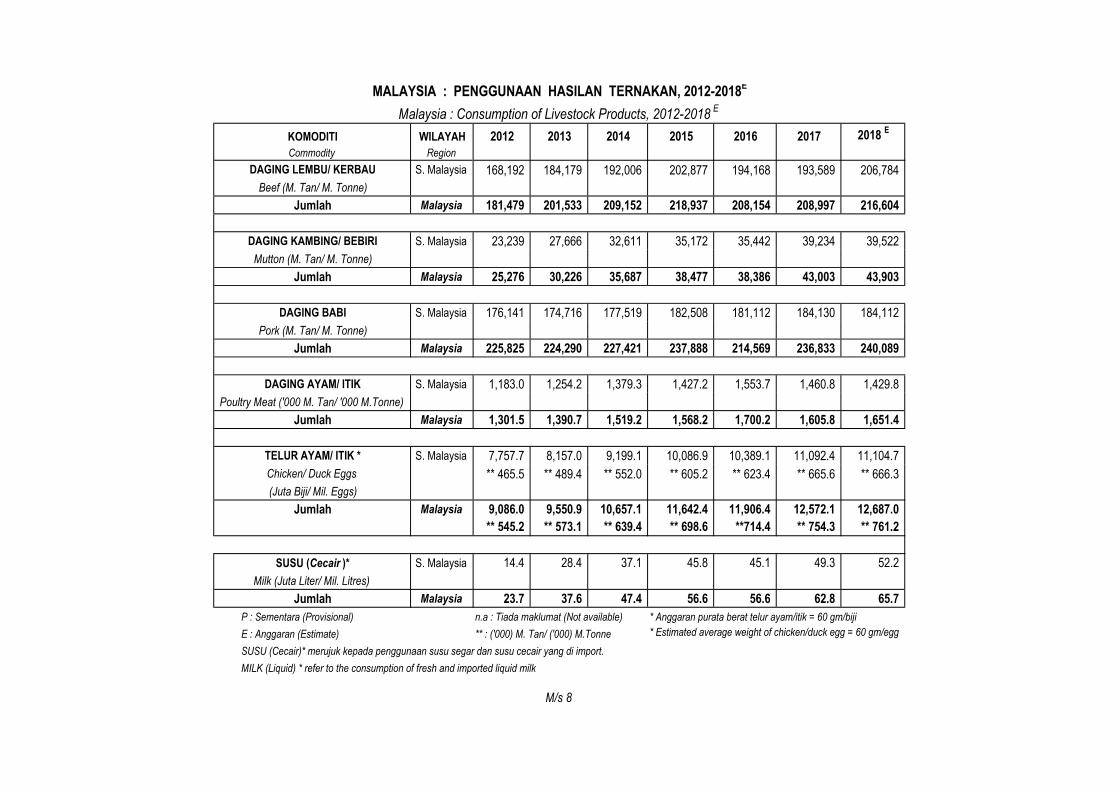
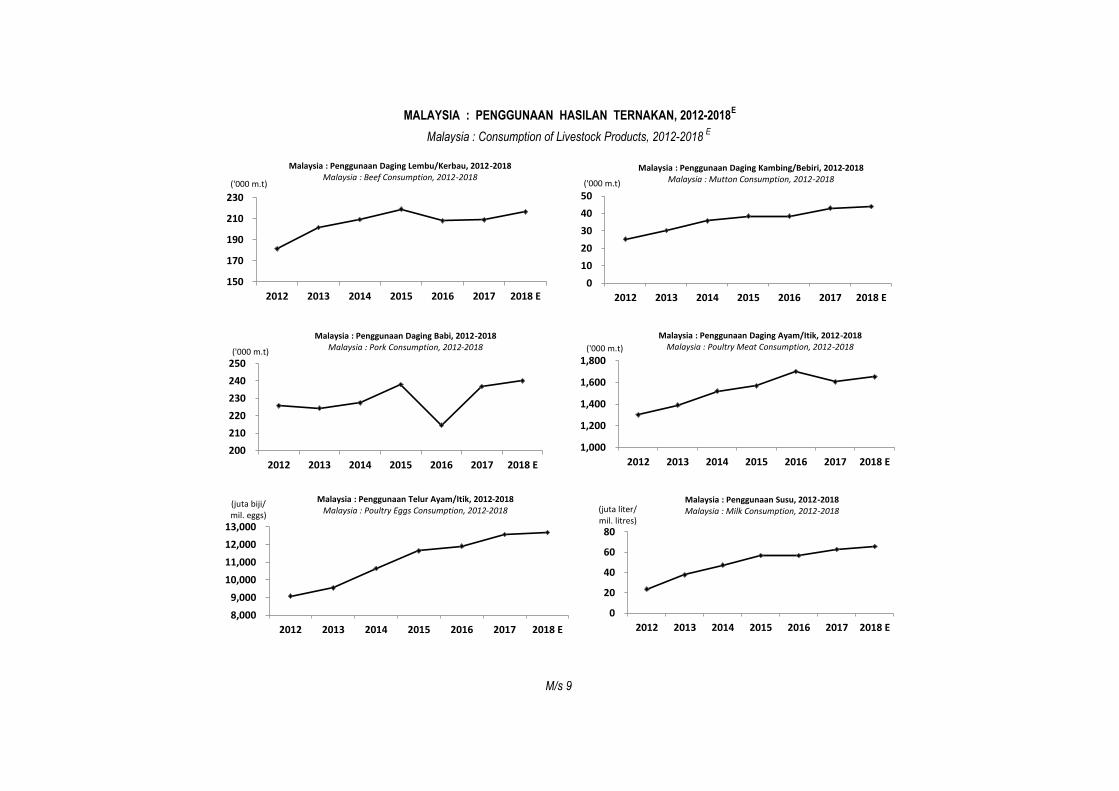
MALAYSIA : PENGGUNAAN HASILAN TERNAKAN, 2012-2018E
Malaysia : Consumption of Livestock Products, 2012-2018E
KOMODITI WILAYAH 2012 2013 2014 2015 2016 2017 2018 E
Commodity Region
DAGING LEMBU/ KERBAU S. Malaysia 168,192 184,179 192,006 202,877 194,168 193,589 206,784
Beef (M. Tan/ M. Tonne)
Jumlah Malaysia 181,479 201,533 209,152 218,937 208,154 208,997 216,604
DAGING KAMBING/ BEBIRI S. Malaysia 23,239 27,666 32,611 35,172 35,442 39,234 39,522
Mutton (M. Tan/ M. Tonne)
Jumlah Malaysia 25,276 30,226 35,687 38,477 38,386 43,003 43,903
DAGING BABI S. Malaysia 176,141 174,716 177,519 182,508 181,112 184,130 184,112
Pork (M. Tan/ M. Tonne)
Jumlah Malaysia 225,825 224,290 227,421 237,888 214,569 236,833 240,089
DAGING AYAM/ ITIK S. Malaysia 1,183.0 1,254.2 1,379.3 1,427.2 1,553.7 1,460.8 1,429.8
Poultry Meat ('000 M. Tan/ '000 M.Tonne)
Jumlah Malaysia 1,301.5 1,390.7 1,519.2 1,568.2 1,700.2 1,605.8 1,651.4
TELUR AYAM/ ITIK * S. Malaysia 7,757.7 8,157.0 9,199.1 10,086.9 10,389.1 11,092.4 11,104.7
Chicken/ Duck Eggs ** 465.5 ** 489.4 ** 552.0 ** 605.2 ** 623.4 ** 665.6 ** 666.3
(Juta Biji/ Mil. Eggs)
Jumlah Malaysia 9,086.0 9,550.9 10,657.1 11,642.4 11,906.4 12,572.1 12,687.0
** 545.2 ** 573.1 ** 639.4 ** 698.6 **714.4 ** 754.3 ** 761.2
SUSU (Cecair )* S. Malaysia 14.4 28.4 37.1 45.8 45.1 49.3 52.2
Milk (Juta Liter/ Mil. Litres)
Jumlah Malaysia 23.7 37.6 47.4 56.6 56.6 62.8 65.7
P : Sementara (Provisional) n.a : Tiada maklumat (Not available) * Anggaran purata berat telur ayam/itik = 60 gm/biji
E : Anggaran (Estimate) ** : ('000) M. Tan/ ('000) M.Tonne * Estimated average weight of chicken/duck egg = 60 gm/egg
SUSU (Cecair)* merujuk kepada penggunaan susu segar dan susu cecair yang di import.
MILK (Liquid) * refer to the consumption of fresh and imported liquid milk
M/s 8
MALAYSIA : PENGGUNAAN HASILAN TERNAKAN, 2012-2018E
Malaysia : Consumption of Livestock Products, 2012-2018E
M/s 9
150
170
190
210
230
2012 2013 2014 2015 2016 2017 2018 E
('000 m.t)
Malaysia : Penggunaan Daging Lembu/Kerbau, 2012-2018Malaysia : Beef Consumption, 2012-2018
0
10
20
30
40
50
2012 2013 2014 2015 2016 2017 2018 E
('000 m.t)
Malaysia : Penggunaan Daging Kambing/Bebiri, 2012-2018Malaysia : Mutton Consumption, 2012-2018
200
210
220
230
240
250
2012 2013 2014 2015 2016 2017 2018 E
('000 m.t)
Malaysia : Penggunaan Daging Babi, 2012-2018Malaysia : Pork Consumption, 2012-2018
1,000
1,200
1,400
1,600
1,800
2012 2013 2014 2015 2016 2017 2018 E
('000 m.t)
Malaysia : Penggunaan Daging Ayam/Itik, 2012-2018Malaysia : Poultry Meat Consumption, 2012-2018
8,000
9,000
10,000
11,000
12,000
13,000
2012 2013 2014 2015 2016 2017 2018 E
(juta biji/mil. eggs)
Malaysia : Penggunaan Telur Ayam/Itik, 2012-2018Malaysia : Poultry Eggs Consumption, 2012-2018
0
20
40
60
80
2012 2013 2014 2015 2016 2017 2018 E
(juta liter/mil. litres)
Malaysia : Penggunaan Susu, 2012-2018Malaysia : Milk Consumption, 2012-2018
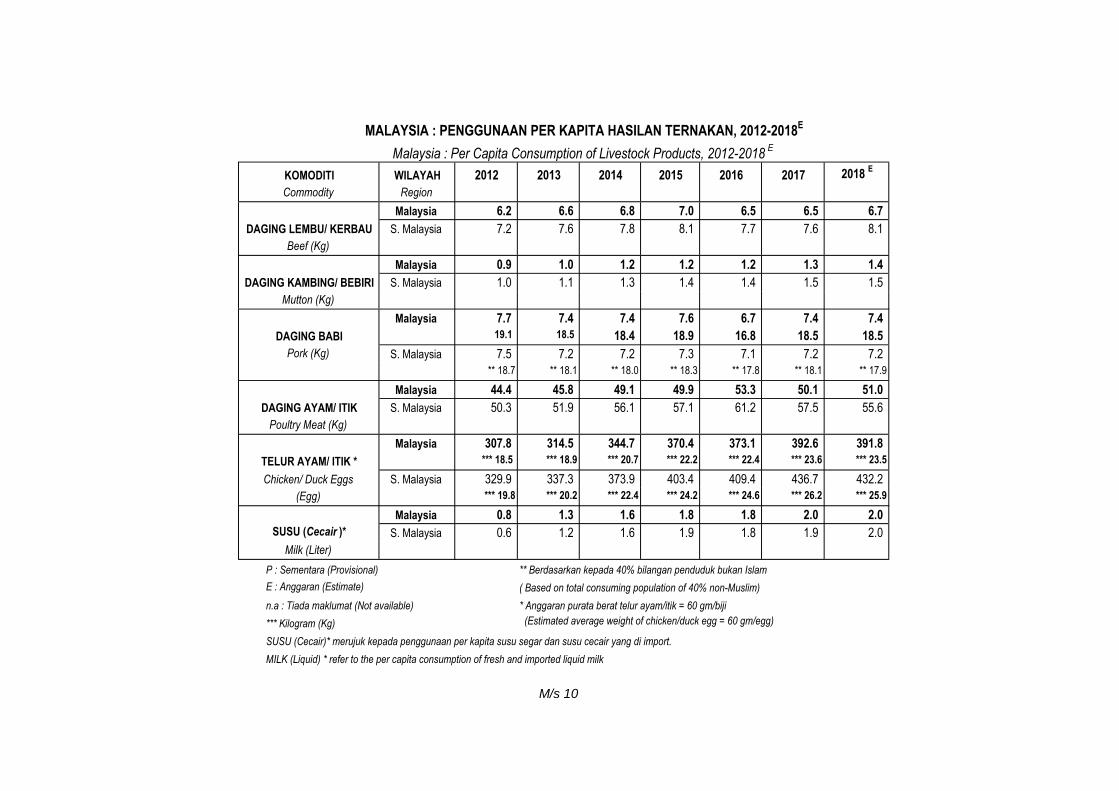
MALAYSIA : PENGGUNAAN PER KAPITA HASILAN TERNAKAN, 2012-2018E
Malaysia : Per Capita Consumption of Livestock Products, 2012-2018E
KOMODITI WILAYAH 2012 2013 2014 2015 2016 2017 2018 E
Commodity Region
Malaysia 6.2 6.6 6.8 7.0 6.5 6.5 6.7
DAGING LEMBU/ KERBAU S. Malaysia 7.2 7.6 7.8 8.1 7.7 7.6 8.1
Beef (Kg)
Malaysia 0.9 1.0 1.2 1.2 1.2 1.3 1.4
DAGING KAMBING/ BEBIRI S. Malaysia 1.0 1.1 1.3 1.4 1.4 1.5 1.5
Mutton (Kg)
Malaysia 7.7 7.4 7.4 7.6 6.7 7.4 7.4
DAGING BABI 19.1 18.5 18.4 18.9 16.8 18.5 18.5
Pork (Kg) S. Malaysia 7.5 7.2 7.2 7.3 7.1 7.2 7.2
** 18.7 ** 18.1 ** 18.0 ** 18.3 ** 17.8 ** 18.1 ** 17.9
Malaysia 44.4 45.8 49.1 49.9 53.3 50.1 51.0
DAGING AYAM/ ITIK S. Malaysia 50.3 51.9 56.1 57.1 61.2 57.5 55.6
Poultry Meat (Kg)
Malaysia 307.8 314.5 344.7 370.4 373.1 392.6 391.8
TELUR AYAM/ ITIK * *** 18.5 *** 18.9 *** 20.7 *** 22.2 *** 22.4 *** 23.6 *** 23.5
Chicken/ Duck Eggs S. Malaysia 329.9 337.3 373.9 403.4 409.4 436.7 432.2
(Egg) *** 19.8 *** 20.2 *** 22.4 *** 24.2 *** 24.6 *** 26.2 *** 25.9
Malaysia 0.8 1.3 1.6 1.8 1.8 2.0 2.0
SUSU (Cecair )* S. Malaysia 0.6 1.2 1.6 1.9 1.8 1.9 2.0
Milk (Liter)
P : Sementara (Provisional) ** Berdasarkan kepada 40% bilangan penduduk bukan Islam
E : Anggaran (Estimate) ( Based on total consuming population of 40% non-Muslim)
n.a : Tiada maklumat (Not available) * Anggaran purata berat telur ayam/itik = 60 gm/biji
*** Kilogram (Kg) (Estimated average weight of chicken/duck egg = 60 gm/egg)
SUSU (Cecair)* merujuk kepada penggunaan per kapita susu segar dan susu cecair yang di import.
MILK (Liquid) * refer to the per capita consumption of fresh and imported liquid milk
M/s 10
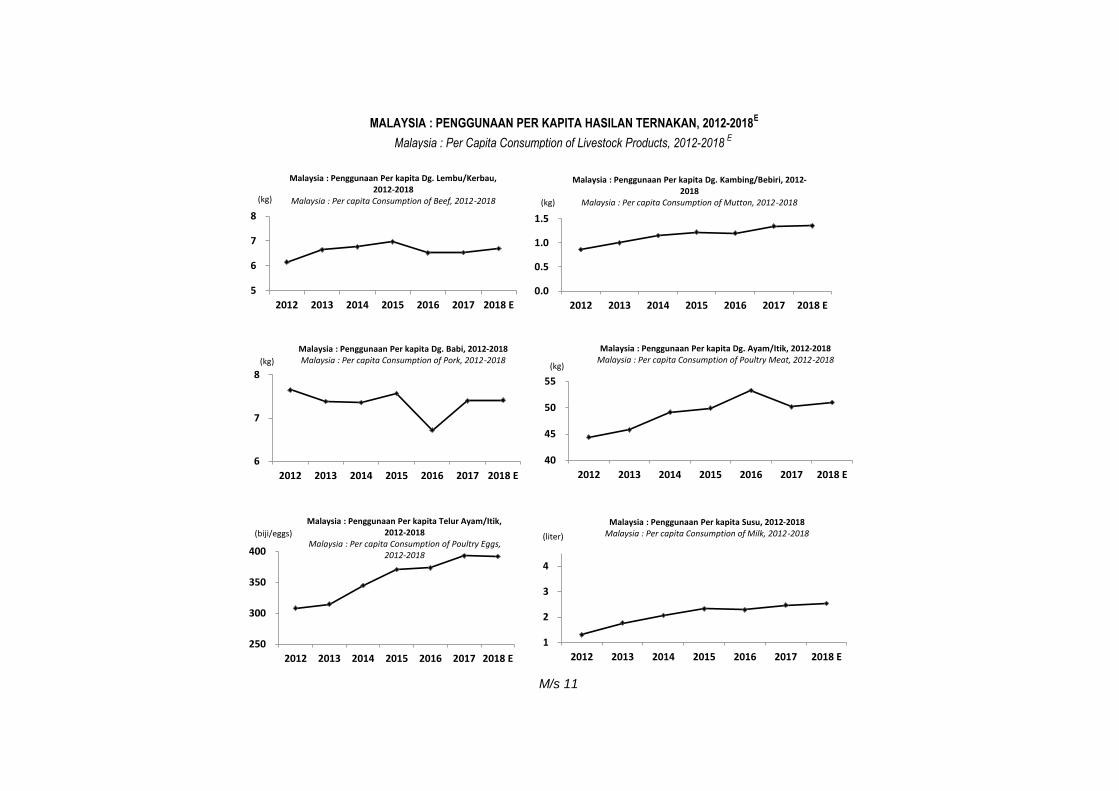
MALAYSIA : PENGGUNAAN PER KAPITA HASILAN TERNAKAN, 2012-2018E
Malaysia : Per Capita Consumption of Livestock Products, 2012-2018E
M/s 11
6
6
7
7
8
2004 2005 2006 2007 2008 2009 2010
(kg)
Malaysia : Penggunaan Per kapita Dg. Lembu/Kerbau, 2004-2013
Malaysia : Per capita Consumption of Beef, 2004-2013
6
7
7
8
8
2004 2005 2006 2007 2008 2009 2010
(kg)
Malaysia : Penggunaan Per kapita Dg. Babi, 2004-2013
Malaysia : Per capita Consumption of Pork, 2004-2013
0
100
200
300
400
500
2004 2005 2006 2007 2008 2009 2010
(biji/eggs)
Malaysia : Penggunaan Per kapita Telur Ayam/Itik, 2004-2013
Malaysia : Per capita Consumption of Poultry Eggs, 2004-2013
5
6
7
8
2012 2013 2014 2015 2016 2017 2018 E
(kg)
Malaysia : Penggunaan Per kapita Dg. Lembu/Kerbau, 2012-2018
Malaysia : Per capita Consumption of Beef, 2012-2018
0.0
0.5
1.0
1.5
2012 2013 2014 2015 2016 2017 2018 E
(kg)
Malaysia : Penggunaan Per kapita Dg. Kambing/Bebiri, 2012-2018
Malaysia : Per capita Consumption of Mutton, 2012-2018
6
7
8
2012 2013 2014 2015 2016 2017 2018 E
(kg)
Malaysia : Penggunaan Per kapita Dg. Babi, 2012-2018Malaysia : Per capita Consumption of Pork, 2012-2018
40
45
50
55
2012 2013 2014 2015 2016 2017 2018 E
(kg)
Malaysia : Penggunaan Per kapita Dg. Ayam/Itik, 2012-2018Malaysia : Per capita Consumption of Poultry Meat, 2012-2018
250
300
350
400
2012 2013 2014 2015 2016 2017 2018 E
(biji/eggs)
Malaysia : Penggunaan Per kapita Telur Ayam/Itik, 2012-2018
Malaysia : Per capita Consumption of Poultry Eggs, 2012-2018
1
2
3
4
2012 2013 2014 2015 2016 2017 2018 E
(liter)
Malaysia : Penggunaan Per kapita Susu, 2012-2018Malaysia : Per capita Consumption of Milk, 2012-2018
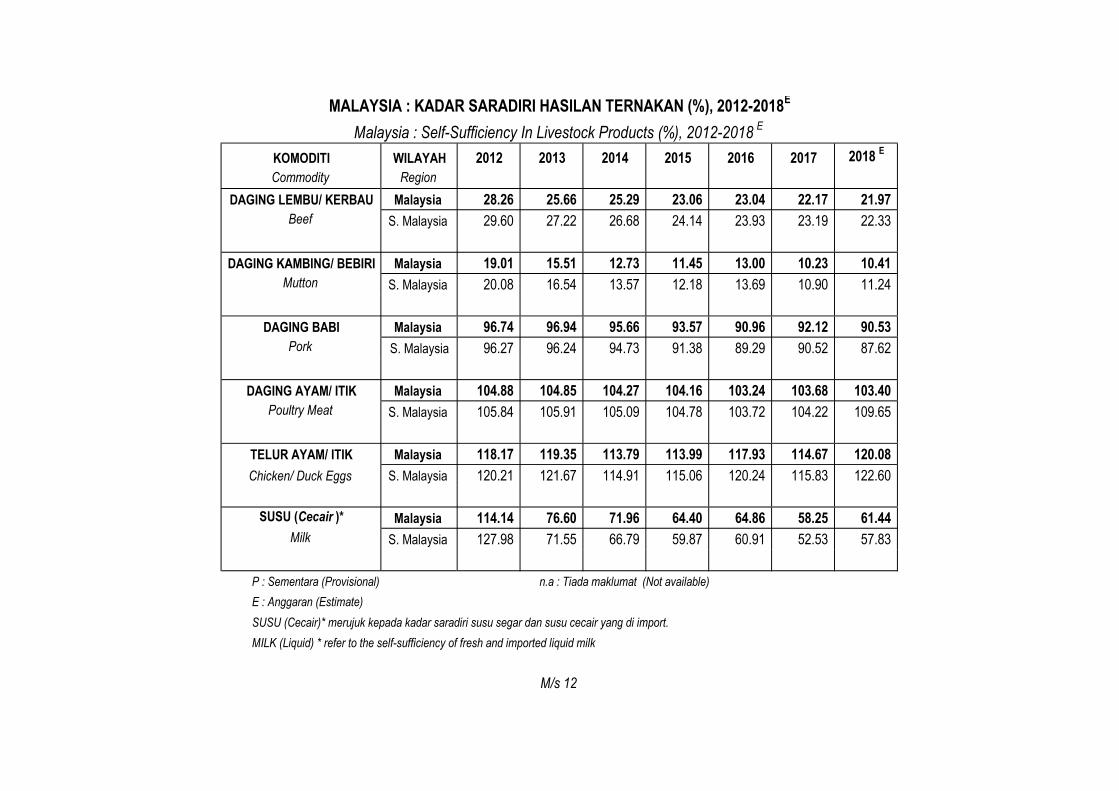
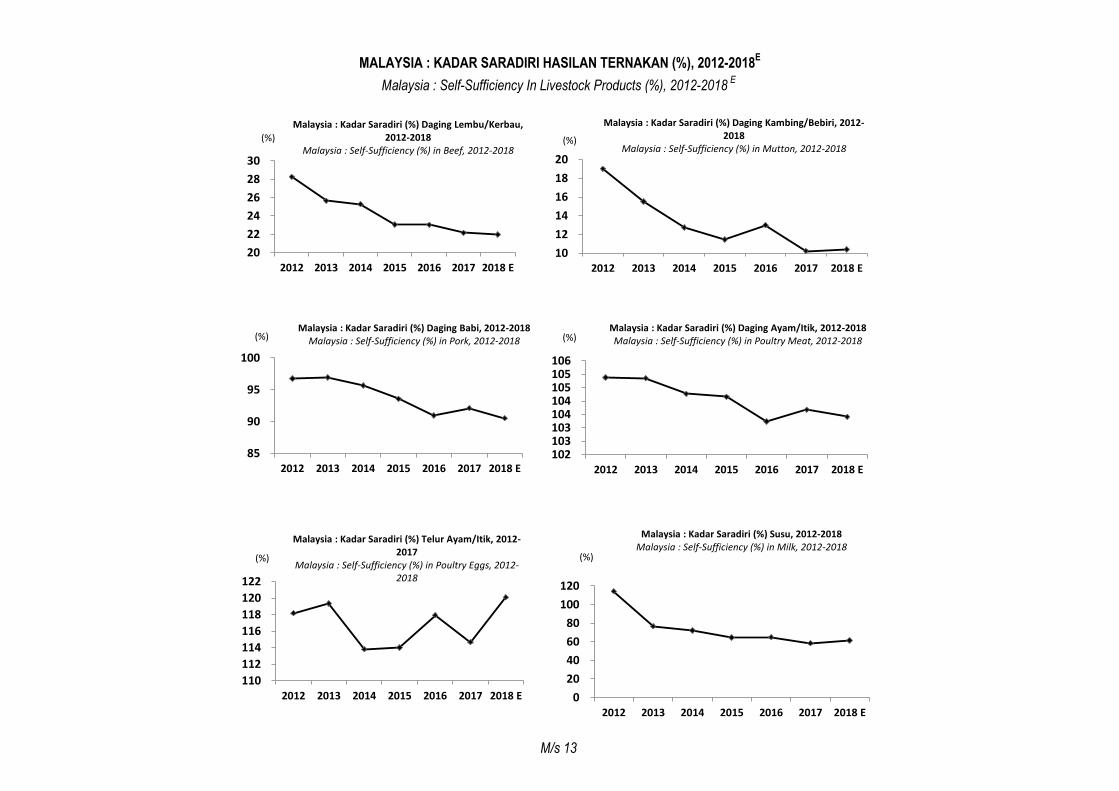
MALAYSIA : KADAR SARADIRI HASILAN TERNAKAN (%), 2012-2018E
Malaysia : Self-Sufficiency In Livestock Products (%), 2012-2018E
KOMODITI WILAYAH 2012 2013 2014 2015 2016 2017 2018 E
Commodity Region
DAGING LEMBU/ KERBAU Malaysia 28.26 25.66 25.29 23.06 23.04 22.17 21.97
Beef S. Malaysia 29.60 27.22 26.68 24.14 23.93 23.19 22.33
DAGING KAMBING/ BEBIRI Malaysia 19.01 15.51 12.73 11.45 13.00 10.23 10.41
Mutton S. Malaysia 20.08 16.54 13.57 12.18 13.69 10.90 11.24
DAGING BABI Malaysia 96.74 96.94 95.66 93.57 90.96 92.12 90.53
Pork S. Malaysia 96.27 96.24 94.73 91.38 89.29 90.52 87.62
DAGING AYAM/ ITIK Malaysia 104.88 104.85 104.27 104.16 103.24 103.68 103.40
Poultry Meat S. Malaysia 105.84 105.91 105.09 104.78 103.72 104.22 109.65
TELUR AYAM/ ITIK Malaysia 118.17 119.35 113.79 113.99 117.93 114.67 120.08
Chicken/ Duck Eggs S. Malaysia 120.21 121.67 114.91 115.06 120.24 115.83 122.60
SUSU (Cecair )* Malaysia 114.14 76.60 71.96 64.40 64.86 58.25 61.44
Milk S. Malaysia 127.98 71.55 66.79 59.87 60.91 52.53 57.83
P : Sementara (Provisional) n.a : Tiada maklumat (Not available)
E : Anggaran (Estimate)
SUSU (Cecair)* merujuk kepada kadar saradiri susu segar dan susu cecair yang di import.
MILK (Liquid) * refer to the self-sufficiency of fresh and imported liquid milk
M/s 12
MALAYSIA : KADAR SARADIRI HASILAN TERNAKAN (%), 2012-2018E
Malaysia : Self-Sufficiency In Livestock Products (%), 2012-2018E
M/s 13
20
22
24
26
28
30
2012 2013 2014 2015 2016 2017 2018 E
(%)
Malaysia : Kadar Saradiri (%) Daging Lembu/Kerbau, 2012-2018
Malaysia : Self-Sufficiency (%) in Beef, 2012-2018
10
12
14
16
18
20
2012 2013 2014 2015 2016 2017 2018 E
(%)
Malaysia : Kadar Saradiri (%) Daging Kambing/Bebiri, 2012-2018
Malaysia : Self-Sufficiency (%) in Mutton, 2012-2018
85
90
95
100
2012 2013 2014 2015 2016 2017 2018 E
(%)Malaysia : Kadar Saradiri (%) Daging Babi, 2012-2018
Malaysia : Self-Sufficiency (%) in Pork, 2012-2018
102103103104104105105106
2012 2013 2014 2015 2016 2017 2018 E
(%)Malaysia : Kadar Saradiri (%) Daging Ayam/Itik, 2012-2018Malaysia : Self-Sufficiency (%) in Poultry Meat, 2012-2018
110
112
114
116
118
120
122
2012 2013 2014 2015 2016 2017 2018 E
(%)
Malaysia : Kadar Saradiri (%) Telur Ayam/Itik, 2012-2017
Malaysia : Self-Sufficiency (%) in Poultry Eggs, 2012-2018
0
20
40
60
80
100
120
2012 2013 2014 2015 2016 2017 2018 E
(%)
Malaysia : Kadar Saradiri (%) Susu, 2012-2018Malaysia : Self-Sufficiency (%) in Milk, 2012-2018

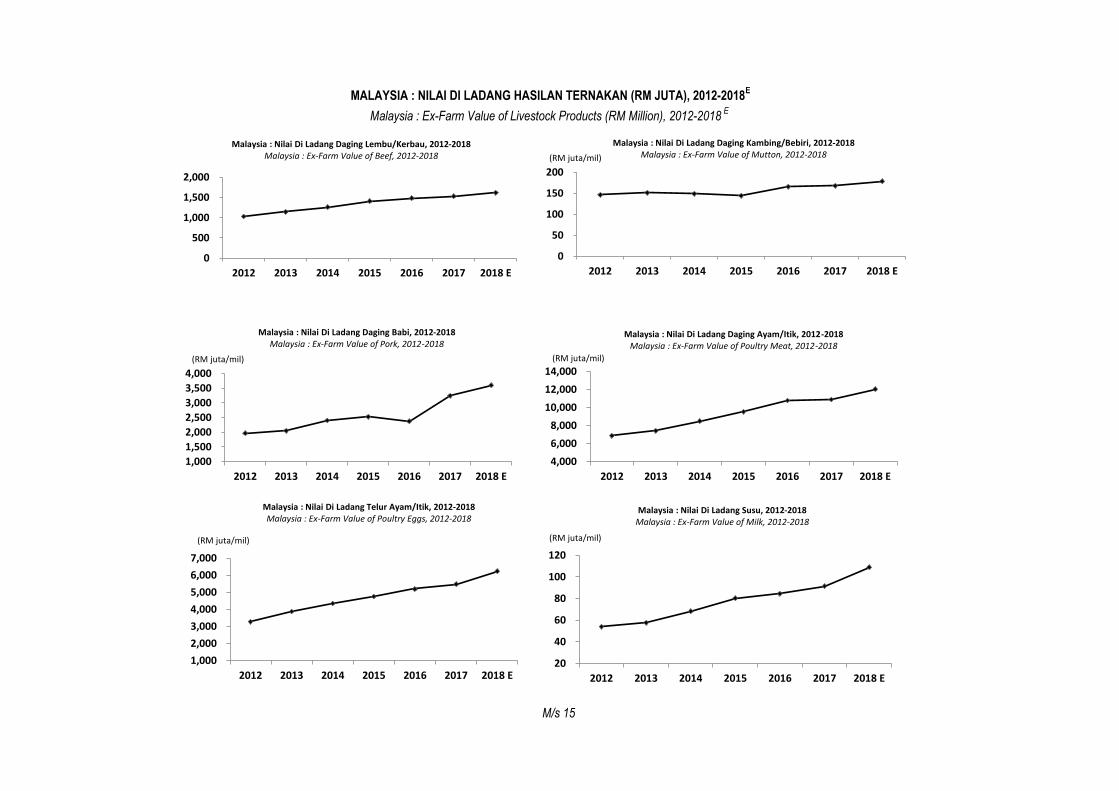
MALAYSIA : NILAI DI LADANG HASILAN TERNAKAN (RM JUTA), 2012-2018 E
Malaysia : Ex-Farm Value of Livestock Products (RM Million), 2012-2018E
KOMODITI WILAYAH 2012 2013 2014 2015 2016 2017 2018 E
Commodity Region
DAGING LEMBU/ KERBAU S. Malaysia 976.49 1,082.96 1,202.64 1,356.67 1,440.55 1,481.44 1,569.75
Beef
Malaysia 1,031.76 1,141.57 1,264.13 1,411.72 1,486.65 1,528.66 1,618.45
DAGING KAMBING/ BEBIRI S. Malaysia 140.01 146.40 143.80 139.21 160.15 162.45 173.30
Mutton
Malaysia 146.13 151.39 148.88 144.52 165.70 167.58 178.42
DAGING BABI S. Malaysia 1,474.46 1,476.91 1,849.74 1,917.84 1,940.59 2,500.02 2,742.41
Pork
Malaysia 1,968.86 2,048.89 2,401.82 2,526.06 2,370.12 3,243.16 3,599.54
DAGING AYAM/ ITIK S. Malaysia 6,094.11 6,605.16 7,682.76 8,673.37 9,830.07 9,896.24 10,974.06
Poultry Meat
Malaysia 6,867.60 7,413.53 8,499.07 9,534.28 10,776.05 10,883.96 12,046.48
TELUR AYAM/ ITIK S. Malaysia 2,797.76 3,374.23 3,805.57 4,178.03 4,621.97 4,882.47 5,582.05
Chicken/Duck Eggs
Malaysia 3,274.63 3,872.77 4,349.46 4,752.04 5,190.09 5,479.54 6,231.74
SUSU (SEGAR)* S. Malaysia 36.76 40.66 49.62 60.31 63.11 64.70 81.55
Fresh milk
Malaysia 54.05 57.62 68.16 80.23 84.50 91.53 108.98
KULIT & BELULANG S. Malaysia 11.79 11.87 13.36 16.46 17.33 19.61 21.85
Raw Hides & Skins
Malaysia 12.26 12.36 13.94 17.13 18.06 20.41 22.74
JUMLAH BESAR S. Malaysia 11,531.38 12,738.19 14,747.49 16,341.89 18,073.77 19,006.93 21,144.97
Grand Total
Malaysia 13,355.29 14,698.13 16,745.46 18,465.98 20,091.17 21,414.84 23,806.34
P : Sementara (Provisional) n.a : Tiada maklumat (Not available)
E : Anggaran (Estimate)
M/s 14
MALAYSIA : NILAI DI LADANG HASILAN TERNAKAN (RM JUTA), 2012-2018E
Malaysia : Ex-Farm Value of Livestock Products (RM Million), 2012-2018E
M/s 15
0
500
1,000
1,500
2,000
2012 2013 2014 2015 2016 2017 2018 E
Malaysia : Nilai Di Ladang Daging Lembu/Kerbau, 2012-2018Malaysia : Ex-Farm Value of Beef, 2012-2018
0
50
100
150
200
2012 2013 2014 2015 2016 2017 2018 E
(RM juta/mil)
Malaysia : Nilai Di Ladang Daging Kambing/Bebiri, 2012-2018Malaysia : Ex-Farm Value of Mutton, 2012-2018
1,000
1,500
2,000
2,500
3,000
3,500
4,000
2012 2013 2014 2015 2016 2017 2018 E
(RM juta/mil)
Malaysia : Nilai Di Ladang Daging Babi, 2012-2018Malaysia : Ex-Farm Value of Pork, 2012-2018
4,000
6,000
8,000
10,000
12,000
14,000
2012 2013 2014 2015 2016 2017 2018 E
(RM juta/mil)
Malaysia : Nilai Di Ladang Daging Ayam/Itik, 2012-2018Malaysia : Ex-Farm Value of Poultry Meat, 2012-2018
1,000
2,000
3,000
4,000
5,000
6,000
7,000
2012 2013 2014 2015 2016 2017 2018 E
(RM juta/mil)
Malaysia : Nilai Di Ladang Telur Ayam/Itik, 2012-2018Malaysia : Ex-Farm Value of Poultry Eggs, 2012-2018
20
40
60
80
100
120
2012 2013 2014 2015 2016 2017 2018 E
(RM juta/mil)
Malaysia : Nilai Di Ladang Susu, 2012-2018Malaysia : Ex-Farm Value of Milk, 2012-2018