lelaki ('000) (%) penganggur luar tenaga kadar … series...bilangan/number ('000) (%)...
TRANSCRIPT
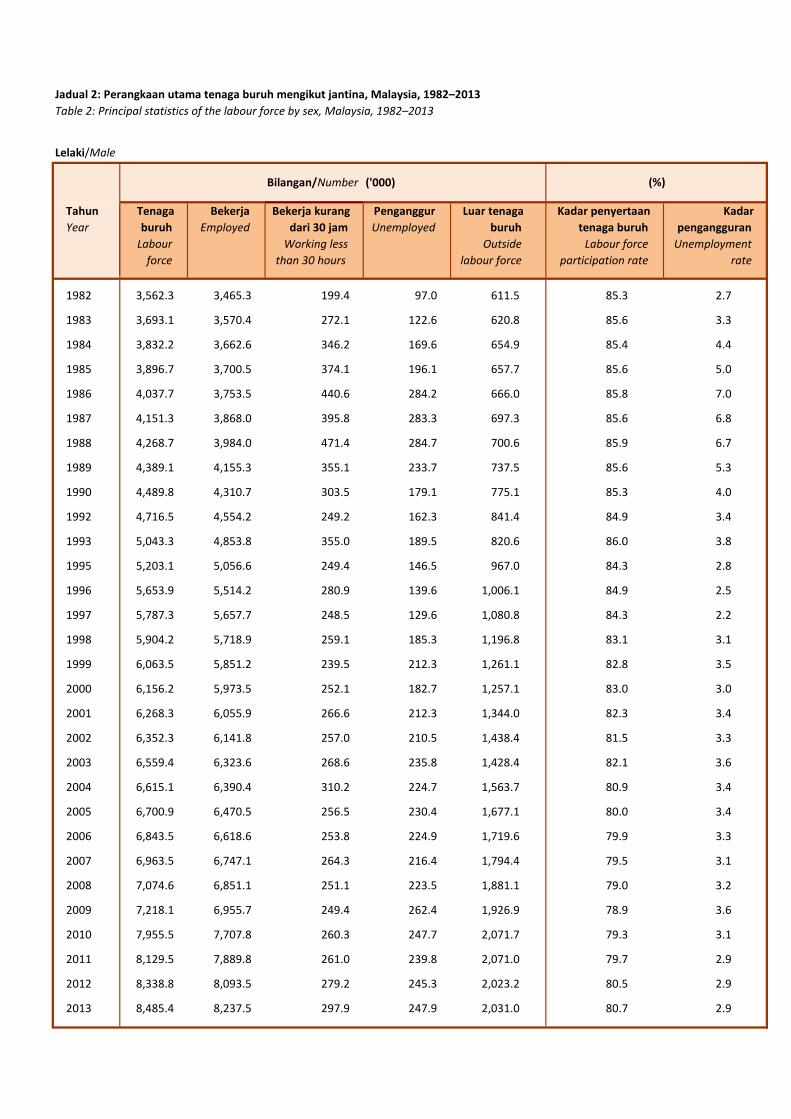
Jadual 2: Perangkaan utama tenaga buruh mengikut jantina, Malaysia, 1982–2013
Lelaki/Male
Tahun
Year
Tenaga
buruh
Labour
force
Bekerja
Employed
Bekerja kurang
dari 30 jam
Working less
than 30 hours
Penganggur
Unemployed
Luar tenaga
buruh
Outside
labour force
Kadar penyertaan
tenaga buruh
Labour force
participation rate
Kadar
pengangguran
Unemployment
rate
1982 3,562.3 3,465.3 199.4 97.0 611.5 85.3 2.7
1983 3,693.1 3,570.4 272.1 122.6 620.8 85.6 3.3
1984 3,832.2 3,662.6 346.2 169.6 654.9 85.4 4.4
1985 3,896.7 3,700.5 374.1 196.1 657.7 85.6 5.0
1986 4,037.7 3,753.5 440.6 284.2 666.0 85.8 7.0
1987 4,151.3 3,868.0 395.8 283.3 697.3 85.6 6.8
1988 4,268.7 3,984.0 471.4 284.7 700.6 85.9 6.7
1989 4,389.1 4,155.3 355.1 233.7 737.5 85.6 5.3
1990 4,489.8 4,310.7 303.5 179.1 775.1 85.3 4.0
1992 4,716.5 4,554.2 249.2 162.3 841.4 84.9 3.4
1993 5,043.3 4,853.8 355.0 189.5 820.6 86.0 3.8
1995 5,203.1 5,056.6 249.4 146.5 967.0 84.3 2.8
1996 5,653.9 5,514.2 280.9 139.6 1,006.1 84.9 2.5
1997 5,787.3 5,657.7 248.5 129.6 1,080.8 84.3 2.2
1998 5,904.2 5,718.9 259.1 185.3 1,196.8 83.1 3.1
1999 6,063.5 5,851.2 239.5 212.3 1,261.1 82.8 3.5
2000 6,156.2 5,973.5 252.1 182.7 1,257.1 83.0 3.0
2001 6,268.3 6,055.9 266.6 212.3 1,344.0 82.3 3.4
2002 6,352.3 6,141.8 257.0 210.5 1,438.4 81.5 3.3
2003 6,559.4 6,323.6 268.6 235.8 1,428.4 82.1 3.6
2004 6,615.1 6,390.4 310.2 224.7 1,563.7 80.9 3.4
2005 6,700.9 6,470.5 256.5 230.4 1,677.1 80.0 3.4
2006 6,843.5 6,618.6 253.8 224.9 1,719.6 79.9 3.3
2007 6,963.5 6,747.1 264.3 216.4 1,794.4 79.5 3.1
2008 7,074.6 6,851.1 251.1 223.5 1,881.1 79.0 3.2
2009 7,218.1 6,955.7 249.4 262.4 1,926.9 78.9 3.6
2010 7,955.5 7,707.8 260.3 247.7 2,071.7 79.3 3.1
2011 8,129.5 7,889.8 261.0 239.8 2,071.0 79.7 2.9
2012 8,338.8 8,093.5 279.2 245.3 2,023.2 80.5 2.9
2013 8,485.4 8,237.5 297.9 247.9 2,031.0 80.7 2.9
Table 2: Principal statistics of the labour force by sex, Malaysia, 1982–2013
Bilangan/Number ('000) (%)
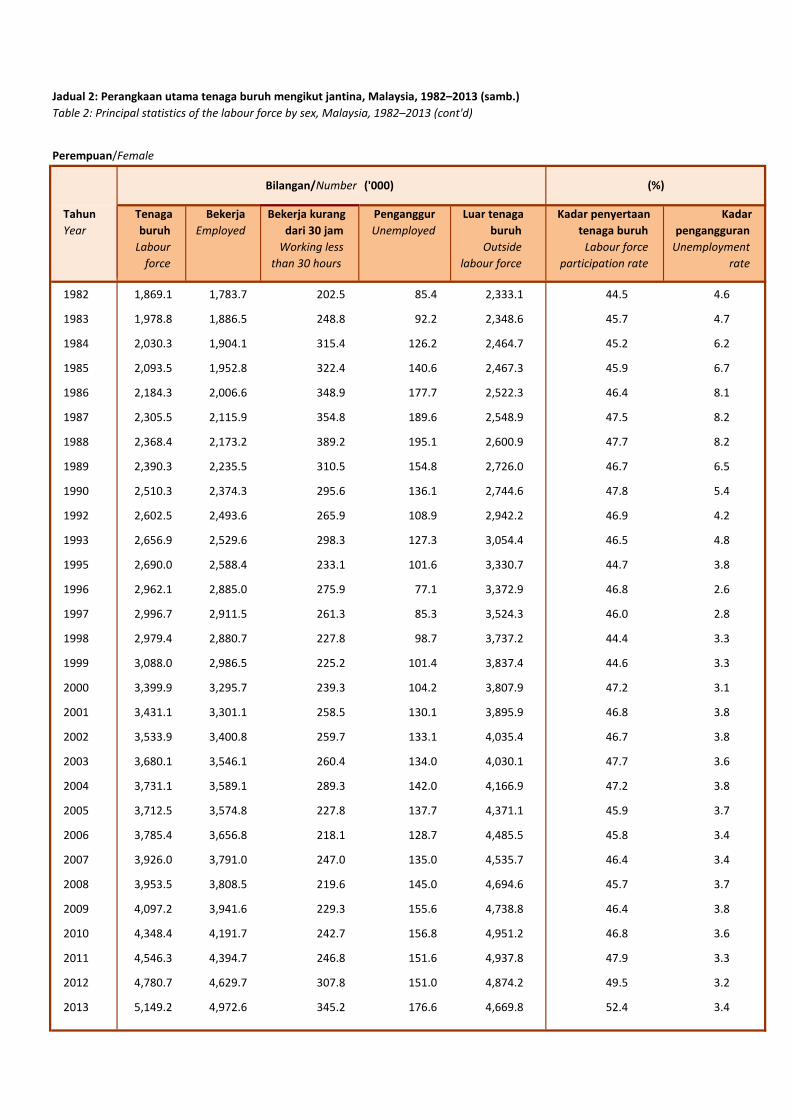
Perempuan/Female
Tahun
Year
Tenaga
buruh
Labour
force
Bekerja
Employed
Bekerja kurang
dari 30 jam
Working less
than 30 hours
Penganggur
Unemployed
Luar tenaga
buruh
Outside
labour force
Kadar penyertaan
tenaga buruh
Labour force
participation rate
Kadar
pengangguran
Unemployment
rate
1982 1,869.1 1,783.7 202.5 85.4 2,333.1 44.5 4.6
1983 1,978.8 1,886.5 248.8 92.2 2,348.6 45.7 4.7
1984 2,030.3 1,904.1 315.4 126.2 2,464.7 45.2 6.2
1985 2,093.5 1,952.8 322.4 140.6 2,467.3 45.9 6.7
1986 2,184.3 2,006.6 348.9 177.7 2,522.3 46.4 8.1
1987 2,305.5 2,115.9 354.8 189.6 2,548.9 47.5 8.2
1988 2,368.4 2,173.2 389.2 195.1 2,600.9 47.7 8.2
1989 2,390.3 2,235.5 310.5 154.8 2,726.0 46.7 6.5
1990 2,510.3 2,374.3 295.6 136.1 2,744.6 47.8 5.4
1992 2,602.5 2,493.6 265.9 108.9 2,942.2 46.9 4.2
1993 2,656.9 2,529.6 298.3 127.3 3,054.4 46.5 4.8
1995 2,690.0 2,588.4 233.1 101.6 3,330.7 44.7 3.8
1996 2,962.1 2,885.0 275.9 77.1 3,372.9 46.8 2.6
1997 2,996.7 2,911.5 261.3 85.3 3,524.3 46.0 2.8
1998 2,979.4 2,880.7 227.8 98.7 3,737.2 44.4 3.3
1999 3,088.0 2,986.5 225.2 101.4 3,837.4 44.6 3.3
2000 3,399.9 3,295.7 239.3 104.2 3,807.9 47.2 3.1
2001 3,431.1 3,301.1 258.5 130.1 3,895.9 46.8 3.8
2002 3,533.9 3,400.8 259.7 133.1 4,035.4 46.7 3.8
2003 3,680.1 3,546.1 260.4 134.0 4,030.1 47.7 3.6
2004 3,731.1 3,589.1 289.3 142.0 4,166.9 47.2 3.8
2005 3,712.5 3,574.8 227.8 137.7 4,371.1 45.9 3.7
2006 3,785.4 3,656.8 218.1 128.7 4,485.5 45.8 3.4
2007 3,926.0 3,791.0 247.0 135.0 4,535.7 46.4 3.4
2008 3,953.5 3,808.5 219.6 145.0 4,694.6 45.7 3.7
2009 4,097.2 3,941.6 229.3 155.6 4,738.8 46.4 3.8
2010 4,348.4 4,191.7 242.7 156.8 4,951.2 46.8 3.6
2011 4,546.3 4,394.7 246.8 151.6 4,937.8 47.9 3.3
2012 4,780.7 4,629.7 307.8 151.0 4,874.2 49.5 3.2
2013 5,149.2 4,972.6 345.2 176.6 4,669.8 52.4 3.4
Jadual 2: Perangkaan utama tenaga buruh mengikut jantina, Malaysia, 1982–2013 (samb.)
Table 2: Principal statistics of the labour force by sex, Malaysia, 1982–2013 (cont'd)
Bilangan/Number ('000) (%)
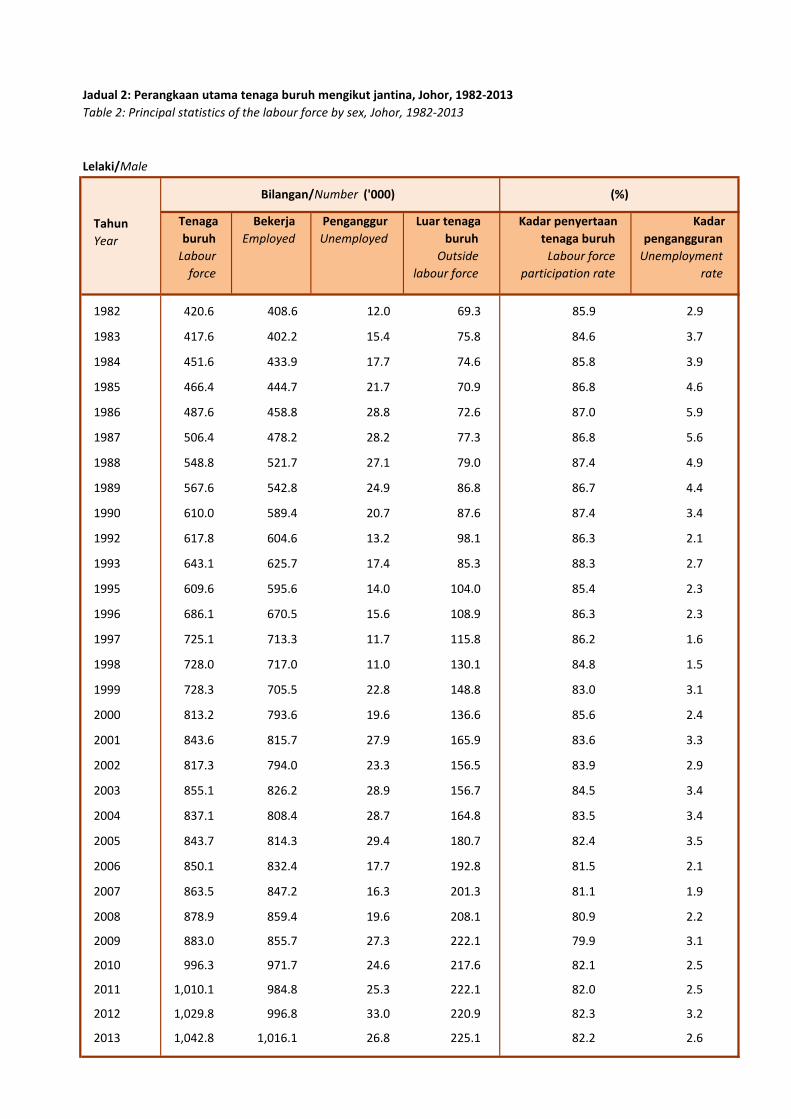
Jadual 2: Perangkaan utama tenaga buruh mengikut jantina, Johor, 1982-2013
Table 2: Principal statistics of the labour force by sex, Johor, 1982-2013
Lelaki/Male
Tenaga
buruh
Labour
force
Bekerja
Employed
Penganggur
Unemployed
Luar tenaga
buruh
Outside
labour force
Kadar penyertaan
tenaga buruh
Labour force
participation rate
Kadar
pengangguran
Unemployment
rate
1982 420.6 408.6 12.0 69.3 85.9 2.9
1983 417.6 402.2 15.4 75.8 84.6 3.7
1984 451.6 433.9 17.7 74.6 85.8 3.9
1985 466.4 444.7 21.7 70.9 86.8 4.6
1986 487.6 458.8 28.8 72.6 87.0 5.9
1987 506.4 478.2 28.2 77.3 86.8 5.6
1988 548.8 521.7 27.1 79.0 87.4 4.9
1989 567.6 542.8 24.9 86.8 86.7 4.4
1990 610.0 589.4 20.7 87.6 87.4 3.4
1992 617.8 604.6 13.2 98.1 86.3 2.1
1993 643.1 625.7 17.4 85.3 88.3 2.7
1995 609.6 595.6 14.0 104.0 85.4 2.3
1996 686.1 670.5 15.6 108.9 86.3 2.3
1997 725.1 713.3 11.7 115.8 86.2 1.6
1998 728.0 717.0 11.0 130.1 84.8 1.5
1999 728.3 705.5 22.8 148.8 83.0 3.1
2000 813.2 793.6 19.6 136.6 85.6 2.4
2001 843.6 815.7 27.9 165.9 83.6 3.3
2002 817.3 794.0 23.3 156.5 83.9 2.9
2003 855.1 826.2 28.9 156.7 84.5 3.4
2004 837.1 808.4 28.7 164.8 83.5 3.4
2005 843.7 814.3 29.4 180.7 82.4 3.5
2006 850.1 832.4 17.7 192.8 81.5 2.1
2007 863.5 847.2 16.3 201.3 81.1 1.9
2008 878.9 859.4 19.6 208.1 80.9 2.2
2009 883.0 855.7 27.3 222.1 79.9 3.1
2010 996.3 971.7 24.6 217.6 82.1 2.5
2011 1,010.1 984.8 25.3 222.1 82.0 2.5
2012 1,029.8 996.8 33.0 220.9 82.3 3.2
2013 1,042.8 1,016.1 26.8 225.1 82.2 2.6
Tahun
Year
Bilangan/Number ('000) (%)
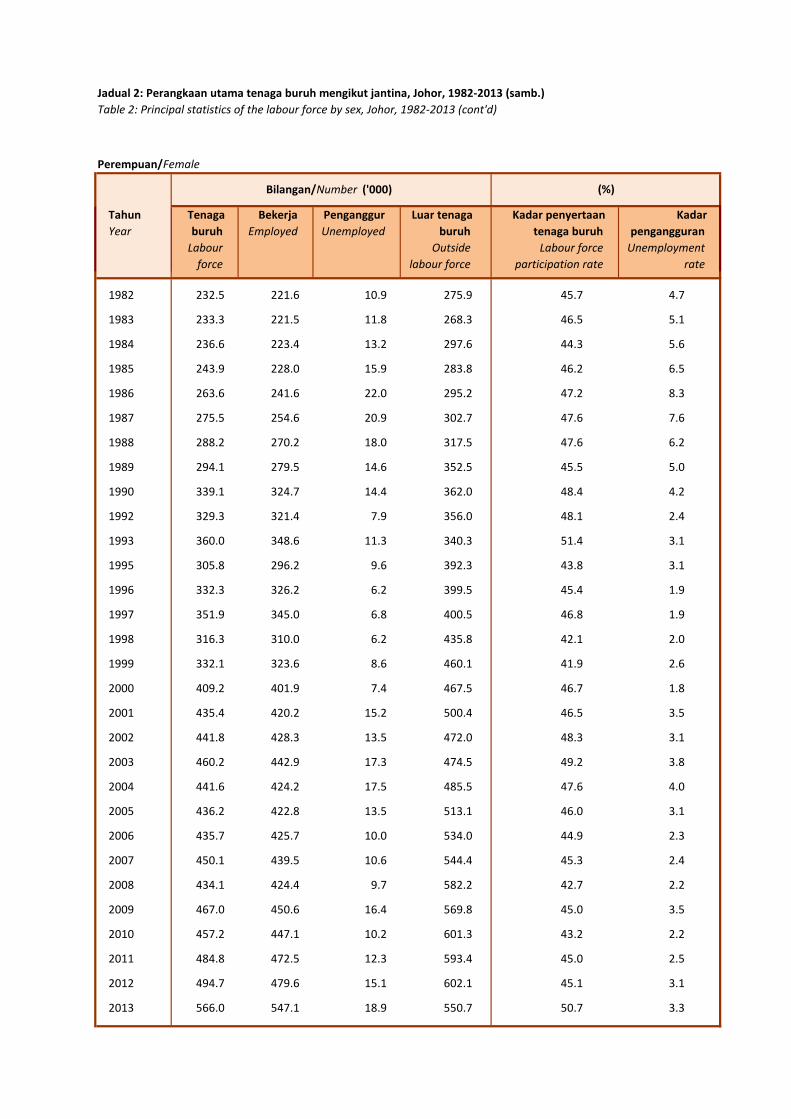
Table 2: Principal statistics of the labour force by sex, Johor, 1982-2013 (cont'd)
Tahun
Year
Tenaga
buruh
Labour
force
Bekerja
Employed
Penganggur
Unemployed
Luar tenaga
buruh
Outside
labour force
Kadar penyertaan
tenaga buruh
Labour force
participation rate
Kadar
pengangguran
Unemployment
rate
1982 232.5 221.6 10.9 275.9 45.7 4.7
1983 233.3 221.5 11.8 268.3 46.5 5.1
1984 236.6 223.4 13.2 297.6 44.3 5.6
1985 243.9 228.0 15.9 283.8 46.2 6.5
1986 263.6 241.6 22.0 295.2 47.2 8.3
1987 275.5 254.6 20.9 302.7 47.6 7.6
1988 288.2 270.2 18.0 317.5 47.6 6.2
1989 294.1 279.5 14.6 352.5 45.5 5.0
1990 339.1 324.7 14.4 362.0 48.4 4.2
1992 329.3 321.4 7.9 356.0 48.1 2.4
1993 360.0 348.6 11.3 340.3 51.4 3.1
1995 305.8 296.2 9.6 392.3 43.8 3.1
1996 332.3 326.2 6.2 399.5 45.4 1.9
1997 351.9 345.0 6.8 400.5 46.8 1.9
1998 316.3 310.0 6.2 435.8 42.1 2.0
1999 332.1 323.6 8.6 460.1 41.9 2.6
2000 409.2 401.9 7.4 467.5 46.7 1.8
2001 435.4 420.2 15.2 500.4 46.5 3.5
2002 441.8 428.3 13.5 472.0 48.3 3.1
2003 460.2 442.9 17.3 474.5 49.2 3.8
2004 441.6 424.2 17.5 485.5 47.6 4.0
2005 436.2 422.8 13.5 513.1 46.0 3.1
2006 435.7 425.7 10.0 534.0 44.9 2.3
2007 450.1 439.5 10.6 544.4 45.3 2.4
2008 434.1 424.4 9.7 582.2 42.7 2.2
2009 467.0 450.6 16.4 569.8 45.0 3.5
2010 457.2 447.1 10.2 601.3 43.2 2.2
2011 484.8 472.5 12.3 593.4 45.0 2.5
2012 494.7 479.6 15.1 602.1 45.1 3.1
2013 566.0 547.1 18.9 550.7 50.7 3.3
Jadual 2: Perangkaan utama tenaga buruh mengikut jantina, Johor, 1982-2013 (samb.)
Perempuan/Female
Bilangan/Number ('000) (%)

Lelaki/Male
Tahun
Year
Tenaga
buruh
Labour
force
Bekerja
Employed
Penganggur
Unemployed
Luar tenaga
buruh
Outside labour
force
Kadar penyertaan
tenaga buruh
Labour force
participation rate
Kadar
pengangguran
Unemployment
rate
1982 266.8 260.8 6.0 58.0 82.1 2.2
1983 243.2 237.8 5.4 46.2 84.1 2.2
1984 290.1 277.6 12.6 61.8 82.4 4.3
1985 283.8 269.2 14.6 64.4 81.5 5.1
1986 301.2 281.1 20.1 60.4 83.3 6.7
1987 302.5 282.1 20.4 64.1 82.5 6.7
1988 317.7 298.0 19.7 60.0 84.1 6.2
1989 310.9 295.3 15.6 64.6 82.8 5.0
1990 326.5 314.6 11.9 63.8 83.7 3.7
1992 333.4 322.0 11.4 66.5 83.4 3.4
1993 332.3 322.0 10.2 51.9 86.5 3.1
1995 352.3 345.4 6.9 73.9 82.7 2.0
1996 362.5 352.8 9.7 83.6 81.3 2.7
1997 405.6 397.7 7.9 88.7 82.1 1.9
1998 387.0 373.2 13.9 83.3 82.3 3.6
1999 462.9 448.1 14.8 97.1 82.7 3.2
2000 416.6 404.6 12.0 90.3 82.2 2.9
2001 459.6 442.6 16.9 107.3 81.1 3.7
2002 429.4 415.9 13.5 107.2 80.0 3.1
2003 436.9 422.5 14.3 106.4 80.4 3.3
2004 426.6 412.3 14.3 111.1 79.3 3.4
2005 430.7 415.4 15.3 120.8 78.1 3.6
2006 441.0 424.4 16.6 123.3 78.1 3.8
2007 443.6 430.4 13.2 134.8 76.7 3.0
2008 448.8 433.0 15.7 142.4 75.9 3.5
2009 468.0 450.0 18.0 138.3 77.2 3.8
2010 490.6 477.5 13.1 144.3 77.3 2.7
2011 502.1 485.3 16.8 147.0 77.4 3.4
2012 519.3 505.7 13.6 143.9 78.3 2.6
2013 528.0 518.0 10.0 148.0 78.1 1.9
Jadual 2: Perangkaan utama tenaga buruh mengikut jantina, Kedah, 1982-2013
Table 2: Principal statistics of the labour force by sex, Kedah, 1982-2013
Bilangan/Number ('000) (%)

Perempuan/Female
Tahun
Year
Tenaga
buruh
Labour
force
Bekerja
Employed
Penganggur
Unemployed
Luar tenaga
buruh
Outside
labour force
Kadar penyertaan
tenaga buruh
Labour force
participation rate
Kadar
pengangguran
Unemployment
rate
1982 137.1 128.1 8.9 201.2 40.5 6.5
1983 145.1 135.8 9.3 180.5 44.6 6.4
1984 152.5 140.0 12.4 214.6 41.5 8.1
1985 161.6 144.6 17.0 211.6 43.3 10.5
1986 153.8 136.8 16.9 235.8 39.5 11.0
1987 154.0 138.0 16.0 227.1 40.4 10.4
1988 178.4 161.3 17.1 235.8 43.1 9.6
1989 159.2 148.0 11.2 224.1 41.5 7.0
1990 162.8 153.1 9.7 237.3 40.7 6.0
1992 180.6 173.1 7.6 239.1 43.0 4.2
1993 160.6 153.0 7.5 243.0 39.8 4.7
1995 179.4 175.7 3.7 261.4 40.7 2.1
1996 187.3 183.2 4.1 278.1 40.2 2.2
1997 211.0 203.6 7.4 289.9 42.1 3.5
1998 200.1 194.2 5.9 288.8 40.9 3.0
1999 238.5 230.5 8.0 325.3 42.3 3.4
2000 228.7 222.0 6.7 301.0 43.2 2.9
2001 267.9 258.5 9.4 352.9 43.2 3.5
2002 237.1 229.2 7.9 318.6 42.7 3.3
2003 243.3 235.2 8.1 301.7 44.6 3.3
2004 253.8 242.3 11.5 304.2 45.5 4.5
2005 247.1 237.4 9.8 324.8 43.2 4.0
2006 241.4 232.4 9.0 343.9 41.2 3.7
2007 249.5 240.0 9.5 346.8 41.8 3.8
2008 254.2 243.0 11.2 355.1 41.7 4.4
2009 264.6 251.5 13.1 357.8 42.5 4.9
2010 256.3 248.2 8.1 364.6 41.3 3.2
2011 268.0 258.1 10.0 366.2 42.3 3.7
2012 289.8 279.7 10.1 358.2 44.7 3.5
2013 321.3 310.7 10.6 339.0 48.7 3.3
Jadual 2: Perangkaan utama tenaga buruh mengikut jantina, Kedah, 1982-2013 (samb.)
Table 2: Principal statistics of the labour force by sex, Kedah, 1982-2013 (cont'd)
Bilangan/Number ('000) (%)

Lelaki/Male
Tahun
Year
Tenaga
buruh
Labour
force
Bekerja
Employed
Penganggur
Unemployed
Luar tenaga
buruh
Outside labour
force
Kadar penyertaan
tenaga buruh
Labour force
participation rate
Kadar
pengangguran
Unemployment
rate
1982 192.8 185.2 7.6 49.7 79.5 3.9
1983 191.9 182.2 9.7 61.0 75.9 5.1
1984 211.2 199.8 11.4 56.9 78.8 5.4
1985 212.8 198.7 14.1 54.9 79.5 6.6
1986 228.3 212.3 16.0 58.5 79.6 7.0
1987 230.2 214.1 16.1 55.5 80.6 7.0
1988 236.7 216.8 20.0 50.9 82.3 8.4
1989 240.0 223.8 16.2 58.4 80.4 6.8
1990 236.1 228.5 7.6 60.0 79.7 3.2
1992 242.1 228.3 13.8 58.3 80.6 5.7
1993 259.6 250.0 9.6 61.2 80.9 3.7
1995 260.9 251.6 9.2 66.4 79.7 3.5
1996 276.2 266.4 9.8 67.7 80.3 3.5
1997 262.8 254.7 8.1 73.0 78.3 3.1
1998 272.8 260.7 12.1 73.8 78.7 4.4
1999 285.1 275.5 9.6 79.5 78.2 3.4
2000 273.8 266.8 7.0 77.3 78.0 2.6
2001 287.2 280.7 6.5 89.0 76.3 2.3
2002 276.7 267.4 9.3 90.6 75.3 3.4
2003 302.4 292.8 9.6 93.8 76.3 3.2
2004 290.1 277.4 12.6 110.8 72.4 4.3
2005 295.2 286.0 9.2 120.0 71.1 3.1
2006 298.6 291.9 6.7 130.4 69.6 2.2
2007 311.7 304.6 7.1 132.6 70.2 2.3
2008 318.9 310.6 8.3 137.7 69.8 2.6
2009 329.5 322.3 7.2 142.7 69.8 2.2
2010 347.2 339.1 8.1 132.8 72.3 2.3
2011 349.1 341.8 7.3 143.4 70.9 2.1
2012 364.8 357.1 7.7 141.5 72.1 2.1
2013 375.7 366.3 9.3 141.9 72.6 2.5
Jadual 2: Perangkaan utama tenaga buruh mengikut jantina, Kelantan, 1982-2013
Table 2: Principal statistics of the labour force by sex, Kelantan, 1982-2013
Bilangan/Number ('000) (%)
Perempuan/Female
Tahun
Year
Tenaga
buruh
Labour
force
Bekerja
Employed
Penganggur
Unemployed
Luar tenaga
buruh
Outside labour
force
Kadar penyertaan
tenaga buruh
Labour force
participation rate
Kadar
pengangguran
Unemployment
rate
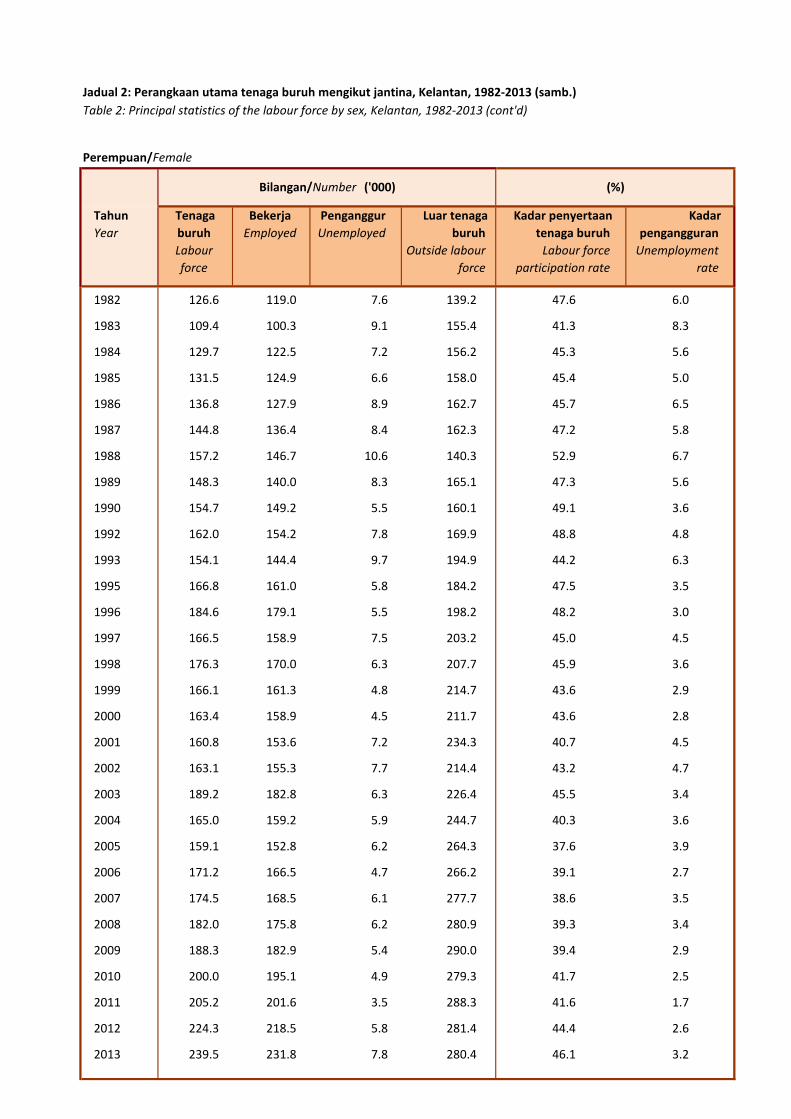
1982 126.6 119.0 7.6 139.2 47.6 6.0
1983 109.4 100.3 9.1 155.4 41.3 8.3
1984 129.7 122.5 7.2 156.2 45.3 5.6
1985 131.5 124.9 6.6 158.0 45.4 5.0
1986 136.8 127.9 8.9 162.7 45.7 6.5
1987 144.8 136.4 8.4 162.3 47.2 5.8
1988 157.2 146.7 10.6 140.3 52.9 6.7
1989 148.3 140.0 8.3 165.1 47.3 5.6
1990 154.7 149.2 5.5 160.1 49.1 3.6
1992 162.0 154.2 7.8 169.9 48.8 4.8
1993 154.1 144.4 9.7 194.9 44.2 6.3
1995 166.8 161.0 5.8 184.2 47.5 3.5
1996 184.6 179.1 5.5 198.2 48.2 3.0
1997 166.5 158.9 7.5 203.2 45.0 4.5
1998 176.3 170.0 6.3 207.7 45.9 3.6
1999 166.1 161.3 4.8 214.7 43.6 2.9
2000 163.4 158.9 4.5 211.7 43.6 2.8
2001 160.8 153.6 7.2 234.3 40.7 4.5
2002 163.1 155.3 7.7 214.4 43.2 4.7
2003 189.2 182.8 6.3 226.4 45.5 3.4
2004 165.0 159.2 5.9 244.7 40.3 3.6
2005 159.1 152.8 6.2 264.3 37.6 3.9
2006 171.2 166.5 4.7 266.2 39.1 2.7
2007 174.5 168.5 6.1 277.7 38.6 3.5
2008 182.0 175.8 6.2 280.9 39.3 3.4
2009 188.3 182.9 5.4 290.0 39.4 2.9
2010 200.0 195.1 4.9 279.3 41.7 2.5
2011 205.2 201.6 3.5 288.3 41.6 1.7
2012 224.3 218.5 5.8 281.4 44.4 2.6
2013 239.5 231.8 7.8 280.4 46.1 3.2
Jadual 2: Perangkaan utama tenaga buruh mengikut jantina, Kelantan, 1982-2013 (samb.)
Table 2: Principal statistics of the labour force by sex, Kelantan, 1982-2013 (cont'd)
Bilangan/Number ('000) (%)
Lelaki/Male
Tahun
Year
Tenaga
buruh
Labour
force
Bekerja
Employed
Penganggur
Unemployed
Luar tenaga
buruh
Outside
labour force
Kadar penyertaan
tenaga buruh
Labour force
participation rate
Kadar
pengangguran
Unemployment
rate
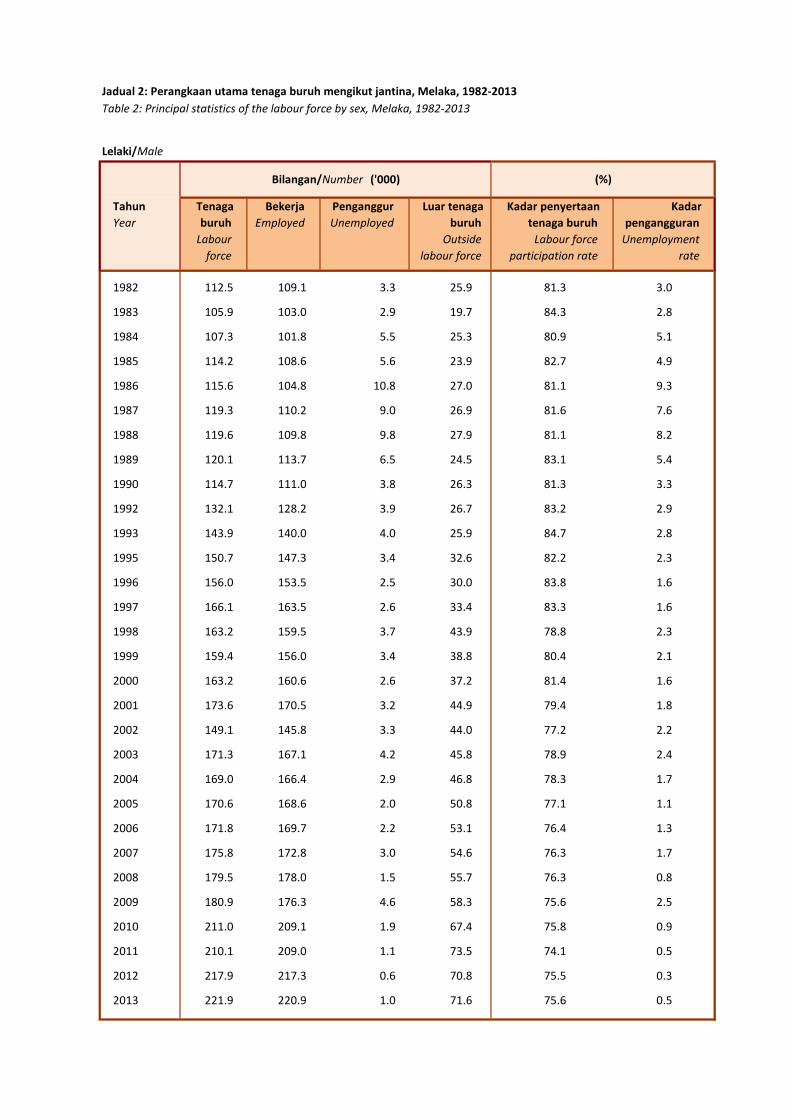
1982 112.5 109.1 3.3 25.9 81.3 3.0
1983 105.9 103.0 2.9 19.7 84.3 2.8
1984 107.3 101.8 5.5 25.3 80.9 5.1
1985 114.2 108.6 5.6 23.9 82.7 4.9
1986 115.6 104.8 10.8 27.0 81.1 9.3
1987 119.3 110.2 9.0 26.9 81.6 7.6
1988 119.6 109.8 9.8 27.9 81.1 8.2
1989 120.1 113.7 6.5 24.5 83.1 5.4
1990 114.7 111.0 3.8 26.3 81.3 3.3
1992 132.1 128.2 3.9 26.7 83.2 2.9
1993 143.9 140.0 4.0 25.9 84.7 2.8
1995 150.7 147.3 3.4 32.6 82.2 2.3
1996 156.0 153.5 2.5 30.0 83.8 1.6
1997 166.1 163.5 2.6 33.4 83.3 1.6
1998 163.2 159.5 3.7 43.9 78.8 2.3
1999 159.4 156.0 3.4 38.8 80.4 2.1
2000 163.2 160.6 2.6 37.2 81.4 1.6
2001 173.6 170.5 3.2 44.9 79.4 1.8
2002 149.1 145.8 3.3 44.0 77.2 2.2
2003 171.3 167.1 4.2 45.8 78.9 2.4
2004 169.0 166.4 2.9 46.8 78.3 1.7
2005 170.6 168.6 2.0 50.8 77.1 1.1
2006 171.8 169.7 2.2 53.1 76.4 1.3
2007 175.8 172.8 3.0 54.6 76.3 1.7
2008 179.5 178.0 1.5 55.7 76.3 0.8
2009 180.9 176.3 4.6 58.3 75.6 2.5
2010 211.0 209.1 1.9 67.4 75.8 0.9
2011 210.1 209.0 1.1 73.5 74.1 0.5
2012 217.9 217.3 0.6 70.8 75.5 0.3
2013 221.9 220.9 1.0 71.6 75.6 0.5
Jadual 2: Perangkaan utama tenaga buruh mengikut jantina, Melaka, 1982-2013
Table 2: Principal statistics of the labour force by sex, Melaka, 1982-2013
Bilangan/Number ('000) (%)
Perempuan/Female
Tahun
Year
Tenaga
buruh
Labour
force
Bekerja
Employed
Penganggur
Unemployed
Luar tenaga
buruh
Outside
labour force
Kadar penyertaan
tenaga buruh
Labour force
participation rate
Kadar
pengangguran
Unemployment
rate
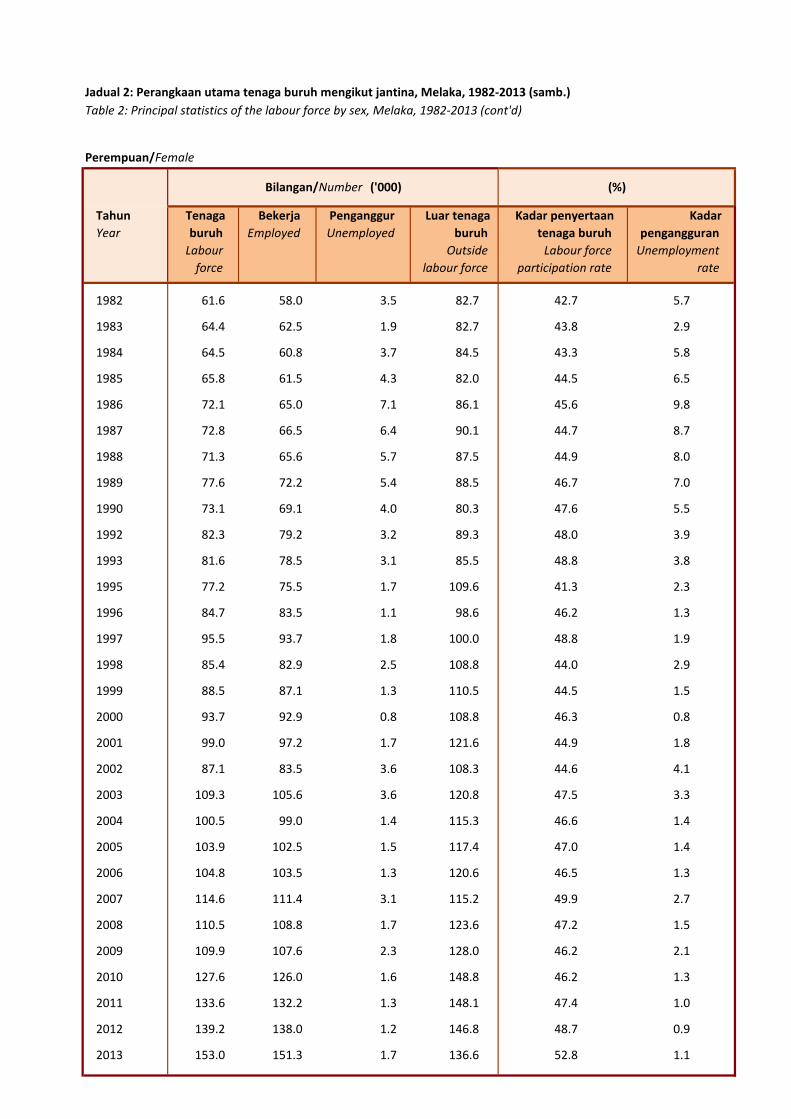
1982 61.6 58.0 3.5 82.7 42.7 5.7
1983 64.4 62.5 1.9 82.7 43.8 2.9
1984 64.5 60.8 3.7 84.5 43.3 5.8
1985 65.8 61.5 4.3 82.0 44.5 6.5
1986 72.1 65.0 7.1 86.1 45.6 9.8
1987 72.8 66.5 6.4 90.1 44.7 8.7
1988 71.3 65.6 5.7 87.5 44.9 8.0
1989 77.6 72.2 5.4 88.5 46.7 7.0
1990 73.1 69.1 4.0 80.3 47.6 5.5
1992 82.3 79.2 3.2 89.3 48.0 3.9
1993 81.6 78.5 3.1 85.5 48.8 3.8
1995 77.2 75.5 1.7 109.6 41.3 2.3
1996 84.7 83.5 1.1 98.6 46.2 1.3
1997 95.5 93.7 1.8 100.0 48.8 1.9
1998 85.4 82.9 2.5 108.8 44.0 2.9
1999 88.5 87.1 1.3 110.5 44.5 1.5
2000 93.7 92.9 0.8 108.8 46.3 0.8
2001 99.0 97.2 1.7 121.6 44.9 1.8
2002 87.1 83.5 3.6 108.3 44.6 4.1
2003 109.3 105.6 3.6 120.8 47.5 3.3
2004 100.5 99.0 1.4 115.3 46.6 1.4
2005 103.9 102.5 1.5 117.4 47.0 1.4
2006 104.8 103.5 1.3 120.6 46.5 1.3
2007 114.6 111.4 3.1 115.2 49.9 2.7
2008 110.5 108.8 1.7 123.6 47.2 1.5
2009 109.9 107.6 2.3 128.0 46.2 2.1
2010 127.6 126.0 1.6 148.8 46.2 1.3
2011 133.6 132.2 1.3 148.1 47.4 1.0
2012 139.2 138.0 1.2 146.8 48.7 0.9
2013 153.0 151.3 1.7 136.6 52.8 1.1
Jadual 2: Perangkaan utama tenaga buruh mengikut jantina, Melaka, 1982-2013 (samb.)
Table 2: Principal statistics of the labour force by sex, Melaka, 1982-2013 (cont'd)
Bilangan/Number ('000) (%)
Lelaki/Male
Tahun
Year
Tenaga
buruh
Labour
force
Bekerja
Employed
Penganggur
Unemployed
Luar tenaga
buruh
Outside
labour force
Kadar penyertaan
tenaga buruh
Labour force
participation rate
Kadar
pengangguran
Unemployment
rate
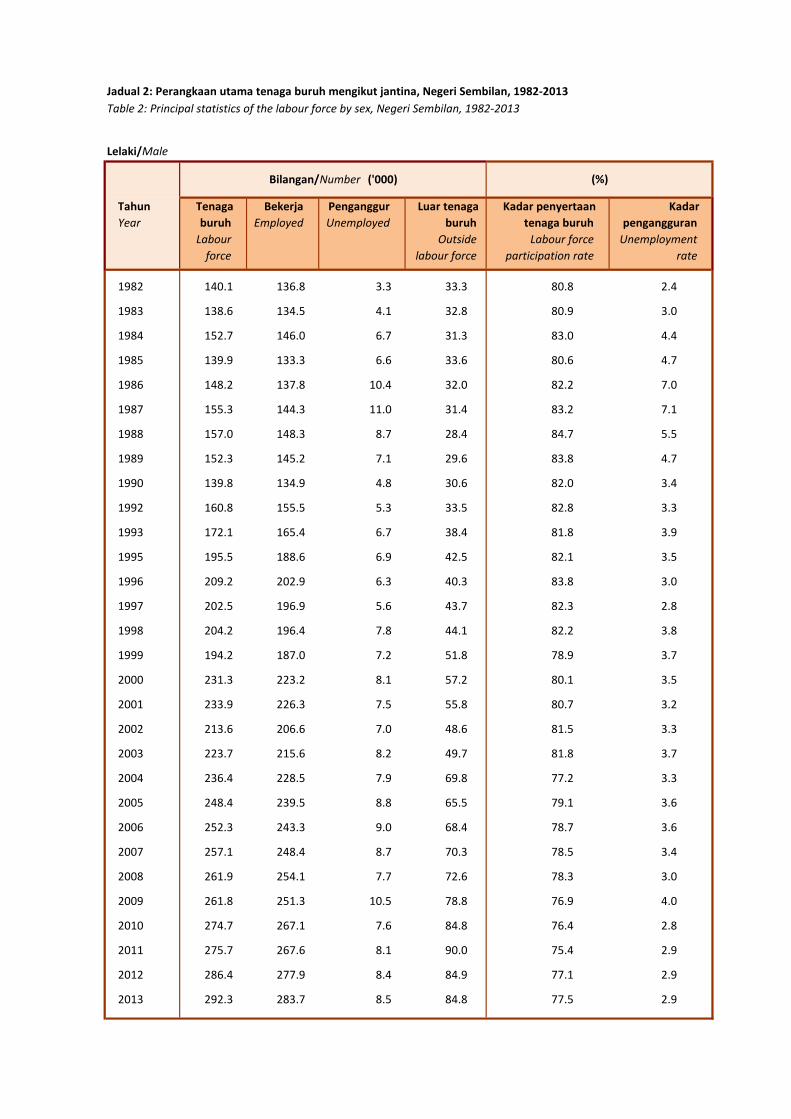
1982 140.1 136.8 3.3 33.3 80.8 2.4
1983 138.6 134.5 4.1 32.8 80.9 3.0
1984 152.7 146.0 6.7 31.3 83.0 4.4
1985 139.9 133.3 6.6 33.6 80.6 4.7
1986 148.2 137.8 10.4 32.0 82.2 7.0
1987 155.3 144.3 11.0 31.4 83.2 7.1
1988 157.0 148.3 8.7 28.4 84.7 5.5
1989 152.3 145.2 7.1 29.6 83.8 4.7
1990 139.8 134.9 4.8 30.6 82.0 3.4
1992 160.8 155.5 5.3 33.5 82.8 3.3
1993 172.1 165.4 6.7 38.4 81.8 3.9
1995 195.5 188.6 6.9 42.5 82.1 3.5
1996 209.2 202.9 6.3 40.3 83.8 3.0
1997 202.5 196.9 5.6 43.7 82.3 2.8
1998 204.2 196.4 7.8 44.1 82.2 3.8
1999 194.2 187.0 7.2 51.8 78.9 3.7
2000 231.3 223.2 8.1 57.2 80.1 3.5
2001 233.9 226.3 7.5 55.8 80.7 3.2
2002 213.6 206.6 7.0 48.6 81.5 3.3
2003 223.7 215.6 8.2 49.7 81.8 3.7
2004 236.4 228.5 7.9 69.8 77.2 3.3
2005 248.4 239.5 8.8 65.5 79.1 3.6
2006 252.3 243.3 9.0 68.4 78.7 3.6
2007 257.1 248.4 8.7 70.3 78.5 3.4
2008 261.9 254.1 7.7 72.6 78.3 3.0
2009 261.8 251.3 10.5 78.8 76.9 4.0
2010 274.7 267.1 7.6 84.8 76.4 2.8
2011 275.7 267.6 8.1 90.0 75.4 2.9
2012 286.4 277.9 8.4 84.9 77.1 2.9
2013 292.3 283.7 8.5 84.8 77.5 2.9
Jadual 2: Perangkaan utama tenaga buruh mengikut jantina, Negeri Sembilan, 1982-2013
Table 2: Principal statistics of the labour force by sex, Negeri Sembilan, 1982-2013
Bilangan/Number ('000) (%)
Perempuan/Female
Tahun
Year
Tenaga
buruh
Labour
force
Bekerja
Employed
Penganggur
Unemployed
Luar tenaga
buruh
Outside
labour force
Kadar penyertaan
tenaga buruh
Labour force
participation rate
Kadar
pengangguran
Unemployment
rate
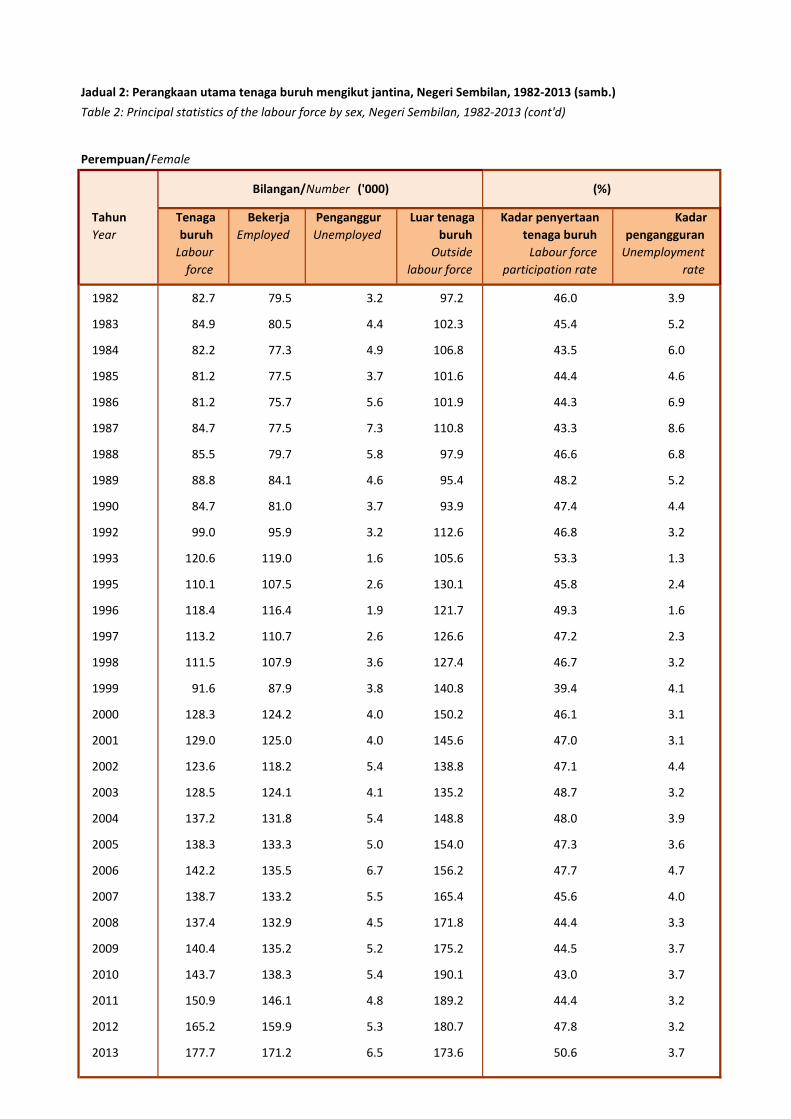
1982 82.7 79.5 3.2 97.2 46.0 3.9
1983 84.9 80.5 4.4 102.3 45.4 5.2
1984 82.2 77.3 4.9 106.8 43.5 6.0
1985 81.2 77.5 3.7 101.6 44.4 4.6
1986 81.2 75.7 5.6 101.9 44.3 6.9
1987 84.7 77.5 7.3 110.8 43.3 8.6
1988 85.5 79.7 5.8 97.9 46.6 6.8
1989 88.8 84.1 4.6 95.4 48.2 5.2
1990 84.7 81.0 3.7 93.9 47.4 4.4
1992 99.0 95.9 3.2 112.6 46.8 3.2
1993 120.6 119.0 1.6 105.6 53.3 1.3
1995 110.1 107.5 2.6 130.1 45.8 2.4
1996 118.4 116.4 1.9 121.7 49.3 1.6
1997 113.2 110.7 2.6 126.6 47.2 2.3
1998 111.5 107.9 3.6 127.4 46.7 3.2
1999 91.6 87.9 3.8 140.8 39.4 4.1
2000 128.3 124.2 4.0 150.2 46.1 3.1
2001 129.0 125.0 4.0 145.6 47.0 3.1
2002 123.6 118.2 5.4 138.8 47.1 4.4
2003 128.5 124.1 4.1 135.2 48.7 3.2
2004 137.2 131.8 5.4 148.8 48.0 3.9
2005 138.3 133.3 5.0 154.0 47.3 3.6
2006 142.2 135.5 6.7 156.2 47.7 4.7
2007 138.7 133.2 5.5 165.4 45.6 4.0
2008 137.4 132.9 4.5 171.8 44.4 3.3
2009 140.4 135.2 5.2 175.2 44.5 3.7
2010 143.7 138.3 5.4 190.1 43.0 3.7
2011 150.9 146.1 4.8 189.2 44.4 3.2
2012 165.2 159.9 5.3 180.7 47.8 3.2
2013 177.7 171.2 6.5 173.6 50.6 3.7
Jadual 2: Perangkaan utama tenaga buruh mengikut jantina, Negeri Sembilan, 1982-2013 (samb.)
Table 2: Principal statistics of the labour force by sex, Negeri Sembilan, 1982-2013 (cont'd)
Bilangan/Number ('000) (%)
Lelaki/Male
Tahun
Year
Tenaga
buruh
Labour
force
Bekerja
Employed
Penganggur
Unemployed
Luar tenaga
buruh
Outside
labour force
Kadar penyertaan
tenaga buruh
Labour force
participation rate
Kadar
pengangguran
Unemployment
rate
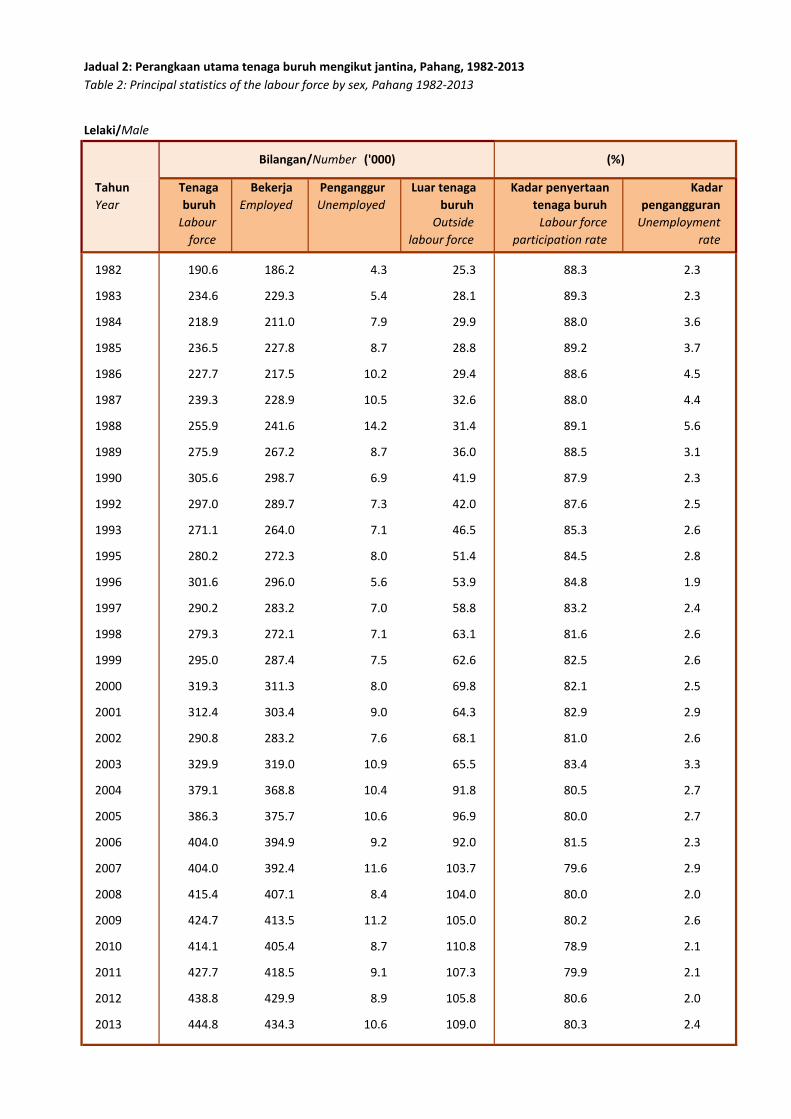
1982 190.6 186.2 4.3 25.3 88.3 2.3
1983 234.6 229.3 5.4 28.1 89.3 2.3
1984 218.9 211.0 7.9 29.9 88.0 3.6
1985 236.5 227.8 8.7 28.8 89.2 3.7
1986 227.7 217.5 10.2 29.4 88.6 4.5
1987 239.3 228.9 10.5 32.6 88.0 4.4
1988 255.9 241.6 14.2 31.4 89.1 5.6
1989 275.9 267.2 8.7 36.0 88.5 3.1
1990 305.6 298.7 6.9 41.9 87.9 2.3
1992 297.0 289.7 7.3 42.0 87.6 2.5
1993 271.1 264.0 7.1 46.5 85.3 2.6
1995 280.2 272.3 8.0 51.4 84.5 2.8
1996 301.6 296.0 5.6 53.9 84.8 1.9
1997 290.2 283.2 7.0 58.8 83.2 2.4
1998 279.3 272.1 7.1 63.1 81.6 2.6
1999 295.0 287.4 7.5 62.6 82.5 2.6
2000 319.3 311.3 8.0 69.8 82.1 2.5
2001 312.4 303.4 9.0 64.3 82.9 2.9
2002 290.8 283.2 7.6 68.1 81.0 2.6
2003 329.9 319.0 10.9 65.5 83.4 3.3
2004 379.1 368.8 10.4 91.8 80.5 2.7
2005 386.3 375.7 10.6 96.9 80.0 2.7
2006 404.0 394.9 9.2 92.0 81.5 2.3
2007 404.0 392.4 11.6 103.7 79.6 2.9
2008 415.4 407.1 8.4 104.0 80.0 2.0
2009 424.7 413.5 11.2 105.0 80.2 2.6
2010 414.1 405.4 8.7 110.8 78.9 2.1
2011 427.7 418.5 9.1 107.3 79.9 2.1
2012 438.8 429.9 8.9 105.8 80.6 2.0
2013 444.8 434.3 10.6 109.0 80.3 2.4
Jadual 2: Perangkaan utama tenaga buruh mengikut jantina, Pahang, 1982-2013
Table 2: Principal statistics of the labour force by sex, Pahang 1982-2013
Bilangan/Number ('000) (%)
Perempuan/Female
Tahun
Year
Tenaga
buruh
Labour
force
Bekerja
Employed
Penganggur
Unemployed
Luar tenaga
buruh
Outside
labour force
Kadar penyertaan
tenaga buruh
Labour force
participation rate
Kadar
pengangguran
Unemployment
rate
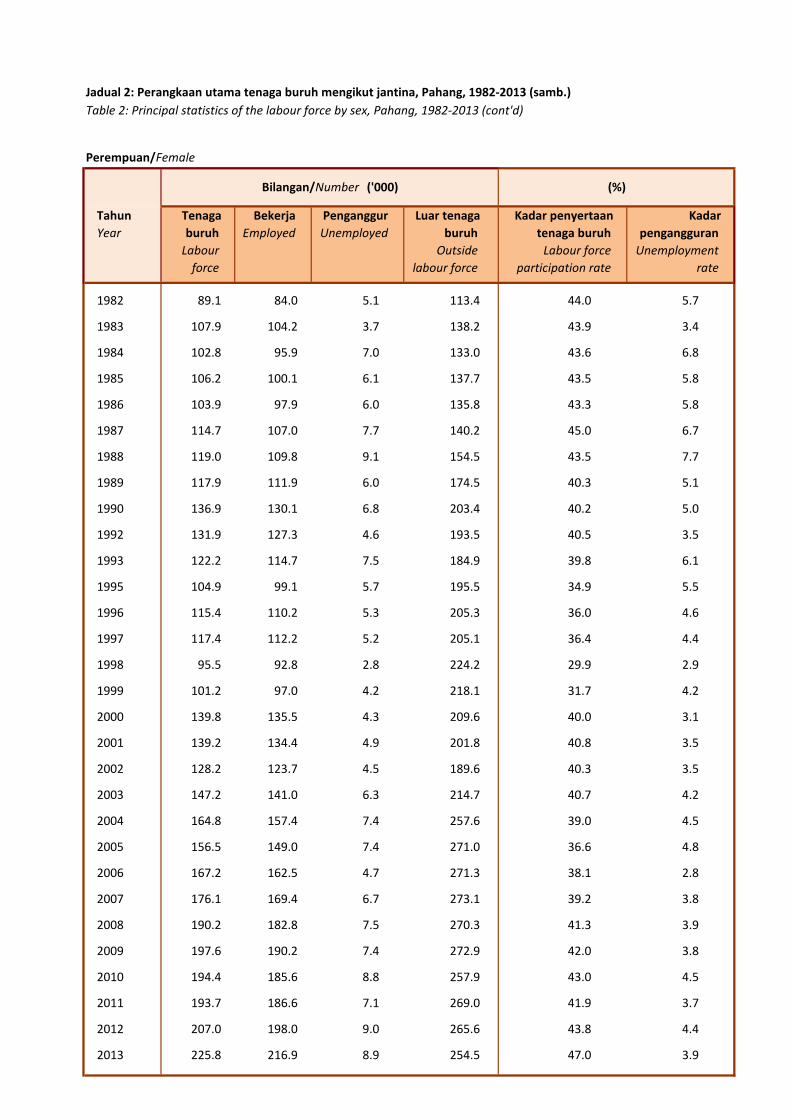
1982 89.1 84.0 5.1 113.4 44.0 5.7
1983 107.9 104.2 3.7 138.2 43.9 3.4
1984 102.8 95.9 7.0 133.0 43.6 6.8
1985 106.2 100.1 6.1 137.7 43.5 5.8
1986 103.9 97.9 6.0 135.8 43.3 5.8
1987 114.7 107.0 7.7 140.2 45.0 6.7
1988 119.0 109.8 9.1 154.5 43.5 7.7
1989 117.9 111.9 6.0 174.5 40.3 5.1
1990 136.9 130.1 6.8 203.4 40.2 5.0
1992 131.9 127.3 4.6 193.5 40.5 3.5
1993 122.2 114.7 7.5 184.9 39.8 6.1
1995 104.9 99.1 5.7 195.5 34.9 5.5
1996 115.4 110.2 5.3 205.3 36.0 4.6
1997 117.4 112.2 5.2 205.1 36.4 4.4
1998 95.5 92.8 2.8 224.2 29.9 2.9
1999 101.2 97.0 4.2 218.1 31.7 4.2
2000 139.8 135.5 4.3 209.6 40.0 3.1
2001 139.2 134.4 4.9 201.8 40.8 3.5
2002 128.2 123.7 4.5 189.6 40.3 3.5
2003 147.2 141.0 6.3 214.7 40.7 4.2
2004 164.8 157.4 7.4 257.6 39.0 4.5
2005 156.5 149.0 7.4 271.0 36.6 4.8
2006 167.2 162.5 4.7 271.3 38.1 2.8
2007 176.1 169.4 6.7 273.1 39.2 3.8
2008 190.2 182.8 7.5 270.3 41.3 3.9
2009 197.6 190.2 7.4 272.9 42.0 3.8
2010 194.4 185.6 8.8 257.9 43.0 4.5
2011 193.7 186.6 7.1 269.0 41.9 3.7
2012 207.0 198.0 9.0 265.6 43.8 4.4
2013 225.8 216.9 8.9 254.5 47.0 3.9
Jadual 2: Perangkaan utama tenaga buruh mengikut jantina, Pahang, 1982-2013 (samb.)
Table 2: Principal statistics of the labour force by sex, Pahang, 1982-2013 (cont'd)
Bilangan/Number ('000) (%)
Lelaki/Male
Tahun
Year
Tenaga
buruh
Labour
force
Bekerja
Employed
Penganggur
Unemployed
Luar tenaga
buruh
Outside
labour force
Kadar penyertaan
tenaga buruh
Labour force
participation rate
Kadar
pengangguran
Unemployment
rate
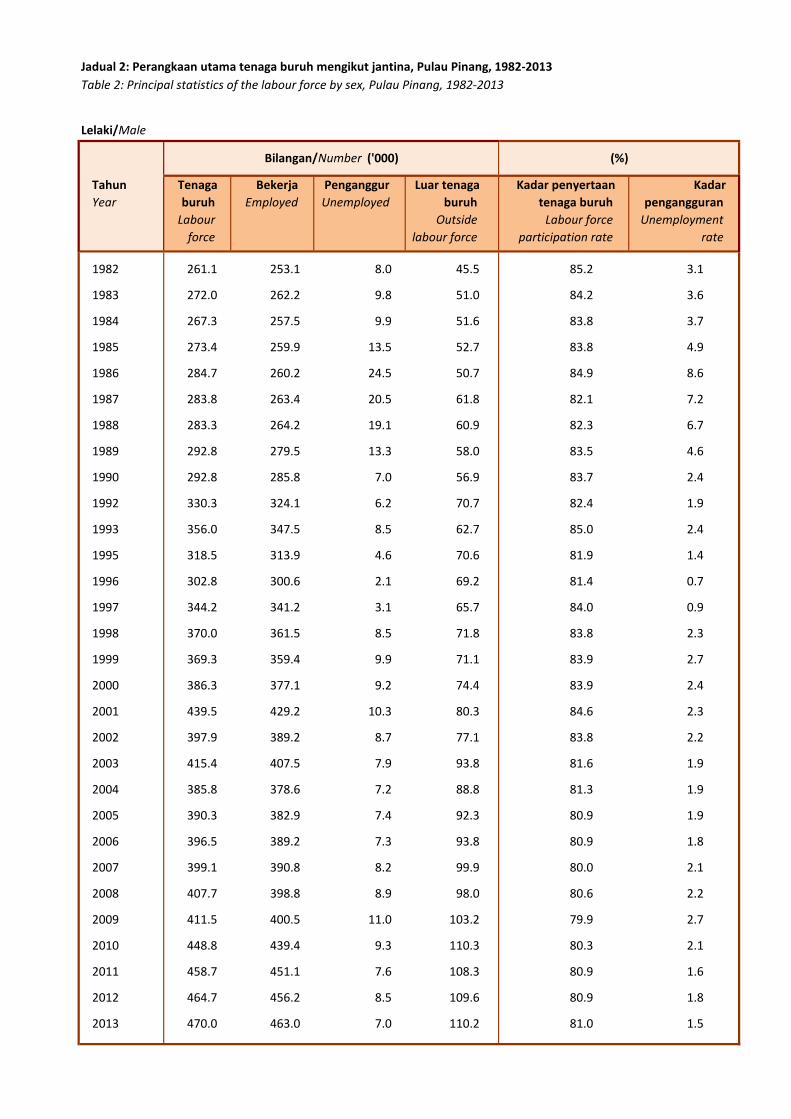
1982 261.1 253.1 8.0 45.5 85.2 3.1
1983 272.0 262.2 9.8 51.0 84.2 3.6
1984 267.3 257.5 9.9 51.6 83.8 3.7
1985 273.4 259.9 13.5 52.7 83.8 4.9
1986 284.7 260.2 24.5 50.7 84.9 8.6
1987 283.8 263.4 20.5 61.8 82.1 7.2
1988 283.3 264.2 19.1 60.9 82.3 6.7
1989 292.8 279.5 13.3 58.0 83.5 4.6
1990 292.8 285.8 7.0 56.9 83.7 2.4
1992 330.3 324.1 6.2 70.7 82.4 1.9
1993 356.0 347.5 8.5 62.7 85.0 2.4
1995 318.5 313.9 4.6 70.6 81.9 1.4
1996 302.8 300.6 2.1 69.2 81.4 0.7
1997 344.2 341.2 3.1 65.7 84.0 0.9
1998 370.0 361.5 8.5 71.8 83.8 2.3
1999 369.3 359.4 9.9 71.1 83.9 2.7
2000 386.3 377.1 9.2 74.4 83.9 2.4
2001 439.5 429.2 10.3 80.3 84.6 2.3
2002 397.9 389.2 8.7 77.1 83.8 2.2
2003 415.4 407.5 7.9 93.8 81.6 1.9
2004 385.8 378.6 7.2 88.8 81.3 1.9
2005 390.3 382.9 7.4 92.3 80.9 1.9
2006 396.5 389.2 7.3 93.8 80.9 1.8
2007 399.1 390.8 8.2 99.9 80.0 2.1
2008 407.7 398.8 8.9 98.0 80.6 2.2
2009 411.5 400.5 11.0 103.2 79.9 2.7
2010 448.8 439.4 9.3 110.3 80.3 2.1
2011 458.7 451.1 7.6 108.3 80.9 1.6
2012 464.7 456.2 8.5 109.6 80.9 1.8
2013 470.0 463.0 7.0 110.2 81.0 1.5
Jadual 2: Perangkaan utama tenaga buruh mengikut jantina, Pulau Pinang, 1982-2013
Table 2: Principal statistics of the labour force by sex, Pulau Pinang, 1982-2013
Bilangan/Number ('000) (%)

Perempuan/Female
Tahun
Year
Tenaga
buruh
Labour
force
Bekerja
Employed
Penganggur
Unemployed
Luar tenaga
buruh
Outside
labour force
Kadar penyertaan
tenaga buruh
Labour force
participation rate
Kadar
pengangguran
Unemployment
rate
1982 134.9 129.2 5.7 177.0 43.2 4.2
1983 149.0 142.6 6.4 182.7 44.9 4.3
1984 130.5 126.2 4.3 194.2 40.2 3.3
1985 135.1 128.2 7.0 205.8 39.6 5.2
1986 142.5 131.2 11.3 204.6 41.1 7.9
1987 149.0 141.5 7.6 206.4 41.9 5.1
1988 144.5 134.7 9.8 199.7 42.0 6.8
1989 161.0 156.8 4.3 194.3 45.3 2.7
1990 177.5 171.4 6.1 182.9 49.2 3.4
1992 191.2 188.6 2.6 222.8 46.2 1.4
1993 187.1 183.5 3.6 229.9 44.9 1.9
1995 174.3 172.0 2.3 217.3 44.5 1.3
1996 149.7 148.8 0.8 225.1 39.9 0.6
1997 213.7 210.8 2.9 194.1 52.4 1.4
1998 229.2 223.7 5.5 207.0 52.5 2.4
1999 248.1 243.5 4.7 202.9 55.0 1.9
2000 296.0 292.1 3.9 206.5 58.9 1.3
2001 293.8 285.7 8.1 215.3 57.7 2.7
2002 259.4 253.9 5.5 226.0 53.4 2.1
2003 270.9 266.8 4.0 248.5 52.2 1.5
2004 250.9 246.4 4.5 238.0 51.3 1.8
2005 244.6 238.6 6.1 253.0 49.2 2.5
2006 262.4 258.5 3.9 245.6 51.7 1.5
2007 268.5 262.7 5.8 248.7 51.9 2.2
2008 280.7 276.1 4.6 245.3 53.4 1.6
2009 295.7 289.3 6.4 241.1 55.1 2.2
2010 310.2 302.9 7.3 242.0 56.2 2.4
2011 322.8 315.9 6.9 238.2 57.5 2.1
2012 321.4 314.2 7.2 247.0 56.5 2.2
2013 327.7 321.3 6.5 247.3 57.0 2.0
Jadual 2: Perangkaan utama tenaga buruh mengikut jantina, Pulau Pinang, 1982-2013 (samb.)
Table 2: Principal statistics of the labour force by sex, Pulau Pinang, 1982-2013 (cont'd)
Bilangan/Number ('000) (%)
Lelaki/Male
Tahun
Year
Tenaga
buruh
Labour
force
Bekerja
Employed
Penganggur
Unemployed
Luar tenaga
buruh
Outside
labour force
Kadar penyertaan
tenaga buruh
Labour force
participation rate
Kadar
pengangguran
Unemployment
rate
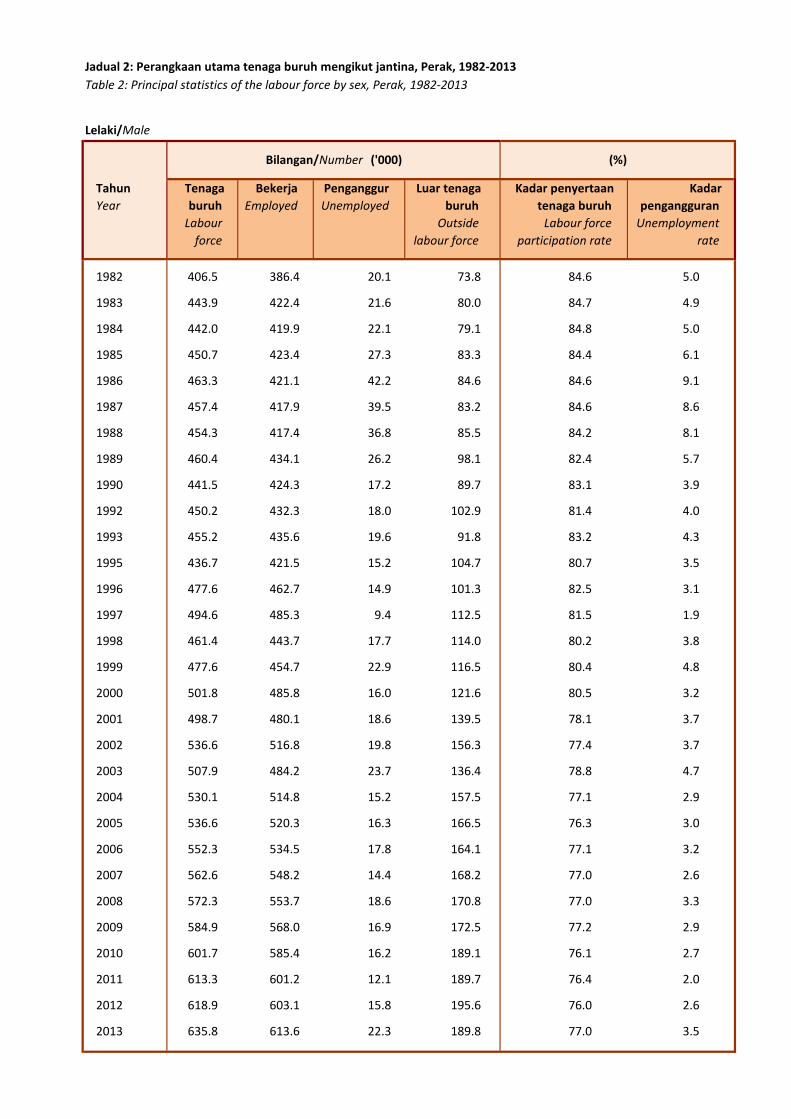
1982 406.5 386.4 20.1 73.8 84.6 5.0
1983 443.9 422.4 21.6 80.0 84.7 4.9
1984 442.0 419.9 22.1 79.1 84.8 5.0
1985 450.7 423.4 27.3 83.3 84.4 6.1
1986 463.3 421.1 42.2 84.6 84.6 9.1
1987 457.4 417.9 39.5 83.2 84.6 8.6
1988 454.3 417.4 36.8 85.5 84.2 8.1
1989 460.4 434.1 26.2 98.1 82.4 5.7
1990 441.5 424.3 17.2 89.7 83.1 3.9
1992 450.2 432.3 18.0 102.9 81.4 4.0
1993 455.2 435.6 19.6 91.8 83.2 4.3
1995 436.7 421.5 15.2 104.7 80.7 3.5
1996 477.6 462.7 14.9 101.3 82.5 3.1
1997 494.6 485.3 9.4 112.5 81.5 1.9
1998 461.4 443.7 17.7 114.0 80.2 3.8
1999 477.6 454.7 22.9 116.5 80.4 4.8
2000 501.8 485.8 16.0 121.6 80.5 3.2
2001 498.7 480.1 18.6 139.5 78.1 3.7
2002 536.6 516.8 19.8 156.3 77.4 3.7
2003 507.9 484.2 23.7 136.4 78.8 4.7
2004 530.1 514.8 15.2 157.5 77.1 2.9
2005 536.6 520.3 16.3 166.5 76.3 3.0
2006 552.3 534.5 17.8 164.1 77.1 3.2
2007 562.6 548.2 14.4 168.2 77.0 2.6
2008 572.3 553.7 18.6 170.8 77.0 3.3
2009 584.9 568.0 16.9 172.5 77.2 2.9
2010 601.7 585.4 16.2 189.1 76.1 2.7
2011 613.3 601.2 12.1 189.7 76.4 2.0
2012 618.9 603.1 15.8 195.6 76.0 2.6
2013 635.8 613.6 22.3 189.8 77.0 3.5
Jadual 2: Perangkaan utama tenaga buruh mengikut jantina, Perak, 1982-2013
Table 2: Principal statistics of the labour force by sex, Perak, 1982-2013
Bilangan/Number ('000) (%)

Perempuan/Female
Tahun
Year
Tenaga
buruh
Labour
force
Bekerja
Employed
Penganggur
Unemployed
Luar tenaga
buruh
Outside
labour force
Kadar penyertaan
tenaga buruh
Labour force
participation rate
Kadar
pengangguran
Unemployment
rate
1982 232.1 217.6 14.5 286.3 44.8 6.2
1983 261.0 246.8 14.1 279.8 48.3 5.4
1984 255.2 239.7 15.5 297.9 46.1 6.1
1985 262.4 246.2 16.2 307.6 46.0 6.2
1986 270.9 248.8 22.1 306.2 46.9 8.2
1987 271.3 252.6 18.8 299.7 47.5 6.9
1988 260.7 239.3 21.4 313.7 45.4 8.2
1989 266.1 252.6 13.5 327.1 44.9 5.4
1990 265.3 253.9 11.4 314.0 45.8 4.3
1992 269.4 260.6 8.8 336.7 44.5 3.3
1993 244.4 234.1 10.2 341.2 41.7 4.2
1995 223.2 212.8 10.4 369.4 37.7 4.7
1996 269.3 260.4 8.9 342.0 44.1 3.3
1997 265.9 258.9 7.0 378.3 41.3 2.6
1998 251.3 241.3 10.1 349.0 41.9 4.0
1999 237.8 229.8 8.0 364.9 39.5 3.4
2000 269.5 258.3 11.2 360.2 42.8 4.2
2001 262.6 250.6 12.0 374.0 41.2 4.6
2002 284.0 271.5 12.5 420.8 40.3 4.4
2003 263.5 250.5 13.0 388.4 40.4 5.0
2004 288.2 276.2 12.1 396.5 42.1 4.2
2005 292.2 280.9 11.3 407.3 41.8 3.9
2006 293.2 281.3 11.8 419.0 41.2 4.0
2007 315.3 304.0 11.3 410.9 43.4 3.6
2008 320.3 305.2 15.1 418.1 43.4 4.7
2009 338.8 323.5 15.3 410.9 45.2 4.5
2010 304.3 293.3 11.1 453.1 40.2 3.6
2011 329.9 317.1 12.8 440.5 42.8 3.9
2012 333.8 321.2 12.6 451.0 42.5 3.8
2013 340.4 324.8 15.6 454.2 42.8 4.6
Jadual 2: Perangkaan utama tenaga buruh mengikut jantina, Perak, 1982-2013 (samb.)
Table 2: Principal statistics of the labour force by sex, Perak, 1982-2013 (cont'd)
Bilangan/Number ('000) (%)

Lelaki/Male
Tahun
Year
Tenaga
buruh
Labour
force
Bekerja
Employed
Penganggur
Unemployed
Luar tenaga
buruh
Outside
labour force
Kadar penyertaan
tenaga buruh
Labour force
participation rate
Kadar
pengangguran
Unemployment
rate
1982 39.3 38.3 1.0 7.6 83.8 2.6
1983 48.3 47.0 1.3 9.0 84.3 2.6
1984 44.5 43.5 1.0 6.4 87.4 2.3
1985 44.7 43.0 1.7 6.1 87.9 3.9
1986 42.1 39.8 2.3 6.9 86.0 5.4
1987 46.0 43.3 2.8 7.5 86.0 6.0
1988 51.2 48.0 3.2 7.1 87.7 6.2
1989 49.5 46.8 2.8 9.7 83.7 5.6
1990 42.4 40.6 1.8 8.9 82.6 4.2
1992 47.8 46.6 1.2 7.1 87.1 2.5
1993 51.6 50.9 0.7 7.5 87.3 1.4
1995 50.9 50.3 0.6 9.3 84.6 1.2
1996 49.4 48.5 0.9 9.4 84.0 1.8
1997 48.7 47.8 0.9 11.1 81.5 1.9
1998 51.7 49.9 1.9 12.1 81.1 3.6
1999 52.6 50.8 1.8 12.6 80.7 3.3
2000 50.2 48.9 1.3 10.9 82.2 2.5
2001 57.1 55.5 1.6 13.6 80.8 2.7
2002 39.5 38.5 1.0 9.8 80.1 2.6
2003 52.8 50.8 2.0 13.4 79.7 3.7
2004 49.1 47.6 1.5 14.7 76.9 3.0
2005 48.8 47.3 1.5 16.1 75.1 3.0
2006 50.6 49.0 1.5 15.8 76.2 3.0
2007 52.0 50.7 1.2 16.0 76.5 2.4
2008 52.3 50.8 1.5 17.1 75.4 2.9
2009 53.9 52.3 1.7 16.7 76.3 3.1
2010 55.7 53.8 1.9 20.4 73.2 3.5
2011 57.6 55.4 2.2 19.8 74.5 3.7
2012 58.2 55.8 2.4 20.0 74.4 4.1
2013 61.0 58.7 2.2 18.0 77.2 3.7
Jadual 2: Perangkaan utama tenaga buruh mengikut jantina, Perlis, 1982-2013
Table 2: Principal statistics of the labour force by sex, Perlis, 1982-2013
Bilangan/Number ('000) (%)
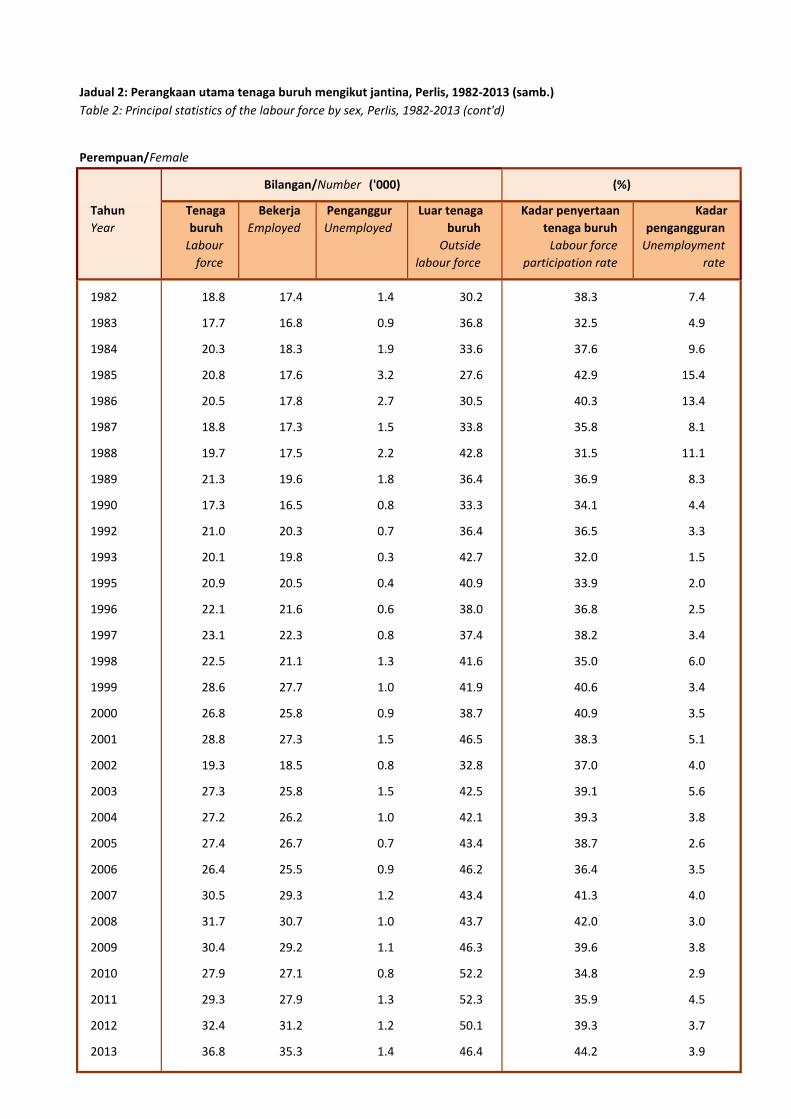
Perempuan/Female
Tahun
Year
Tenaga
buruh
Labour
force
Bekerja
Employed
Penganggur
Unemployed
Luar tenaga
buruh
Outside
labour force
Kadar penyertaan
tenaga buruh
Labour force
participation rate
Kadar
pengangguran
Unemployment
rate
1982 18.8 17.4 1.4 30.2 38.3 7.4
1983 17.7 16.8 0.9 36.8 32.5 4.9
1984 20.3 18.3 1.9 33.6 37.6 9.6
1985 20.8 17.6 3.2 27.6 42.9 15.4
1986 20.5 17.8 2.7 30.5 40.3 13.4
1987 18.8 17.3 1.5 33.8 35.8 8.1
1988 19.7 17.5 2.2 42.8 31.5 11.1
1989 21.3 19.6 1.8 36.4 36.9 8.3
1990 17.3 16.5 0.8 33.3 34.1 4.4
1992 21.0 20.3 0.7 36.4 36.5 3.3
1993 20.1 19.8 0.3 42.7 32.0 1.5
1995 20.9 20.5 0.4 40.9 33.9 2.0
1996 22.1 21.6 0.6 38.0 36.8 2.5
1997 23.1 22.3 0.8 37.4 38.2 3.4
1998 22.5 21.1 1.3 41.6 35.0 6.0
1999 28.6 27.7 1.0 41.9 40.6 3.4
2000 26.8 25.8 0.9 38.7 40.9 3.5
2001 28.8 27.3 1.5 46.5 38.3 5.1
2002 19.3 18.5 0.8 32.8 37.0 4.0
2003 27.3 25.8 1.5 42.5 39.1 5.6
2004 27.2 26.2 1.0 42.1 39.3 3.8
2005 27.4 26.7 0.7 43.4 38.7 2.6
2006 26.4 25.5 0.9 46.2 36.4 3.5
2007 30.5 29.3 1.2 43.4 41.3 4.0
2008 31.7 30.7 1.0 43.7 42.0 3.0
2009 30.4 29.2 1.1 46.3 39.6 3.8
2010 27.9 27.1 0.8 52.2 34.8 2.9
2011 29.3 27.9 1.3 52.3 35.9 4.5
2012 32.4 31.2 1.2 50.1 39.3 3.7
2013 36.8 35.3 1.4 46.4 44.2 3.9
Jadual 2: Perangkaan utama tenaga buruh mengikut jantina, Perlis, 1982-2013 (samb.)
Table 2: Principal statistics of the labour force by sex, Perlis, 1982-2013 (cont'd)
Bilangan/Number ('000) (%)
Lelaki/Male
Tahun
Year
Tenaga
buruh
Labour
force
Bekerja
Employed
Penganggur
Unemployed
Luar tenaga
buruh
Outside
labour force
Kadar penyertaan
tenaga buruh
Labour force
participation rate
Kadar
pengangguran
Unemployment
rate
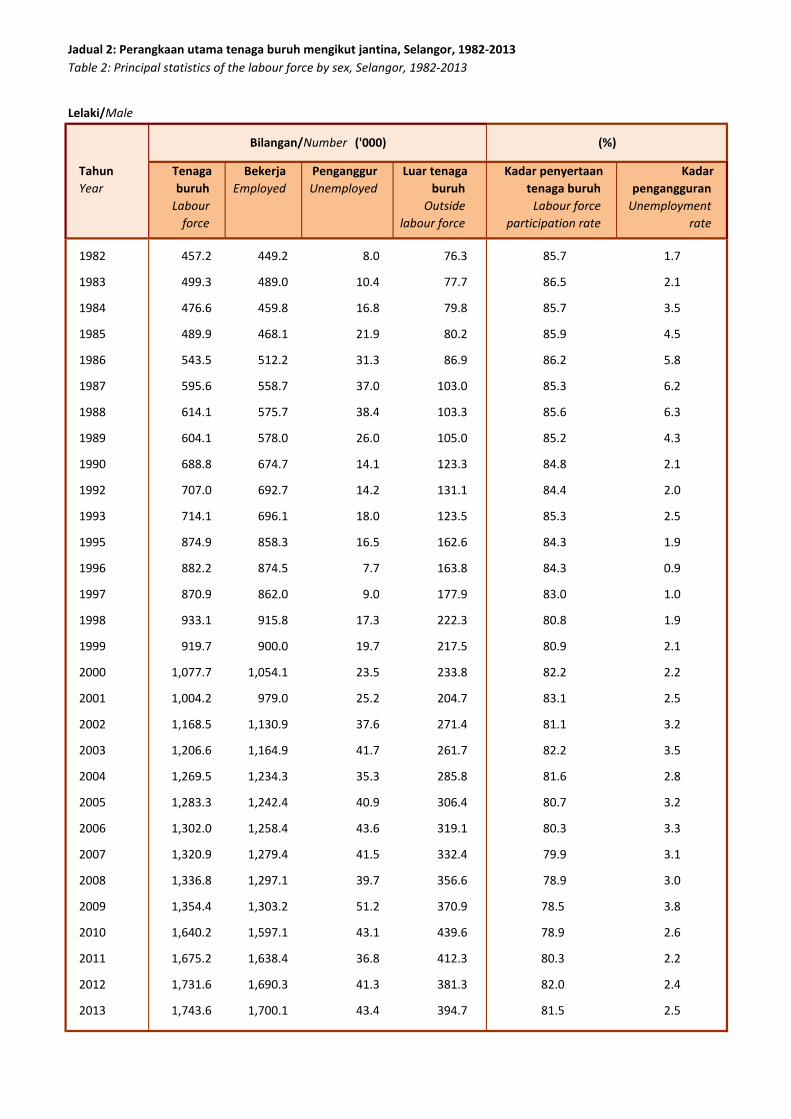
1982 457.2 449.2 8.0 76.3 85.7 1.7
1983 499.3 489.0 10.4 77.7 86.5 2.1
1984 476.6 459.8 16.8 79.8 85.7 3.5
1985 489.9 468.1 21.9 80.2 85.9 4.5
1986 543.5 512.2 31.3 86.9 86.2 5.8
1987 595.6 558.7 37.0 103.0 85.3 6.2
1988 614.1 575.7 38.4 103.3 85.6 6.3
1989 604.1 578.0 26.0 105.0 85.2 4.3
1990 688.8 674.7 14.1 123.3 84.8 2.1
1992 707.0 692.7 14.2 131.1 84.4 2.0
1993 714.1 696.1 18.0 123.5 85.3 2.5
1995 874.9 858.3 16.5 162.6 84.3 1.9
1996 882.2 874.5 7.7 163.8 84.3 0.9
1997 870.9 862.0 9.0 177.9 83.0 1.0
1998 933.1 915.8 17.3 222.3 80.8 1.9
1999 919.7 900.0 19.7 217.5 80.9 2.1
2000 1,077.7 1,054.1 23.5 233.8 82.2 2.2
2001 1,004.2 979.0 25.2 204.7 83.1 2.5
2002 1,168.5 1,130.9 37.6 271.4 81.1 3.2
2003 1,206.6 1,164.9 41.7 261.7 82.2 3.5
2004 1,269.5 1,234.3 35.3 285.8 81.6 2.8
2005 1,283.3 1,242.4 40.9 306.4 80.7 3.2
2006 1,302.0 1,258.4 43.6 319.1 80.3 3.3
2007 1,320.9 1,279.4 41.5 332.4 79.9 3.1
2008 1,336.8 1,297.1 39.7 356.6 78.9 3.0
2009 1,354.4 1,303.2 51.2 370.9 78.5 3.8
2010 1,640.2 1,597.1 43.1 439.6 78.9 2.6
2011 1,675.2 1,638.4 36.8 412.3 80.3 2.2
2012 1,731.6 1,690.3 41.3 381.3 82.0 2.4
2013 1,743.6 1,700.1 43.4 394.7 81.5 2.5
Jadual 2: Perangkaan utama tenaga buruh mengikut jantina, Selangor, 1982-2013
Table 2: Principal statistics of the labour force by sex, Selangor, 1982-2013
Bilangan/Number ('000) (%)
Perempuan/Female
Tahun
Year
Tenaga
buruh
Labour
force
Bekerja
Employed
Penganggur
Unemployed
Luar tenaga
buruh
Outside
labour force
Kadar penyertaan
tenaga buruh
Labour force
participation rate
Kadar
pengangguran
Unemployment
rate
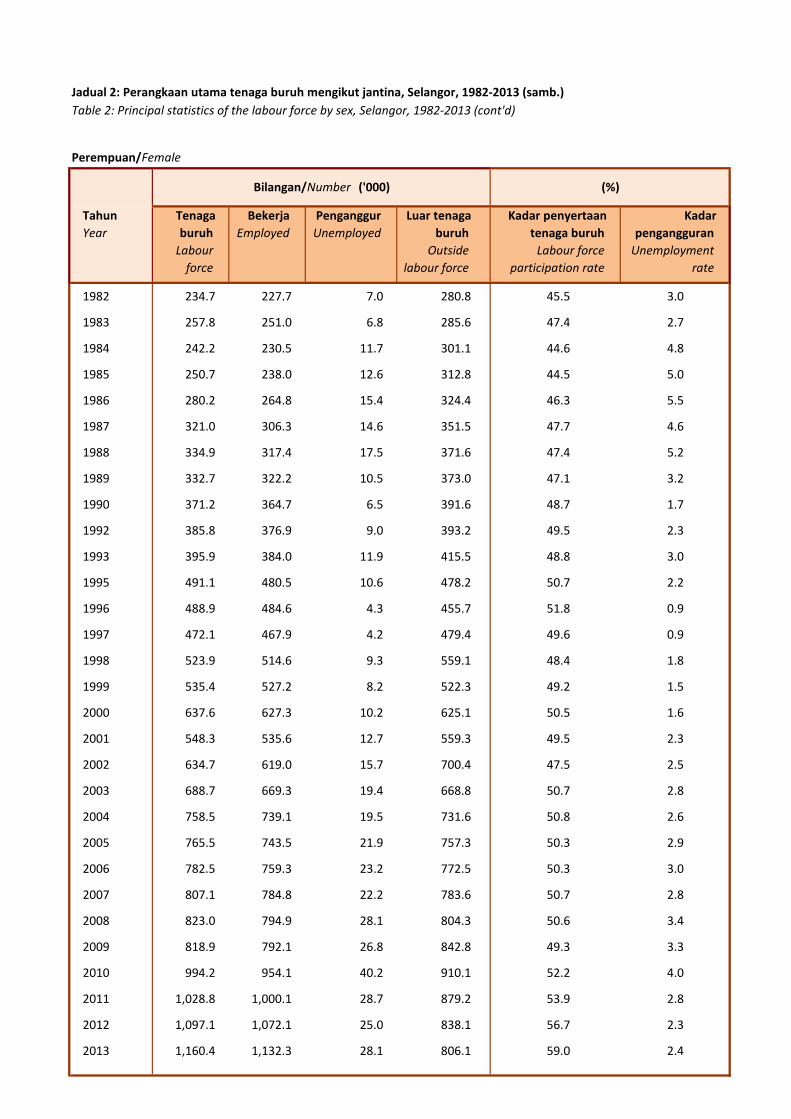
1982 234.7 227.7 7.0 280.8 45.5 3.0
1983 257.8 251.0 6.8 285.6 47.4 2.7
1984 242.2 230.5 11.7 301.1 44.6 4.8
1985 250.7 238.0 12.6 312.8 44.5 5.0
1986 280.2 264.8 15.4 324.4 46.3 5.5
1987 321.0 306.3 14.6 351.5 47.7 4.6
1988 334.9 317.4 17.5 371.6 47.4 5.2
1989 332.7 322.2 10.5 373.0 47.1 3.2
1990 371.2 364.7 6.5 391.6 48.7 1.7
1992 385.8 376.9 9.0 393.2 49.5 2.3
1993 395.9 384.0 11.9 415.5 48.8 3.0
1995 491.1 480.5 10.6 478.2 50.7 2.2
1996 488.9 484.6 4.3 455.7 51.8 0.9
1997 472.1 467.9 4.2 479.4 49.6 0.9
1998 523.9 514.6 9.3 559.1 48.4 1.8
1999 535.4 527.2 8.2 522.3 49.2 1.5
2000 637.6 627.3 10.2 625.1 50.5 1.6
2001 548.3 535.6 12.7 559.3 49.5 2.3
2002 634.7 619.0 15.7 700.4 47.5 2.5
2003 688.7 669.3 19.4 668.8 50.7 2.8
2004 758.5 739.1 19.5 731.6 50.8 2.6
2005 765.5 743.5 21.9 757.3 50.3 2.9
2006 782.5 759.3 23.2 772.5 50.3 3.0
2007 807.1 784.8 22.2 783.6 50.7 2.8
2008 823.0 794.9 28.1 804.3 50.6 3.4
2009 818.9 792.1 26.8 842.8 49.3 3.3
2010 994.2 954.1 40.2 910.1 52.2 4.0
2011 1,028.8 1,000.1 28.7 879.2 53.9 2.8
2012 1,097.1 1,072.1 25.0 838.1 56.7 2.3
2013 1,160.4 1,132.3 28.1 806.1 59.0 2.4
Jadual 2: Perangkaan utama tenaga buruh mengikut jantina, Selangor, 1982-2013 (samb.)
Table 2: Principal statistics of the labour force by sex, Selangor, 1982-2013 (cont'd)
Bilangan/Number ('000) (%)
Lelaki/Male
Tahun
Year
Tenaga
buruh
Labour
force
Bekerja
Employed
Penganggur
Unemployed
Luar tenaga
buruh
Outside
labour force
Kadar penyertaan
tenaga buruh
Labour force
participation rate
Kadar
pengangguran
Unemployment
rate
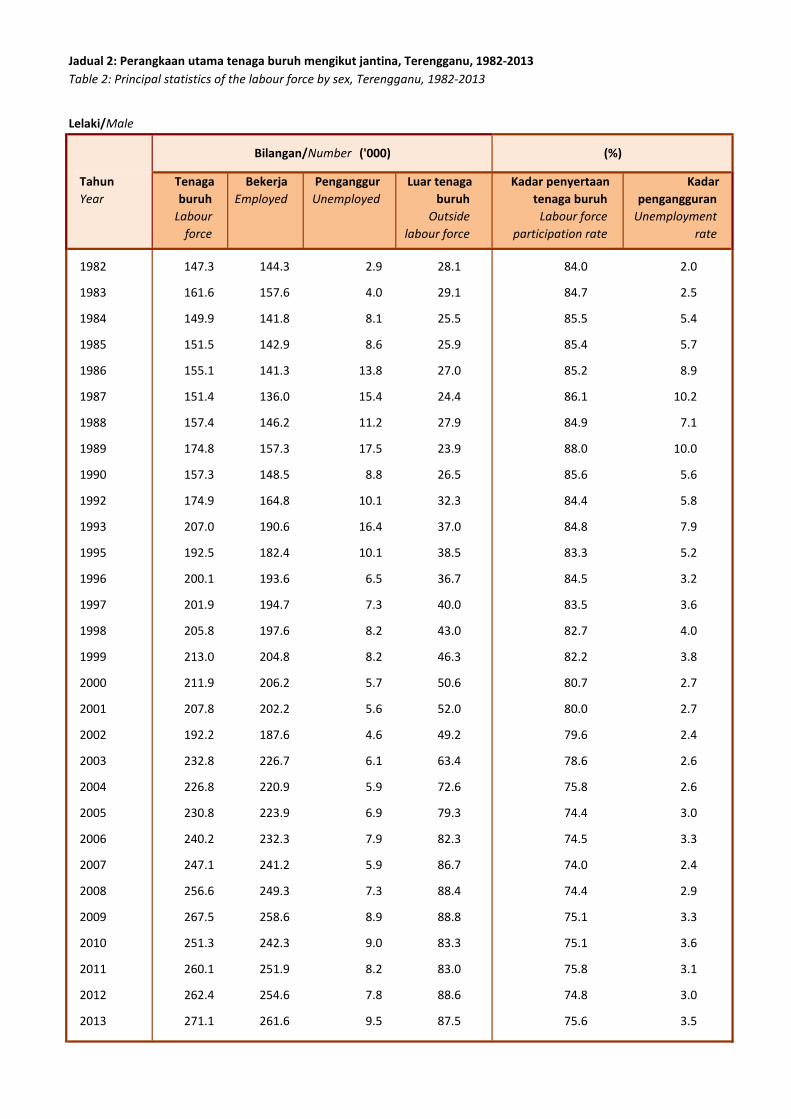
1982 147.3 144.3 2.9 28.1 84.0 2.0
1983 161.6 157.6 4.0 29.1 84.7 2.5
1984 149.9 141.8 8.1 25.5 85.5 5.4
1985 151.5 142.9 8.6 25.9 85.4 5.7
1986 155.1 141.3 13.8 27.0 85.2 8.9
1987 151.4 136.0 15.4 24.4 86.1 10.2
1988 157.4 146.2 11.2 27.9 84.9 7.1
1989 174.8 157.3 17.5 23.9 88.0 10.0
1990 157.3 148.5 8.8 26.5 85.6 5.6
1992 174.9 164.8 10.1 32.3 84.4 5.8
1993 207.0 190.6 16.4 37.0 84.8 7.9
1995 192.5 182.4 10.1 38.5 83.3 5.2
1996 200.1 193.6 6.5 36.7 84.5 3.2
1997 201.9 194.7 7.3 40.0 83.5 3.6
1998 205.8 197.6 8.2 43.0 82.7 4.0
1999 213.0 204.8 8.2 46.3 82.2 3.8
2000 211.9 206.2 5.7 50.6 80.7 2.7
2001 207.8 202.2 5.6 52.0 80.0 2.7
2002 192.2 187.6 4.6 49.2 79.6 2.4
2003 232.8 226.7 6.1 63.4 78.6 2.6
2004 226.8 220.9 5.9 72.6 75.8 2.6
2005 230.8 223.9 6.9 79.3 74.4 3.0
2006 240.2 232.3 7.9 82.3 74.5 3.3
2007 247.1 241.2 5.9 86.7 74.0 2.4
2008 256.6 249.3 7.3 88.4 74.4 2.9
2009 267.5 258.6 8.9 88.8 75.1 3.3
2010 251.3 242.3 9.0 83.3 75.1 3.6
2011 260.1 251.9 8.2 83.0 75.8 3.1
2012 262.4 254.6 7.8 88.6 74.8 3.0
2013 271.1 261.6 9.5 87.5 75.6 3.5
Jadual 2: Perangkaan utama tenaga buruh mengikut jantina, Terengganu, 1982-2013
Table 2: Principal statistics of the labour force by sex, Terengganu, 1982-2013
Bilangan/Number ('000) (%)

Perempuan/Female
Tahun
Year
Tenaga
buruh
Labour
force
Bekerja
Employed
Penganggur
Unemployed
Luar tenaga
buruh
Outside
labour force
Kadar penyertaan
tenaga buruh
Labour force
participation rate
Kadar
pengangguran
Unemployment
rate
1982 80.0 76.8 3.2 93.8 46.0 4.0
1983 81.5 79.3 2.2 109.5 42.7 2.7
1984 69.4 62.7 6.8 104.2 40.0 9.7
1985 77.4 69.6 7.8 102.2 43.1 10.1
1986 86.3 77.1 9.2 97.7 46.9 10.7
1987 85.1 73.0 12.1 92.6 47.9 14.3
1988 96.3 83.7 12.6 84.5 53.2 13.1
1989 87.3 72.7 14.7 99.3 46.8 16.8
1990 87.2 79.1 8.1 91.0 48.9 9.3
1992 92.9 88.1 4.7 110.9 45.6 5.1
1993 95.1 90.3 4.8 128.2 42.6 5.1
1995 92.4 85.6 6.9 133.8 40.9 7.4
1996 108.0 104.4 3.7 128.1 45.7 3.4
1997 90.9 87.6 3.3 138.6 39.6 3.7
1998 99.8 95.8 4.0 138.2 41.9 4.0
1999 99.3 95.3 4.0 136.1 42.2 4.0
2000 103.5 99.8 3.7 140.2 42.5 3.6
2001 99.3 96.4 2.8 143.1 41.0 2.9
2002 96.6 92.0 4.6 137.8 41.2 4.7
2003 122.3 118.2 4.1 161.6 43.1 3.3
2004 121.1 116.0 5.1 161.8 42.8 4.2
2005 122.3 118.1 4.2 171.1 41.7 3.4
2006 124.4 119.3 5.2 179.4 41.0 4.2
2007 125.6 121.8 3.8 187.5 40.1 3.0
2008 132.2 126.3 5.9 191.9 40.8 4.5
2009 138.1 131.7 6.4 195.9 41.4 4.7
2010 129.3 124.2 5.0 188.8 40.6 3.9
2011 141.4 136.7 4.7 185.4 43.3 3.3
2012 138.8 134.5 4.4 197.0 41.3 3.1
2013 151.2 146.3 5.0 193.2 43.9 3.3
Jadual 2: Perangkaan utama tenaga buruh mengikut jantina, Terengganu, 1982-2013 (samb.)
Table 2: Principal statistics of the labour force by sex, Terengganu, 1982-2013 (cont'd)
Bilangan/Number ('000) (%)
Lelaki/Male
Tahun
Year
Tenaga
buruh
Labour
force
Bekerja
Employed
Penganggur
Unemployed
Luar tenaga
buruh
Outside
labour force
Kadar penyertaan
tenaga buruh
Labour force
participation rate
Kadar
pengangguran
Unemployment
rate
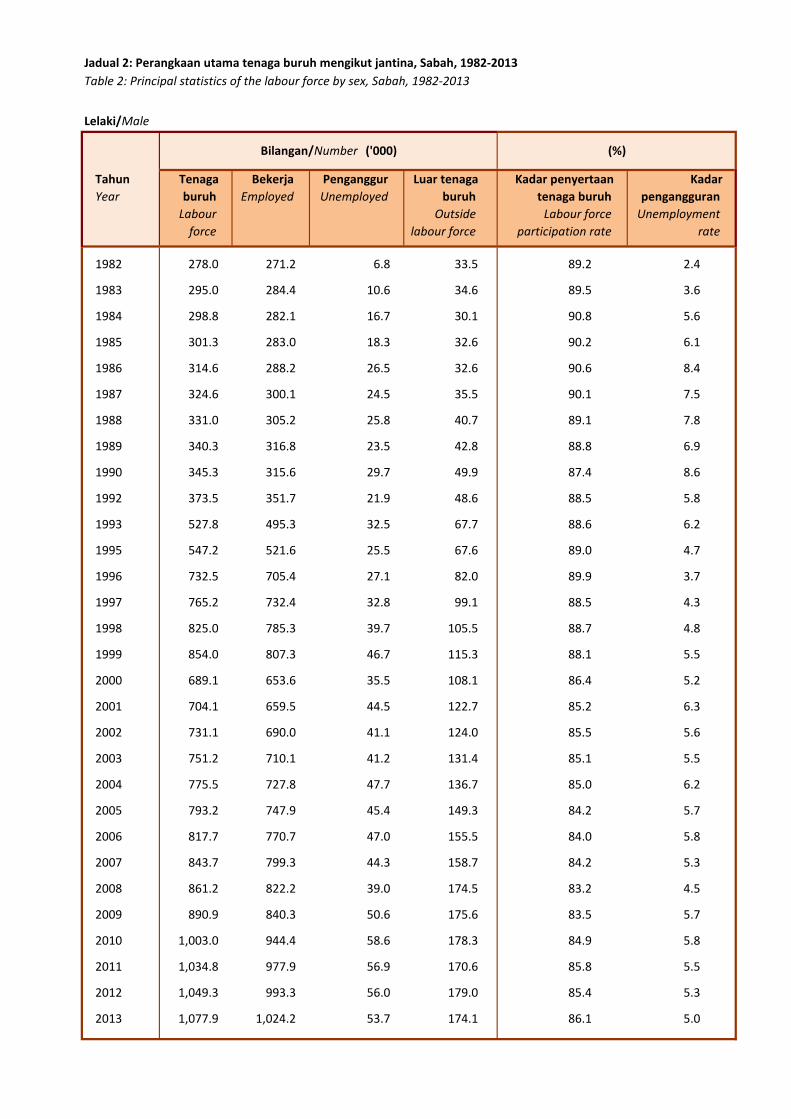
1982 278.0 271.2 6.8 33.5 89.2 2.4
1983 295.0 284.4 10.6 34.6 89.5 3.6
1984 298.8 282.1 16.7 30.1 90.8 5.6
1985 301.3 283.0 18.3 32.6 90.2 6.1
1986 314.6 288.2 26.5 32.6 90.6 8.4
1987 324.6 300.1 24.5 35.5 90.1 7.5
1988 331.0 305.2 25.8 40.7 89.1 7.8
1989 340.3 316.8 23.5 42.8 88.8 6.9
1990 345.3 315.6 29.7 49.9 87.4 8.6
1992 373.5 351.7 21.9 48.6 88.5 5.8
1993 527.8 495.3 32.5 67.7 88.6 6.2
1995 547.2 521.6 25.5 67.6 89.0 4.7
1996 732.5 705.4 27.1 82.0 89.9 3.7
1997 765.2 732.4 32.8 99.1 88.5 4.3
1998 825.0 785.3 39.7 105.5 88.7 4.8
1999 854.0 807.3 46.7 115.3 88.1 5.5
2000 689.1 653.6 35.5 108.1 86.4 5.2
2001 704.1 659.5 44.5 122.7 85.2 6.3
2002 731.1 690.0 41.1 124.0 85.5 5.6
2003 751.2 710.1 41.2 131.4 85.1 5.5
2004 775.5 727.8 47.7 136.7 85.0 6.2
2005 793.2 747.9 45.4 149.3 84.2 5.7
2006 817.7 770.7 47.0 155.5 84.0 5.8
2007 843.7 799.3 44.3 158.7 84.2 5.3
2008 861.2 822.2 39.0 174.5 83.2 4.5
2009 890.9 840.3 50.6 175.6 83.5 5.7
2010 1,003.0 944.4 58.6 178.3 84.9 5.8
2011 1,034.8 977.9 56.9 170.6 85.8 5.5
2012 1,049.3 993.3 56.0 179.0 85.4 5.3
2013 1,077.9 1,024.2 53.7 174.1 86.1 5.0
Jadual 2: Perangkaan utama tenaga buruh mengikut jantina, Sabah, 1982-2013
Table 2: Principal statistics of the labour force by sex, Sabah, 1982-2013
Bilangan/Number ('000) (%)
Perempuan/Female
Tahun
Year
Tenaga
buruh
Labour
force
Bekerja
Employed
Penganggur
Unemployed
Luar tenaga
buruh
Outside
labour force
Kadar penyertaan
tenaga buruh
Labour force
participation rate
Kadar
pengangguran
Unemployment
rate
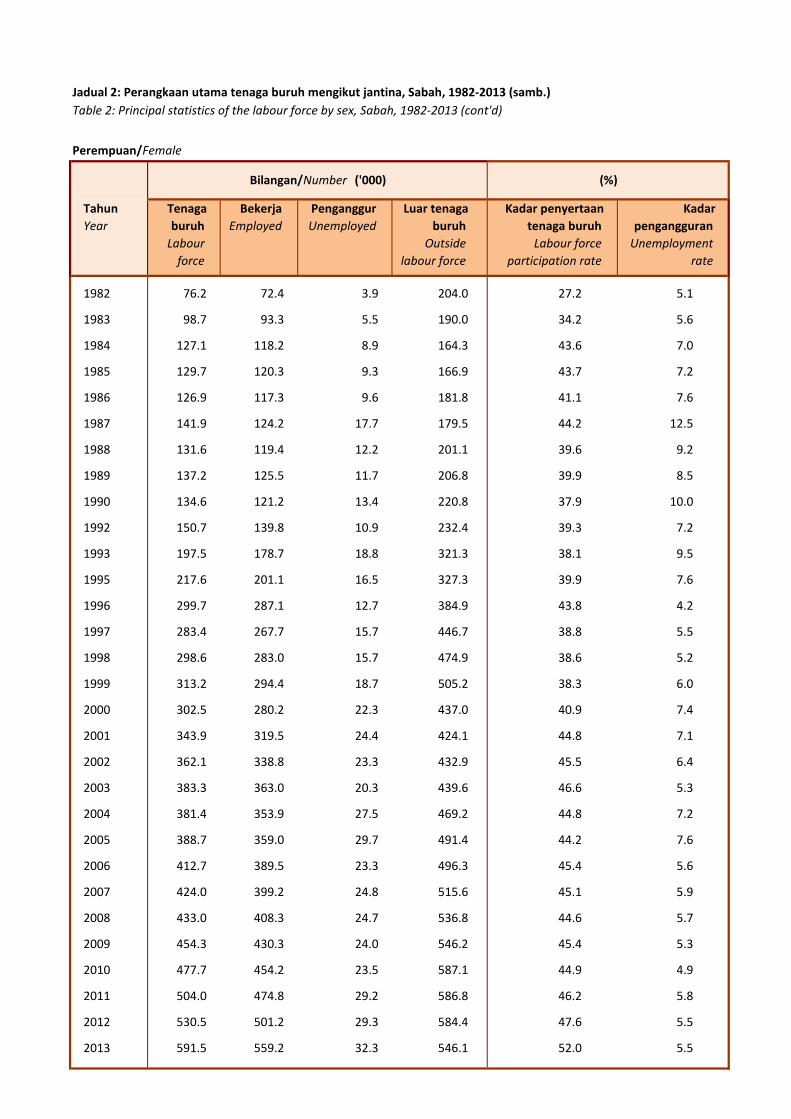
1982 76.2 72.4 3.9 204.0 27.2 5.1
1983 98.7 93.3 5.5 190.0 34.2 5.6
1984 127.1 118.2 8.9 164.3 43.6 7.0
1985 129.7 120.3 9.3 166.9 43.7 7.2
1986 126.9 117.3 9.6 181.8 41.1 7.6
1987 141.9 124.2 17.7 179.5 44.2 12.5
1988 131.6 119.4 12.2 201.1 39.6 9.2
1989 137.2 125.5 11.7 206.8 39.9 8.5
1990 134.6 121.2 13.4 220.8 37.9 10.0
1992 150.7 139.8 10.9 232.4 39.3 7.2
1993 197.5 178.7 18.8 321.3 38.1 9.5
1995 217.6 201.1 16.5 327.3 39.9 7.6
1996 299.7 287.1 12.7 384.9 43.8 4.2
1997 283.4 267.7 15.7 446.7 38.8 5.5
1998 298.6 283.0 15.7 474.9 38.6 5.2
1999 313.2 294.4 18.7 505.2 38.3 6.0
2000 302.5 280.2 22.3 437.0 40.9 7.4
2001 343.9 319.5 24.4 424.1 44.8 7.1
2002 362.1 338.8 23.3 432.9 45.5 6.4
2003 383.3 363.0 20.3 439.6 46.6 5.3
2004 381.4 353.9 27.5 469.2 44.8 7.2
2005 388.7 359.0 29.7 491.4 44.2 7.6
2006 412.7 389.5 23.3 496.3 45.4 5.6
2007 424.0 399.2 24.8 515.6 45.1 5.9
2008 433.0 408.3 24.7 536.8 44.6 5.7
2009 454.3 430.3 24.0 546.2 45.4 5.3
2010 477.7 454.2 23.5 587.1 44.9 4.9
2011 504.0 474.8 29.2 586.8 46.2 5.8
2012 530.5 501.2 29.3 584.4 47.6 5.5
2013 591.5 559.2 32.3 546.1 52.0 5.5
Jadual 2: Perangkaan utama tenaga buruh mengikut jantina, Sabah, 1982-2013 (samb.)
Table 2: Principal statistics of the labour force by sex, Sabah, 1982-2013 (cont'd)
Bilangan/Number ('000) (%)
Lelaki/Male
Tahun
Year
Tenaga
buruh
Labour
force
Bekerja
Employed
Penganggur
Unemployed
Luar tenaga
buruh
Outside
labour force
Kadar penyertaan
tenaga buruh
Labour force
participation rate
Kadar
pengangguran
Unemployment
rate
1982 338.2 329.8 8.4 43.4 88.6 2.5
1983 354.8 337.9 16.8 41.5 89.5 4.7
1984 373.9 353.4 20.5 40.4 90.2 5.5
1985 380.9 359.6 21.4 40.4 90.4 5.6
1986 399.3 370.7 28.6 39.0 91.1 7.2
1987 420.0 391.8 28.2 34.2 92.5 6.7
1988 415.0 385.9 29.0 38.3 91.6 7.0
1989 449.4 419.1 30.3 37.9 92.2 6.7
1990 453.9 417.7 36.2 46.9 90.6 8.0
1992 476.6 449.5 27.1 54.1 89.8 5.7
1993 506.6 479.1 27.5 50.5 90.9 5.4
1995 525.2 506.7 18.6 62.5 89.4 3.5
1996 548.5 527.2 21.2 64.5 89.5 3.9
1997 556.1 537.6 18.5 71.3 88.6 3.3
1998 560.9 535.7 25.2 83.4 87.1 4.5
1999 572.7 548.7 24.1 88.3 86.6 4.2
2000 568.3 546.4 21.9 77.5 88.0 3.8
2001 575.0 553.1 21.9 87.6 86.8 3.8
2002 581.5 561.6 19.9 97.1 85.7 3.4
2003 596.9 574.8 22.0 98.0 85.9 3.7
2004 601.9 579.6 22.3 109.6 84.6 3.7
2005 602.2 576.5 25.7 126.7 82.6 4.3
2006 620.2 595.7 24.5 124.2 83.3 3.9
2007 629.3 601.6 27.7 131.8 82.7 4.4
2008 633.6 600.0 33.6 145.0 81.4 5.3
2009 651.9 622.9 29.0 142.3 82.1 4.5
2010 707.2 678.5 28.7 148.3 82.7 4.1
2011 714.5 682.1 32.4 157.3 82.0 4.5
2012 742.6 716.7 25.9 143.6 83.8 3.5
2013 749.9 723.2 26.7 150.3 83.3 3.6
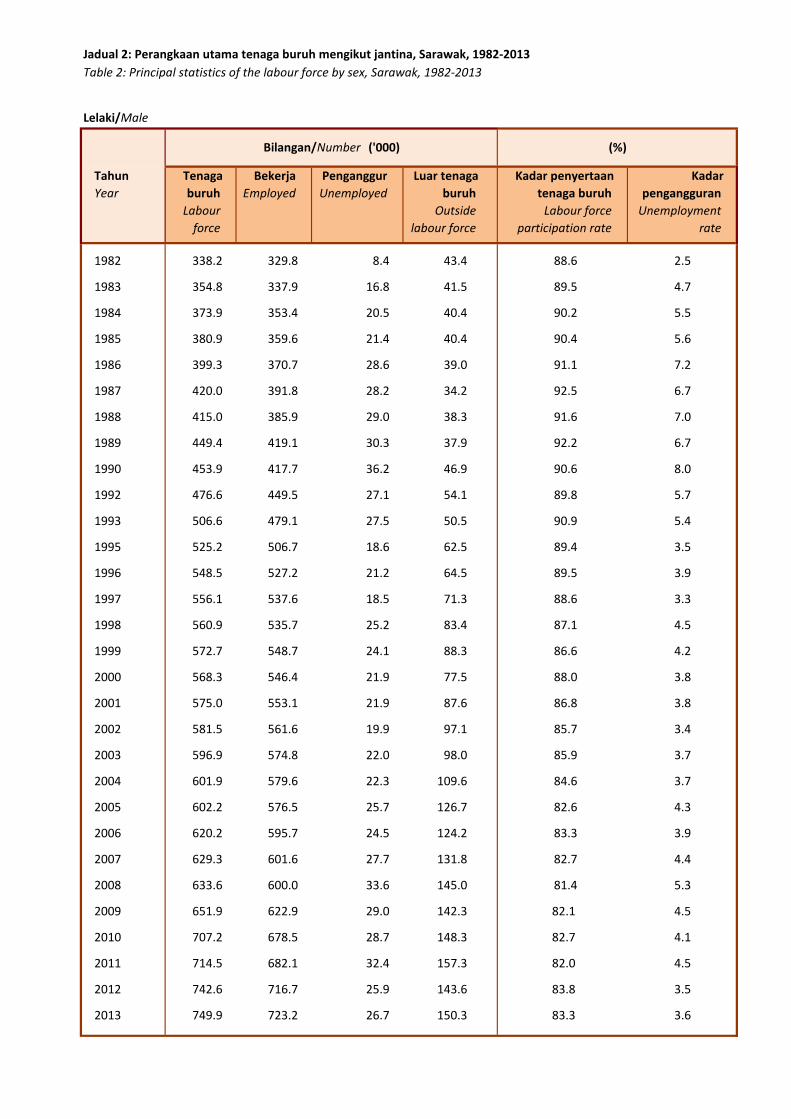
Jadual 2: Perangkaan utama tenaga buruh mengikut jantina, Sarawak, 1982-2013
Table 2: Principal statistics of the labour force by sex, Sarawak, 1982-2013
Bilangan/Number ('000) (%)
Perempuan/Female
Tahun
Year
Tenaga
buruh
Labour
force
Bekerja
Employed
Penganggur
Unemployed
Luar tenaga
buruh
Outside
labour force
Kadar penyertaan
tenaga buruh
Labour force
participation rate
Kadar
pengangguran
Unemployment
rate
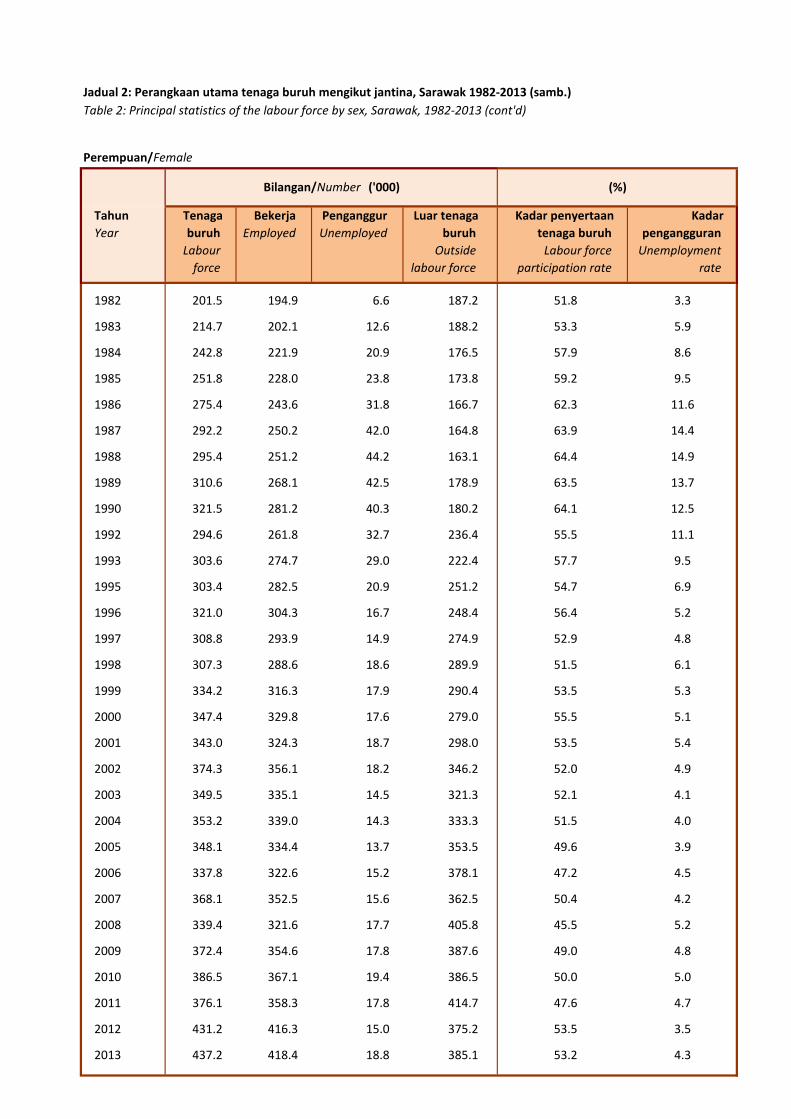
1982 201.5 194.9 6.6 187.2 51.8 3.3
1983 214.7 202.1 12.6 188.2 53.3 5.9
1984 242.8 221.9 20.9 176.5 57.9 8.6
1985 251.8 228.0 23.8 173.8 59.2 9.5
1986 275.4 243.6 31.8 166.7 62.3 11.6
1987 292.2 250.2 42.0 164.8 63.9 14.4
1988 295.4 251.2 44.2 163.1 64.4 14.9
1989 310.6 268.1 42.5 178.9 63.5 13.7
1990 321.5 281.2 40.3 180.2 64.1 12.5
1992 294.6 261.8 32.7 236.4 55.5 11.1
1993 303.6 274.7 29.0 222.4 57.7 9.5
1995 303.4 282.5 20.9 251.2 54.7 6.9
1996 321.0 304.3 16.7 248.4 56.4 5.2
1997 308.8 293.9 14.9 274.9 52.9 4.8
1998 307.3 288.6 18.6 289.9 51.5 6.1
1999 334.2 316.3 17.9 290.4 53.5 5.3
2000 347.4 329.8 17.6 279.0 55.5 5.1
2001 343.0 324.3 18.7 298.0 53.5 5.4
2002 374.3 356.1 18.2 346.2 52.0 4.9
2003 349.5 335.1 14.5 321.3 52.1 4.1
2004 353.2 339.0 14.3 333.3 51.5 4.0
2005 348.1 334.4 13.7 353.5 49.6 3.9
2006 337.8 322.6 15.2 378.1 47.2 4.5
2007 368.1 352.5 15.6 362.5 50.4 4.2
2008 339.4 321.6 17.7 405.8 45.5 5.2
2009 372.4 354.6 17.8 387.6 49.0 4.8
2010 386.5 367.1 19.4 386.5 50.0 5.0
2011 376.1 358.3 17.8 414.7 47.6 4.7
2012 431.2 416.3 15.0 375.2 53.5 3.5
2013 437.2 418.4 18.8 385.1 53.2 4.3
Jadual 2: Perangkaan utama tenaga buruh mengikut jantina, Sarawak 1982-2013 (samb.)
Table 2: Principal statistics of the labour force by sex, Sarawak, 1982-2013 (cont'd)
Bilangan/Number ('000) (%)
Lelaki/Male
Tahun
Year
Tenaga
buruh
Labour
force
Bekerja
Employed
Penganggur
Unemployed
Luar tenaga
buruh
Outside
labour force
Kadar penyertaan
tenaga buruh
Labour force
participation rate
Kadar
pengangguran
Unemployment
rate
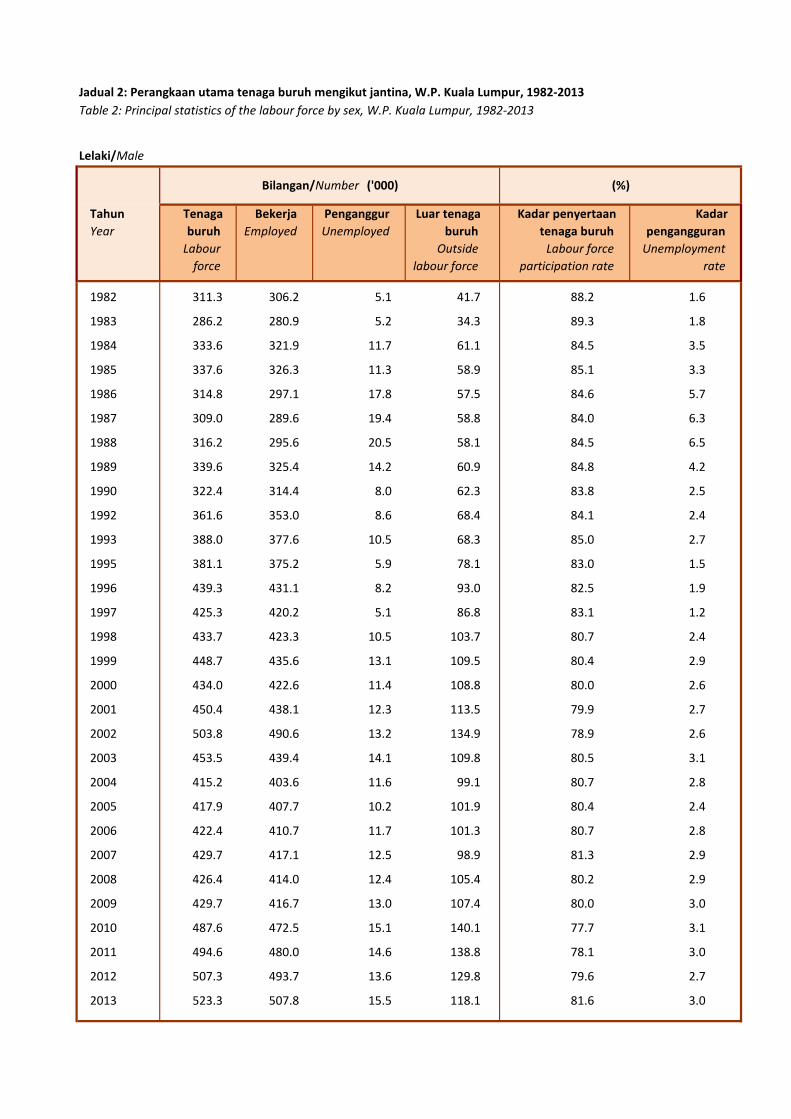
1982 311.3 306.2 5.1 41.7 88.2 1.6
1983 286.2 280.9 5.2 34.3 89.3 1.8
1984 333.6 321.9 11.7 61.1 84.5 3.5
1985 337.6 326.3 11.3 58.9 85.1 3.3
1986 314.8 297.1 17.8 57.5 84.6 5.7
1987 309.0 289.6 19.4 58.8 84.0 6.3
1988 316.2 295.6 20.5 58.1 84.5 6.5
1989 339.6 325.4 14.2 60.9 84.8 4.2
1990 322.4 314.4 8.0 62.3 83.8 2.5
1992 361.6 353.0 8.6 68.4 84.1 2.4
1993 388.0 377.6 10.5 68.3 85.0 2.7
1995 381.1 375.2 5.9 78.1 83.0 1.5
1996 439.3 431.1 8.2 93.0 82.5 1.9
1997 425.3 420.2 5.1 86.8 83.1 1.2
1998 433.7 423.3 10.5 103.7 80.7 2.4
1999 448.7 435.6 13.1 109.5 80.4 2.9
2000 434.0 422.6 11.4 108.8 80.0 2.6
2001 450.4 438.1 12.3 113.5 79.9 2.7
2002 503.8 490.6 13.2 134.9 78.9 2.6
2003 453.5 439.4 14.1 109.8 80.5 3.1
2004 415.2 403.6 11.6 99.1 80.7 2.8
2005 417.9 407.7 10.2 101.9 80.4 2.4
2006 422.4 410.7 11.7 101.3 80.7 2.8
2007 429.7 417.1 12.5 98.9 81.3 2.9
2008 426.4 414.0 12.4 105.4 80.2 2.9
2009 429.7 416.7 13.0 107.4 80.0 3.0
2010 487.6 472.5 15.1 140.1 77.7 3.1
2011 494.6 480.0 14.6 138.8 78.1 3.0
2012 507.3 493.7 13.6 129.8 79.6 2.7
2013 523.3 507.8 15.5 118.1 81.6 3.0
Jadual 2: Perangkaan utama tenaga buruh mengikut jantina, W.P. Kuala Lumpur, 1982-2013
Table 2: Principal statistics of the labour force by sex, W.P. Kuala Lumpur, 1982-2013
Bilangan/Number ('000) (%)
Perempuan/Female
Tahun
Year
Tenaga
buruh
Labour
force
Bekerja
Employed
Penganggur
Unemployed
Luar tenaga
buruh
Outside
labour force
Kadar penyertaan
tenaga buruh
Labour force
participation rate
Kadar
pengangguran
Unemployment
rate
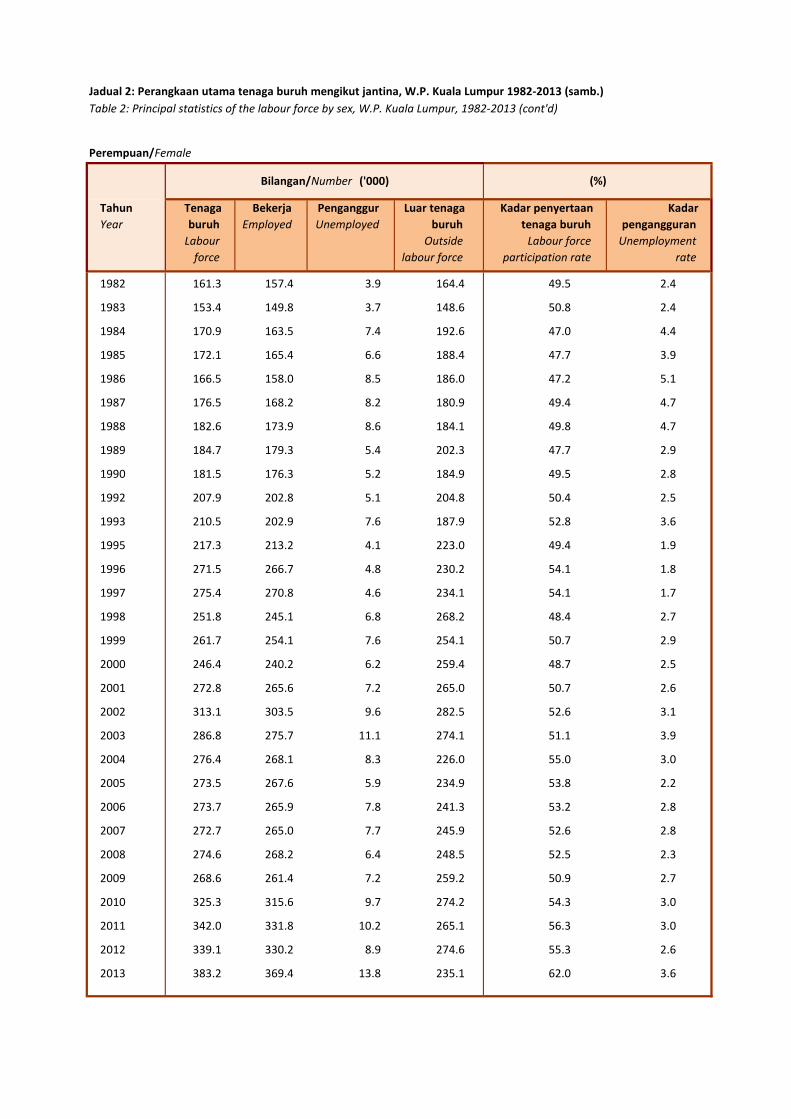
1982 161.3 157.4 3.9 164.4 49.5 2.4
1983 153.4 149.8 3.7 148.6 50.8 2.4
1984 170.9 163.5 7.4 192.6 47.0 4.4
1985 172.1 165.4 6.6 188.4 47.7 3.9
1986 166.5 158.0 8.5 186.0 47.2 5.1
1987 176.5 168.2 8.2 180.9 49.4 4.7
1988 182.6 173.9 8.6 184.1 49.8 4.7
1989 184.7 179.3 5.4 202.3 47.7 2.9
1990 181.5 176.3 5.2 184.9 49.5 2.8
1992 207.9 202.8 5.1 204.8 50.4 2.5
1993 210.5 202.9 7.6 187.9 52.8 3.6
1995 217.3 213.2 4.1 223.0 49.4 1.9
1996 271.5 266.7 4.8 230.2 54.1 1.8
1997 275.4 270.8 4.6 234.1 54.1 1.7
1998 251.8 245.1 6.8 268.2 48.4 2.7
1999 261.7 254.1 7.6 254.1 50.7 2.9
2000 246.4 240.2 6.2 259.4 48.7 2.5
2001 272.8 265.6 7.2 265.0 50.7 2.6
2002 313.1 303.5 9.6 282.5 52.6 3.1
2003 286.8 275.7 11.1 274.1 51.1 3.9
2004 276.4 268.1 8.3 226.0 55.0 3.0
2005 273.5 267.6 5.9 234.9 53.8 2.2
2006 273.7 265.9 7.8 241.3 53.2 2.8
2007 272.7 265.0 7.7 245.9 52.6 2.8
2008 274.6 268.2 6.4 248.5 52.5 2.3
2009 268.6 261.4 7.2 259.2 50.9 2.7
2010 325.3 315.6 9.7 274.2 54.3 3.0
2011 342.0 331.8 10.2 265.1 56.3 3.0
2012 339.1 330.2 8.9 274.6 55.3 2.6
2013 383.2 369.4 13.8 235.1 62.0 3.6
Jadual 2: Perangkaan utama tenaga buruh mengikut jantina, W.P. Kuala Lumpur 1982-2013 (samb.)
Table 2: Principal statistics of the labour force by sex, W.P. Kuala Lumpur, 1982-2013 (cont'd)
Bilangan/Number ('000) (%)
Lelaki/Male
Tahun
Year
Tenaga
buruh
Labour
force
Bekerja
Employed
Penganggur
Unemployed
Luar tenaga
buruh
Outside
labour force
Kadar penyertaan
tenaga buruh
Labour force
participation rate
Kadar
pengangguran
Unemployment
rate
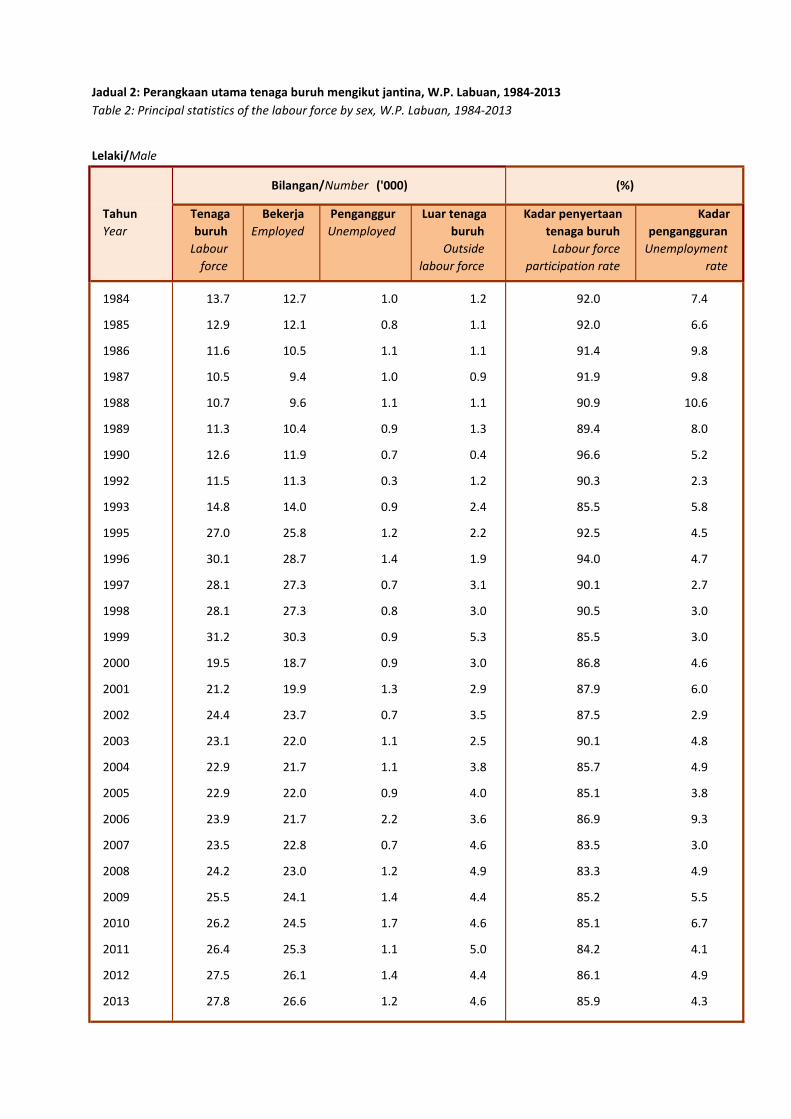
1984 13.7 12.7 1.0 1.2 92.0 7.4
1985 12.9 12.1 0.8 1.1 92.0 6.6
1986 11.6 10.5 1.1 1.1 91.4 9.8
1987 10.5 9.4 1.0 0.9 91.9 9.8
1988 10.7 9.6 1.1 1.1 90.9 10.6
1989 11.3 10.4 0.9 1.3 89.4 8.0
1990 12.6 11.9 0.7 0.4 96.6 5.2
1992 11.5 11.3 0.3 1.2 90.3 2.3
1993 14.8 14.0 0.9 2.4 85.5 5.8
1995 27.0 25.8 1.2 2.2 92.5 4.5
1996 30.1 28.7 1.4 1.9 94.0 4.7
1997 28.1 27.3 0.7 3.1 90.1 2.7
1998 28.1 27.3 0.8 3.0 90.5 3.0
1999 31.2 30.3 0.9 5.3 85.5 3.0
2000 19.5 18.7 0.9 3.0 86.8 4.6
2001 21.2 19.9 1.3 2.9 87.9 6.0
2002 24.4 23.7 0.7 3.5 87.5 2.9
2003 23.1 22.0 1.1 2.5 90.1 4.8
2004 22.9 21.7 1.1 3.8 85.7 4.9
2005 22.9 22.0 0.9 4.0 85.1 3.8
2006 23.9 21.7 2.2 3.6 86.9 9.3
2007 23.5 22.8 0.7 4.6 83.5 3.0
2008 24.2 23.0 1.2 4.9 83.3 4.9
2009 25.5 24.1 1.4 4.4 85.2 5.5
2010 26.2 24.5 1.7 4.6 85.1 6.7
2011 26.4 25.3 1.1 5.0 84.2 4.1
2012 27.5 26.1 1.4 4.4 86.1 4.9
2013 27.8 26.6 1.2 4.6 85.9 4.3
Jadual 2: Perangkaan utama tenaga buruh mengikut jantina, W.P. Labuan, 1984-2013
Table 2: Principal statistics of the labour force by sex, W.P. Labuan, 1984-2013
Bilangan/Number ('000) (%)
Perempuan/Female
Tahun
Year
Tenaga
buruh
Labour
force
Bekerja
Employed
Penganggur
Unemployed
Luar tenaga
buruh
Outside
labour force
Kadar penyertaan
tenaga buruh
Labour force
participation rate
Kadar
pengangguran
Unemployment
rate
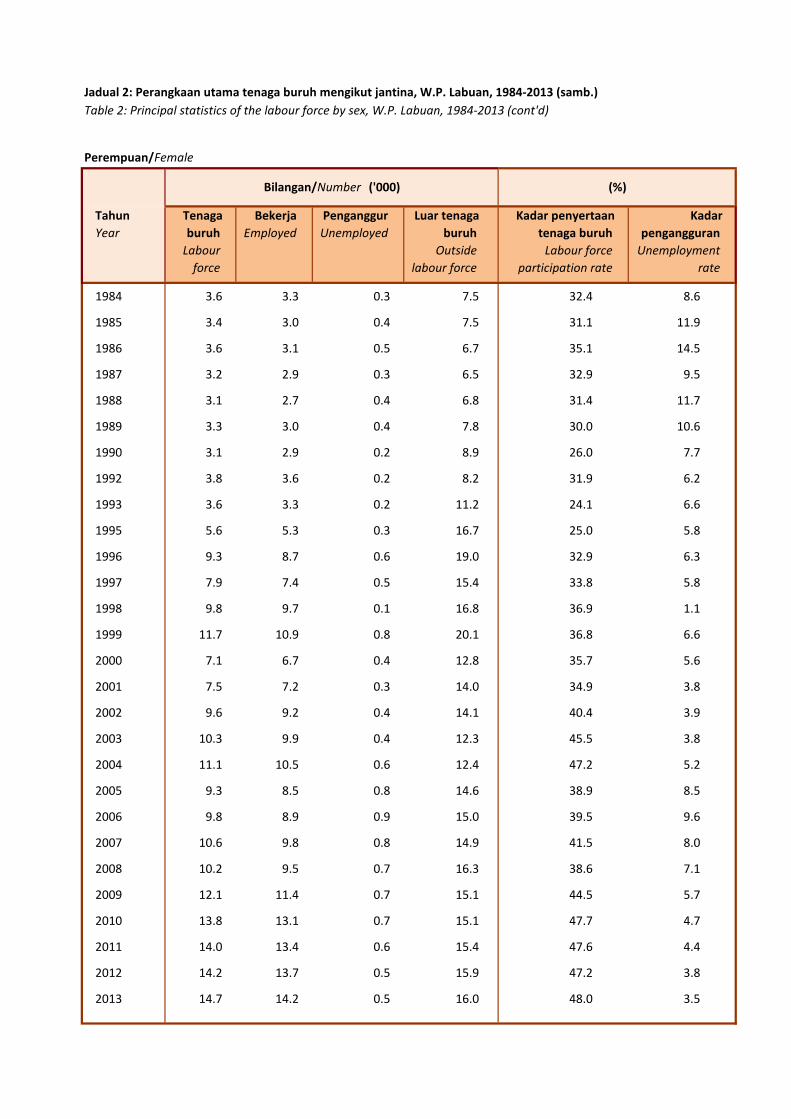
1984 3.6 3.3 0.3 7.5 32.4 8.6
1985 3.4 3.0 0.4 7.5 31.1 11.9
1986 3.6 3.1 0.5 6.7 35.1 14.5
1987 3.2 2.9 0.3 6.5 32.9 9.5
1988 3.1 2.7 0.4 6.8 31.4 11.7
1989 3.3 3.0 0.4 7.8 30.0 10.6
1990 3.1 2.9 0.2 8.9 26.0 7.7
1992 3.8 3.6 0.2 8.2 31.9 6.2
1993 3.6 3.3 0.2 11.2 24.1 6.6
1995 5.6 5.3 0.3 16.7 25.0 5.8
1996 9.3 8.7 0.6 19.0 32.9 6.3
1997 7.9 7.4 0.5 15.4 33.8 5.8
1998 9.8 9.7 0.1 16.8 36.9 1.1
1999 11.7 10.9 0.8 20.1 36.8 6.6
2000 7.1 6.7 0.4 12.8 35.7 5.6
2001 7.5 7.2 0.3 14.0 34.9 3.8
2002 9.6 9.2 0.4 14.1 40.4 3.9
2003 10.3 9.9 0.4 12.3 45.5 3.8
2004 11.1 10.5 0.6 12.4 47.2 5.2
2005 9.3 8.5 0.8 14.6 38.9 8.5
2006 9.8 8.9 0.9 15.0 39.5 9.6
2007 10.6 9.8 0.8 14.9 41.5 8.0
2008 10.2 9.5 0.7 16.3 38.6 7.1
2009 12.1 11.4 0.7 15.1 44.5 5.7
2010 13.8 13.1 0.7 15.1 47.7 4.7
2011 14.0 13.4 0.6 15.4 47.6 4.4
2012 14.2 13.7 0.5 15.9 47.2 3.8
2013 14.7 14.2 0.5 16.0 48.0 3.5
Jadual 2: Perangkaan utama tenaga buruh mengikut jantina, W.P. Labuan, 1984-2013 (samb.)
Table 2: Principal statistics of the labour force by sex, W.P. Labuan, 1984-2013 (cont'd)
Bilangan/Number ('000) (%)
Lelaki/Male
Tahun
Year
Tenaga
buruh
Labour
force
Bekerja
Employed
Penganggur
Unemployed
Luar tenaga
buruh
Outside
labour force
Kadar penyertaan
tenaga buruh
Labour force
participation rate
Kadar
pengangguran
Unemployment
rate
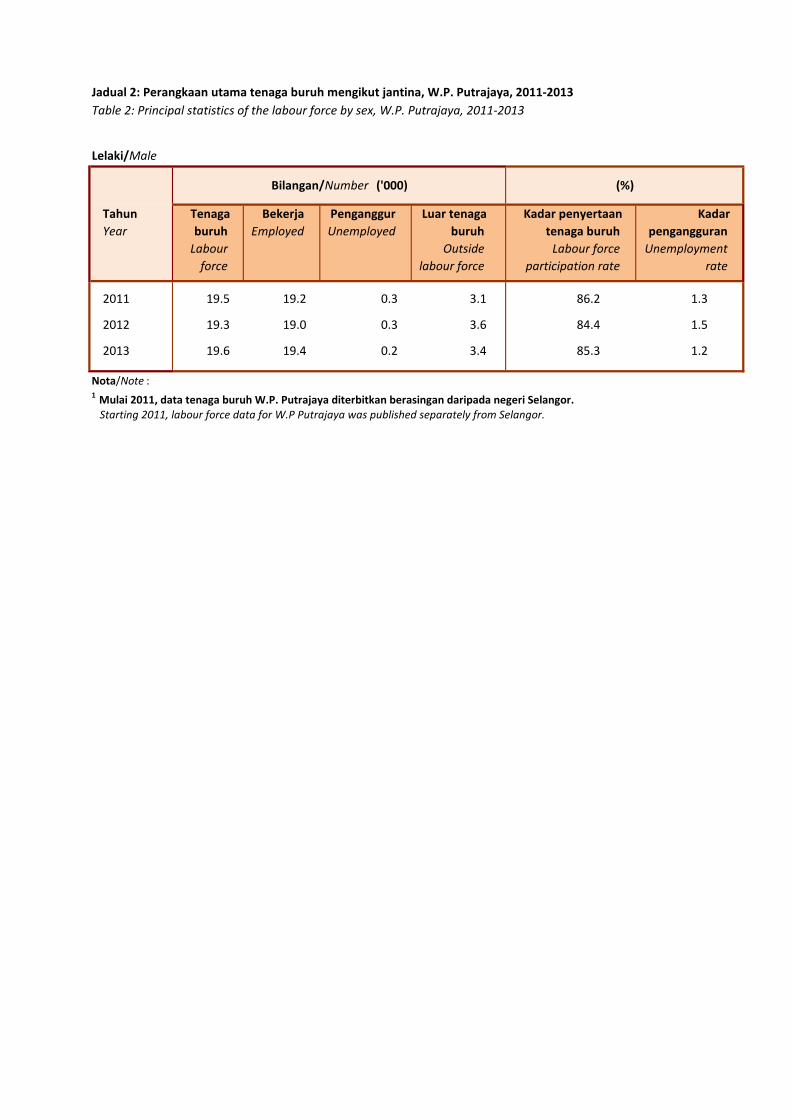
2011 19.5 19.2 0.3 3.1 86.2 1.3
2012 19.3 19.0 0.3 3.6 84.4 1.5
2013 19.6 19.4 0.2 3.4 85.3 1.2
Nota/Note :1 Mulai 2011, data tenaga buruh W.P. Putrajaya diterbitkan berasingan daripada negeri Selangor. Starting 2011, labour force data for W.P Putrajaya was published separately from Selangor.
Jadual 2: Perangkaan utama tenaga buruh mengikut jantina, W.P. Putrajaya, 2011-2013
Table 2: Principal statistics of the labour force by sex, W.P. Putrajaya, 2011-2013
Bilangan/Number ('000) (%)
Perempuan/Female
Tahun
Year
Tenaga
buruh
Labour
force
Bekerja
Employed
Penganggur
Unemployed
Luar tenaga
buruh
Outside
labour force
Kadar penyertaan
tenaga buruh
Labour force
participation rate
Kadar
pengangguran
Unemployment
rate
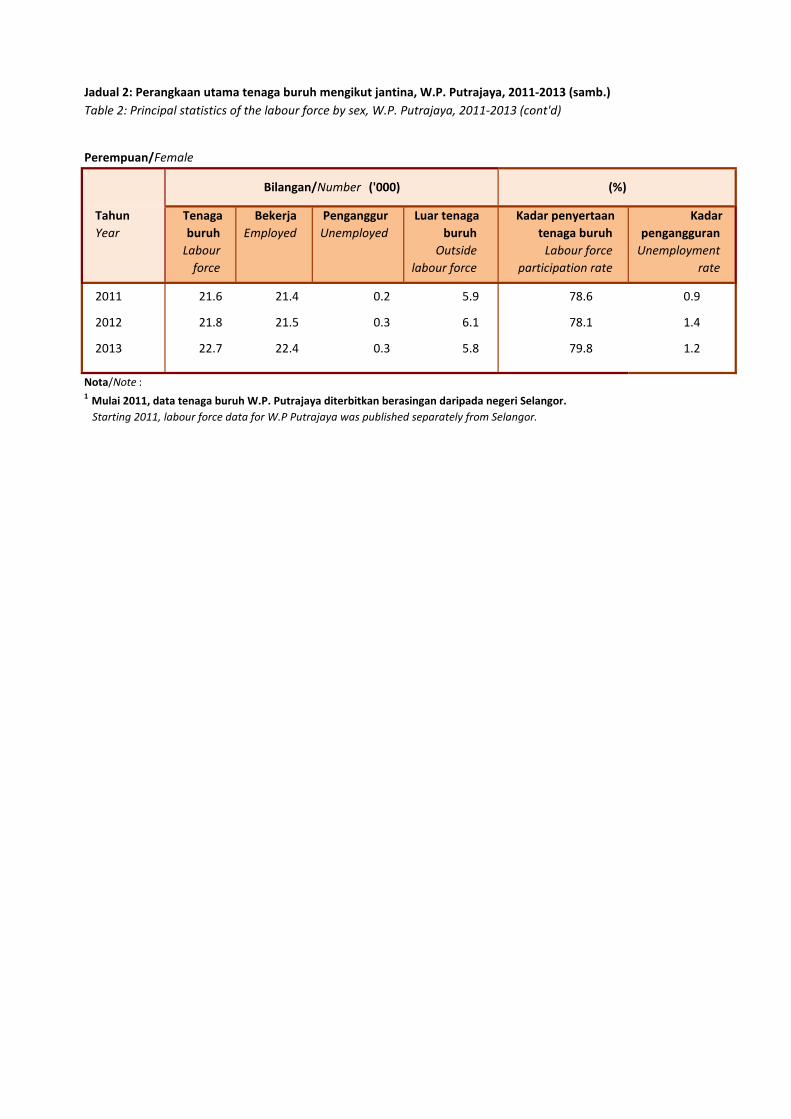
2011 21.6 21.4 0.2 5.9 78.6 0.9
2012 21.8 21.5 0.3 6.1 78.1 1.4
2013 22.7 22.4 0.3 5.8 79.8 1.2
Nota/Note :1 Mulai 2011, data tenaga buruh W.P. Putrajaya diterbitkan berasingan daripada negeri Selangor.
Starting 2011, labour force data for W.P Putrajaya was published separately from Selangor.
Jadual 2: Perangkaan utama tenaga buruh mengikut jantina, W.P. Putrajaya, 2011-2013 (samb.)
Table 2: Principal statistics of the labour force by sex, W.P. Putrajaya, 2011-2013 (cont'd)
Bilangan/Number ('000) (%)