jurnal teknologi full paper -...
TRANSCRIPT
67:3 (2014) 57–64 | www.jurnalteknologi.utm.my | eISSN 2180–3722 |
Full paper Jurnal
Teknologi
Classification of Paroxysmal Atrial Fibrillation using Second Order System Nurul Ashikin Abdul-Kadir, Norlaili Mat Safri*, Mohd Afzan Othman
Faculty of Electrical Engineering, Universiti Teknologi Malaysia, 81310 UTM Johor Bahru, Johor, Malaysia
*Corresponding author: [email protected]
Article history
Received :23 October 2013
Received in revised form :
14 December 2013 Accepted :10 January 2014
Graphical abstract
ECG of Atrial Fibrillation
Abstract
In this paper, we monitored and analyzed the characteristics of atrial fibrillation in patient using second
order approach. Atrial fibrillation is a type of atria arrhythmias, disturbing the normal heart rhythm
between the atria and lower ventricles of the heart. Heart disease and hypertension increase risk of stroke from atrial fibrillation. This study used electrocardiogram (ECG) signals from Physiobank, namely MIT-
BIH Atrial Fibrillation Dataset and MIT-BIH Normal Sinus Rhythm Dataset. In total, 865 episodes for
each type of ECG signal were classified, specifically normal sinus rhythm (NSR) of human without arrhythmia, normal sinus rhythm of atrial fibrillation patient (N) and atrial fibrillation (AF). Extracted
parameters (forcing input, natural frequency and damping coefficient) from second order system were
characterized and analyzed. Their ratios, time derivatives, and differential derivatives were also observed. Altogether, 12 parameters were extracted and analysed from the approach. The results show significant
difference between the three ECGs of forcing input, and derivative of forcing input. Overall system
performance gives specificity and sensitivity of 84.9 % and 85.5 %, respectively.
Keywords: Atrial fibrillation; normal sinus rhythm; hypertension; stroke; electrocardiogram; second order
system
Abstrak
Dalam kajian ini, kami mengawasi dan menganalisis sifat-sifat dan ramalan tercetusnya fibrilasi atrium
pada pesakit. Fibrilasi atrium adalah sejenis aritmia atria, yang mengganggu degupan normal jantung
antara atria dan ventrikal bawah. Penyakit jantung dan hipertensi meningkatkan risiko strok daripada fibrilasi atrium. Kajian ini menggunakan isyarat elektrokardiogram (ECG) dari Physiobank, bernama
MIT-BIH Atrial Fibrillation Dataset dan MIT-BIH Normal Sinus Rhythm Dataset. Sejumlah 865 episod
bagi setiap pengekelasan isyarat ECG, dengan lebih spesifik, irama sinus yang normal (NSR) manusia tanpa aritmia, irama sinus yang normal pesakit fibrilasi atrium (N) dan irama fibrilasi atrium pesakit (AF).
Parameter yang diekstrak (masukan paksaan, frekuensi natural, pekali kelembapan) dari sistem peringkat
kedua dicirikan dan dianalisa. Nisbahnya, terbitan masa, dan pembezaan terbitan juga diperhatikan di mana keseluruhannya terdapat 12 parameter yang dianalisis. Hasil menunjukkan perbezaan yang
signifikan antara masukan paksaan, dan terbitan masukan paksaan. Keseluruhan persembahan sistem
memberikan kekhususan dan kepekaan masing-masing, 84.9 % dan 85.5 %.
Kata kunci: Fibrilasi atrium; irama sinus yang normal; hipertensi; strok; elektrokardiogram; sistem
peringkat kedua
© 2014 Penerbit UTM Press. All rights reserved.
1.0 INTRODUCTION
Atrial fibrillation is one of atria arrhythmias which can life
threaten if not diagnose earlier by physician or doctor. It is a
condition where heart fibrillates when electrical impulses
disorganize and the contraction of atrias become disorganize.
During atria muscle fibrillation, atria can no longer pumps blood
to ventricles. Therefore, ventricles contract rapidly. Normal
rhythm between the atria and ventricles of the heart are disturb
and may cause someone to suffer heart attack, high blood
pressure, coronary heart disease or heart valve disease.1 Normal
human can show symptoms of feeling lightheaded, out of breath,
week, heart racing or unevenly beating heart.1 Normal heart rate
maintains at 60 beats per minute during rest and can fire rapidly
between 180-200 beats per minute while exercising.2 In atria
fibrillation, heart can fire up to 600 beats per minute with
ventricular rate in the region of more than 100 pulses per minute.1-
2 The loss of atrial contraction can leads to formation of blood
clots in the heart as blood in the atria become stagnate. It can
enlarge and moving to brain which resulting as ischemic stroke in
58 Norlaili Mat Safri et al. / Jurnal Teknologi (Sciences & Engineering) 67:3 (2014), 57–64
patient. Stroke is number three killer in Malaysia after diabetes
and cancer,3 and has been the third leading cause of death in most
countries around the world for a very long time.4 Therefore this
study concern was on characterizing the normal and atrial
fibrillation ECG signal using second order system to classify atrial
fibrillation signal in-between normal heart rhythm (normal sinus
rhythm or normal heart beat).
1.1 Previous Research
A few existing algorithms are performed to detect, differentiate
and classify atrial fibrillation ECG signal with other signal.
Previous research are based on P-wave absence5-7 or relied on RR
intervals8-12 or combinations of both13-14 to detect atrial
fibrillation. Methods such as neural networks15, wavelet
analysis16-17, and QRST cancellation18-19 were investigated and
developed. While semantic mining approach was developed in
gaming20 and pattern recognition for estimating opponent
strategy21 and detecting ventricular arrhythmias.22-24
In one of the previous research, the P wave absence was
found in 34 of 68 stroke patients which developed atrial
fibrillation (AF) and other were classified as non-AF contraction
with the number of 88.2% and 37.3% of AF in each group.5
Another researcher developed a sequential analysis of the
atrial activity in a single ECG lead for automatic detection of
atrial flutter and atrial fibrillation.7 The approached used P wave
absence and ventricular arrhythmia detection which achieved
accuracy and sensitivity of 98.8% and 95.7% respectively.7
Meanwhile another had developed algorithm for atrial
fibrillation detection based on RR interval time series that
achieved sensitivity of 94.1% and specificity of 95.1%.8 The
dataset used were MIT-BIH Atrial Fibrillation Database and MIT-
BIH Arrhythmia Database. The combination of both databases
gave sensitivity of 90.2% and specificity of 91.2% in the study.
Another study that detects atrial fibrillation based on RR-
interval, data from MIT-BIH Atrial Database were used.10 The
estimation between standard density histograms and a test density
histogram by the Kolmogorov-Smirnov (KS) test gave significant
difference. The average sensitivity and average specificity
achieved were 93.2% and 96.7% respectively.10
M. Stridh and M. Rosenqvist performed RR-interval and
separated RR intervals between disturbances or occasional ectopic
beats from irregular rhythms.13 Later, P-wave detection was
performed and achieved sinus rhythm cases of 93% and atrial
fibrillation cases of 98% successfully recognized from the
database. In addition, P. De Chazal and C. Heneghan also used
RR-interval and P wave shape in automated assessment of the
ECG for predicting the onset of atrial fibrillation.14 Results show
that features based on RR intervals were most successful with
score of 41/50.
In another study, the classification performance of normal
sinus rhythm and atrial fibrillation ECGs using neural network
gave high accuracy.15 The trained 3-layer network achieved 100%
accuracy of 24 and 28 normal sinus rhythm and atrial fibrillation
state ECGs respectively.15
None of the above study had use second order dynamic
approach. First of its kind, the same approach had been use to
characterize ventricular tachycardia and ventricular fibrillation,
namely semantic mining.22-24 The paper mentioned that semantic
mining able to recognize and differentiate between ventricular
tachycardia, ventricular fibrillation and normal heart rhythm.
Based on that, this study extends the usage of second order system
for atrial fibrillation classification. The second order system
applied to atrial fibrillation dataset was described in our initial
study.25
2.0 EXPERIMENTAL
2.1 Data Collection
Data collection from Physiobank, namely MIT-BIH Atrial
Fibrillation Dataset and MIT-BIH Normal Sinus Rhythm Dataset
were used.26 This study used sample number #04126 and #16265
from the datasets respectively. The data was in binary format of
12-bit resolution, with range of ±10 mV. The sampling frequency
are 250 Hz and 128 Hz respectively, while typical bandwidth
recording of approximately 0.1 Hz to 40 Hz. The ECG signals
were windowed into 4 seconds episodes, and overlapped by 3
seconds (moving filter). Matlab software was used to convert the
binary data obtained from Physiobank to ascii format as
LabVIEW software compatible format. All processing were done
in LabVIEW platform.
2.2 Data Processing
Butterworth band pass filter was used. The transfers function as in
(1). Pass band of 1 to 30 Hz was chosen. LabVIEW software was
used in this study.
𝐻(𝑧) =0.027+0.109𝑧−1+0.164𝑧−2+0.109𝑧−3+0.027𝑧−4
1−2.791𝑧−1+4.327𝑧−2−2.791𝑧−3+𝑧−4 (1)
2.3 Extraction Of Parameters
The second order system is described as equation (2).
𝜔−2. 𝑥 ′′ + 2𝜁𝜔−1𝑥 ′ + 𝑥 = 𝜇 ; 𝑥(0) = 𝑥0 ; 𝑥 ′(0) = 𝑥 ′0 (2)
where 𝜔 is the natural frequency, 𝜁 is the damping
coefficient and 𝜇 is the forcing input of the system. These three
parameters are extracted from the ECG signal to characterize its
characteristic for further analysis and study.
By differentiating (2) with respect to t (3) and divide it with
𝑥 ′′ (4), damping coefficient, 𝜁 can be obtained and differentiate
with respect to t another time (5) to obtain natural frequency, 𝜔.
𝜔−2. 𝑥 ′′′ + 2𝜁𝜔−1𝑥 ′′ + 𝑥 ′ = 0 (3)
𝜔−2.𝑥′′′
𝑥′′+
2𝜁𝜔−1𝑥′′
𝑥′′+
𝑥′
𝑥′′= 0 (4)
𝜔−2(𝑥′′.𝑥′′′−𝑥′′′.𝑥′′′)
(𝑥′′)2 + 0 +𝑥′′.𝑥′′−𝑥′.𝑥′′′
(𝑥′′)2 = 0 (5)
From (4)
𝜁 = − [𝜔−2.𝑥′′′+𝑥′
2𝜔−1.𝑥′′] (6)
From (5)
𝜔2 =𝑥′′.𝑥′′′−(𝑥′′′)2
𝑥′.𝑥′′′−(𝑥′′)2 (7)
While forcing input, 𝜇 is obtained from (2).
𝜇 = 𝜔−2. 𝑥 ′′ + 2𝜁𝜔−1𝑥 ′ + 𝑥 (8)
The parameters obtained from second order system (damping
coefficient, 𝜁 ; natural frequency, ; and forcing input, ) are
monitored, as well as:
59 Norlaili Mat Safri et al. / Jurnal Teknologi (Sciences & Engineering) 67:3 (2014), 57–64
i. the ratio (ratios of forcing input to natural frequency, /;
ratios of forcing input to damping coefficient, /𝜁; ratios of
natural frequency to damping coefficient, /𝜁),
ii. differential of time (the derivative of the natural frequency
with respect to time, d/dt; the derivative of the damping
coefficient with respect to time, d𝜁/dt; the derivative of the
forcing input with respect to time, d/dt), and
iii. derivatives of differential (the derivative of the forcing input
with respect to the natural frequency, d/d; the derivative
of the forcing input with respect to the damping coefficient,
d/d 𝜁 ; and the derivative of the natural frequency with
respect to the damping coefficient, d/d 𝜁 ) to provide a
realistic different in analyzing the features. In total, twelve
parameters were analyzed. Results are show and discuss in
results and discussion.
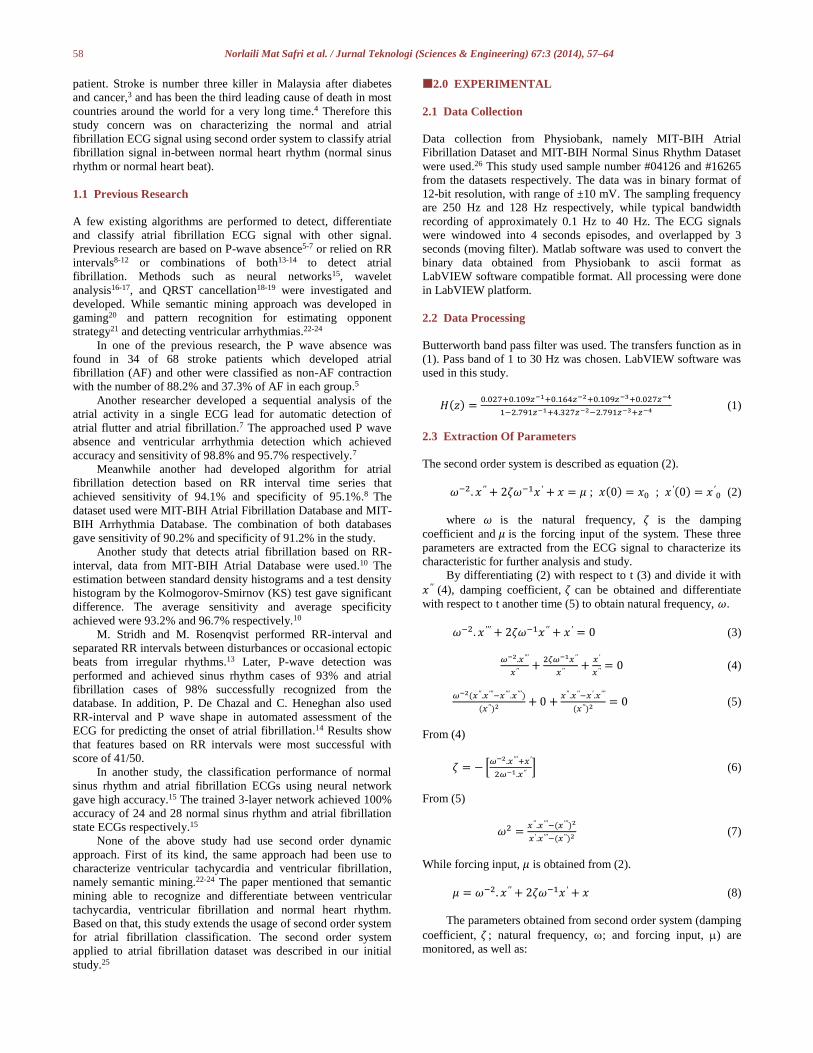
Figure 1 shows overall workflow for this study. Sample from
MIT-BIH Normal Sinus Rhythm Database was rescaled into 250
Hz, to be analyzed with 250 Hz sample of MIT-BIH Atrial
Fibrillation Database.
Figure 1 The workflow of the study
3.0 RESULTS
The results observed during this study, includes, the scaling of
sample of MIT-BIH Normal Sinus Rhythm Dataset from 128 Hz
to 250 Hz, the filtering process, segmentation into specific
episode, normalization, transforming a function of time into
frequency using fast-Fourier Transform (FFT), extraction of
features using second order system, beneficial of statistical t-test
for classification, and also the performance observation. In this
results section, four parts are reveals as follow.
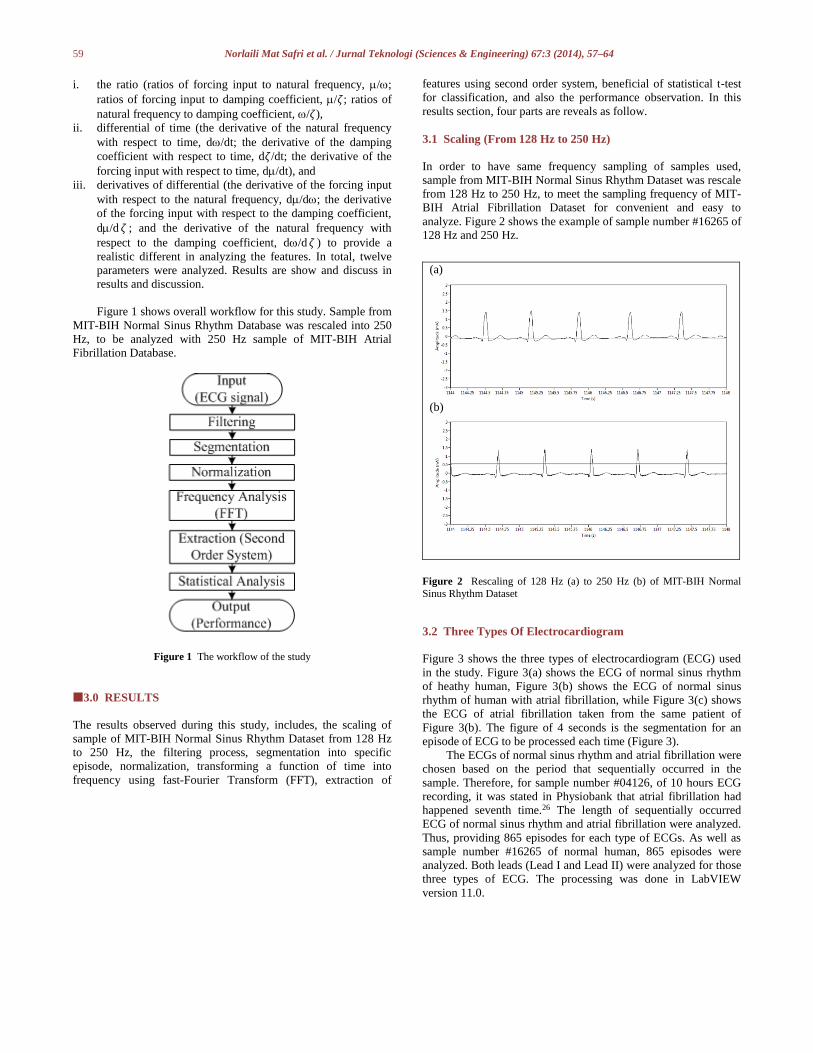
3.1 Scaling (From 128 Hz to 250 Hz)
In order to have same frequency sampling of samples used,
sample from MIT-BIH Normal Sinus Rhythm Dataset was rescale
from 128 Hz to 250 Hz, to meet the sampling frequency of MIT-
BIH Atrial Fibrillation Dataset for convenient and easy to
analyze. Figure 2 shows the example of sample number #16265 of
128 Hz and 250 Hz.
(a)
(b)
Figure 2 Rescaling of 128 Hz (a) to 250 Hz (b) of MIT-BIH Normal
Sinus Rhythm Dataset
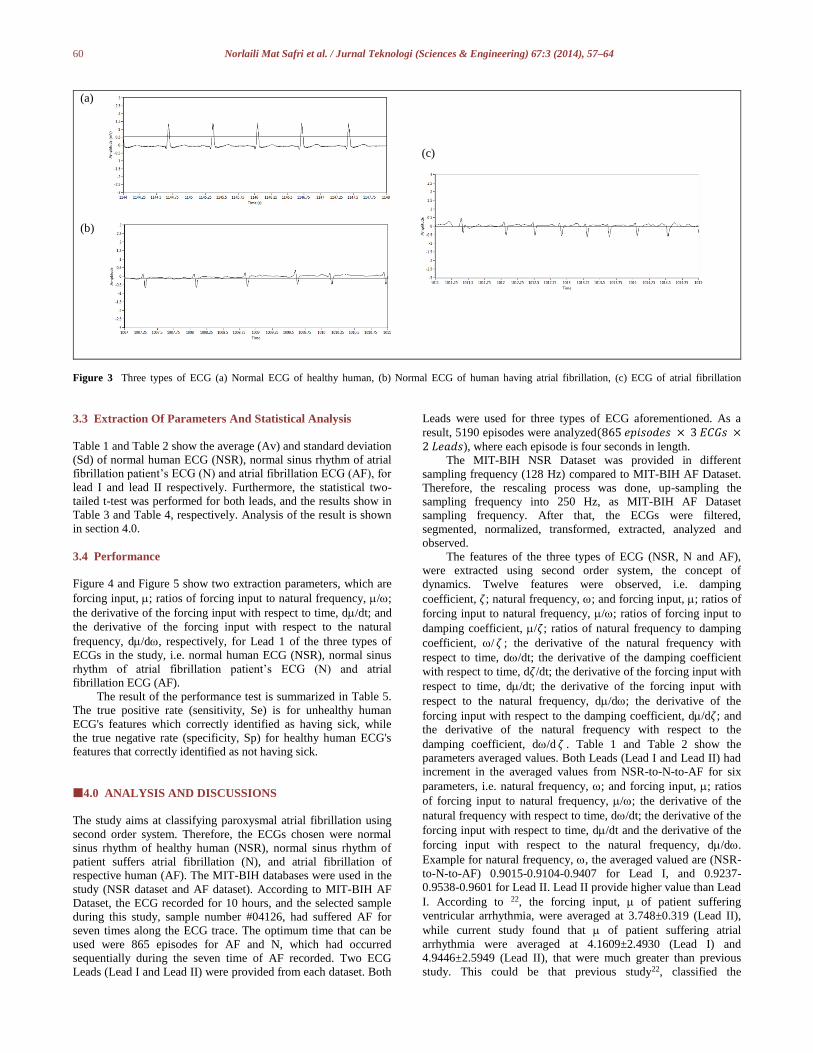
3.2 Three Types Of Electrocardiogram
Figure 3 shows the three types of electrocardiogram (ECG) used
in the study. Figure 3(a) shows the ECG of normal sinus rhythm
of heathy human, Figure 3(b) shows the ECG of normal sinus
rhythm of human with atrial fibrillation, while Figure 3(c) shows
the ECG of atrial fibrillation taken from the same patient of
Figure 3(b). The figure of 4 seconds is the segmentation for an
episode of ECG to be processed each time (Figure 3).
The ECGs of normal sinus rhythm and atrial fibrillation were
chosen based on the period that sequentially occurred in the
sample. Therefore, for sample number #04126, of 10 hours ECG
recording, it was stated in Physiobank that atrial fibrillation had
happened seventh time.26 The length of sequentially occurred
ECG of normal sinus rhythm and atrial fibrillation were analyzed.
Thus, providing 865 episodes for each type of ECGs. As well as
sample number #16265 of normal human, 865 episodes were
analyzed. Both leads (Lead I and Lead II) were analyzed for those
three types of ECG. The processing was done in LabVIEW
version 11.0.
60 Norlaili Mat Safri et al. / Jurnal Teknologi (Sciences & Engineering) 67:3 (2014), 57–64
(a)
(c)
(b)
Figure 3 Three types of ECG (a) Normal ECG of healthy human, (b) Normal ECG of human having atrial fibrillation, (c) ECG of atrial fibrillation
3.3 Extraction Of Parameters And Statistical Analysis
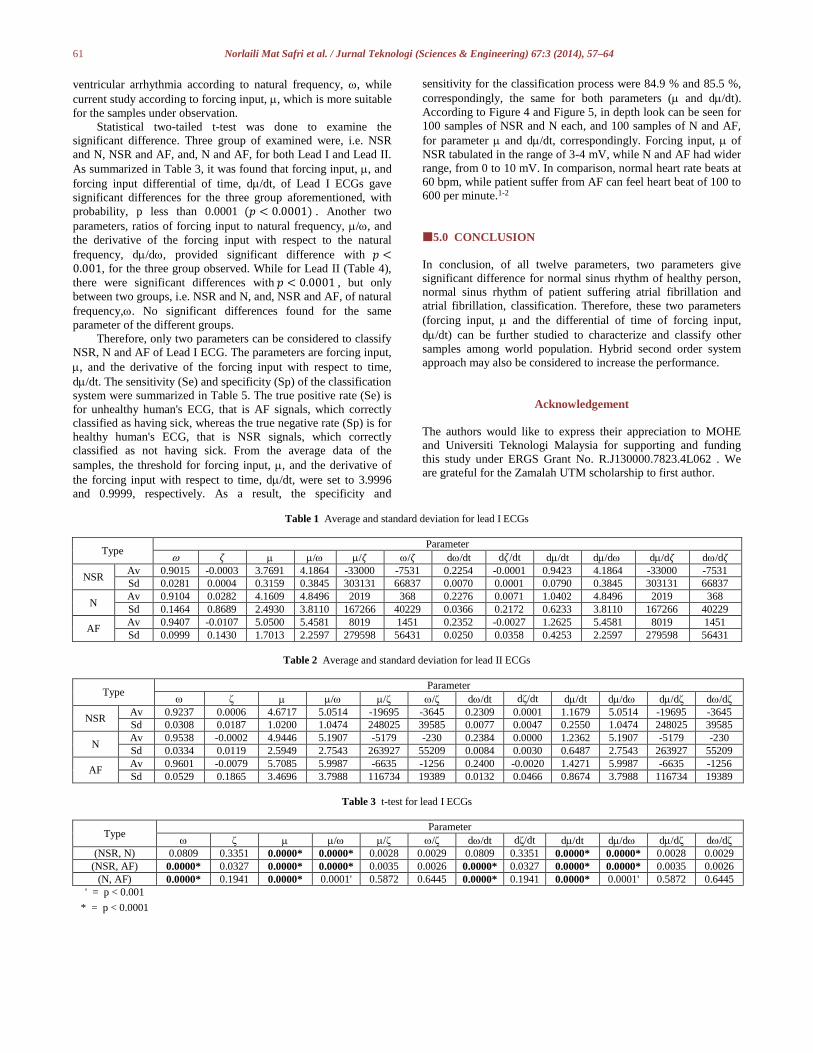
Table 1 and Table 2 show the average (Av) and standard deviation
(Sd) of normal human ECG (NSR), normal sinus rhythm of atrial
fibrillation patient’s ECG (N) and atrial fibrillation ECG (AF), for
lead I and lead II respectively. Furthermore, the statistical two-
tailed t-test was performed for both leads, and the results show in
Table 3 and Table 4, respectively. Analysis of the result is shown
in section 4.0.
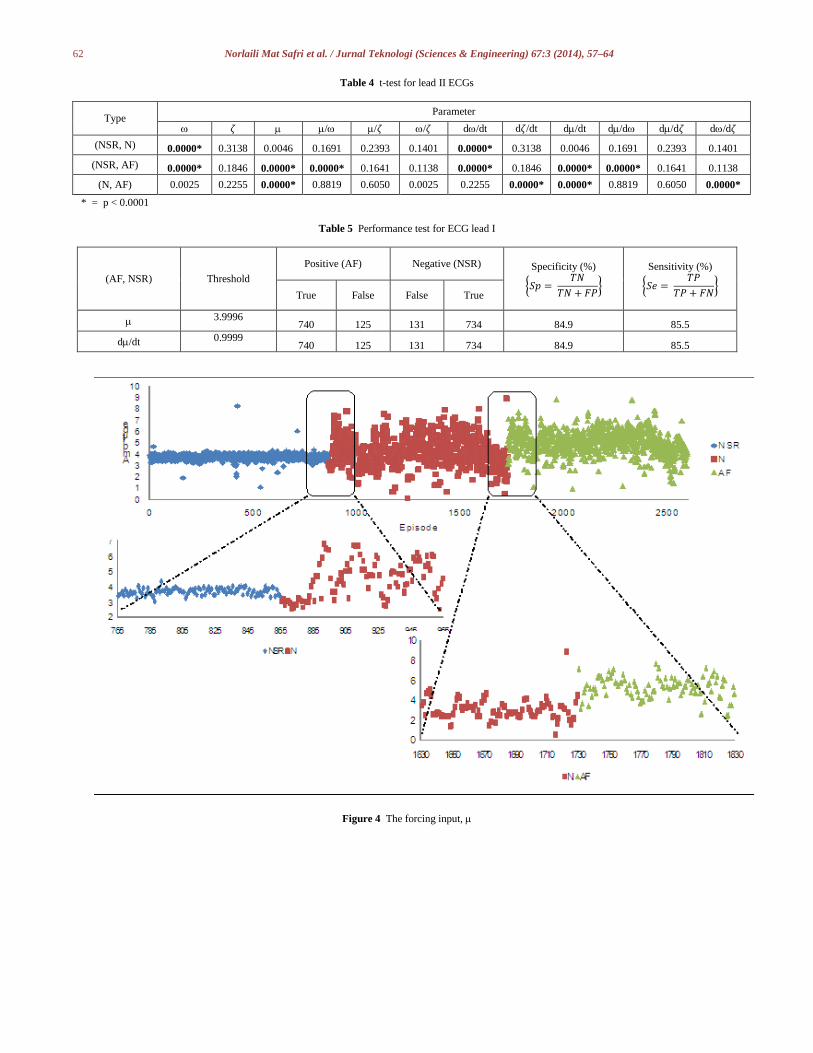
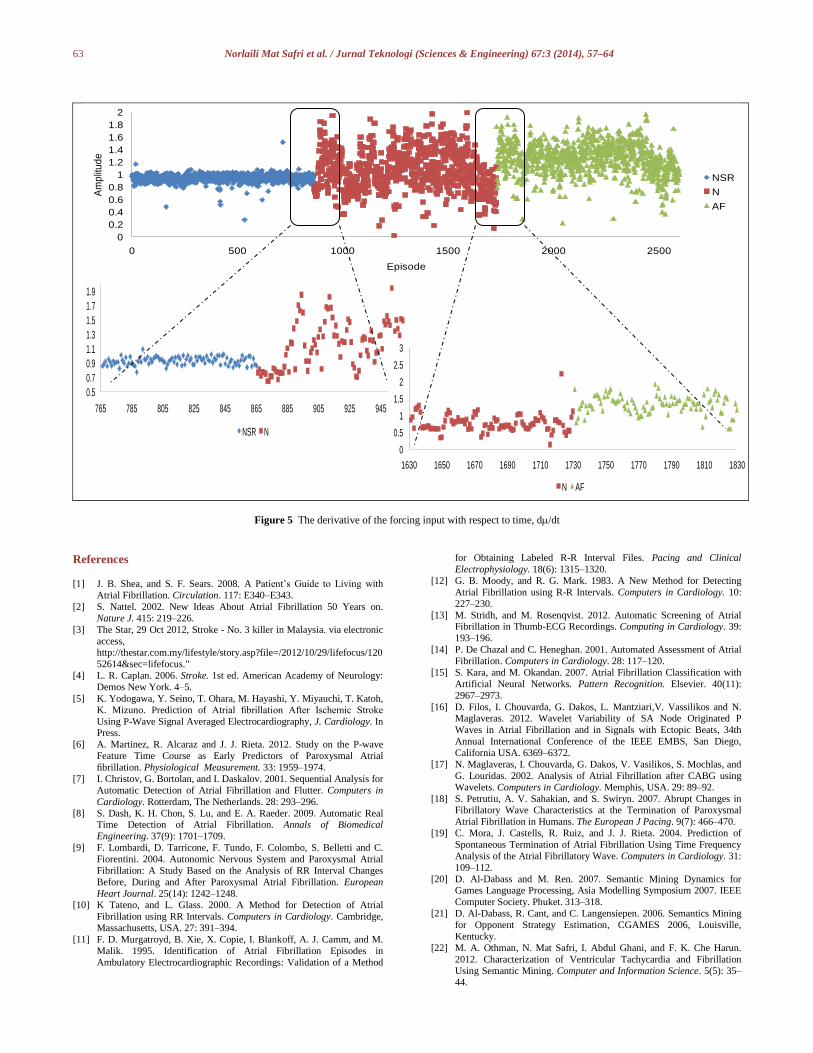
3.4 Performance
Figure 4 and Figure 5 show two extraction parameters, which are
forcing input, ; ratios of forcing input to natural frequency, /;
the derivative of the forcing input with respect to time, d/dt; and
the derivative of the forcing input with respect to the natural
frequency, d/d, respectively, for Lead 1 of the three types of
ECGs in the study, i.e. normal human ECG (NSR), normal sinus
rhythm of atrial fibrillation patient’s ECG (N) and atrial
fibrillation ECG (AF).
The result of the performance test is summarized in Table 5.
The true positive rate (sensitivity, Se) is for unhealthy human
ECG's features which correctly identified as having sick, while
the true negative rate (specificity, Sp) for healthy human ECG's
features that correctly identified as not having sick.
4.0 ANALYSIS AND DISCUSSIONS
The study aims at classifying paroxysmal atrial fibrillation using
second order system. Therefore, the ECGs chosen were normal
sinus rhythm of healthy human (NSR), normal sinus rhythm of
patient suffers atrial fibrillation (N), and atrial fibrillation of
respective human (AF). The MIT-BIH databases were used in the
study (NSR dataset and AF dataset). According to MIT-BIH AF
Dataset, the ECG recorded for 10 hours, and the selected sample
during this study, sample number #04126, had suffered AF for
seven times along the ECG trace. The optimum time that can be
used were 865 episodes for AF and N, which had occurred
sequentially during the seven time of AF recorded. Two ECG
Leads (Lead I and Lead II) were provided from each dataset. Both
Leads were used for three types of ECG aforementioned. As a
result, 5190 episodes were analyzed(865 𝑒𝑝𝑖𝑠𝑜𝑑𝑒𝑠 × 3 𝐸𝐶𝐺𝑠 ×2 𝐿𝑒𝑎𝑑𝑠), where each episode is four seconds in length.
The MIT-BIH NSR Dataset was provided in different
sampling frequency (128 Hz) compared to MIT-BIH AF Dataset.
Therefore, the rescaling process was done, up-sampling the
sampling frequency into 250 Hz, as MIT-BIH AF Dataset
sampling frequency. After that, the ECGs were filtered,
segmented, normalized, transformed, extracted, analyzed and
observed.
The features of the three types of ECG (NSR, N and AF),
were extracted using second order system, the concept of
dynamics. Twelve features were observed, i.e. damping
coefficient, 𝜁; natural frequency, ; and forcing input, ; ratios of
forcing input to natural frequency, /; ratios of forcing input to
damping coefficient, /𝜁; ratios of natural frequency to damping
coefficient, / 𝜁 ; the derivative of the natural frequency with
respect to time, d/dt; the derivative of the damping coefficient
with respect to time, d𝜁/dt; the derivative of the forcing input with
respect to time, d/dt; the derivative of the forcing input with
respect to the natural frequency, d/d; the derivative of the
forcing input with respect to the damping coefficient, d/d𝜁; and
the derivative of the natural frequency with respect to the
damping coefficient, d/d 𝜁 . Table 1 and Table 2 show the
parameters averaged values. Both Leads (Lead I and Lead II) had
increment in the averaged values from NSR-to-N-to-AF for six
parameters, i.e. natural frequency, ; and forcing input, ; ratios
of forcing input to natural frequency, /; the derivative of the
natural frequency with respect to time, d/dt; the derivative of the
forcing input with respect to time, d/dt and the derivative of the
forcing input with respect to the natural frequency, d/d.
Example for natural frequency, , the averaged valued are (NSR-
to-N-to-AF) 0.9015-0.9104-0.9407 for Lead I, and 0.9237-
0.9538-0.9601 for Lead II. Lead II provide higher value than Lead
I. According to 22, the forcing input, of patient suffering
ventricular arrhythmia, were averaged at 3.748±0.319 (Lead II),
while current study found that of patient suffering atrial
arrhythmia were averaged at 4.1609±2.4930 (Lead I) and
4.9446±2.5949 (Lead II), that were much greater than previous
study. This could be that previous study22, classified the
61 Norlaili Mat Safri et al. / Jurnal Teknologi (Sciences & Engineering) 67:3 (2014), 57–64
ventricular arrhythmia according to natural frequency, , while
current study according to forcing input, , which is more suitable
for the samples under observation.
Statistical two-tailed t-test was done to examine the
significant difference. Three group of examined were, i.e. NSR
and N, NSR and AF, and, N and AF, for both Lead I and Lead II.
As summarized in Table 3, it was found that forcing input, , and
forcing input differential of time, d/dt, of Lead I ECGs gave
significant differences for the three group aforementioned, with
probability, p less than 0.0001 (𝑝 < 0.0001) . Another two
parameters, ratios of forcing input to natural frequency, /, and
the derivative of the forcing input with respect to the natural
frequency, d/d, provided significant difference with 𝑝 <0.001, for the three group observed. While for Lead II (Table 4),
there were significant differences with 𝑝 < 0.0001 , but only
between two groups, i.e. NSR and N, and, NSR and AF, of natural
frequency,. No significant differences found for the same
parameter of the different groups.
Therefore, only two parameters can be considered to classify
NSR, N and AF of Lead I ECG. The parameters are forcing input,
, and the derivative of the forcing input with respect to time,
d/dt. The sensitivity (Se) and specificity (Sp) of the classification
system were summarized in Table 5. The true positive rate (Se) is
for unhealthy human's ECG, that is AF signals, which correctly
classified as having sick, whereas the true negative rate (Sp) is for
healthy human's ECG, that is NSR signals, which correctly
classified as not having sick. From the average data of the
samples, the threshold for forcing input, , and the derivative of
the forcing input with respect to time, d/dt, were set to 3.9996
and 0.9999, respectively. As a result, the specificity and
sensitivity for the classification process were 84.9 % and 85.5 %,
correspondingly, the same for both parameters ( and d/dt).
According to Figure 4 and Figure 5, in depth look can be seen for
100 samples of NSR and N each, and 100 samples of N and AF,
for parameter and d/dt, correspondingly. Forcing input, of
NSR tabulated in the range of 3-4 mV, while N and AF had wider
range, from 0 to 10 mV. In comparison, normal heart rate beats at
60 bpm, while patient suffer from AF can feel heart beat of 100 to
600 per minute.1-2
5.0 CONCLUSION
In conclusion, of all twelve parameters, two parameters give
significant difference for normal sinus rhythm of healthy person,
normal sinus rhythm of patient suffering atrial fibrillation and
atrial fibrillation, classification. Therefore, these two parameters
(forcing input, and the differential of time of forcing input,
d/dt) can be further studied to characterize and classify other
samples among world population. Hybrid second order system
approach may also be considered to increase the performance.
Acknowledgement
The authors would like to express their appreciation to MOHE
and Universiti Teknologi Malaysia for supporting and funding
this study under ERGS Grant No. R.J130000.7823.4L062 . We
are grateful for the Zamalah UTM scholarship to first author.
Table 1 Average and standard deviation for lead I ECGs
Type Parameter
𝜁 / /𝜁 /𝜁 d/dt d𝜁/dt d/dt d/d d/d𝜁 d/d𝜁
NSR Av 0.9015 -0.0003 3.7691 4.1864 -33000 -7531 0.2254 -0.0001 0.9423 4.1864 -33000 -7531
Sd 0.0281 0.0004 0.3159 0.3845 303131 66837 0.0070 0.0001 0.0790 0.3845 303131 66837
N Av 0.9104 0.0282 4.1609 4.8496 2019 368 0.2276 0.0071 1.0402 4.8496 2019 368
Sd 0.1464 0.8689 2.4930 3.8110 167266 40229 0.0366 0.2172 0.6233 3.8110 167266 40229
AF Av 0.9407 -0.0107 5.0500 5.4581 8019 1451 0.2352 -0.0027 1.2625 5.4581 8019 1451
Sd 0.0999 0.1430 1.7013 2.2597 279598 56431 0.0250 0.0358 0.4253 2.2597 279598 56431
Table 2 Average and standard deviation for lead II ECGs
Type Parameter
ζ / /ζ /ζ d/dt dζ/dt d/dt d/d d/dζ d/dζ
NSR Av 0.9237 0.0006 4.6717 5.0514 -19695 -3645 0.2309 0.0001 1.1679 5.0514 -19695 -3645
Sd 0.0308 0.0187 1.0200 1.0474 248025 39585 0.0077 0.0047 0.2550 1.0474 248025 39585
N Av 0.9538 -0.0002 4.9446 5.1907 -5179 -230 0.2384 0.0000 1.2362 5.1907 -5179 -230
Sd 0.0334 0.0119 2.5949 2.7543 263927 55209 0.0084 0.0030 0.6487 2.7543 263927 55209
AF Av 0.9601 -0.0079 5.7085 5.9987 -6635 -1256 0.2400 -0.0020 1.4271 5.9987 -6635 -1256
Sd 0.0529 0.1865 3.4696 3.7988 116734 19389 0.0132 0.0466 0.8674 3.7988 116734 19389
Table 3 t-test for lead I ECGs
Type Parameter
ζ / /ζ /ζ d/dt dζ/dt d/dt d/d d/dζ d/dζ
(NSR, N) 0.0809 0.3351 0.0000* 0.0000* 0.0028 0.0029 0.0809 0.3351 0.0000* 0.0000* 0.0028 0.0029
(NSR, AF) 0.0000* 0.0327 0.0000* 0.0000* 0.0035 0.0026 0.0000* 0.0327 0.0000* 0.0000* 0.0035 0.0026
(N, AF) 0.0000* 0.1941 0.0000* 0.0001' 0.5872 0.6445 0.0000* 0.1941 0.0000* 0.0001' 0.5872 0.6445
' = p < 0.001
* = p < 0.0001
62 Norlaili Mat Safri et al. / Jurnal Teknologi (Sciences & Engineering) 67:3 (2014), 57–64
Table 4 t-test for lead II ECGs
Type Parameter
𝜁 / /𝜁 /𝜁 d/dt d𝜁/dt d/dt d/d d/d𝜁 d/d𝜁
(NSR, N) 0.0000* 0.3138 0.0046 0.1691 0.2393 0.1401 0.0000* 0.3138 0.0046 0.1691 0.2393 0.1401
(NSR, AF) 0.0000* 0.1846 0.0000* 0.0000* 0.1641 0.1138 0.0000* 0.1846 0.0000* 0.0000* 0.1641 0.1138
(N, AF) 0.0025 0.2255 0.0000* 0.8819 0.6050 0.0025 0.2255 0.0000* 0.0000* 0.8819 0.6050 0.0000*
* = p < 0.0001
Table 5 Performance test for ECG lead I
(AF, NSR) Threshold
Positive (AF) Negative (NSR) Specificity (%)
{𝑆𝑝 = 𝑇𝑁
𝑇𝑁 + 𝐹𝑃}
Sensitivity (%)
{𝑆𝑒 = 𝑇𝑃
𝑇𝑃 + 𝐹𝑁}
True False False True
3.9996 740 125 131 734 84.9 85.5
d/dt 0.9999 740 125 131 734 84.9 85.5
Figure 4 The forcing input,
63 Norlaili Mat Safri et al. / Jurnal Teknologi (Sciences & Engineering) 67:3 (2014), 57–64
0.5
0.7
0.9
1.1
1.3
1.5
1.7
1.9
765 785 805 825 845 865 885 905 925 945 965
NSR N
0
0.5
1
1.5
2
2.5
3
1630 1650 1670 1690 1710 1730 1750 1770 1790 1810 1830
N AF
Figure 5 The derivative of the forcing input with respect to time, d/dt
References [1] J. B. Shea, and S. F. Sears. 2008. A Patient’s Guide to Living with
Atrial Fibrillation. Circulation. 117: E340–E343.
[2] S. Nattel. 2002. New Ideas About Atrial Fibrillation 50 Years on.
Nature J. 415: 219–226.
[3] The Star, 29 Oct 2012, Stroke - No. 3 killer in Malaysia. via electronic
access, http://thestar.com.my/lifestyle/story.asp?file=/2012/10/29/lifefocus/120
52614&sec=lifefocus."
[4] L. R. Caplan. 2006. Stroke. 1st ed. American Academy of Neurology:
Demos New York. 4–5.
[5] K. Yodogawa, Y. Seino, T. Ohara, M. Hayashi, Y. Miyauchi, T. Katoh,
K. Mizuno. Prediction of Atrial fibrillation After Ischemic Stroke
Using P-Wave Signal Averaged Electrocardiography, J. Cardiology. In Press.
[6] A. Martinez, R. Alcaraz and J. J. Rieta. 2012. Study on the P-wave
Feature Time Course as Early Predictors of Paroxysmal Atrial
fibrillation. Physiological Measurement. 33: 1959–1974.
[7] I. Christov, G. Bortolan, and I. Daskalov. 2001. Sequential Analysis for
Automatic Detection of Atrial Fibrillation and Flutter. Computers in
Cardiology. Rotterdam, The Netherlands. 28: 293–296.
[8] S. Dash, K. H. Chon, S. Lu, and E. A. Raeder. 2009. Automatic Real Time Detection of Atrial Fibrillation. Annals of Biomedical
Engineering. 37(9): 1701–1709.
[9] F. Lombardi, D. Tarricone, F. Tundo, F. Colombo, S. Belletti and C.
Fiorentini. 2004. Autonomic Nervous System and Paroxysmal Atrial
Fibrillation: A Study Based on the Analysis of RR Interval Changes
Before, During and After Paroxysmal Atrial Fibrillation. European
Heart Journal. 25(14): 1242–1248. [10] K Tateno, and L. Glass. 2000. A Method for Detection of Atrial
Fibrillation using RR Intervals. Computers in Cardiology. Cambridge,
Massachusetts, USA. 27: 391–394.
[11] F. D. Murgatroyd, B. Xie, X. Copie, I. Blankoff, A. J. Camm, and M.
Malik. 1995. Identification of Atrial Fibrillation Episodes in
Ambulatory Electrocardiographic Recordings: Validation of a Method
for Obtaining Labeled R-R Interval Files. Pacing and Clinical
Electrophysiology. 18(6): 1315–1320.
[12] G. B. Moody, and R. G. Mark. 1983. A New Method for Detecting
Atrial Fibrillation using R-R Intervals. Computers in Cardiology. 10:
227–230.
[13] M. Stridh, and M. Rosenqvist. 2012. Automatic Screening of Atrial Fibrillation in Thumb-ECG Recordings. Computing in Cardiology. 39:
193–196.
[14] P. De Chazal and C. Heneghan. 2001. Automated Assessment of Atrial
Fibrillation. Computers in Cardiology. 28: 117–120.
[15] S. Kara, and M. Okandan. 2007. Atrial Fibrillation Classification with
Artificial Neural Networks. Pattern Recognition. Elsevier. 40(11):
2967–2973.
[16] D. Filos, I. Chouvarda, G. Dakos, L. Mantziari,V. Vassilikos and N. Maglaveras. 2012. Wavelet Variability of SA Node Originated P
Waves in Atrial Fibrillation and in Signals with Ectopic Beats, 34th
Annual International Conference of the IEEE EMBS, San Diego,
California USA. 6369–6372.
[17] N. Maglaveras, I. Chouvarda, G. Dakos, V. Vasilikos, S. Mochlas, and
G. Louridas. 2002. Analysis of Atrial Fibrillation after CABG using
Wavelets. Computers in Cardiology. Memphis, USA. 29: 89–92.
[18] S. Petrutiu, A. V. Sahakian, and S. Swiryn. 2007. Abrupt Changes in Fibrillatory Wave Characteristics at the Termination of Paroxysmal
Atrial Fibrillation in Humans. The European J Pacing. 9(7): 466–470.
[19] C. Mora, J. Castells, R. Ruiz, and J. J. Rieta. 2004. Prediction of
Spontaneous Termination of Atrial Fibrillation Using Time Frequency
Analysis of the Atrial Fibrillatory Wave. Computers in Cardiology. 31:
109–112.
[20] D. Al-Dabass and M. Ren. 2007. Semantic Mining Dynamics for Games Language Processing, Asia Modelling Symposium 2007. IEEE
Computer Society. Phuket. 313–318.
[21] D. Al-Dabass, R. Cant, and C. Langensiepen. 2006. Semantics Mining
for Opponent Strategy Estimation, CGAMES 2006, Louisville,
Kentucky.
[22] M. A. Othman, N. Mat Safri, I. Abdul Ghani, and F. K. Che Harun.
2012. Characterization of Ventricular Tachycardia and Fibrillation
Using Semantic Mining. Computer and Information Science. 5(5): 35–44.
0
0.2
0.4
0.6
0.8
1
1.2
1.4
1.6
1.8
2
0 500 1000 1500 2000 2500
Am
plit
ud
e
Episode
NSR
N
AF

64 Norlaili Mat Safri et al. / Jurnal Teknologi (Sciences & Engineering) 67:3 (2014), 57–64
[23] Mohd Afzan Othman, Norlaili Mat Safri, Ismawati Abdul Ghani,
Fauzan Khairi Che Harun, and Ismail Ariffin. 2013. A New Semantic
Mining Approach for Detecting Ventricular Tachycardia and
Ventricular Fibrillation. Biomedical Signal Processing and Control. 8:
222–227. [24] Mohd Afzan Othman and Norlaili Mat Safri. 2012. Characterization of
Ventricular Arrhythmias Using a Semantic Mining Algorithm. Journal
of Mechanics in Medicine and Biology. 12(3): 1250049-(1–11).
[25] N. A. Abdul-Kadir, N. Mat Safri, and M. A. Othman. 2013. Feasibility
Study of Semantic Mining for Predicting the Onset of Atrial
Fibrillation. In: 4th International Graduate Conference on Engineering
Science & Humanity 2013, 4th IGCESH2013. 184–189.
[26] A. L. Goldberger, L. A. N. Amaral, L. Glass, J. M. Hausdorff, P. Ch. Ivanov, R. G. Mark, J. E. Mietus, G. B. Moody, C-K. Peng, Stanley H.
E. 2000. PhysioBank, PhysioToolkit, and PhysioNet: Components of a
New Research Resource for Complex Physiologic Signals. Circulation.
101(23): e215–e220.