johor real estate market outlook 2018 · iskandar malaysia 65% batu pahat 11% muar 8% others 16%...
TRANSCRIPT
JOHOR REAL ESTATE MARKET OUTLOOK
2018
PREPARED BY:
LIEW TOH SENMABEST PROPERTIES
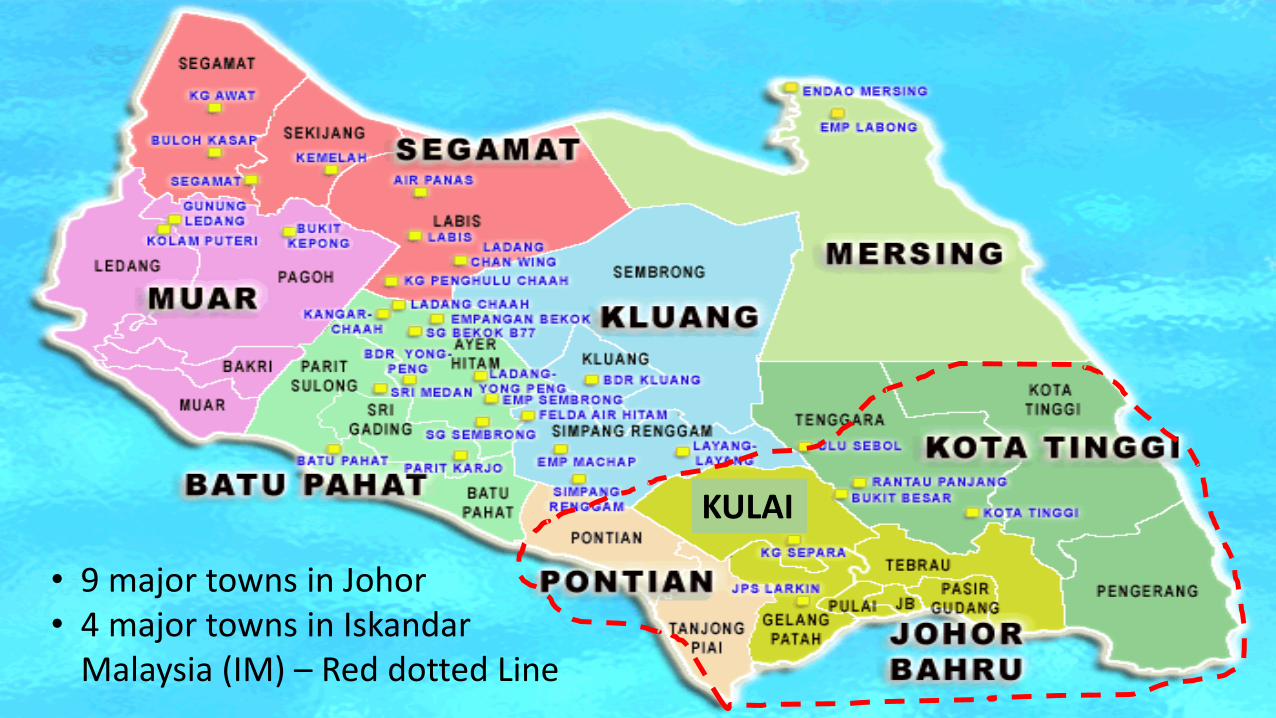
• 9 major towns in Johor• 4 major towns in Iskandar
Malaysia (IM) – Red dotted Line
KULAI
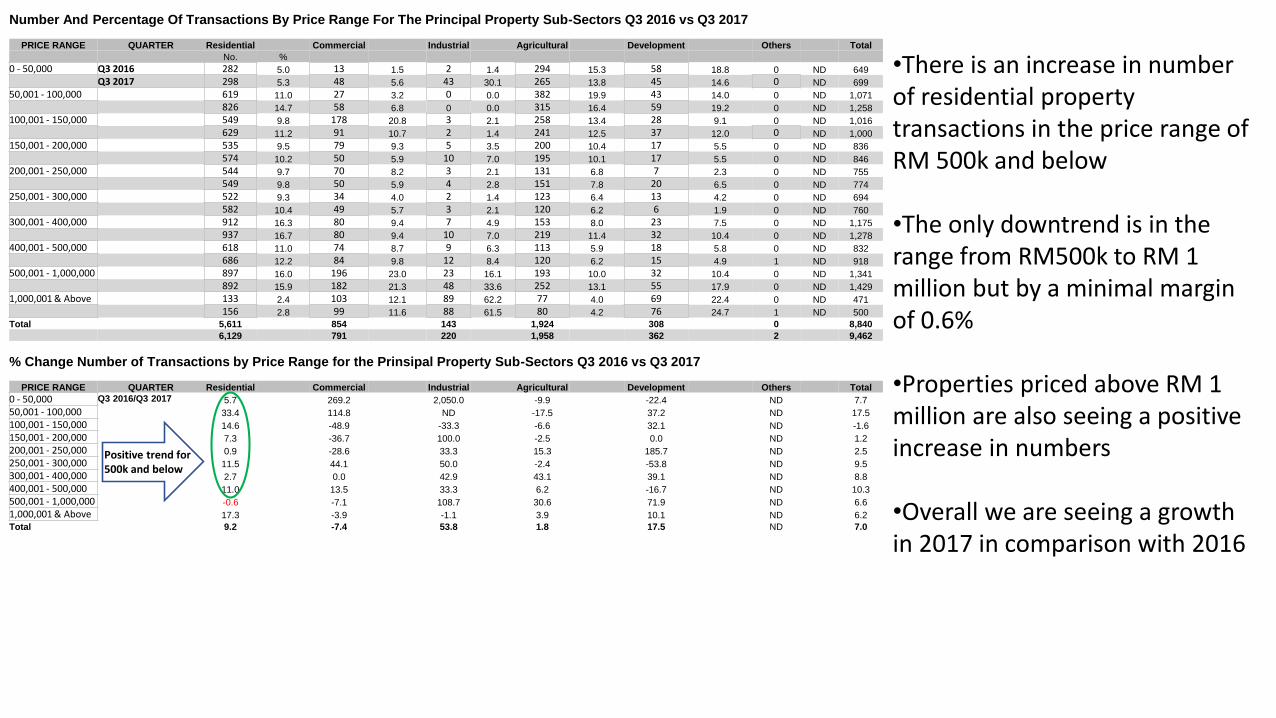
Number And Percentage Of Transactions By Price Range For The Principal Property Sub-Sectors Q3 2016 vs Q3 2017
PRICE RANGE QUARTER Residential Commercial Industrial Agricultural Development Others Total
No. %
0 - 50,000 Q3 2016 282 5.0 13 1.5 2 1.4 294 15.3 58 18.8 0 ND 649
Q3 2017 298 5.3 48 5.6 43 30.1 265 13.8 45 14.6 0 ND 699
50,001 - 100,000 619 11.0 27 3.2 0 0.0 382 19.9 43 14.0 0 ND 1,071
826 14.7 58 6.8 0 0.0 315 16.4 59 19.2 0 ND 1,258
100,001 - 150,000 549 9.8 178 20.8 3 2.1 258 13.4 28 9.1 0 ND 1,016
629 11.2 91 10.7 2 1.4 241 12.5 37 12.0 0 ND 1,000
150,001 - 200,000 535 9.5 79 9.3 5 3.5 200 10.4 17 5.5 0 ND 836
574 10.2 50 5.9 10 7.0 195 10.1 17 5.5 0 ND 846
200,001 - 250,000 544 9.7 70 8.2 3 2.1 131 6.8 7 2.3 0 ND 755
549 9.8 50 5.9 4 2.8 151 7.8 20 6.5 0 ND 774
250,001 - 300,000 522 9.3 34 4.0 2 1.4 123 6.4 13 4.2 0 ND 694
582 10.4 49 5.7 3 2.1 120 6.2 6 1.9 0 ND 760
300,001 - 400,000 912 16.3 80 9.4 7 4.9 153 8.0 23 7.5 0 ND 1,175
937 16.7 80 9.4 10 7.0 219 11.4 32 10.4 0 ND 1,278
400,001 - 500,000 618 11.0 74 8.7 9 6.3 113 5.9 18 5.8 0 ND 832
686 12.2 84 9.8 12 8.4 120 6.2 15 4.9 1 ND 918
500,001 - 1,000,000 897 16.0 196 23.0 23 16.1 193 10.0 32 10.4 0 ND 1,341
892 15.9 182 21.3 48 33.6 252 13.1 55 17.9 0 ND 1,429
1,000,001 & Above 133 2.4 103 12.1 89 62.2 77 4.0 69 22.4 0 ND 471
156 2.8 99 11.6 88 61.5 80 4.2 76 24.7 1 ND 500
Total 5,611 854 143 1,924 308 0 8,840
6,129 791 220 1,958 362 2 9,462
% Change Number of Transactions by Price Range for the Prinsipal Property Sub-Sectors Q3 2016 vs Q3 2017
PRICE RANGE QUARTER Residential Commercial Industrial Agricultural Development Others Total
0 - 50,000 Q3 2016/Q3 2017 5.7 269.2 2,050.0 -9.9 -22.4 ND 7.7
50,001 - 100,000 33.4 114.8 ND -17.5 37.2 ND 17.5
100,001 - 150,000 14.6 -48.9 -33.3 -6.6 32.1 ND -1.6
150,001 - 200,000 7.3 -36.7 100.0 -2.5 0.0 ND 1.2
200,001 - 250,000 0.9 -28.6 33.3 15.3 185.7 ND 2.5
250,001 - 300,000 11.5 44.1 50.0 -2.4 -53.8 ND 9.5
300,001 - 400,000 2.7 0.0 42.9 43.1 39.1 ND 8.8
400,001 - 500,000 11.0 13.5 33.3 6.2 -16.7 ND 10.3
500,001 - 1,000,000 -0.6 -7.1 108.7 30.6 71.9 ND 6.6
1,000,001 & Above 17.3 -3.9 -1.1 3.9 10.1 ND 6.2
Total 9.2 -7.4 53.8 1.8 17.5 ND 7.0
Positive trend for 500k and below
•There is an increase in number of residential property transactions in the price range of RM 500k and below
•The only downtrend is in the range from RM500k to RM 1 million but by a minimal margin of 0.6%
•Properties priced above RM 1 million are also seeing a positive increase in numbers
•Overall we are seeing a growth in 2017 in comparison with 2016
Residential65%
Commercial8%
Industrial2%
Others25%
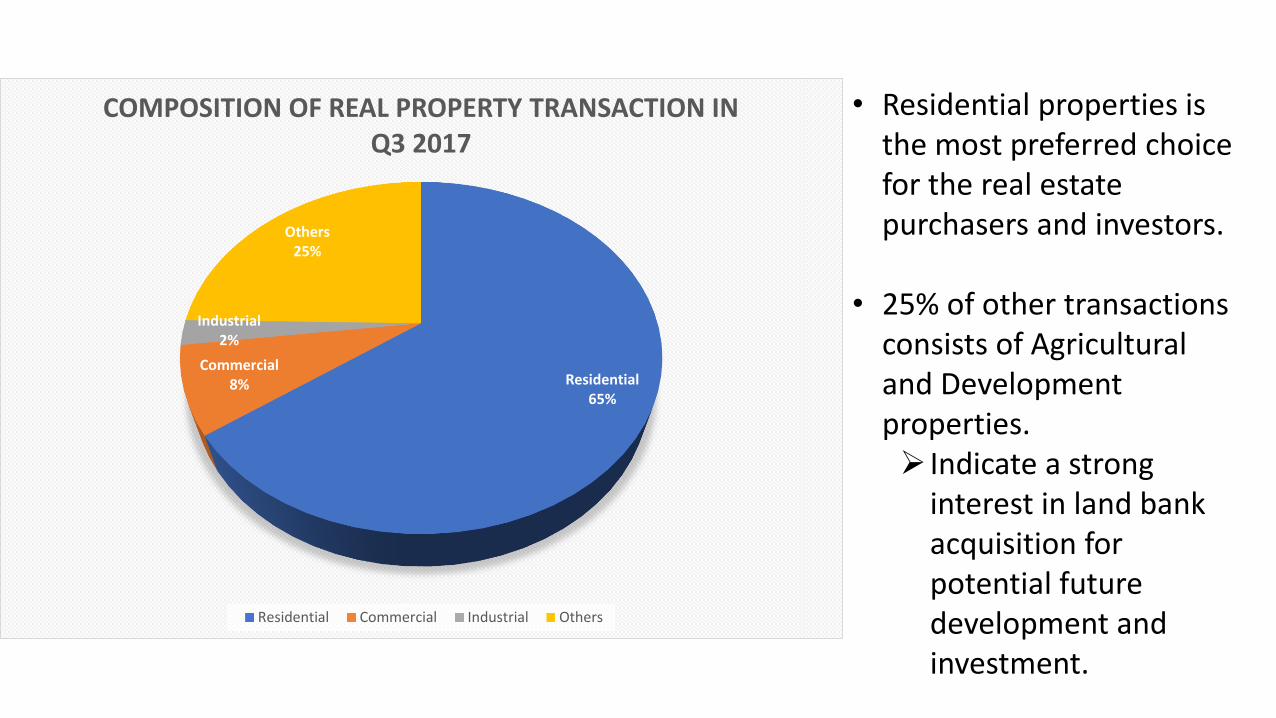
COMPOSITION OF REAL PROPERTY TRANSACTION IN Q3 2017
Residential Commercial Industrial Others
• Residential properties is the most preferred choice for the real estate purchasers and investors.
• 25% of other transactions consists of Agricultural and Development properties.➢ Indicate a strong
interest in land bank acquisition for potential future development and investment.
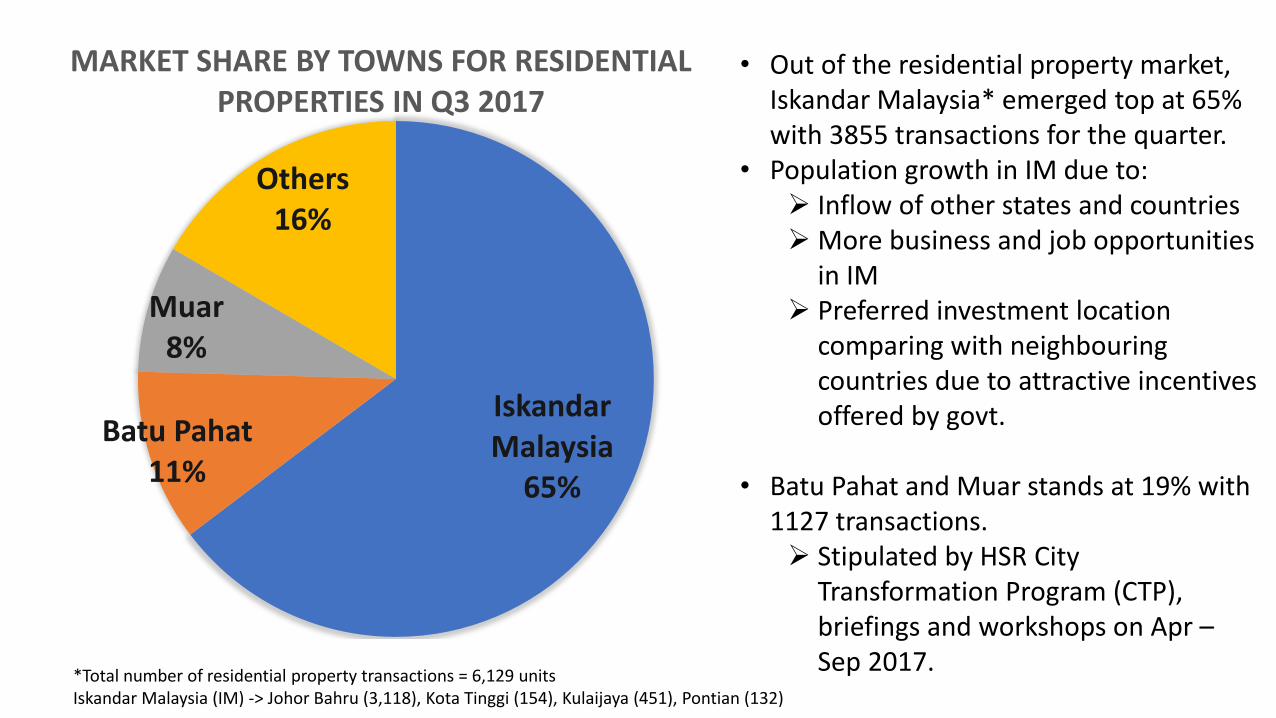
Iskandar Malaysia
65%
Batu Pahat11%
Muar8%
Others16%
MARKET SHARE BY TOWNS FOR RESIDENTIAL PROPERTIES IN Q3 2017
• Out of the residential property market, Iskandar Malaysia* emerged top at 65% with 3855 transactions for the quarter.
• Population growth in IM due to:➢ Inflow of other states and countries➢ More business and job opportunities
in IM➢ Preferred investment location
comparing with neighbouring countries due to attractive incentives offered by govt.
• Batu Pahat and Muar stands at 19% with 1127 transactions.➢ Stipulated by HSR City
Transformation Program (CTP), briefings and workshops on Apr –Sep 2017.
*Total number of residential property transactions = 6,129 unitsIskandar Malaysia (IM) -> Johor Bahru (3,118), Kota Tinggi (154), Kulaijaya (451), Pontian (132)
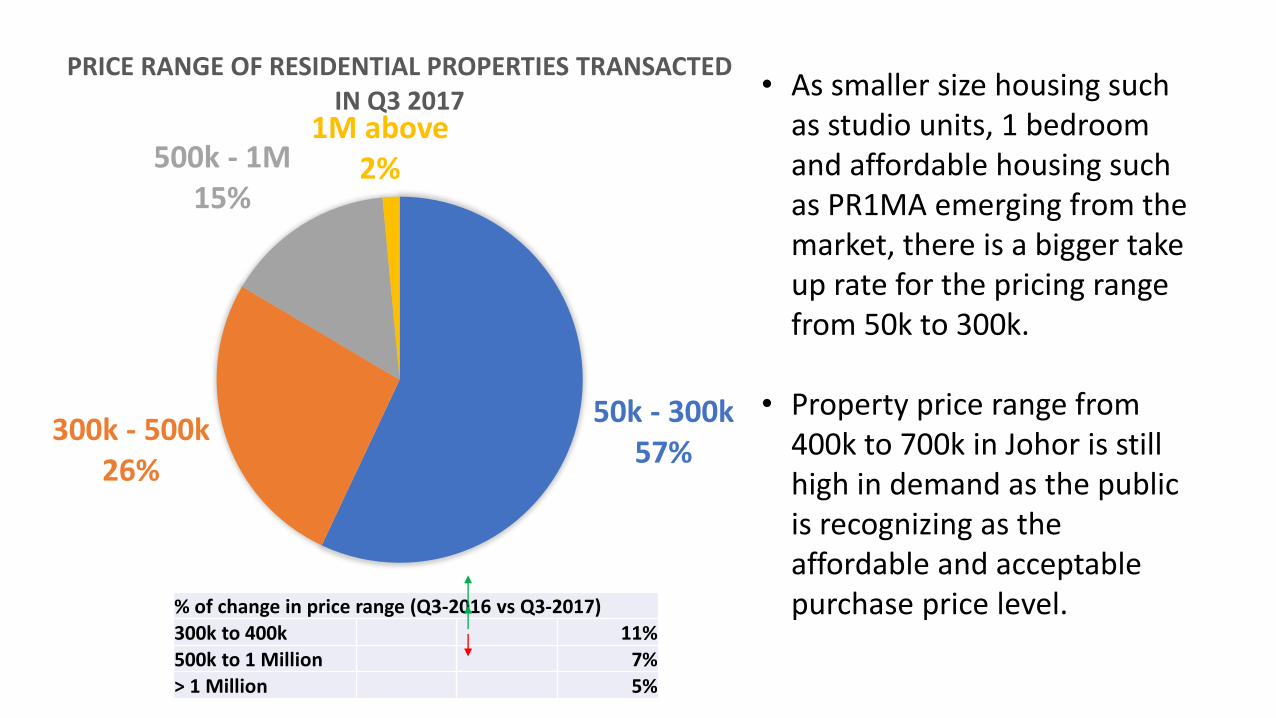
50k - 300k57%
300k - 500k26%
500k - 1M15%
1M above2%
PRICE RANGE OF RESIDENTIAL PROPERTIES TRANSACTED IN Q3 2017
• As smaller size housing such as studio units, 1 bedroom and affordable housing such as PR1MA emerging from the market, there is a bigger take up rate for the pricing range from 50k to 300k.
• Property price range from 400k to 700k in Johor is still high in demand as the public is recognizing as the affordable and acceptable purchase price level.% of change in price range (Q3-2016 vs Q3-2017)
300k to 400k 11%500k to 1 Million 7%> 1 Million 5%

Iskandar Malayisa
53%Muar18%
Batu Pahat12%
Others17%
MARKET SHARE BY TOWNS FOR COMMERCIAL PROPERTIES IN Q3 2017
• Iskandar Malaysia (IM) is at the top of the commercial property transactions with mainly 2 to 3.5 storeys shop offices representing the numbers and a portion are from Hotels
• Muar is at second position purely with shop offices transactions
• Batu Pahat’s commercial market seems to slow down with only 12% market share
• Shop offices are still the core of the total transactions in the commercial properties segment
• Contributing Factors:➢ HSR➢ Increase in Job Opportunities➢ Increase in Economic Activities
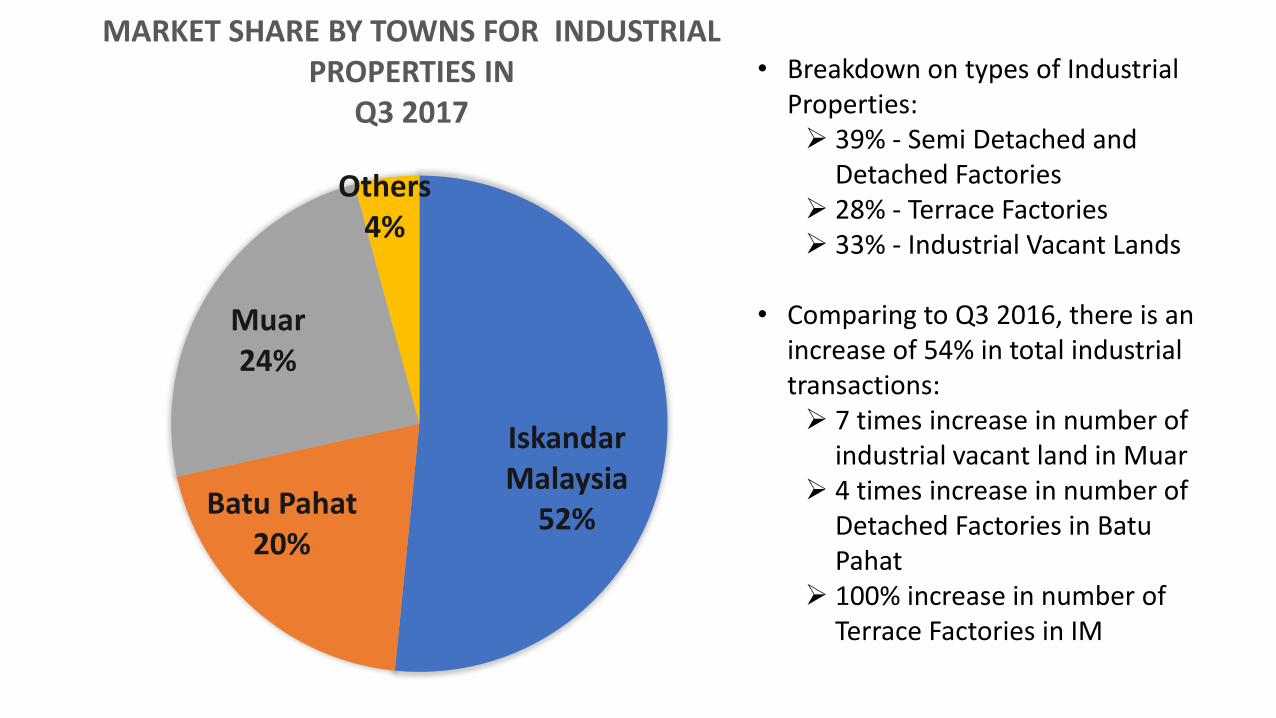
Iskandar Malaysia
52%Batu Pahat20%
Muar24%
Others4%
MARKET SHARE BY TOWNS FOR INDUSTRIAL PROPERTIES IN
Q3 2017
• Breakdown on types of Industrial Properties:➢ 39% - Semi Detached and
Detached Factories➢ 28% - Terrace Factories➢ 33% - Industrial Vacant Lands
• Comparing to Q3 2016, there is an increase of 54% in total industrial transactions:➢ 7 times increase in number of
industrial vacant land in Muar➢ 4 times increase in number of
Detached Factories in BatuPahat
➢ 100% increase in number of Terrace Factories in IM

2018 MARKET O U TLO O K
Iskandar Malaysia
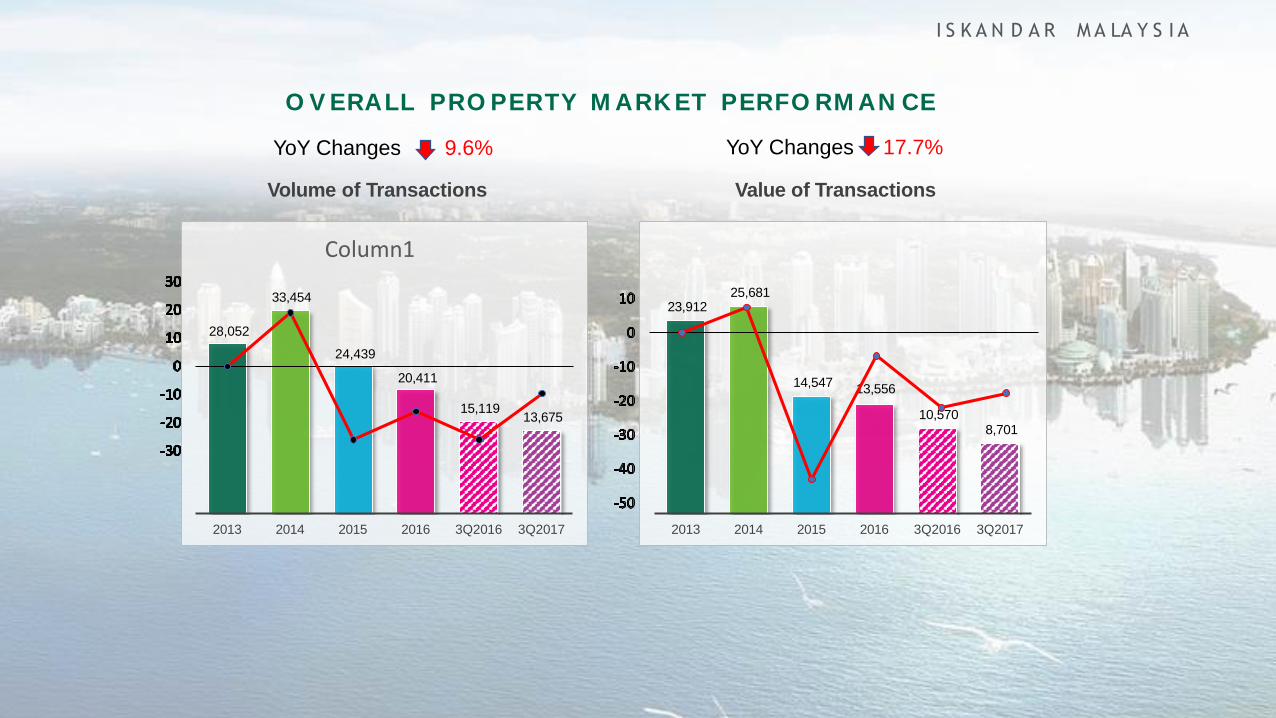
23,91225,681
14,54713,556
10,5708,701
2013 2014 2015 2016 3Q2016 3Q2017
33,454
28,052
24,439
20,411
15,11913,675
2013 2014 2015 2016 3Q2016 3Q2017
O V ERALL PRO PERTY M ARK ET PERFO RM AN CE
YoY Changes 9.6% YoY Changes 17.7%
Volume of Transactions Value of Transactions
I S K A N D A R M A L A Y S I A
Column1
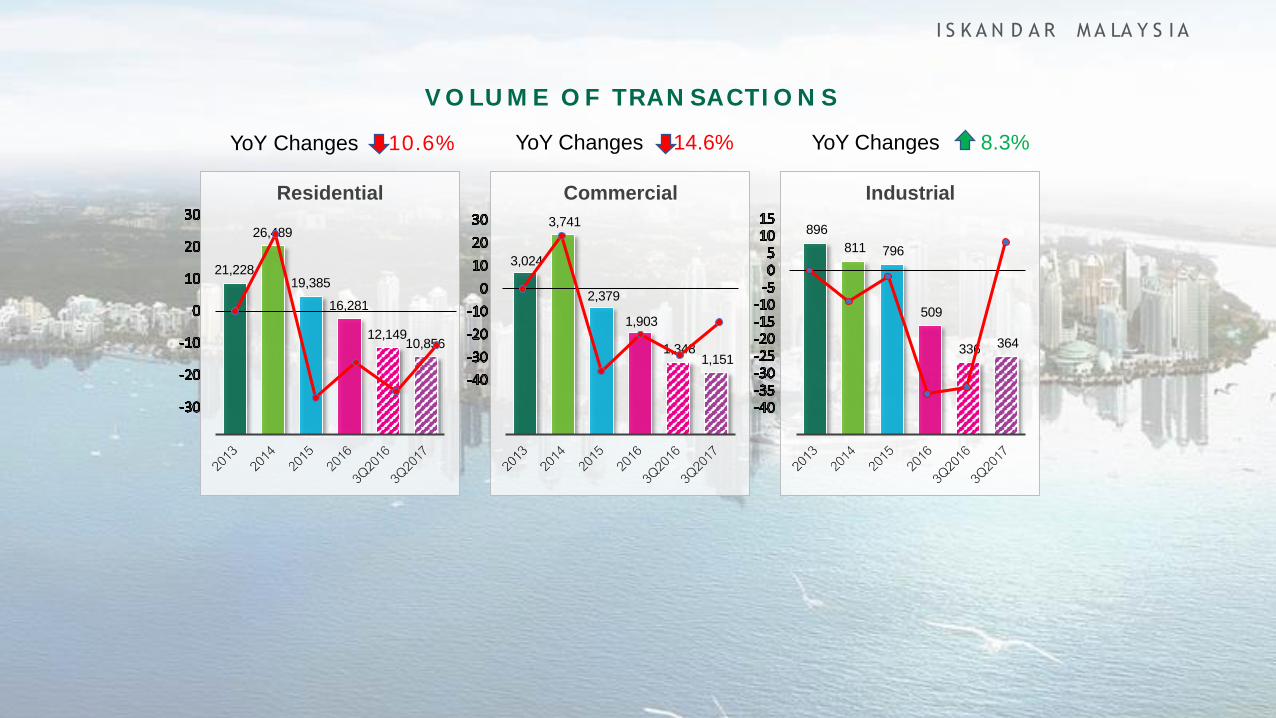
1,3481,151
Commercial
3,741
3,024
2,379
1,903
21,22819,385
16,281
12,14910,856
Residential
26,489 896
811 796
509
336 364
Industrial
V O LU M E O F TRAN SACTI O N S
YoY Changes 10.6% YoY Changes 14.6% YoY Changes 8.3%
I S K A N D A R M A L A Y S I A
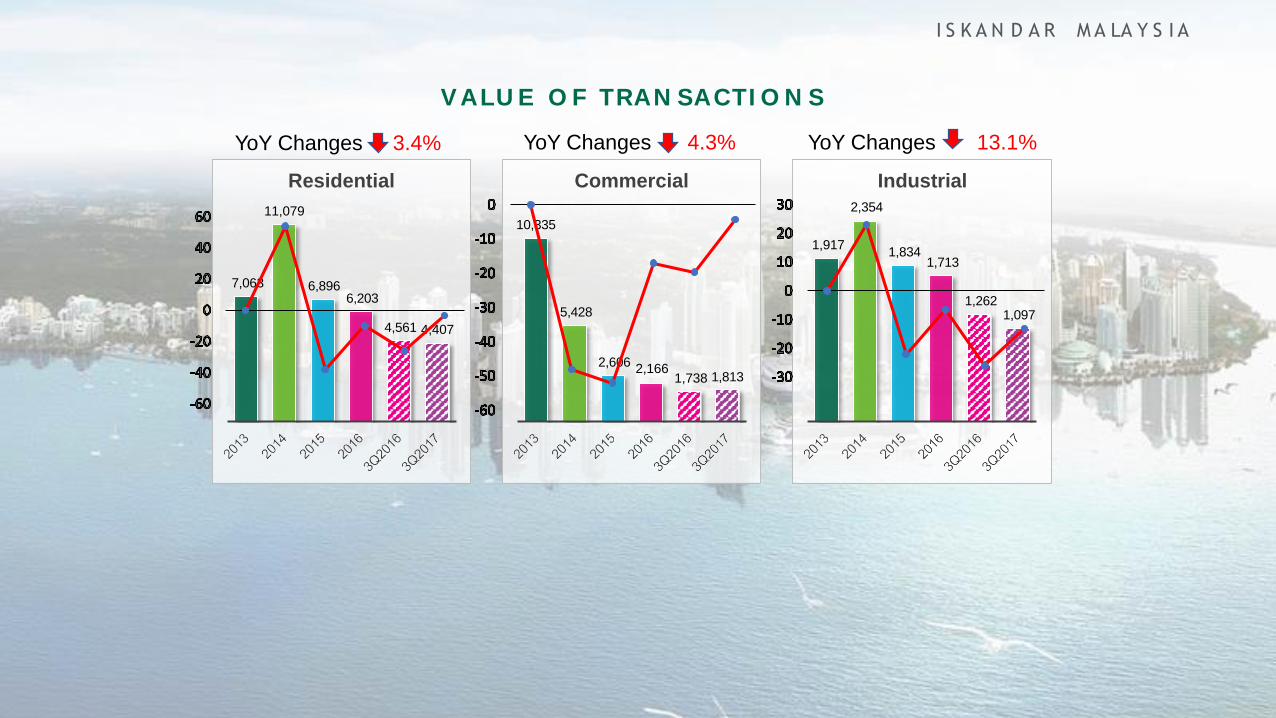
10,335
5,428
2,6062,166
1,738 1,813
7,063 6,8966,203
4,561 4,407
Residential Commercial
11,079
1,9171,834
1,713
1,2621,097
Industrial
2,354
V ALU E O F TRAN SACTI O N S
YoY Changes 3.4% YoY Changes 4.3% YoY Changes 13.1%
I S K A N D A R M A L A Y S I A
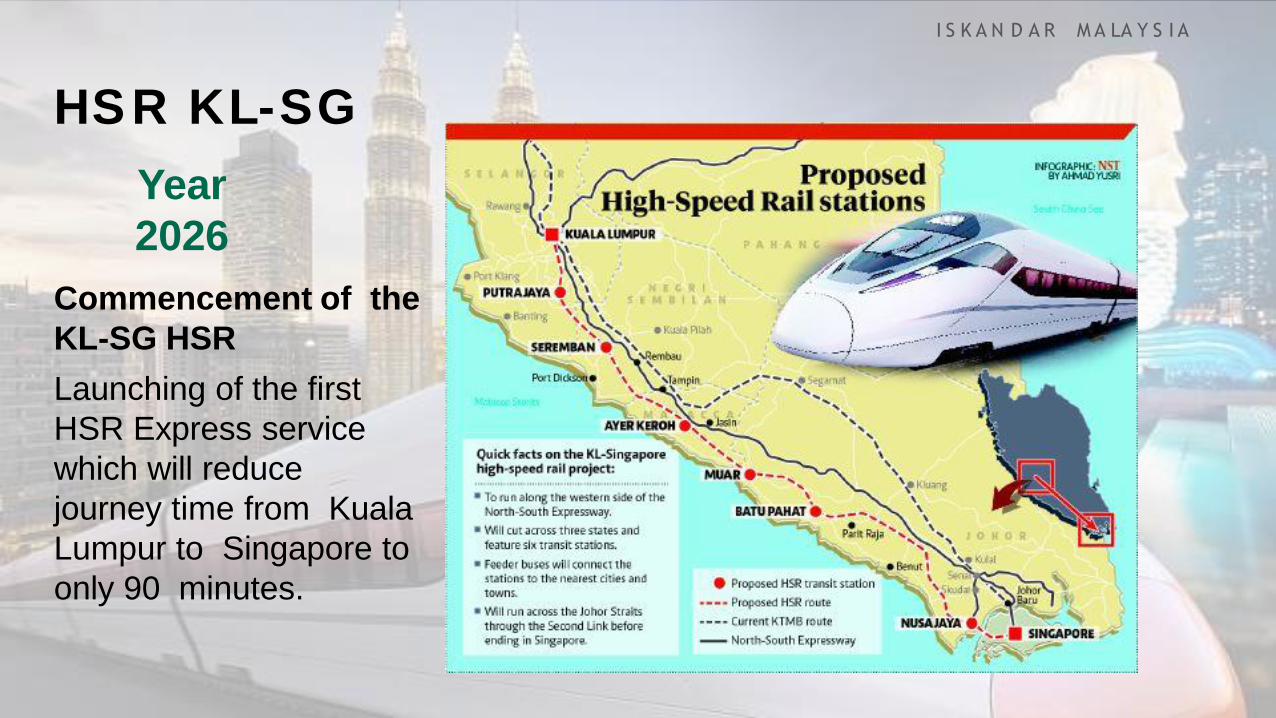
Commencement of the
KL-SG HSR
Launching of the first
HSR Express service
which will reduce
journey time from Kuala
Lumpur to Singapore to
only 90 minutes.
Year
2026
HSR KL-SG
I S K A N D A R M A L A Y S I A
I S K A N D A R M A L A Y S I A
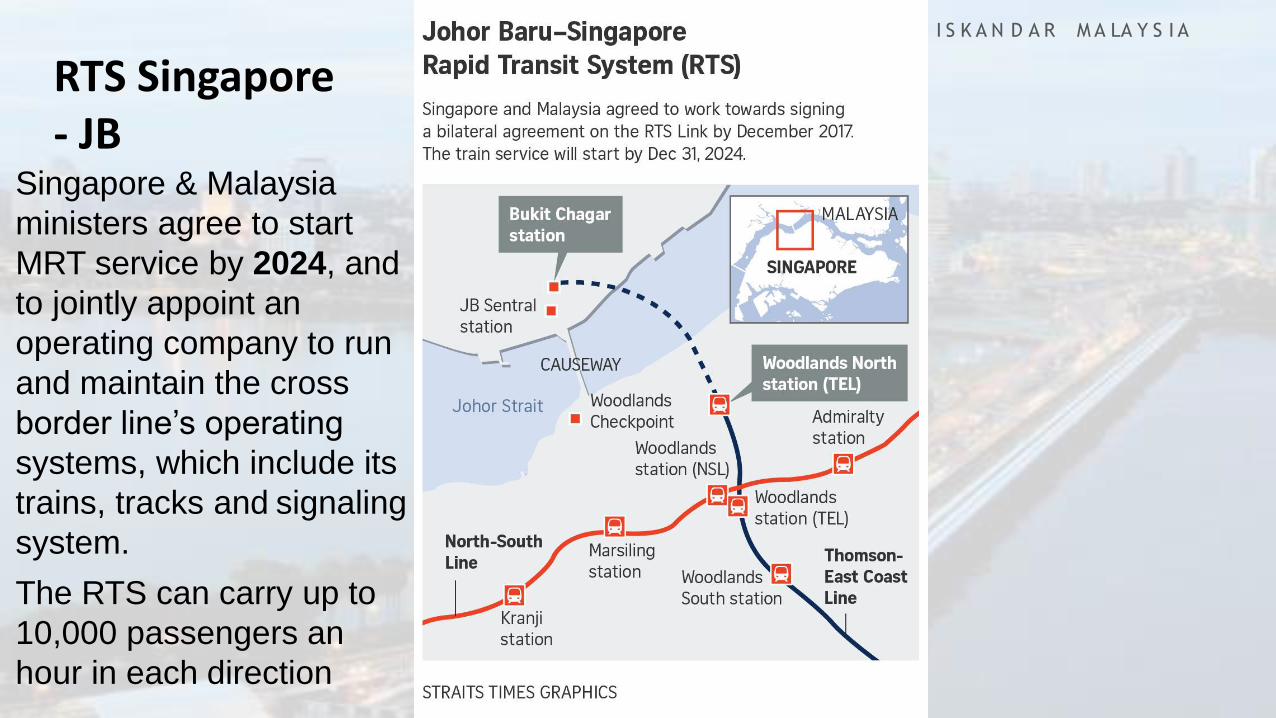
Singapore & Malaysia
ministers agree to start
MRT service by 2024, and
to jointly appoint an
operating company to run
and maintain the cross
border line’s operating
systems, which include its
trains, tracks and signaling
system.
The RTS can carry up to
10,000 passengers an
hour in each direction
RTS Singapore - JB
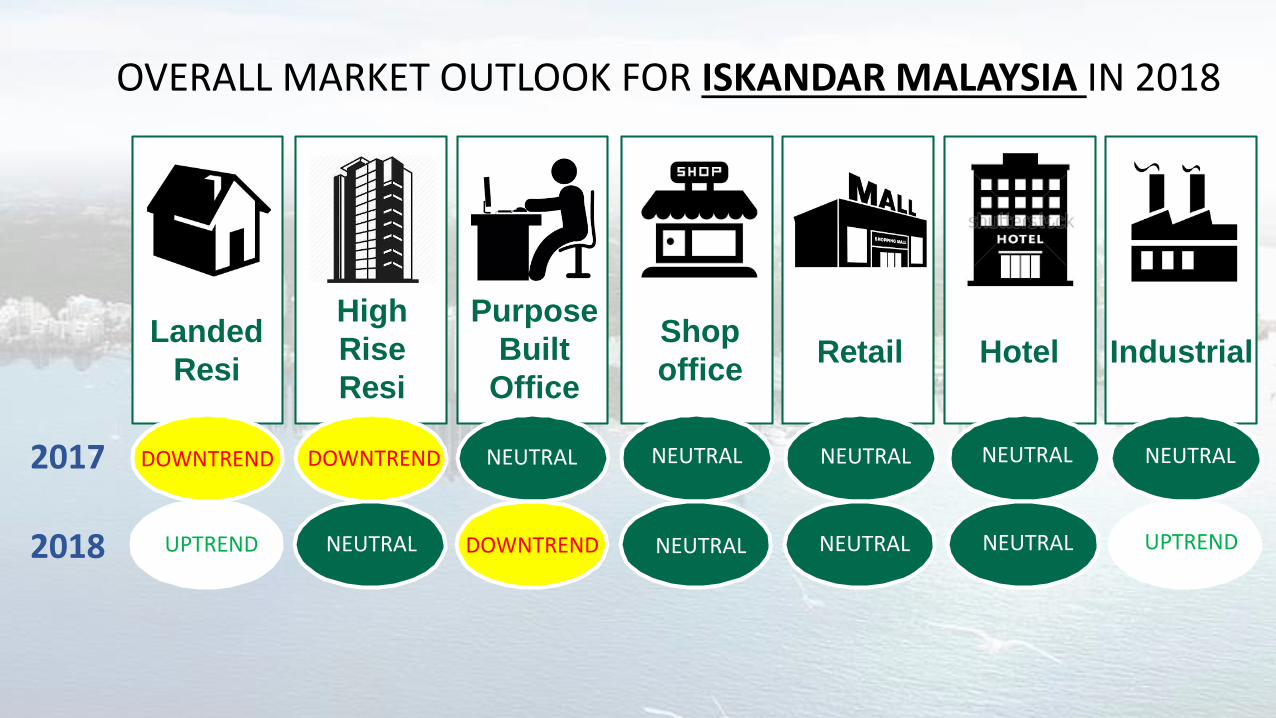
Landed
Resi
High
Rise
Resi
Purpose
Built
Office
Shop
officeRetail Hotel Industrial
OVERALL MARKET OUTLOOK FOR ISKANDAR MALAYSIA IN 2018
2017
2018 UPTREND
DOWNTREND NEUTRALDOWNTREND NEUTRALNEUTRAL NEUTRALNEUTRAL
NEUTRAL NEUTRAL NEUTRAL NEUTRAL UPTRENDDOWNTREND
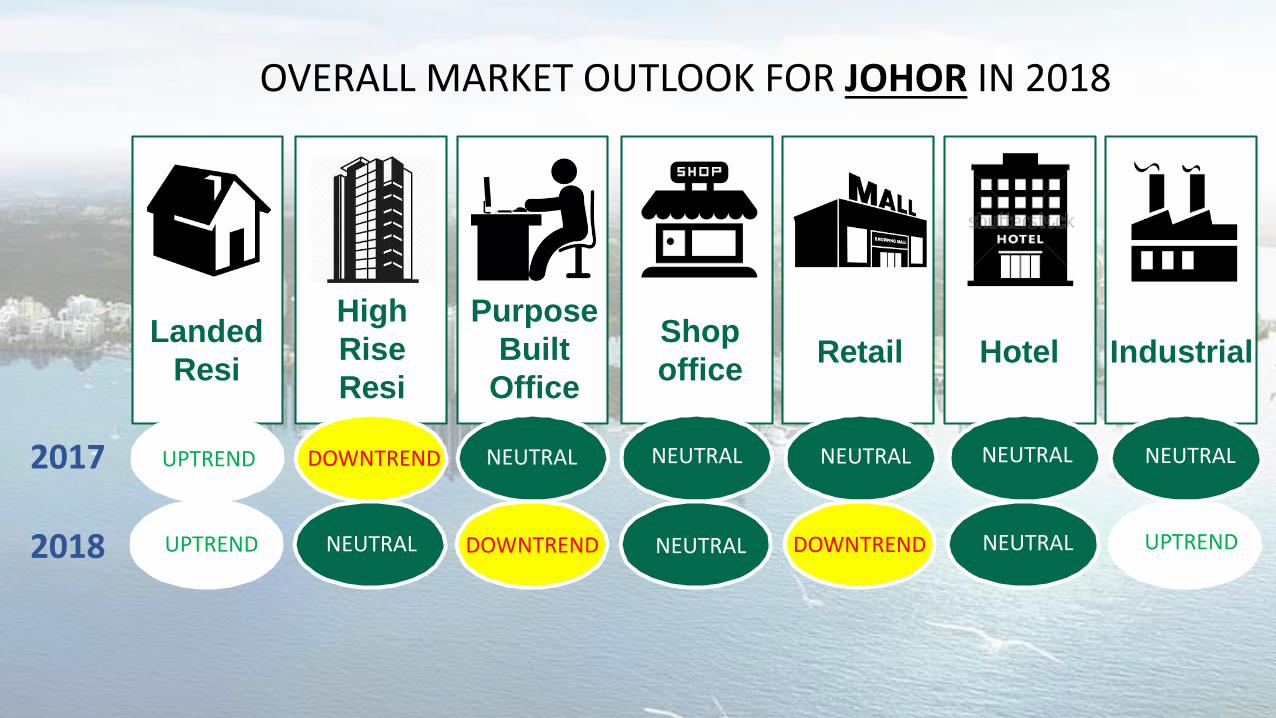
Landed
Resi
High
Rise
Resi
Purpose
Built
Office
Shop
officeRetail Hotel Industrial
OVERALL MARKET OUTLOOK FOR JOHOR IN 2018
2017
2018 UPTREND
UPTREND NEUTRALDOWNTREND NEUTRALNEUTRAL NEUTRALNEUTRAL
NEUTRAL NEUTRAL DOWNTREND NEUTRAL UPTRENDDOWNTREND
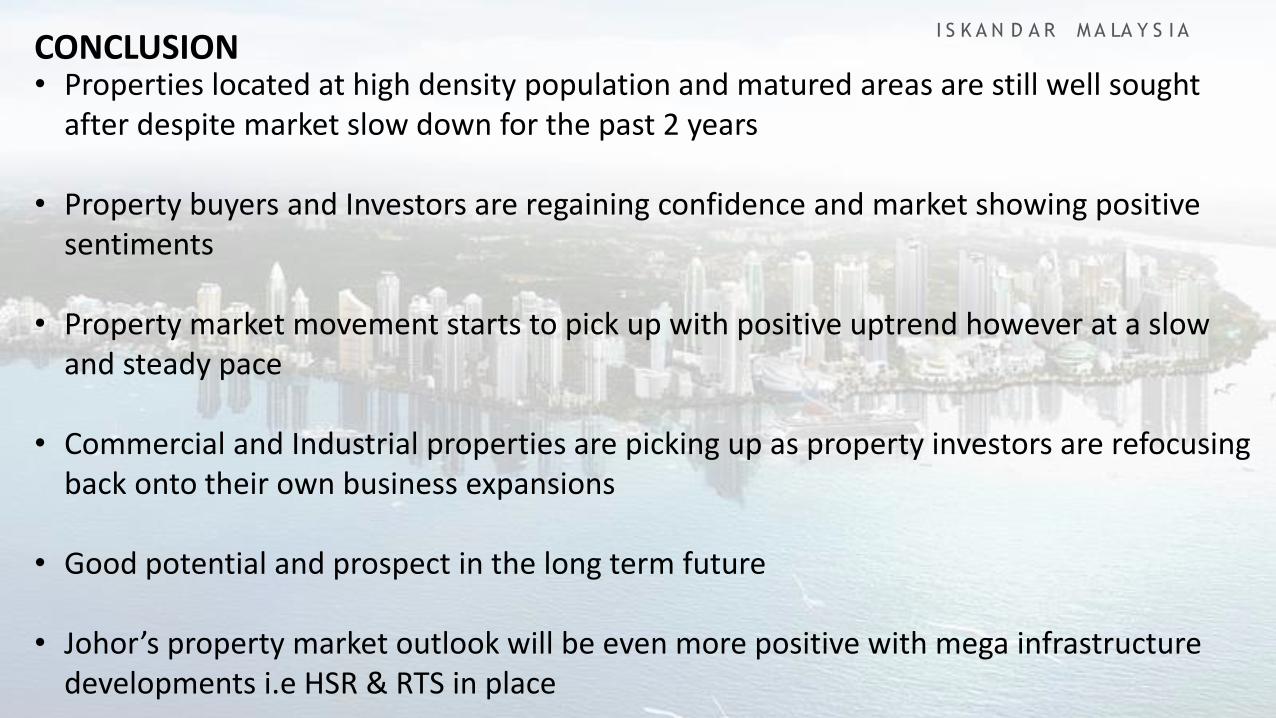
CONCLUSION• Properties located at high density population and matured areas are still well sought
after despite market slow down for the past 2 years
• Property buyers and Investors are regaining confidence and market showing positive sentiments
• Property market movement starts to pick up with positive uptrend however at a slow and steady pace
• Commercial and Industrial properties are picking up as property investors are refocusing back onto their own business expansions
• Good potential and prospect in the long term future
• Johor’s property market outlook will be even more positive with mega infrastructure developments i.e HSR & RTS in place
I S K A N D A R M A L A Y S I A