2013 · jabatan merakamkan setinggi-tinggi penghargaan kepada semua pihak yang telah membekalkan...
TRANSCRIPT
MALAYSIA
Akaun Negara
KDNK NEGERI
20
05
- 2
01
3
JABATAN PERANGKAAN MALAYSIA
DEPARTMENT OF STATISTICS, MALAYSIA
GDP BY STATE National Accounts

i
KATA PENGANTAR
Penerbitan ini membentangkan anggaran tahunan Keluaran Dalam Negeri Kasar
(KDNK) untuk tahun 2005 hingga 2013 bagi semua negeri di Malaysia.
Penyusunan statistik ini telah mengguna pakai perakuan daripada System of
National Accounts 1993 dan 2008 oleh Pertubuhan Bangsa-bangsa Bersatu.
KDNK ini disusun secara tahunan pada harga malar 2005 mengikut kaedah
pengeluaran yang menyediakan nilai ditambah bagi setiap aktiviti ekonomi
mengikut negeri. Anggaran pada harga semasa dan KDNK Per Kapita bagi
setiap negeri turut dimuatkan. Metodologi, konsep, takrifan dan sumber data
juga dibekalkan bagi memudahkan pemahaman terhadap statistik ini.
Jabatan merakamkan setinggi-tinggi penghargaan kepada semua pihak yang
telah membekalkan data yang diperlukan. Sebarang cadangan dan
pandangan ke arah memperbaiki penerbitan ini pada masa hadapan amatlah
dihargai.
Datuk Dr. Haji Abdul Rahman Hasan
Ketua Perangkawan
Malaysia
September 2014
ii
PREFACE
This publication presents the Gross Domestic Product (GDP) for year 2005 to 2013
for all the states in Malaysia. The compilation of these statistics has adopted the
recommendations of System of National Accounts 1993 and 2008, United Nations.
The GDP is compiled annually at constant 2005 prices based on production
approach which provides the value added for each economic activity of the
states. The estimates at current prices as well as GDP Per Capita are also
presented. In order to facilitate better understanding of the statistics,
methodology, concepts, definitions and sources of data are provided.
The Department gratefully acknowledges the cooperation of all parties
concerned in providing the required data. All comments and suggestions towards
improving future reports are highly appreciated.
Datuk Dr. Haji Abdul Rahman Hasan
Chief Statistician
Malaysia
September 2014
SINGKATAN/ABBREVIATIONS
IHP : Indeks Harga Pengguna
IHPR : Indeks Harga Pengeluar
KDNK : Keluaran Dalam Negeri Kasar
RM
WP
WP KL
: Ringgit Malaysia
: Wilayah Persekutuan
: Wilayah Persekutuan Kuala Lumpur
CPI : Consumer Price Index
DOSM : Department of Statistics, Malaysia
FISIM : Financial Intermediation Service Indirectly Measured
GDP : Gross Domestic Product
PPI : Producer Price Index
1993 SNA : System of National Accounts 1993
2008 SNA : System of National Accounts 2008
SIMBOL/SYMBOLS
.. : tidak berkenaan/not applicable
e : anggaran/estimate
p : permulaan/preliminary
a : nilai ditambah kurang daripada RM5 juta/ value added less than RM5 million
NOTA/NOTE
Jumlah angka komponen mungkin tidak bersamaan dengan angka jumlah kecil atau jumlah
besar disebabkan pembundaran.
The sum of the component figures may not tally with the sub-total or total figures due to rounding.
iii
iv
SEKSYEN 1
SECTION 1
SEKSYEN 2
SECTION 2
1
2
3
4
5
6
7
8
9
10
11
12
1-8
9
9
10
10
11
11
12
13
13
14
15
15
RINGKASAN PENEMUAN
SUMMARY FINDINGS
JADUAL
TABLE
KDNK mengikut Negeri, 2005-2013 pada Harga Malar 2005 - RM Juta
GDP by State, 2005-2013 at Constant 2005 Prices - RM Million
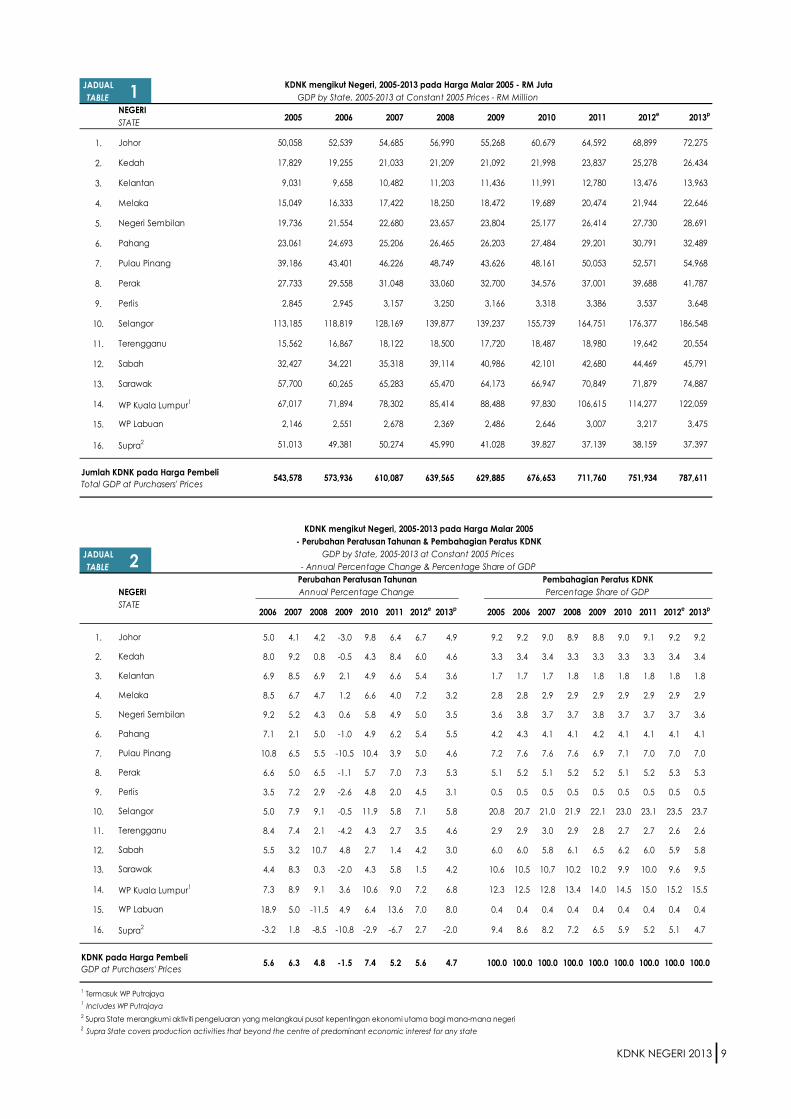
KDNK mengikut Negeri, 2005-2013 pada Harga Malar 2005
- Perubahan Peratusan Tahunan & Pembahagian Peratus KDNK
GDP by State, 2005-2013 at Constant 2005 Prices
- Annual Percentage Change & Percentage Share of GDP
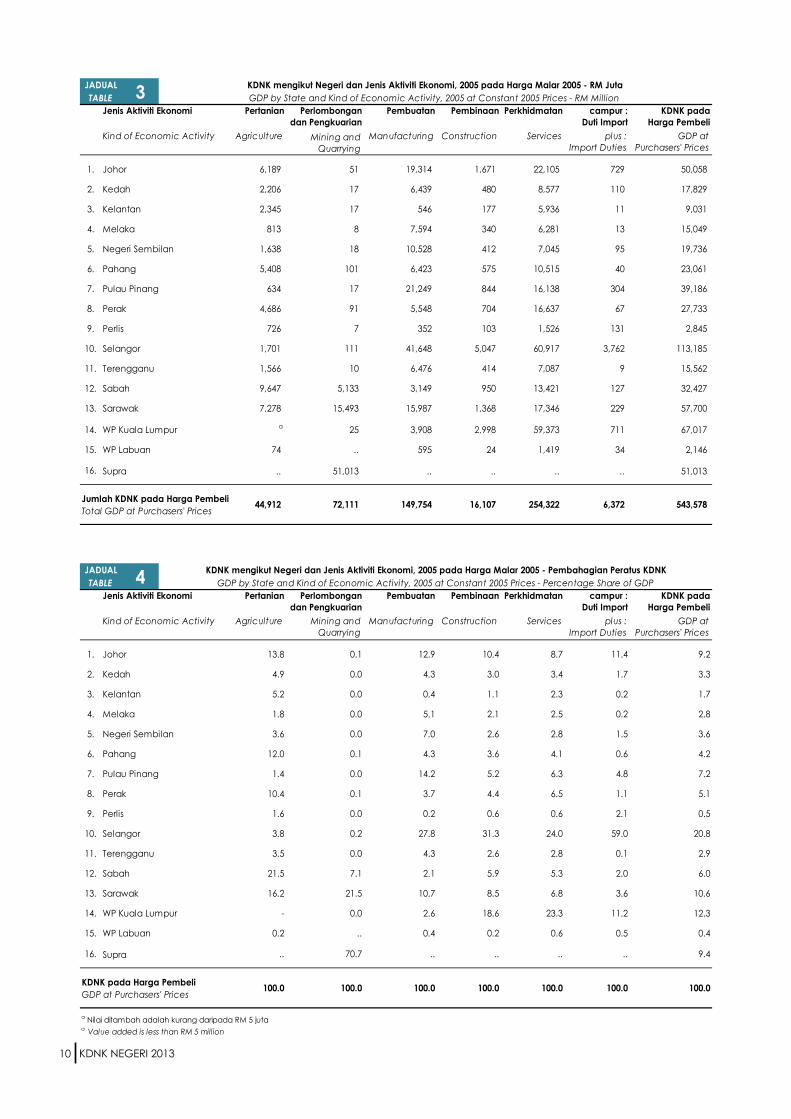
KDNK mengikut Negeri dan Jenis Aktiviti Ekonomi, 2005 pada Harga Malar 2005 - RM Juta
GDP by State and Kind of Economic Activity, 2005 at Constant 2005 Prices - RM Million
KDNK mengikut Negeri dan Jenis Aktiviti Ekonomi, 2005 pada Harga Malar 2005
- Pembahagian Peratus KDNK
GDP by State and Kind of Economic Activity, 2005 at Constant 2005 Prices
- Percentage Share of GDP
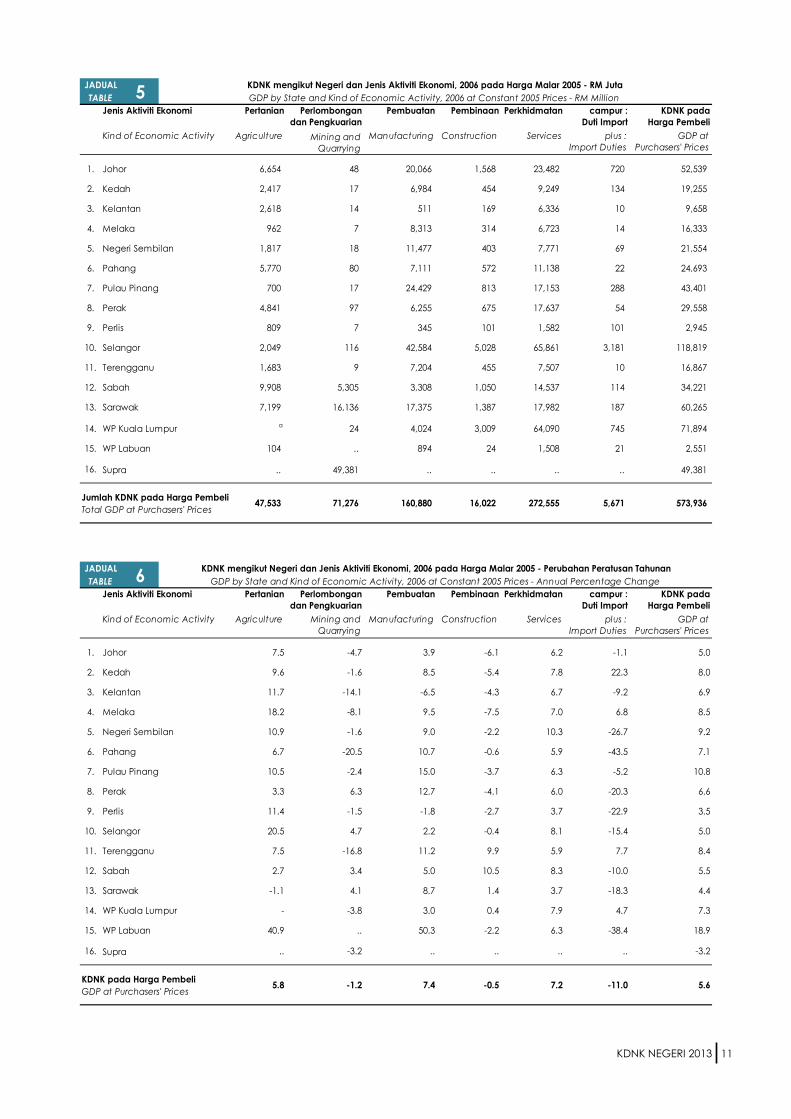
KDNK mengikut Negeri dan Jenis Aktiviti Ekonomi, 2006 pada Harga Malar 2005 - RM Juta
GDP by State and Kind of Economic Activity, 2006 at Constant 2005 Prices - RM Million
KDNK mengikut Negeri dan Jenis Aktiviti Ekonomi, 2006 pada Harga Malar 2005
- Perubahan Peratusan Tahunan
GDP by State and Kind of Economic Activity, 2006 at Constant 2005 Prices
- Annual Percentage Change
KDNK mengikut Negeri dan Jenis Aktiviti Ekonomi, 2006 pada Harga Malar 2005
- Pembahagian Peratus KDNK
GDP by State and Kind of Economic Activity, 2006 at Constant 2005 Prices
- Percentage Share of GDP
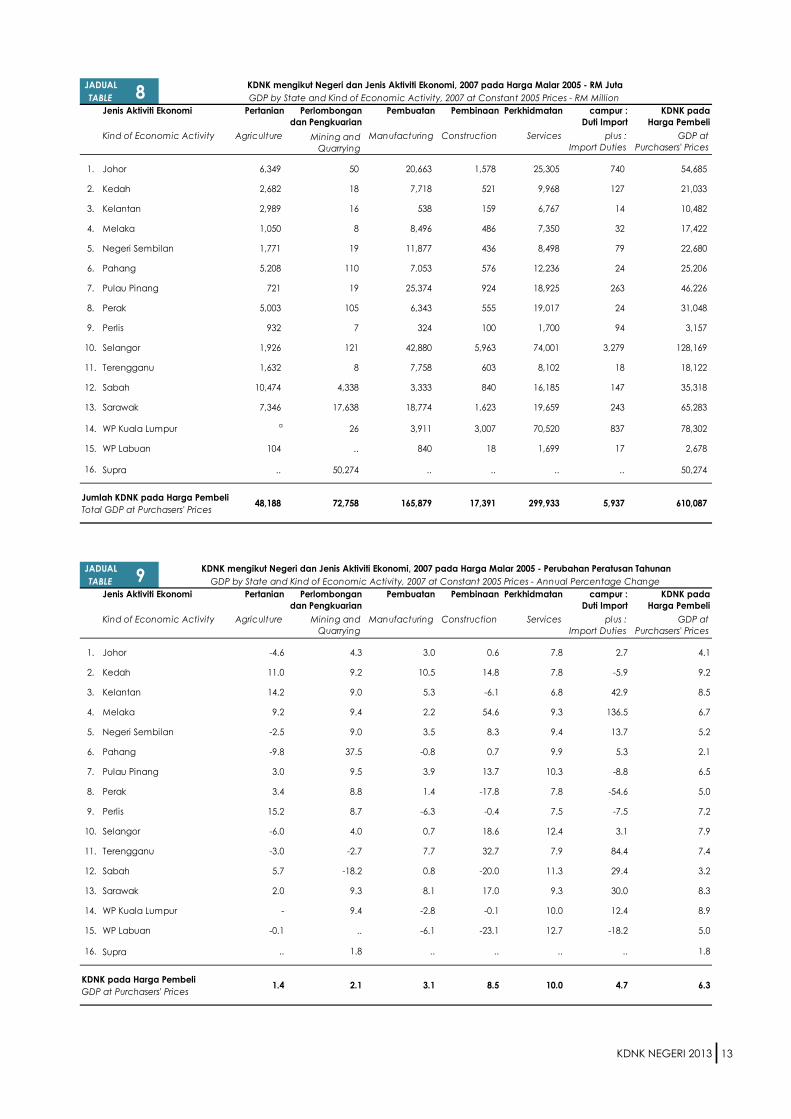
KDNK mengikut Negeri dan Jenis Aktiviti Ekonomi, 2007 pada Harga Malar 2005 - RM Juta
GDP by State and Kind of Economic Activity, 2007 at Constant 2005 Prices - RM Million
KDNK mengikut Negeri dan Jenis Aktiviti Ekonomi, 2007 pada Harga Malar 2005
- Perubahan Peratusan Tahunan
GDP by State and Kind of Economic Activity, 2007 at Constant 2005 Prices
- Annual Percentage Change
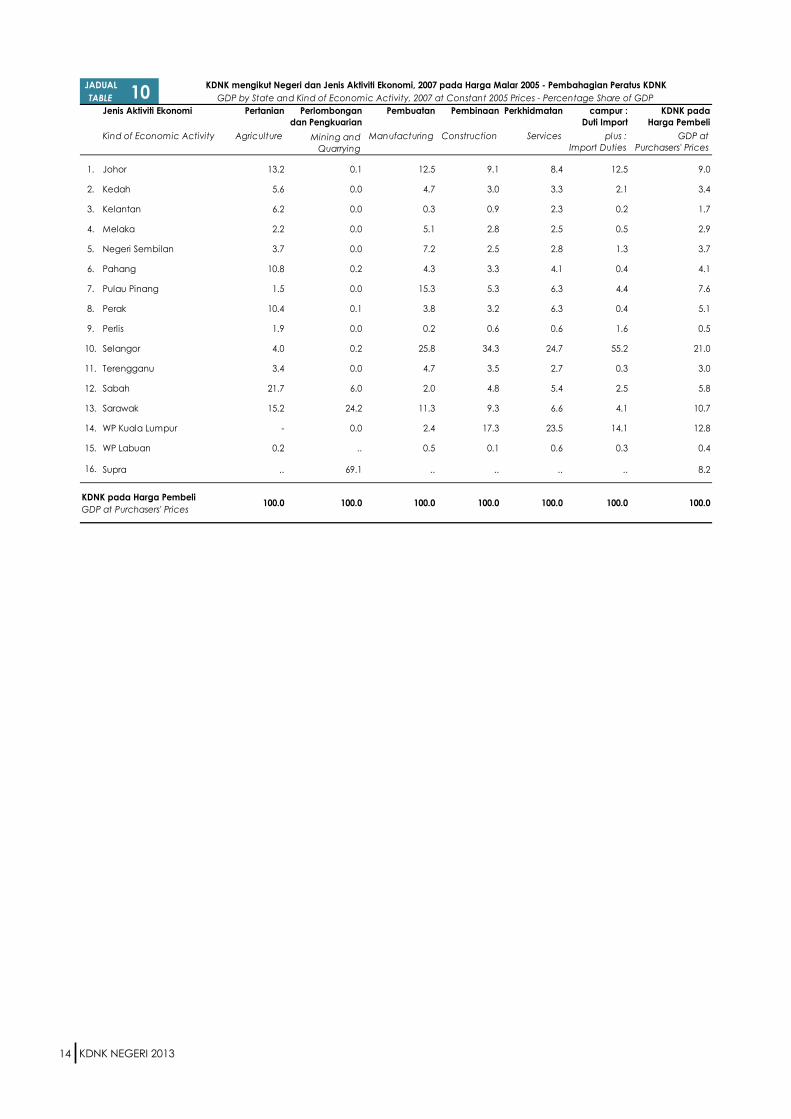
KDNK mengikut Negeri dan Jenis Aktiviti Ekonomi, 2007 pada Harga Malar 2005
- Pembahagian Peratus KDNK
GDP by State and Kind of Economic Activity, 2007 at Constant 2005 Prices
- Percentage Share of GDP
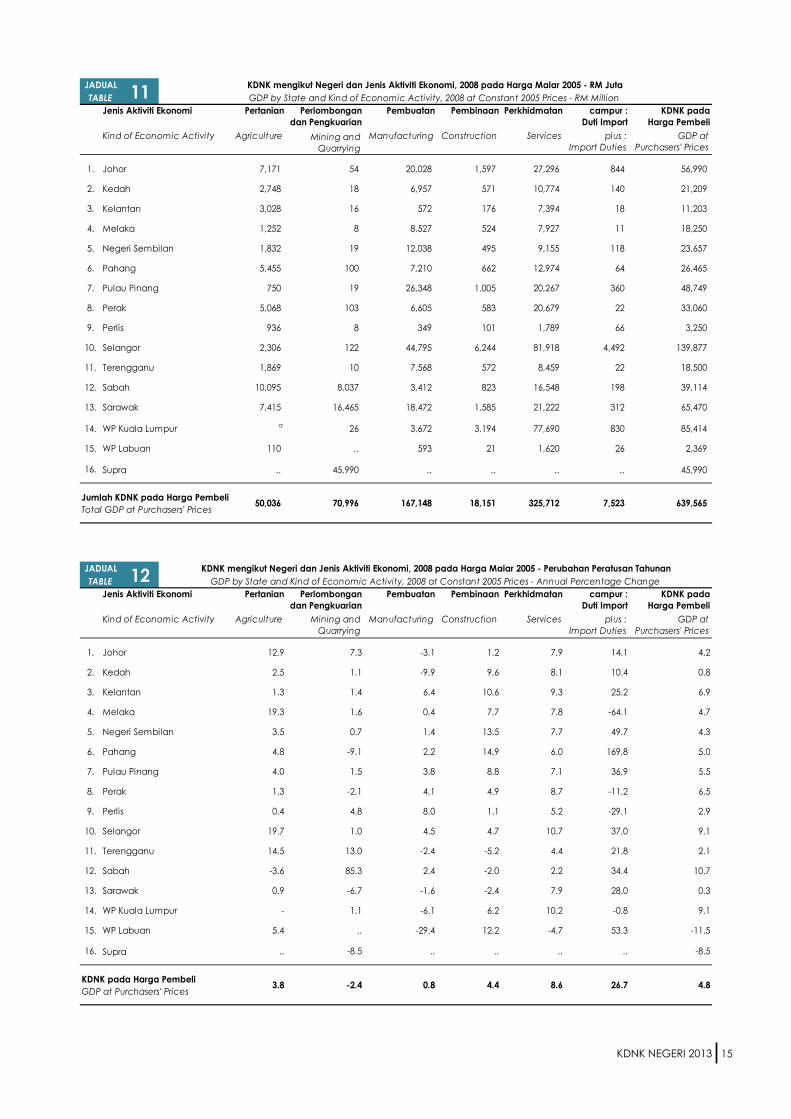
KDNK mengikut Negeri dan Jenis Aktiviti Ekonomi, 2008 pada Harga Malar 2005 - RM Juta
GDP by State and Kind of Economic Activity, 2008 at Constant 2005 Prices - RM Million
KDNK mengikut Negeri dan Jenis Aktiviti Ekonomi, 2008 pada Harga Malar 2005
- Perubahan Peratusan Tahunan
GDP by State and Kind of Economic Activity, 2008 at Constant 2005 Prices
- Annual Percentage Change
KANDUNGAN
CONTENTS
KATA PENGANTAR
PREFACE
SINGKATAN / SIMBOL
ABBREVIATIONS / SYMBOLS
i-ii
iii
v
KANDUNGAN
CONTENTS
13
14
15
16
17
18
19
20
21
22
23
24
25
26
16
17
17
18
19
19
20
21
21
22
23
23
24
25
KDNK mengikut Negeri dan Jenis Aktiviti Ekonomi, 2008 pada Harga Malar 2005
- Pembahagian Peratus KDNK
GDP by State and Kind of Economic Activity, 2008 at Constant 2005 Prices
- Percentage Share of GDP
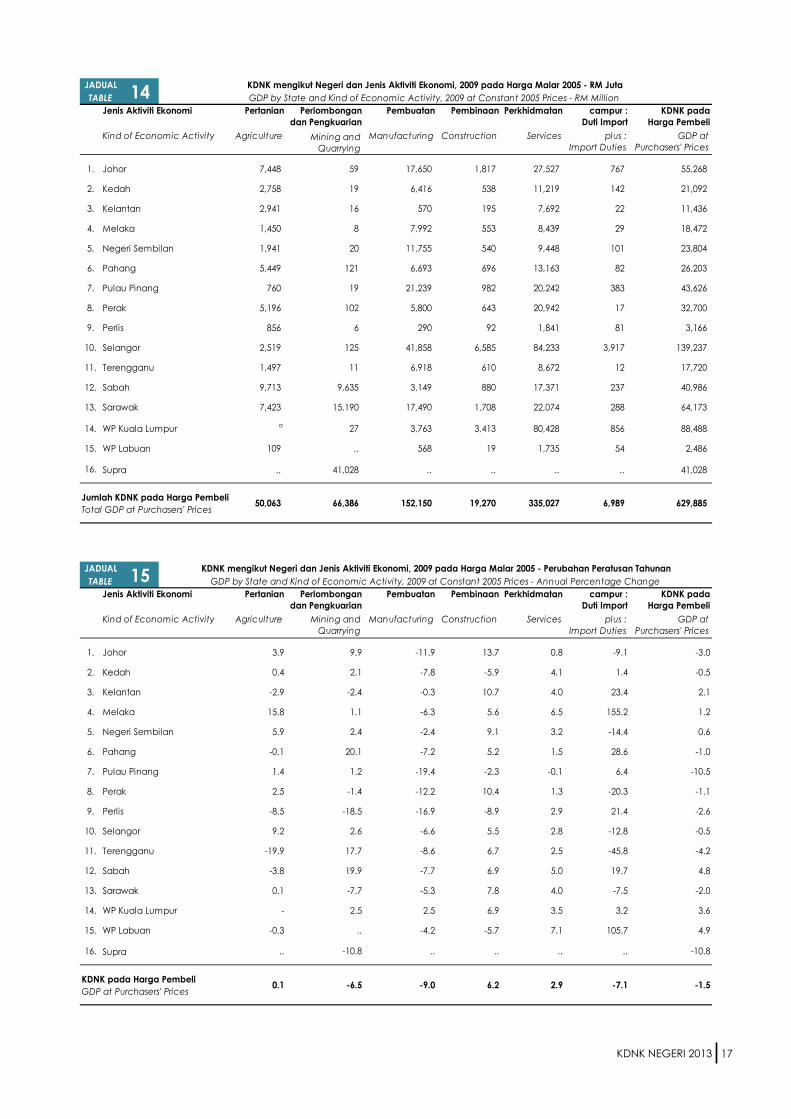
KDNK mengikut Negeri dan Jenis Aktiviti Ekonomi, 2009 pada Harga Malar 2005 - RM Juta
GDP by State and Kind of Economic Activity, 2009 at Constant 2005 Prices - RM Million
KDNK mengikut Negeri dan Jenis Aktiviti Ekonomi, 2009 pada Harga Malar 2005
- Perubahan Peratusan Tahunan
GDP by State and Kind of Economic Activity, 2009 at Constant 2005 Prices
- Annual Percentage Change
KDNK mengikut Negeri dan Jenis Aktiviti Ekonomi, 2009 pada Harga Malar 2005
- Pembahagian Peratus KDNK
GDP by State and Kind of Economic Activity, 2009 at Constant 2005 Prices
- Percentage Share of GDP
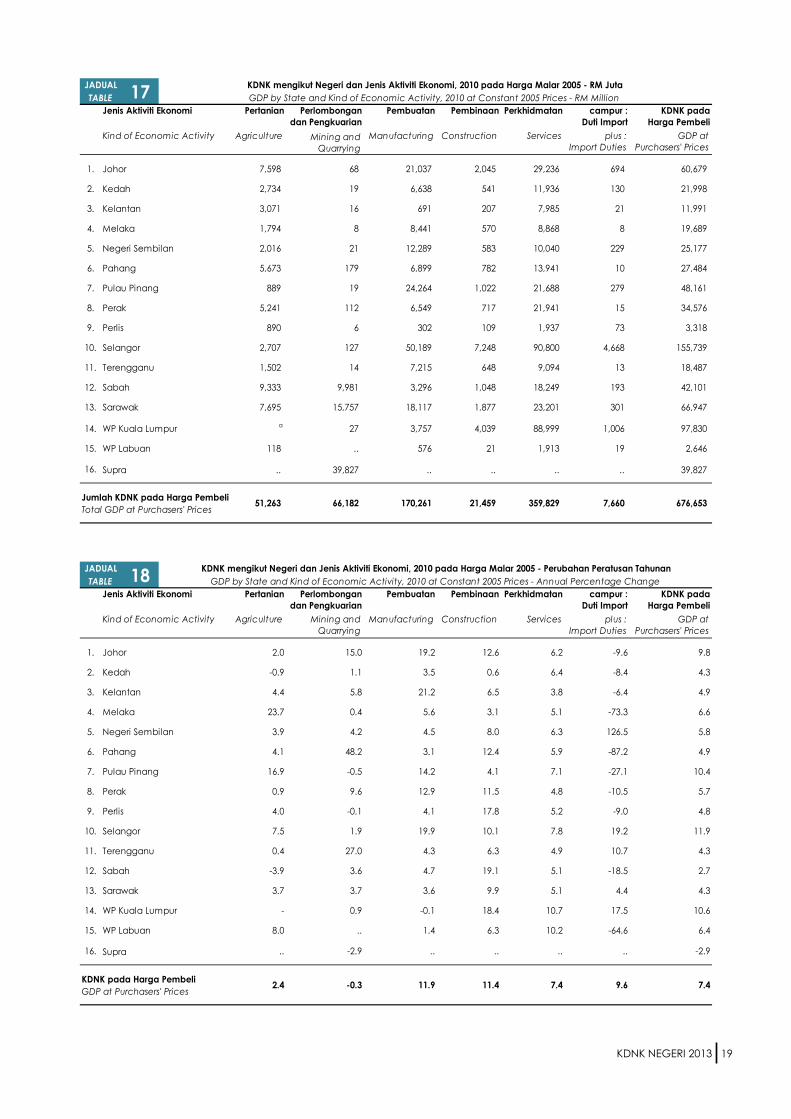
KDNK mengikut Negeri dan Jenis Aktiviti Ekonomi, 2010 pada Harga Malar 2005 - RM Juta
GDP by State and Kind of Economic Activity, 2010 at Constant 2005 Prices - RM Million
KDNK mengikut Negeri dan Jenis Aktiviti Ekonomi, 2010 pada Harga Malar 2005
- Perubahan Peratusan Tahunan
GDP by State and Kind of Economic Activity, 2010 at Constant 2005 Prices
- Annual Percentage Change
KDNK mengikut Negeri dan Jenis Aktiviti Ekonomi, 2010 pada Harga Malar 2005
- Pembahagian Peratus KDNK
GDP by State and Kind of Economic Activity, 2010 at Constant 2005 Prices
- Percentage Share of GDP
KDNK mengikut Negeri dan Jenis Aktiviti Ekonomi, 2011 pada Harga Malar 2005 - RM Juta
GDP by State and Kind of Economic Activity, 2011 at Constant 2005 Prices - RM Million
KDNK mengikut Negeri dan Jenis Aktiviti Ekonomi, 2011 pada Harga Malar 2005
- Perubahan Peratusan Tahunan
GDP by State and Kind of Economic Activity, 2011 at Constant 2005 Prices
- Annual Percentage Change
KDNK mengikut Negeri dan Jenis Aktiviti Ekonomi, 2011 pada Harga Malar 2005
- Pembahagian Peratus KDNK
GDP by State and Kind of Economic Activity, 2011 at Constant 2005 Prices
- Percentage Share of GDP
KDNK mengikut Negeri dan Jenis Aktiviti Ekonomi, 2012 pada Harga Malar 2005 - RM Juta
GDP by State and Kind of Economic Activity, 2012 at Constant 2005 Prices - RM Million
KDNK mengikut Negeri dan Jenis Aktiviti Ekonomi, 2012 pada Harga Malar 2005
- Perubahan Peratusan Tahunan
GDP by State and Kind of Economic Activity, 2012 at Constant 2005 Prices
- Annual Percentage Change
KDNK mengikut Negeri dan Jenis Aktiviti Ekonomi, 2012 pada Harga Malar 2005
- Pembahagian Peratus KDNK
GDP by State and Kind of Economic Activity, 2012 at Constant 2005 Prices
- Percentage Share of GDP
KDNK mengikut Negeri dan Jenis Aktiviti Ekonomi, 2013 pada Harga Malar 2005 - RM Juta
GDP by State and Kind of Economic Activity, 2013 at Constant 2005 Prices - RM Million
JADUAL
TABLE
vi
KANDUNGAN
CONTENTS
27
28
29
30
31
32
33
34
35
36
37
38
39
40
41
25
26
27
27
28
28
29
29
30
30
31
31
32
32
33
KDNK mengikut Negeri dan Jenis Aktiviti Ekonomi, 2013 pada Harga Malar 2005
- Perubahan Peratusan Tahunan
GDP by State and Kind of Economic Activity, 2013 at Constant 2005 Prices
- Annual Percentage Change
KDNK mengikut Negeri dan Jenis Aktiviti Ekonomi, 2013 pada Harga Malar 2005
- Pembahagian Peratus KDNK
GDP by State and Kind of Economic Activity, 2013 at Constant 2005 Prices
- Percentage Share of GDP
KDNK mengikut Negeri, 2005-2013 pada Harga Semasa - RM Juta
GDP by State, 2005-2013 at Current Prices - RM Million
KDNK Per Kapita mengikut Negeri, 2005-2013 pada Harga Semasa - RM
GDP Per Capita by State, 2005-2013 at Current Prices - RM
KDNK Johor mengikut Jenis Aktiviti Ekonomi, 2005-2013 pada Harga Malar 2005 - RM Juta
GDP for Johor by Kind of Economic Activity, 2005-2013 at Constant 2005 Prices - RM Million
KDNK Johor mengikut Jenis Aktiviti Ekonomi, 2005-2013 pada Harga Malar 2005
- Perubahan Peratusan Tahunan & Pembahagian Peratus KDNK
GDP for Johor by Kind of Economic Activity, 2005-2013 at Constant 2005 Prices
- Annual Percentage Change & Percentage Share of GDP
KDNK Kedah mengikut Jenis Aktiviti Ekonomi, 2005-2013 pada Harga Malar 2005 - RM Juta
GDP for Kedah by Kind of Economic Activity, 2005-2013 at Constant 2005 Prices - RM Million
KDNK Kedah mengikut Jenis Aktiviti Ekonomi, 2005-2013 pada Harga Malar 2005
- Perubahan Peratusan Tahunan & Pembahagian Peratus KDNK
GDP for Kedah by Kind of Economic Activity, 2005-2013 at Constant 2005 Prices
- Annual Percentage Change & Percentage Share of GDP
KDNK Kelantan mengikut Jenis Aktiviti Ekonomi, 2005-2013 pada Harga Malar 2005 - RM Juta
GDP for Kelantan by Kind of Economic Activity, 2005-2013 at Constant 2005 Prices - RM Million
KDNK Kelantan mengikut Jenis Aktiviti Ekonomi, 2005-2013 pada Harga Malar 2005
- Perubahan Peratusan Tahunan & Pembahagian Peratus KDNK
GDP for Kelantan by Kind of Economic Activity, 2005-2013 at Constant 2005 Prices
- Annual Percentage Change & Percentage Share of GDP
KDNK Melaka mengikut Jenis Aktiviti Ekonomi, 2005-2013 pada Harga Malar 2005 - RM Juta
GDP for Melaka by Kind of Economic Activity, 2005-2013 at Constant 2005 Prices - RM Million
KDNK Melaka mengikut Jenis Aktiviti Ekonomi, 2005-2013 pada Harga Malar 2005
- Perubahan Peratusan Tahunan & Pembahagian Peratus KDNK
GDP for Melaka by Kind of Economic Activity, 2005-2013 at Constant 2005 Prices
- Annual Percentage Change & Percentage Share of GDP
KDNK Negeri Sembilan mengikut Jenis Aktiviti Ekonomi, 2005-2013 pada Harga Malar 2005
- RM Juta
GDP for Negeri Sembilan by Kind of Economic Activity, 2005-2013 at Constant 2005 Prices
- RM Million
KDNK Negeri Sembilan mengikut Jenis Aktiviti Ekonomi, 2005-2013 pada Harga Malar 2005
- Perubahan Peratusan Tahunan & Pembahagian Peratus KDNK
GDP for Negeri Sembilan by Kind of Economic Activity, 2005-2013 at Constant 2005 Prices
- Annual Percentage Change & Percentage Share of GDP
KDNK Pahang mengikut Jenis Aktiviti Ekonomi, 2005-2013 pada Harga Malar 2005 - RM Juta
GDP for Pahang by Kind of Economic Activity, 2005-2013 at Constant 2005 Prices - RM Million
JADUAL
TABLE
vii
KANDUNGAN
CONTENTS
42
43
44
45
46
47
48
49
50
51
52
53
54
55
56
33
34
34
35
35
36
36
37
37
38
38
39
39
40
40
KDNK Pahang mengikut Jenis Aktiviti Ekonomi, 2005-2013 pada Harga Malar 2005
- Perubahan Peratusan Tahunan & Pembahagian Peratus KDNK
GDP for Pahang by Kind of Economic Activity, 2005-2013 at Constant 2005 Prices
- Annual Percentage Change & Percentage Share of GDP
KDNK Pulau Pinang mengikut Jenis Aktiviti Ekonomi, 2005-2013 pada Harga Malar 2005 - RM Juta
GDP for Pulau Pinang by Kind of Economic Activity, 2005-2013 at Constant 2005 Prices - RM Million
KDNK Pulau Pinang mengikut Jenis Aktiviti Ekonomi, 2005-2013 pada Harga Malar 2005
- Perubahan Peratusan Tahunan & Pembahagian Peratus KDNK
GDP for Pulau Pinang by Kind of Economic Activity, 2005-2013 at Constant 2005 Prices
- Annual Percentage Change & Percentage Share of GDP
KDNK Perak mengikut Jenis Aktiviti Ekonomi, 2005-2013 pada Harga Malar 2005 - RM Juta
GDP for Perak by Kind of Economic Activity, 2005-2013 at Constant 2005 Prices - RM Million
KDNK Perak mengikut Jenis Aktiviti Ekonomi, 2005-2013 pada Harga Malar 2005
- Perubahan Peratusan Tahunan & Pembahagian Peratus KDNK
GDP for Perak by Kind of Economic Activity, 2005-2013 at Constant 2005 Prices
- Annual Percentage Change & Percentage Share of GDP
KDNK Perlis mengikut Jenis Aktiviti Ekonomi, 2005-2013 pada Harga Malar 2005 - RM Juta
GDP for Perlis by Kind of Economic Activity, 2005-2013 at Constant 2005 Prices - RM Million
KDNK Perlis mengikut Jenis Aktiviti Ekonomi, 2005-2013 pada Harga Malar 2005
- Perubahan Peratusan Tahunan & Pembahagian Peratus KDNK
GDP for Perlis by Kind of Economic Activity, 2005-2013 at Constant 2005 Prices
- Annual Percentage Change & Percentage Share of GDP
KDNK Selangor mengikut Jenis Aktiviti Ekonomi, 2005-2013 pada Harga Malar 2005 - RM Juta
GDP for Selangor by Kind of Economic Activity, 2005-2013 at Constant 2005 Prices - RM Million
KDNK Selangor mengikut Jenis Aktiviti Ekonomi, 2005-2013 pada Harga Malar 2005
- Perubahan Peratusan Tahunan & Pembahagian Peratus KDNK
GDP for Selangor by Kind of Economic Activity, 2005-2013 at Constant 2005 Prices
- Annual Percentage Change & Percentage Share of GDP
KDNK Terengganu mengikut Jenis Aktiviti Ekonomi, 2005-2013 pada Harga Malar 2005 - RM Juta
GDP for Terengganu by Kind of Economic Activity, 2005-2013 at Constant 2005 Prices - RM Million
KDNK Terengganu mengikut Jenis Aktiviti Ekonomi, 2005-2013 pada Harga Malar 2005
- Perubahan Peratusan Tahunan & Pembahagian Peratus KDNK
GDP for Terengganu by Kind of Economic Activity, 2005-2013 at Constant 2005 Prices
- Annual Percentage Change & Percentage Share of GDP
KDNK Sabah mengikut Jenis Aktiviti Ekonomi, 2005-2013 pada Harga Malar 2005 - RM Juta
GDP for Sabah by Kind of Economic Activity, 2005-2013 at Constant 2005 Prices - RM Million
KDNK Sabah mengikut Jenis Aktiviti Ekonomi, 2005-2013 pada Harga Malar 2005
- Perubahan Peratusan Tahunan & Pembahagian Peratus KDNK
GDP for Sabah by Kind of Economic Activity, 2005-2013 at Constant 2005 Prices
- Annual Percentage Change & Percentage Share of GDP
KDNK Sarawak mengikut Jenis Aktiviti Ekonomi, 2005-2013 pada Harga Malar 2005 - RM Juta
GDP for Sarawak by Kind of Economic Activity, 2005-2013 at Constant 2005 Prices - RM Million
KDNK Sarawak mengikut Jenis Aktiviti Ekonomi, 2005-2013 pada Harga Malar 2005
- Perubahan Peratusan Tahunan & Pembahagian Peratus KDNK
GDP for Sarawak by Kind of Economic Activity, 2005-2013 at Constant 2005 Prices
- Annual Percentage Change & Percentage Share of GDP
JADUAL
TABLE
viii
KANDUNGAN
CONTENTS
57
58
59
60
SEKSYEN 3
SECTION 3
SEKSYEN 4
SECTION 4
SEKSYEN 5
SECTION 5
SEKSYEN 6
SECTION 6
41
41
42
42
43-50
51-69
71-78
79-87
KDNK WP Kuala Lumpur mengikut Jenis Aktiviti Ekonomi, 2005-2013 pada Harga Malar 2005
- RM Juta
GDP for WP Kuala Lumpur by Kind of Economic Activity, 2005-2013 at Constant 2005 Prices
– RM Million
KDNK WP Kuala Lumpur mengikut Jenis Aktiviti Ekonomi, 2005-2013 pada Harga Malar 2005
- Perubahan Peratusan Tahunan & Pembahagian Peratus KDNK
GDP for WP Kuala Lumpur by Kind of Economic Activity, 2005-2013 at Constant 2005 Prices
- Annual Percentage Change & Percentage Share of GDP
KDNK WP Labuan mengikut Jenis Aktiviti Ekonomi, 2005-2013 pada Harga Malar 2005 - RM Juta
GDP for WP Labuan by Kind of Economic Activity, 2005-2013 at Constant 2005 Prices - RM Million
KDNK WP Labuan mengikut Jenis Aktiviti Ekonomi, 2005-2013 pada Harga Malar 2005
- Perubahan Peratusan Tahunan & Pembahagian Peratus KDNK
GDP for WP Labuan by Kind of Economic Activity, 2005-2013 at Constant 2005 Prices
- Annual Percentage Change & Percentage Share of GDP
NOTA TEKNIKAL
TECHNICAL NOTES
METODOLOGI
METHODOLOGY
SUMBER DATA
DATA SOURCES
GLOSARI
GLOSSARY
JADUAL
TABLE
ix
MA
LAY
SIA
RM
32,9
84
PERLI
S
RM
18
,51
9
KED
AH
RM
16
,31
6
KELA
NTA
N
RM
10
,67
7
TEREN
GG
AN
U
RM
23
,28
5
PA
HA
NG
RM
26
,75
9
JOH
OR
RM
25
,30
2
MELA
KA
RM
34
,10
9
WP K
UA
LA L
UM
PU
R
RM
79
,75
2
NEG
ERI
SEM
BIL
AN
RM
33
,03
3
SELA
NG
OR
RM
37
,85
1
PERA
K
RM
21
,15
0
PU
LAU
PIN
AN
G
RM
38
,35
6
SA
RA
WA
K
RM
41
,11
5
WP L
ABU
AN
RM
43
,84
8
SA
BA
H
RM
18
,60
3
K
DN
K P
ER K
AP
ITA
BA
GI
TAH
UN
20
13
PA
DA
HA
RG
A S
EMA
SA
G
DP
PER
CA
PIT
A F
OR
YEA
R 2
01
3 A
T C
UR
REN
T P
RIC
ES
PR
ESTA
SI
EK
ON
OM
I N
EG
ER
I 201
3
STA
TE E
CO
NO
MIC
PER
FO
RM
AN
CE 2
01
3
KD
NK
me
ng
iku
t N
eg
eri
201
3,
pa
da
Ha
rga
Ma
lar
20
05
— N
ila
i D
ita
mb
ah
(P
ert
um
bu
ha
n, %
)
GD
P b
y S
tate
fo
r Y
ea
r 2
013
at
Co
nst
an
t 2
00
5 P
ric
es —
Va
lue
Ad
de
d (
Gro
wth
, %
)
Keluaran Dalam Negeri Kasar (KDNK) bagi tahun 2013 pada Harga Malar 2005, RM787.6 Bilion
Gross Domestic Product (GDP) for Year 2013 at Constant 2005 Prices, RM787.6 Billion * Te
rma
suk
WP
Pu
tra
jaya
Ke
lan
tan
RM
14
.0 b
il (3
.6%
)
Sa
raw
ak R
M7
4.9
bil
(4.2
%)
WP
Ku
ala
Lu
mp
ur
*
RM
12
2.1
bil
(6.8
%)
Se
lan
go
r R
M1
86
.5 b
il (5
.8%
)
Jo
ho
r R
M7
2.3
bil
(4.9
%)
Pu
lau
Pin
an
g R
M5
5.0
bil
(4.6
%)
Sa
ba
h R
M4
5.8
bil
(3.0
%)
Pe
rak R
M4
1.8
bil
(5.3
%)
N.S
em
bila
n R
M2
8.7
bil
(3.5
%)
Ke
da
h R
M2
6.4
bil
(4.6
%)
Me
laka
RM
22
.6 b
il (3
.2%
)
Tere
ng
ga
nu
RM
20
.6 b
il (4
.6%
)
Pe
rlis
RM
3.6
bil
(3.1
%)
WP
La
bu
an
RM
3.5
bil
(8.0
%)
Su
pra
RM
37
.4 b
il (-
2.0
%)
Pa
ha
ng
RM
32
.5 b
il (5
.5%
)
* In
clu
de
s W
P P
utr
aja
ya
Pe
rta
nia
n (
Tan
am
an
Ma
ka
na
n/
Tern
aka
n)
Ag
ric
ultu
re (
Fo
od
Cro
ps
/ Li
ve
sto
ck)
Pe
rkh
idm
ata
n (
Pe
rda
ga
ng
an
Bo
ron
g &
Ru
nc
it)
Se
rvic
es
(Wh
ole
sale
& R
eta
il Tr
ad
e)
Pe
mb
ua
tan
(P
rod
uk P
etr
ole
um
, K
imia
, G
eta
h &
Pla
stik
) M
an
ufa
ctu
rin
g (
Pe
tro
leu
m,
Ch
em
ica
l, R
ub
be
r &
Pla
stic
Pro
du
cts
)
Pe
mb
ua
tan
(K
ele
ng
ka
pa
n P
en
ga
ng
ku
tan
& P
em
bu
ata
n L
ain
) M
an
ufa
ctu
rin
g (
Tra
nsp
ort
Eq
uip
me
nt
& O
the
r M
an
ufa
ctu
res)
Pe
rkh
idm
ata
n (
Ke
wa
ng
an
& In
sura
ns)
Se
rvic
es
(Fin
an
ce
& In
sura
nc
e)
Pe
rta
nia
n (
Ke
lap
a S
aw
it)
Ag
ric
ultu
re (
Oil
Pa
lm)
Pe
rkh
idm
ata
n (
Utilit
i)
Se
rvic
es
(Uti
litie
s)
Pe
rkh
idm
ata
n L
ain
O
the
r Se
rvic
es
Pe
mb
ua
tan
(Ele
ktr
ik &
Ele
ktr
on
ik)
Ma
nu
fac
turin
g (
Ele
ctr
ica
l & E
lec
tro
nic
s)
Ma
in In
du
stry
In
du
stri u
tam
a
:
Ag
ric
ultu
re (
Ru
bb
er)
P
ert
an
ian
(G
eta
h)
Ag
ric
ultu
re (
Fis
hin
g)
Pe
rta
nia
n (
Pe
rika
na
n)
Min
ing
& Q
ua
rryin
g
Pe
rlo
mb
on
ga
n &
Pe
ng
ku
aria
n
Co
nst
ruc
tio
n
Pe
mb
ina
an
0
.0 —
3.0
3.1
— 4
.0
4.1
— 5
.0
5.1
— 6
.0
6.1
— 8
.0
Ma
lay
sia
KD
NK
/ G
DP =
4.7
%
Pe
rtu
mb
uh
an
KD
NK
Me
ng
iku
t N
eg
eri
, 2013 (
%)
GD
P G
row
th b
y S
tate
, 2013 (
%)
x
RINGKASAN PENEMUAN
SUMMARY FINDINGS
KDNK NEGERI 2013 I GDP BY STATE 2013
1

KDNK NEGERI 2013
RINGKASAN PENEMUAN
PENGENALAN
Ekonomi Malaysia mencatatkan
pertumbuhan sebanyak 4.7 peratus
meskipun dipengaruhi oleh faktor
luaran yang lemah dan ketidakstabilan
ekonomi di peringkat global pada
tahun 2013 (2012: 5.6 peratus). Sektor
Perkhidmatan dan Pembuatan kekal
s e b a g a i p e m a n g k i n k e p a d a
pertumbuhan tersebut. Prestasi Selangor,
WP Kuala Lumpur, Johor, Sarawak
dan Pulau Pinang telah menyumbang
sebanyak 75.0 peratus kepada
momentum nasional.
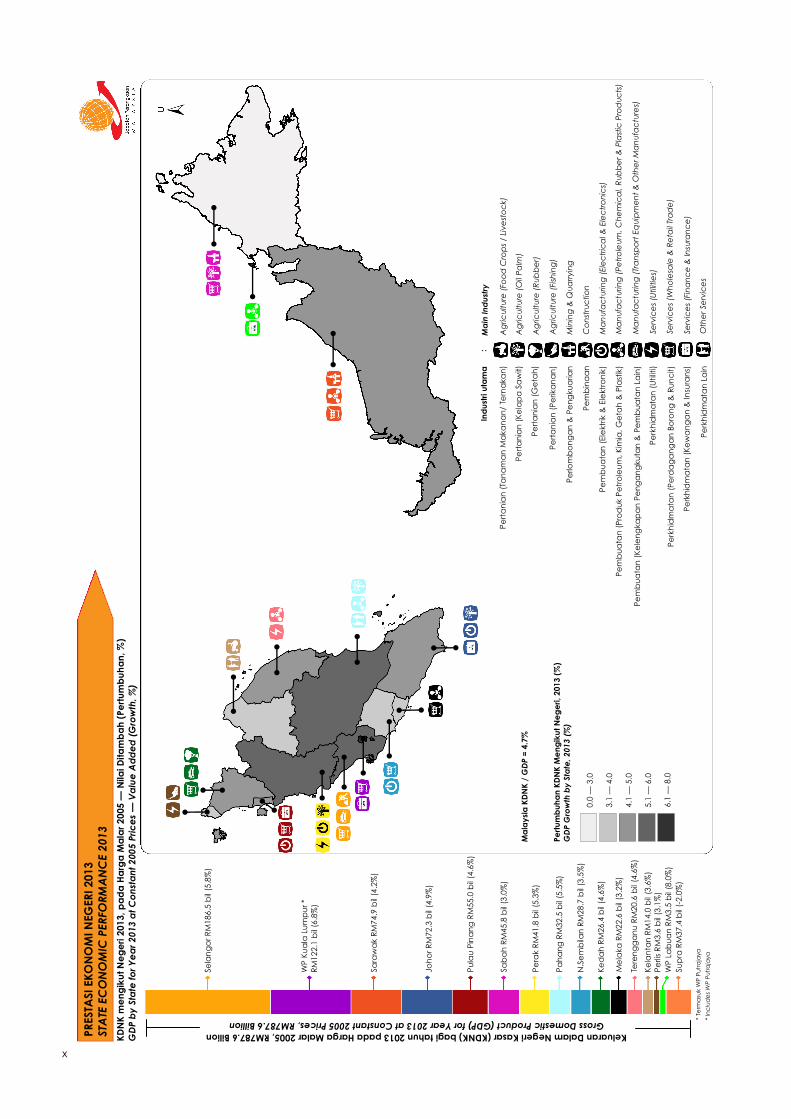
PERTUMBUHAN EKONOMI MENGIKUT
NEGERI, 2013
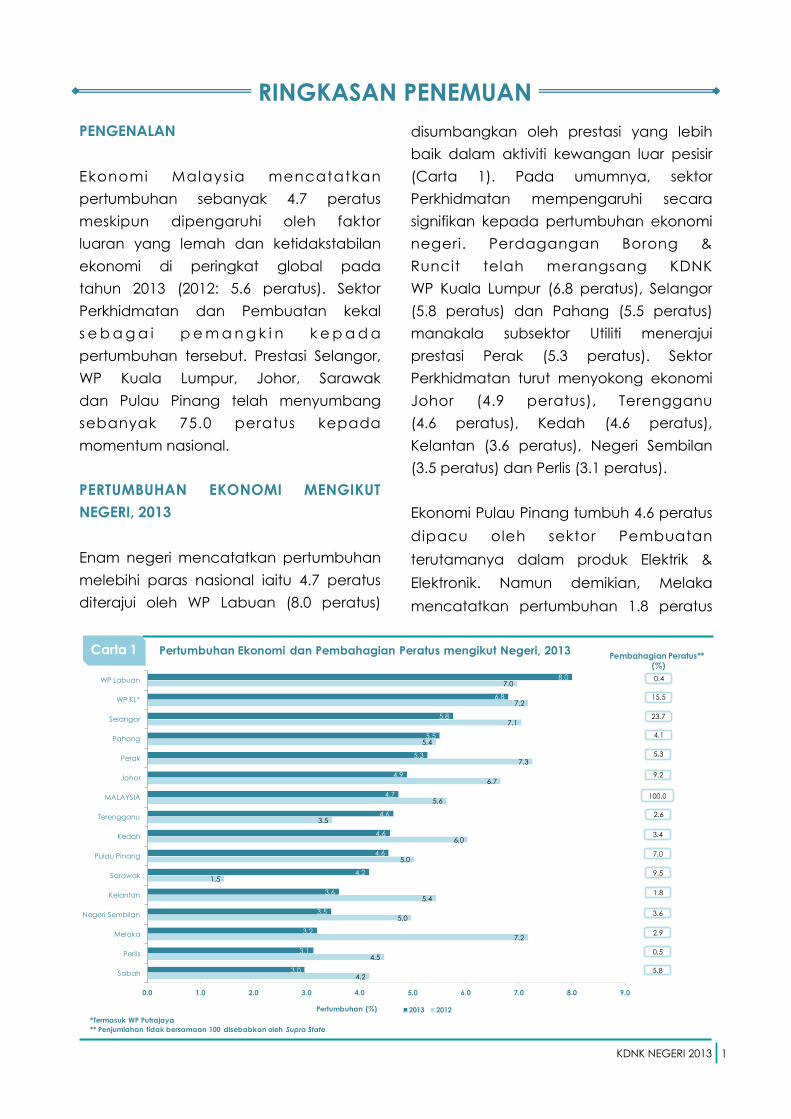
Enam negeri mencatatkan pertumbuhan
melebihi paras nasional iaitu 4.7 peratus
diterajui oleh WP Labuan (8.0 peratus)
disumbangkan oleh prestasi yang lebih
baik dalam aktiviti kewangan luar pesisir
(Carta 1). Pada umumnya, sektor
Perkhidmatan mempengaruhi secara
signifikan kepada pertumbuhan ekonomi
negeri. Perdagangan Borong &
Runcit telah merangsang KDNK
WP Kuala Lumpur (6.8 peratus), Selangor
(5.8 peratus) dan Pahang (5.5 peratus)
manakala subsektor Utiliti menerajui
prestasi Perak (5.3 peratus). Sektor
Perkhidmatan turut menyokong ekonomi
Johor (4.9 peratus), Terengganu
(4.6 peratus), Kedah (4.6 peratus),
Kelantan (3.6 peratus), Negeri Sembilan
(3.5 peratus) dan Perlis (3.1 peratus).
Ekonomi Pulau Pinang tumbuh 4.6 peratus
dipacu oleh sektor Pembuatan
terutamanya dalam produk Elektrik &
Elektronik. Namun demikian, Melaka
mencatatkan pertumbuhan 1.8 peratus
1
4.2
4.5
7.2
5.0
5.4
1.5
5.0
6.0
3.5
5.6
6.7
7.3
5.4
7.1
7.2
7.0
3.0
3.1
3.2
3.5
3.6
4.2
4.6
4.6
4.6
4.7
4.9
5.3
5.5
5.8
6.8
8.0
0.0 1.0 2.0 3.0 4.0 5.0 6.0 7.0 8.0 9.0
Sabah
Perlis
Melaka
Negeri Sembilan
Kelantan
Sarawak
Pulau Pinang
Kedah
Terengganu
MALAYSIA
Johor
Perak
Pahang
Selangor
WP KL*
WP Labuan
2013 2012
0.4
15.5
23.7
4.1
5.3
9.2
100.0
2.6
3.4
7.0
9.5
3.6
2.9
1.8
0.5
5.8
Pertumbuhan Ekonomi dan Pembahagian Peratus mengikut Negeri, 2013Pembahagian Peratus**
(%)
Pertumbuhan (%)
*Termasuk WP Putrajaya
** Penjumlahan tidak bersamaan 100 disebabkan oleh Supra State
Carta 1
KDNK NEGERI 2013
RINGKASAN PENEMUAN
bagi sektor ini didorong oleh kejatuhan
dalam subsektor Petroleum Bertapis.
Di samping itu, penurunan ketara dalam
sektor Pembinaan juga telah menjejaskan
prestasi Melaka kepada 3.2 peratus
(2012: 7.2 peratus).
Sarawak berkembang 4.2 peratus
disokong oleh momentum yang
m e n g g a l a k k a n d a l a m s e k t o r
Perlombongan & Pengkuarian setelah
mencatatkan pertumbuhan sederhana
sebanyak 1.5 peratus pada tahun 2012.
Sabah tumbuh 3.0 peratus dipengaruhi
oleh sektor Perkhidmatan dan Pertanian.
Namun begitu, pencapaian ini adalah
lebih perlahan berbanding 2012
(4.2 peratus) berikutan pengeluaran yang
rendah dalam aktiviti Perlombongan.
SUMBANGAN KDNK MENGIKUT NEGERI,
2013
Pada tahun 2013, lima negeri iaitu
Selangor, WP Kuala Lumpur, Sarawak,
Johor dan Pulau Pinang telah
menyumbang 64.8 peratus kepada
ekonomi negara seperti di Carta 1.
Selangor kekal sebagai pemacu utama
dengan sumbangan sebanyak
23.7 peratus diikuti oleh WP Kuala Lumpur
(15.5 peratus) dan Sarawak (9.5 peratus).
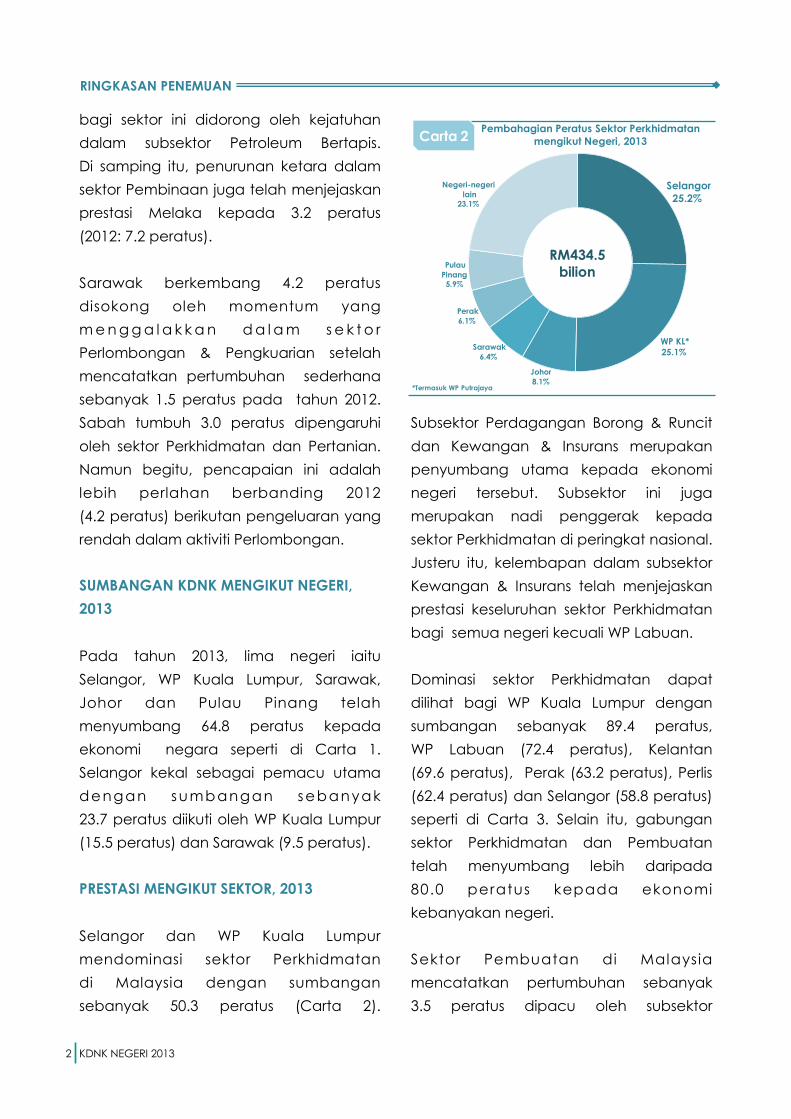
PRESTASI MENGIKUT SEKTOR, 2013
Selangor dan WP Kuala Lumpur
mendominasi sektor Perkhidmatan
di Malaysia dengan sumbangan
sebanyak 50.3 peratus (Carta 2).
Subsektor Perdagangan Borong & Runcit
dan Kewangan & Insurans merupakan
penyumbang utama kepada ekonomi
negeri tersebut. Subsektor ini juga
merupakan nadi penggerak kepada
sektor Perkhidmatan di peringkat nasional.
Justeru itu, kelembapan dalam subsektor
Kewangan & Insurans telah menjejaskan
prestasi keseluruhan sektor Perkhidmatan
bagi semua negeri kecuali WP Labuan.
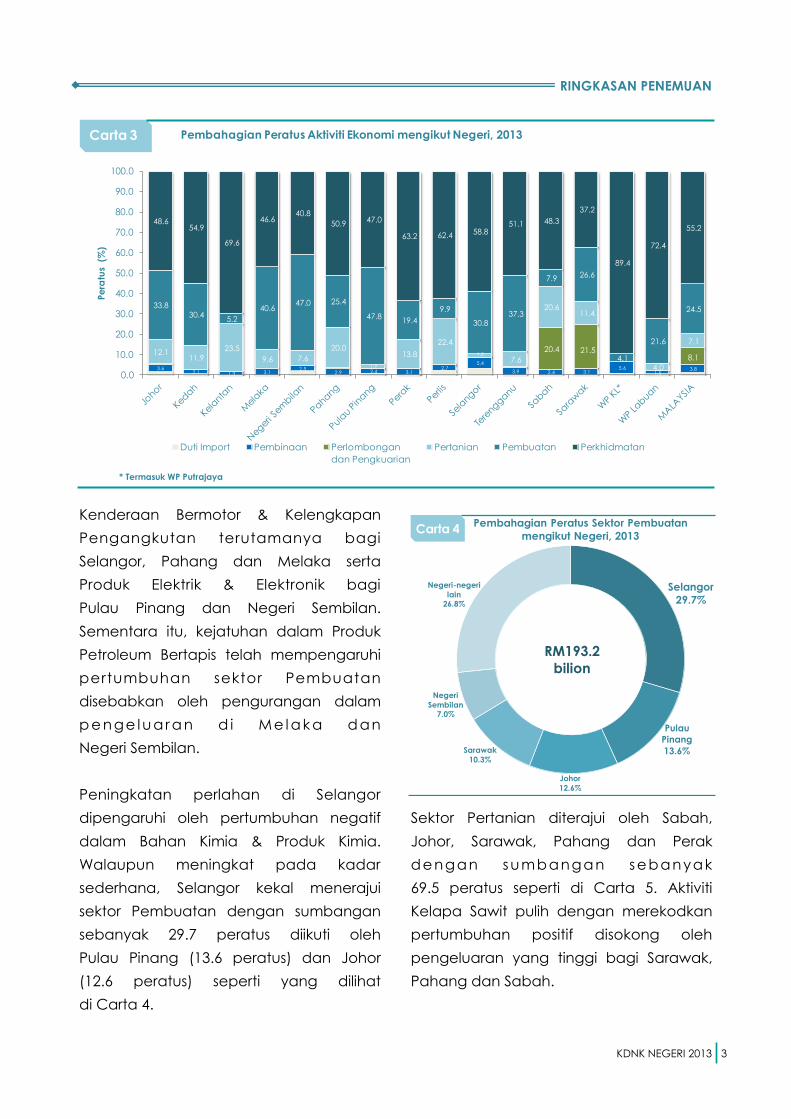
Dominasi sektor Perkhidmatan dapat
dilihat bagi WP Kuala Lumpur dengan
sumbangan sebanyak 89.4 peratus,
WP Labuan (72.4 peratus), Kelantan
(69.6 peratus), Perak (63.2 peratus), Perlis
(62.4 peratus) dan Selangor (58.8 peratus)
seperti di Carta 3. Selain itu, gabungan
sektor Perkhidmatan dan Pembuatan
telah menyumbang lebih daripada
80.0 peratus kepada ekonomi
kebanyakan negeri.
Sektor Pembuatan di Malaysia
mencatatkan pertumbuhan sebanyak
3.5 peratus dipacu oleh subsektor
2
Selangor
25.2%
WP KL*
25.1%
Johor
8.1%
Sarawak
6.4%
Perak
6.1%
Pulau
Pinang
5.9%
Negeri-negeri
lain
23.1%
RM434.5
bilion
Pembahagian Peratus Sektor Perkhidmatan
mengikut Negeri, 2013
*Termasuk WP Putrajaya
Carta 2
KDNK NEGERI 2013
RINGKASAN PENEMUAN
Kenderaan Bermotor & Kelengkapan
Pengangkutan terutamanya bagi
Selangor, Pahang dan Melaka serta
Produk Elektrik & Elektronik bagi
Pulau Pinang dan Negeri Sembilan.
Sementara itu, kejatuhan dalam Produk
Petroleum Bertapis telah mempengaruhi
pertumbuhan sektor Pembuatan
disebabkan oleh pengurangan dalam
p e n ge lu ar a n d i Me l a ka d an
Negeri Sembilan.
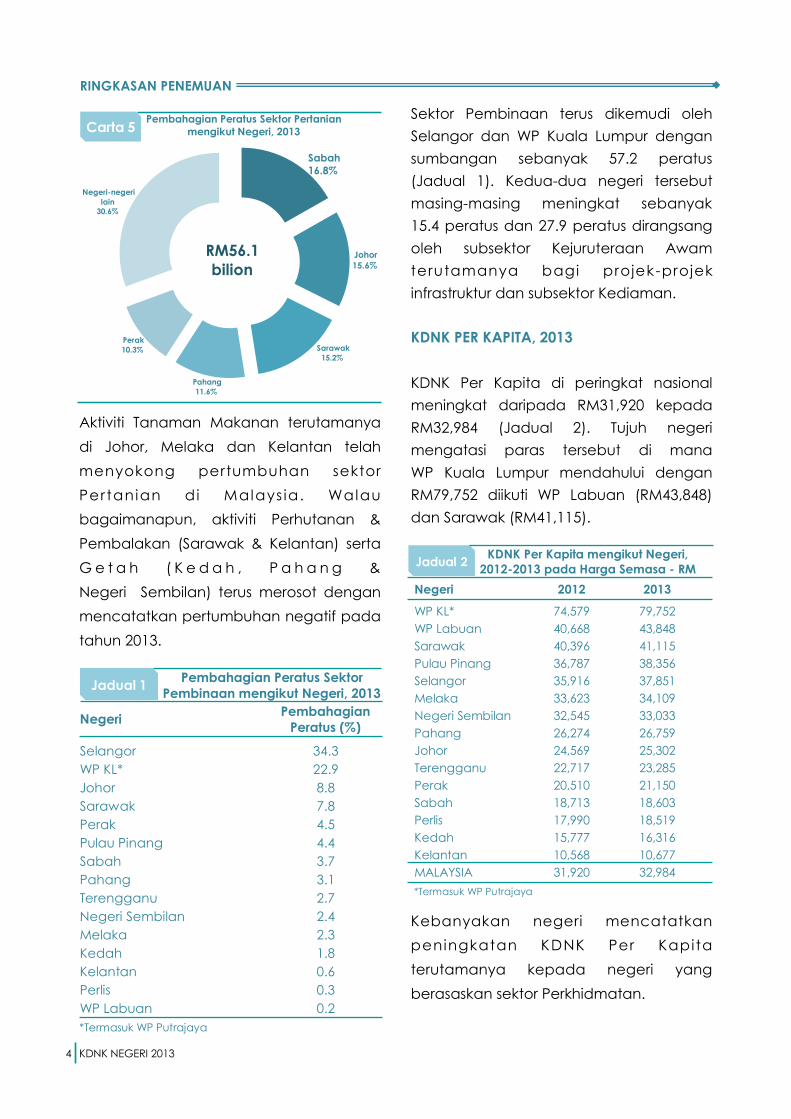
Peningkatan perlahan di Selangor
dipengaruhi oleh pertumbuhan negatif
dalam Bahan Kimia & Produk Kimia.
Walaupun meningkat pada kadar
sederhana, Selangor kekal menerajui
sektor Pembuatan dengan sumbangan
sebanyak 29.7 peratus diikuti oleh
Pulau Pinang (13.6 peratus) dan Johor
(12.6 peratus) seperti yang dilihat
di Carta 4.
Sektor Pertanian diterajui oleh Sabah,
Johor, Sarawak, Pahang dan Perak
dengan sumbangan sebanyak
69.5 peratus seperti di Carta 5. Aktiviti
Kelapa Sawit pulih dengan merekodkan
pertumbuhan positif disokong oleh
pengeluaran yang tinggi bagi Sarawak,
Pahang dan Sabah.
3
3.6 2.1 1.3 3.1
2.5 2.9 2.4 3.1
2.7 5.4
3.9 2.4 3.1 5.6
1.5 3.8
12.1 11.9
23.5
9.6 7.6
20.0
1.9
13.8
22.4
1.5
7.6
20.6 11.4
4.0
7.1
33.8 30.4
5.2
40.6 47.0 25.4
47.8 19.4
9.9
30.8 37.3
7.9 26.6
4.1
21.6
24.5
48.6 54.9
69.6
46.6 40.8
50.9 47.0
63.2 62.4 58.8 51.1 48.3
37.2
89.4
72.4
55.2
0.0
10.0
20.0
30.0
40.0
50.0
60.0
70.0
80.0
90.0
100.0
Pe
ratu
s (
%)
Pembahagian Peratus Aktiviti Ekonomi mengikut Negeri, 2013
Duti Import Pembinaan Perlombongan
dan Pengkuarian
Pertanian Pembuatan Perkhidmatan
* Termasuk WP Putrajaya
Carta 3
20.48.1
21.5
Selangor
29.7%
Pulau
Pinang
13.6%
Johor
12.6%
Sarawak
10.3%
Negeri
Sembilan7.0%
Negeri-negeri
lain26.8%
RM193.2
bilion
Pembahagian Peratus Sektor Pembuatan
mengikut Negeri, 2013Carta 4
KDNK NEGERI 2013
RINGKASAN PENEMUAN
Aktiviti Tanaman Makanan terutamanya
di Johor, Melaka dan Kelantan telah
menyokong pertumbuhan sektor
Pertanian di Malays ia. Walau
bagaimanapun, aktiviti Perhutanan &
Pembalakan (Sarawak & Kelantan) serta
G e t a h ( K e d a h , P a h a n g &
Negeri Sembilan) terus merosot dengan
mencatatkan pertumbuhan negatif pada
tahun 2013.
Sektor Pembinaan terus dikemudi oleh
Selangor dan WP Kuala Lumpur dengan
sumbangan sebanyak 57.2 peratus
(Jadual 1). Kedua-dua negeri tersebut
masing-masing meningkat sebanyak
15.4 peratus dan 27.9 peratus dirangsang
oleh subsektor Kejuruteraan Awam
terutamanya bagi projek-projek
infrastruktur dan subsektor Kediaman.
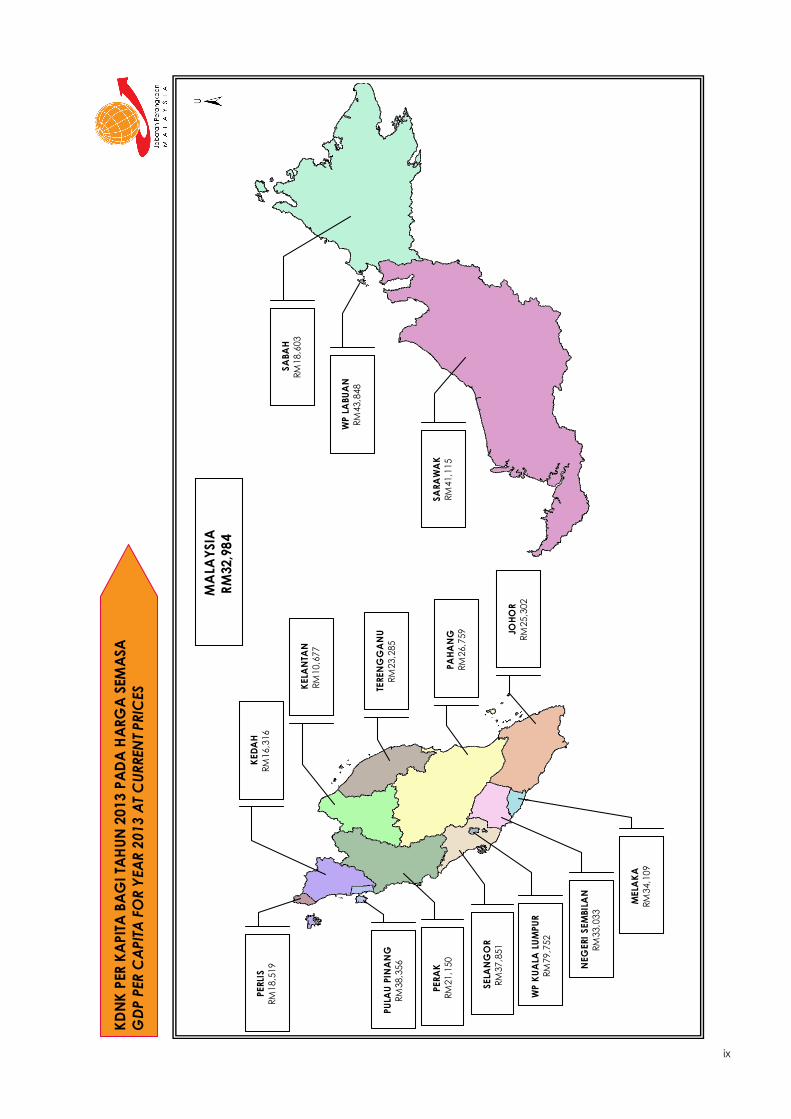
KDNK PER KAPITA, 2013
KDNK Per Kapita di peringkat nasional
meningkat daripada RM31,920 kepada
RM32,984 (Jadual 2). Tujuh negeri
mengatasi paras tersebut di mana
WP Kuala Lumpur mendahului dengan
RM79,752 diikuti WP Labuan (RM43,848)
dan Sarawak (RM41,115).
Kebanyakan negeri mencatatkan
peningkatan KDNK Per Kapita
terutamanya kepada negeri yang
berasaskan sektor Perkhidmatan.
4
Sabah
16.8%
Johor
15.6%
Sarawak
15.2%
Pahang
11.6%
Perak
10.3%
Negeri-negeri
lain
30.6%
Pembahagian Peratus Sektor Pertanian
mengikut Negeri, 2013
RM56.1
bilion
Carta 5
NegeriPembahagian
Peratus (%)
Selangor 34.3
WP KL* 22.9
Johor 8.8
Sarawak 7.8
Perak 4.5
Pulau Pinang 4.4
Sabah 3.7
Pahang 3.1
Terengganu 2.7
Negeri Sembilan 2.4
Melaka 2.3
Kedah 1.8
Kelantan 0.6
Perlis 0.3
WP Labuan 0.2
*Termasuk WP Putrajaya
Pembahagian Peratus Sektor
Pembinaan mengikut Negeri, 2013Jadual 1
Negeri 2012 2013
WP KL* 74,579 79,752
WP Labuan 40,668 43,848
Sarawak 40,396 41,115
Pulau Pinang 36,787 38,356
Selangor 35,916 37,851
Melaka 33,623 34,109
Negeri Sembilan 32,545 33,033
Pahang 26,274 26,759
Johor 24,569 25,302
Terengganu 22,717 23,285
Perak 20,510 21,150
Sabah 18,713 18,603
Perlis 17,990 18,519
Kedah 15,777 16,316
Kelantan 10,568 10,677
MALAYSIA 31,920 32,984
*Termasuk WP Putrajaya
KDNK Per Kapita mengikut Negeri,
2012-2013 pada Harga Semasa - RMJadual 2
KDNK NEGERI 2013
SUMMARY FINDINGS
INTRODUCTION
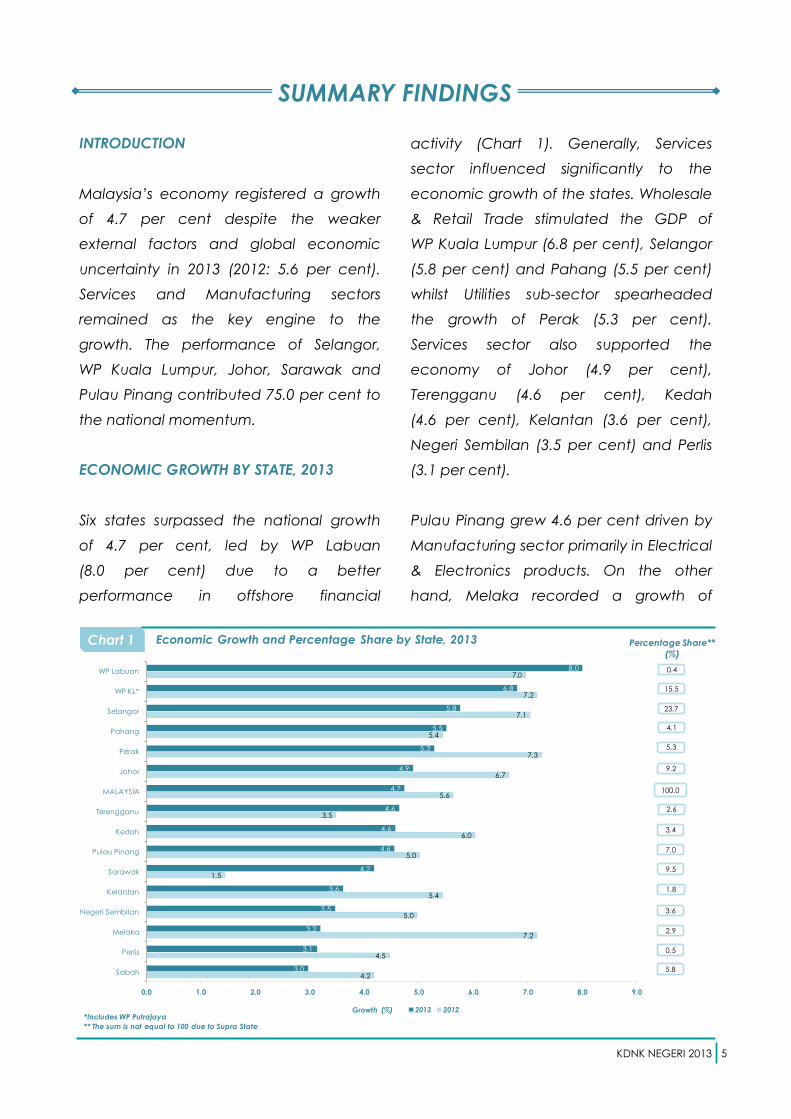
Malaysia’s economy registered a growth
of 4.7 per cent despite the weaker
external factors and global economic
uncertainty in 2013 (2012: 5.6 per cent).
Services and Manufacturing sectors
remained as the key engine to the
growth. The performance of Selangor,
WP Kuala Lumpur, Johor, Sarawak and
Pulau Pinang contributed 75.0 per cent to
the national momentum.
ECONOMIC GROWTH BY STATE, 2013
Six states surpassed the national growth
of 4.7 per cent, led by WP Labuan
(8.0 per cent) due to a better
performance in offshore financial
activity (Chart 1). Generally, Services
sector influenced significantly to the
economic growth of the states. Wholesale
& Retail Trade stimulated the GDP of
WP Kuala Lumpur (6.8 per cent), Selangor
(5.8 per cent) and Pahang (5.5 per cent)
whilst Utilities sub-sector spearheaded
the growth of Perak (5.3 per cent).
Services sector also supported the
economy of Johor (4.9 per cent),
Terengganu (4.6 per cent), Kedah
(4.6 per cent), Kelantan (3.6 per cent),
Negeri Sembilan (3.5 per cent) and Perlis
(3.1 per cent).
Pulau Pinang grew 4.6 per cent driven by
Manufacturing sector primarily in Electrical
& Electronics products. On the other
hand, Melaka recorded a growth of
5
4.2
4.5
7.2
5.0
5.4
1.5
5.0
6.0
3.5
5.6
6.7
7.3
5.4
7.1
7.2
7.0
3.0
3.1
3.2
3.5
3.6
4.2
4.6
4.6
4.6
4.7
4.9
5.3
5.5
5.8
6.8
8.0
0.0 1.0 2.0 3.0 4.0 5.0 6.0 7.0 8.0 9.0
Sabah
Perlis
Melaka
Negeri Sembilan
Kelantan
Sarawak
Pulau Pinang
Kedah
Terengganu
MALAYSIA
Johor
Perak
Pahang
Selangor
WP KL*
WP Labuan
2013 2012
0.4
15.5
23.7
4.1
5.3
9.2
100.0
2.6
3.4
7.0
9.5
3.6
2.9
1.8
0.5
5.8
Economic Growth and Percentage Share by State, 2013 Percentage Share**
(%)
Growth (%)*Includes WP Putrajaya
** The sum is not equal to 100 due to Supra State
Chart 1
KDNK NEGERI 2013
SUMMARY FINDINGS
1.8 per cent in this sector resulted from a
contraction in Refined Petroleum
sub-sector. This, along with a sharp decline
in Construction sector dragged down the
overall growth of Melaka to 3.2 per cent
(2012: 7.2 per cent).
After experiencing a modest growth of
1.5 per cent in 2012, Sarawak expanded
4.2 per cent due to a favourable
momentum in Mining & Quarrying sector.
Sabah grew at 3.0 per cent aided
by Services and Agriculture sectors.
Nevertheless, the growth was slower than
2012 (4.2 per cent) affected by a lower
production in Mining activity.
GDP CONTRIBUTION BY STATE, 2013
In 2013, five states namely Selangor,
WP Kuala Lumpur, Sarawak, Johor and
Pulau Pinang contributed 64.8 per cent
to the national economy as depicted
in Chart 1. Selangor remained as a pillar
with a share of 23.7 per cent, followed
by WP Kuala Lumpur (15.5 per cent) and
Sarawak (9.5 per cent).
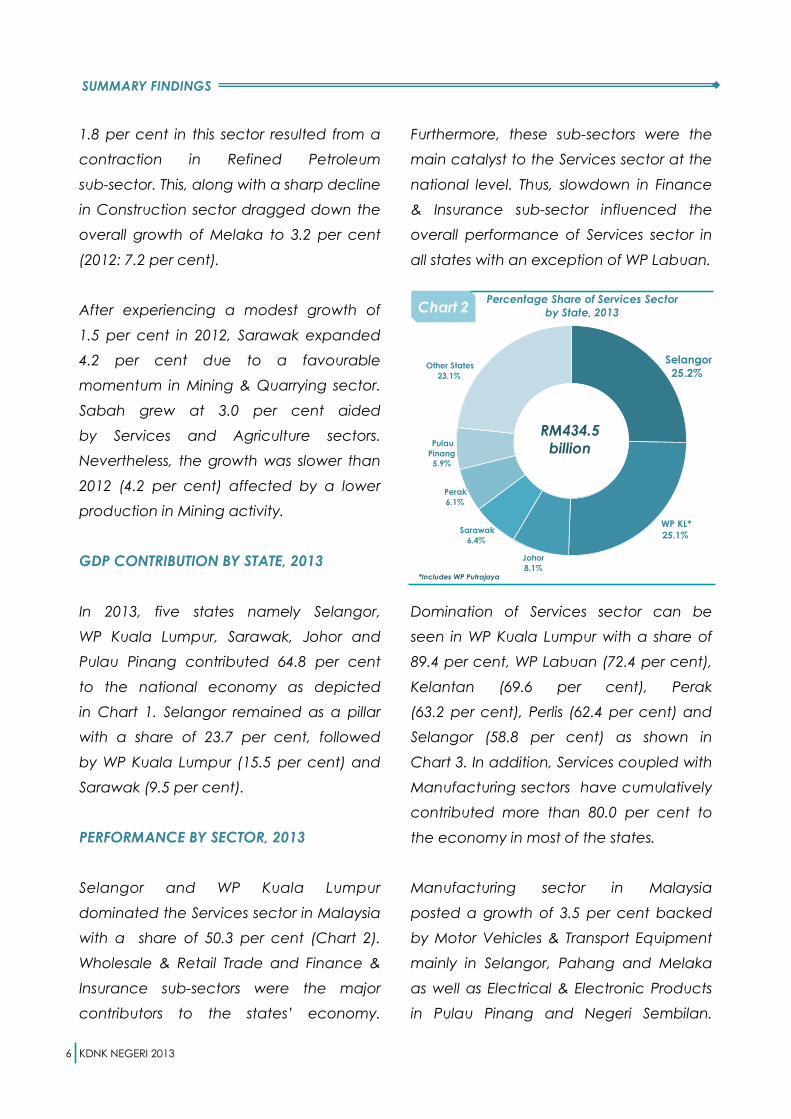
PERFORMANCE BY SECTOR, 2013
Selangor and WP Kuala Lumpur
dominated the Services sector in Malaysia
with a share of 50.3 per cent (Chart 2).
Wholesale & Retail Trade and Finance &
Insurance sub-sectors were the major
contributors to the states’ economy.
Furthermore, these sub-sectors were the
main catalyst to the Services sector at the
national level. Thus, slowdown in Finance
& Insurance sub-sector influenced the
overall performance of Services sector in
all states with an exception of WP Labuan.
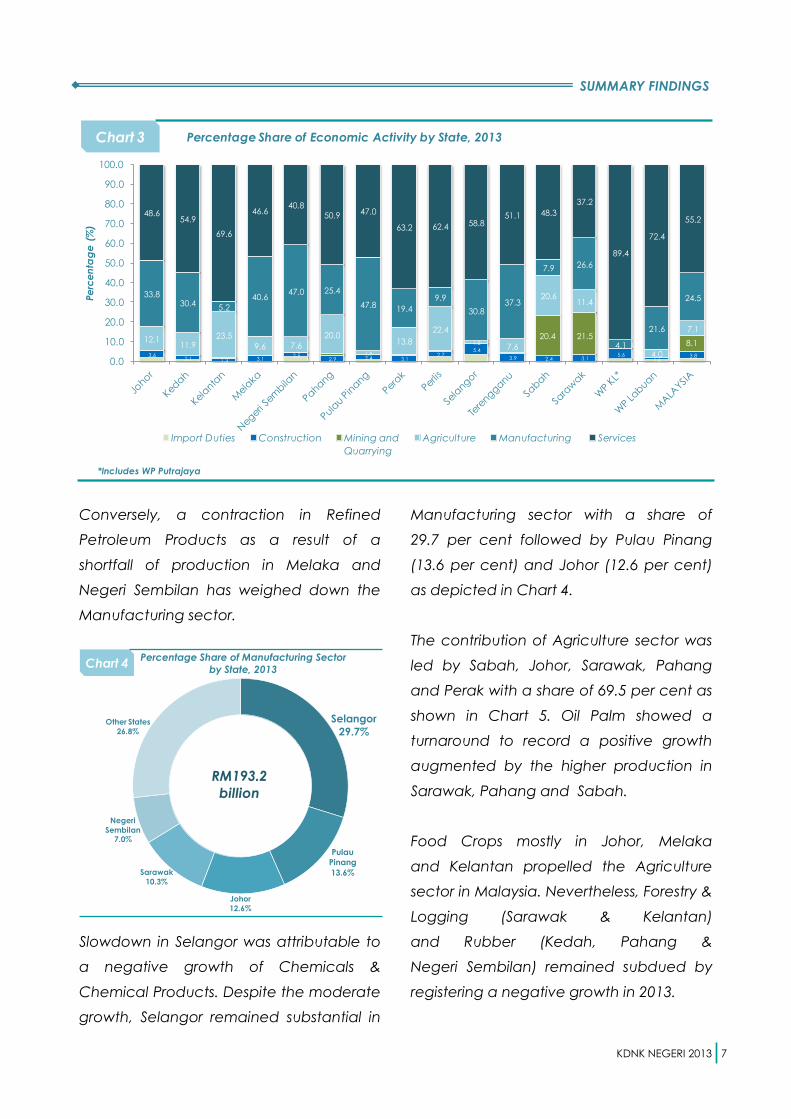
Domination of Services sector can be
seen in WP Kuala Lumpur with a share of
89.4 per cent, WP Labuan (72.4 per cent),
Kelantan (69.6 per cent), Perak
(63.2 per cent), Perlis (62.4 per cent) and
Selangor (58.8 per cent) as shown in
Chart 3. In addition, Services coupled with
Manufacturing sectors have cumulatively
contributed more than 80.0 per cent to
the economy in most of the states.
Manufacturing sector in Malaysia
posted a growth of 3.5 per cent backed
by Motor Vehicles & Transport Equipment
mainly in Selangor, Pahang and Melaka
as well as Electrical & Electronic Products
in Pulau Pinang and Negeri Sembilan.
6
Selangor
25.2%
WP KL*
25.1%
Johor
8.1%
Sarawak
6.4%
Perak
6.1%
Pulau
Pinang
5.9%
Other States
23.1%
RM434.5
billion
Percentage Share of Services Sector
by State, 2013
*Includes WP Putrajaya
Chart 2
KDNK NEGERI 2013
SUMMARY FINDINGS
Conversely, a contraction in Refined
Petroleum Products as a result of a
shortfall of production in Melaka and
Negeri Sembilan has weighed down the
Manufacturing sector.
Slowdown in Selangor was attributable to
a negative growth of Chemicals &
Chemical Products. Despite the moderate
growth, Selangor remained substantial in
Manufacturing sector with a share of
29.7 per cent followed by Pulau Pinang
(13.6 per cent) and Johor (12.6 per cent)
as depicted in Chart 4.
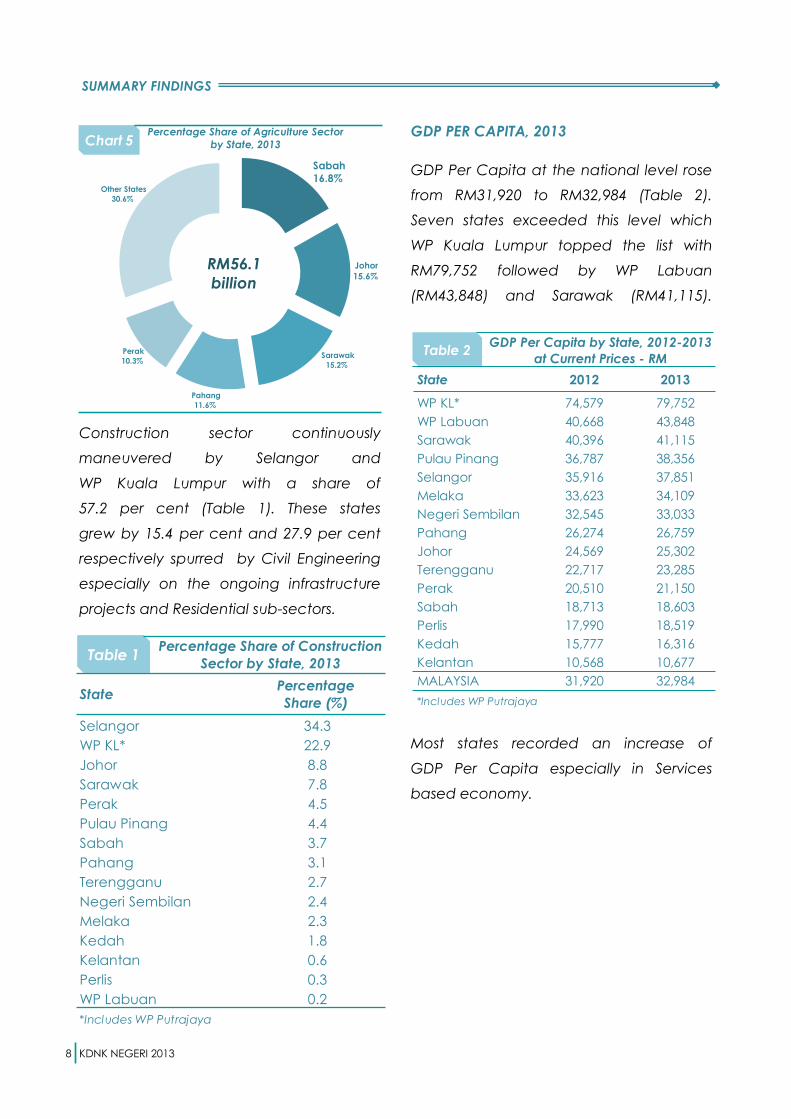
The contribution of Agriculture sector was
led by Sabah, Johor, Sarawak, Pahang
and Perak with a share of 69.5 per cent as
shown in Chart 5. Oil Palm showed a
turnaround to record a positive growth
augmented by the higher production in
Sarawak, Pahang and Sabah.
Food Crops mostly in Johor, Melaka
and Kelantan propelled the Agriculture
sector in Malaysia. Nevertheless, Forestry &
Logging (Sarawak & Kelantan)
and Rubber (Kedah, Pahang &
Negeri Sembilan) remained subdued by
registering a negative growth in 2013.
7
Selangor
29.7%
Pulau
Pinang
13.6%
Johor
12.6%
Sarawak
10.3%
Negeri
Sembilan7.0%
Other States
26.8%
RM193.2
billion
Percentage Share of Manufacturing Sector
by State, 2013Chart 4
3.6 2.1 1.3 3.1
2.5 2.9 2.4 3.1
2.7 5.4
3.9 2.4 3.1 5.6
1.5 3.8
12.1 11.9
23.5
9.6 7.6
20.0
1.9
13.8
22.4
1.5 7.6
20.6 11.4
4.0
7.1
33.8 30.4
5.2
40.6 47.0 25.4
47.8 19.4
9.9
30.8 37.3
7.9 26.6
4.1
21.6
24.5
48.6 54.9
69.6
46.6 40.8
50.9 47.0
63.2 62.4 58.8 51.1 48.3
37.2
89.4
72.4
55.2
0.0
10.0
20.0
30.0
40.0
50.0
60.0
70.0
80.0
90.0
100.0
Pe
rce
nta
ge
(%
)
Percentage Share of Economic Activity by State, 2013
Import Duties Construction Mining and
Quarrying
Agriculture Manufacturing Services
*Includes WP Putrajaya
20.4 21.58.1
Chart 3
KDNK NEGERI 2013
SUMMARY FINDINGS
Construction sector continuously
maneuvered by Selangor and
WP Kuala Lumpur with a share of
57.2 per cent (Table 1). These states
grew by 15.4 per cent and 27.9 per cent
respectively spurred by Civil Engineering
especially on the ongoing infrastructure
projects and Residential sub-sectors.
GDP PER CAPITA, 2013
GDP Per Capita at the national level rose
from RM31,920 to RM32,984 (Table 2).
Seven states exceeded this level which
WP Kuala Lumpur topped the list with
RM79,752 followed by WP Labuan
(RM43,848) and Sarawak (RM41,115).
Most states recorded an increase of
GDP Per Capita especially in Services
based economy.
8
Sabah
16.8%
Johor
15.6%
Sarawak
15.2%
Pahang
11.6%
Perak
10.3%
Other States
30.6%
Percentage Share of Agriculture Sector
by State, 2013
RM56.1
billion
Chart 5
StatePercentage
Share (%)
Selangor 34.3
WP KL* 22.9
Johor 8.8
Sarawak 7.8
Perak 4.5
Pulau Pinang 4.4
Sabah 3.7
Pahang 3.1
Terengganu 2.7
Negeri Sembilan 2.4
Melaka 2.3
Kedah 1.8
Kelantan 0.6
Perlis 0.3
WP Labuan 0.2
*Includes WP Putrajaya
Percentage Share of Construction
Sector by State, 2013Table 1
State 2012 2013
WP KL* 74,579 79,752
WP Labuan 40,668 43,848
Sarawak 40,396 41,115
Pulau Pinang 36,787 38,356
Selangor 35,916 37,851
Melaka 33,623 34,109
Negeri Sembilan 32,545 33,033
Pahang 26,274 26,759
Johor 24,569 25,302
Terengganu 22,717 23,285
Perak 20,510 21,150
Sabah 18,713 18,603
Perlis 17,990 18,519
Kedah 15,777 16,316
Kelantan 10,568 10,677
MALAYSIA 31,920 32,984
*Includes WP Putrajaya
GDP Per Capita by State, 2012-2013
at Current Prices - RMTable 2
JADUAL
TABLE
KDNK NEGERI 2013 I GDP BY STATE 2013
2

KDNK NEGERI 2013 9
JADUAL
TABLE
1.
2.
3.
4.
5.
6.
7.
8.
9.
10.
11.
12.
13.
14.
15.
16.
Jumlah KDNK pada Harga Pembeli
Total GDP at Purchasers' Prices
JADUAL
TABLE
1. 5.0 4.1 4.2 -3.0 9.8 6.4 6.7 4.9 9.2 9.2 9.0 8.9 8.8 9.0 9.1 9.2 9.2
2. 8.0 9.2 0.8 -0.5 4.3 8.4 6.0 4.6 3.3 3.4 3.4 3.3 3.3 3.3 3.3 3.4 3.4
3. 6.9 8.5 6.9 2.1 4.9 6.6 5.4 3.6 1.7 1.7 1.7 1.8 1.8 1.8 1.8 1.8 1.8
4. 8.5 6.7 4.7 1.2 6.6 4.0 7.2 3.2 2.8 2.8 2.9 2.9 2.9 2.9 2.9 2.9 2.9
5. 9.2 5.2 4.3 0.6 5.8 4.9 5.0 3.5 3.6 3.8 3.7 3.7 3.8 3.7 3.7 3.7 3.6
6. 7.1 2.1 5.0 -1.0 4.9 6.2 5.4 5.5 4.2 4.3 4.1 4.1 4.2 4.1 4.1 4.1 4.1
7. 10.8 6.5 5.5 -10.5 10.4 3.9 5.0 4.6 7.2 7.6 7.6 7.6 6.9 7.1 7.0 7.0 7.0
8. 6.6 5.0 6.5 -1.1 5.7 7.0 7.3 5.3 5.1 5.2 5.1 5.2 5.2 5.1 5.2 5.3 5.3
9. 3.5 7.2 2.9 -2.6 4.8 2.0 4.5 3.1 0.5 0.5 0.5 0.5 0.5 0.5 0.5 0.5 0.5
10. 5.0 7.9 9.1 -0.5 11.9 5.8 7.1 5.8 20.8 20.7 21.0 21.9 22.1 23.0 23.1 23.5 23.7
11. 8.4 7.4 2.1 -4.2 4.3 2.7 3.5 4.6 2.9 2.9 3.0 2.9 2.8 2.7 2.7 2.6 2.6
12. 5.5 3.2 10.7 4.8 2.7 1.4 4.2 3.0 6.0 6.0 5.8 6.1 6.5 6.2 6.0 5.9 5.8
13. 4.4 8.3 0.3 -2.0 4.3 5.8 1.5 4.2 10.6 10.5 10.7 10.2 10.2 9.9 10.0 9.6 9.5
14. 7.3 8.9 9.1 3.6 10.6 9.0 7.2 6.8 12.3 12.5 12.8 13.4 14.0 14.5 15.0 15.2 15.5
15. 18.9 5.0 -11.5 4.9 6.4 13.6 7.0 8.0 0.4 0.4 0.4 0.4 0.4 0.4 0.4 0.4 0.4
16. -3.2 1.8 -8.5 -10.8 -2.9 -6.7 2.7 -2.0 9.4 8.6 8.2 7.2 6.5 5.9 5.2 5.1 4.7
KDNK pada Harga Pembeli
GDP at Purchasers' Prices
1 Termasuk WP Putrajaya1 Includes WP Putrajaya2 Supra State merangkumi aktiviti pengeluaran yang melangkaui pusat kepentingan ekonomi utama bagi mana-mana negeri2 Supra State covers production activities that beyond the centre of predominant economic interest for any state
4.7
2013p
100.0
Perubahan Peratusan Tahunan
Annual Percentage Change
Pembahagian Peratus KDNK
Percentage Share of GDP
176,377
19,642
44,469
71,879
114,277
3,217
38,159 37,397
3,475
122,059
74,887
45,791
20,554
186,548 139,237
17,720
40,986
23,837
12,780
20,474
26,414
3,648
164,751
18,980
42,680
39,688 37,001
3,386
25,177
27,484
48,161
34,576
3,318
155,739
18,487
42,101
66,947 64,173
88,488
2,486
41,028
751,934 787,611
97,830
2,646
39,827
106,615
3,007
37,139
629,885 676,653 711,760
70,849
60,679 64,592 68,899 72,275
21,092
11,436
18,472
23,804
26,203 29,201
25,278
13,476
21,944
27,730
30,791 32,489
28,691
22,646
13,963
26,434
55,268
21,998
11,991
19,689
2013p
100.0 100.0 100.0 100.05.2 5.6 100.0 100.0 100.0 100.0
2010f
2011f
2012e
- Annual Percentage Change & Percentage Share of GDP2
543,578 573,936 610,087 639,565
5.6 6.3 4.8 -1.5 7.4
WP Kuala Lumpur1
WP Labuan
Supra2
Terengganu
Sabah
Sarawak
Perak
Perlis
Selangor
Negeri Sembilan
Pahang
Pulau Pinang
Kedah
Kelantan
Melaka
Johor
2012e
2005f
2006f
2007f
2008f
2009f
2013p
NEGERI
STATE2006
f2007
f2008
f2009
f2010
f2011
f
KDNK mengikut Negeri, 2005-2013 pada Harga Malar 2005
- Perubahan Peratusan Tahunan & Pembahagian Peratus KDNK
GDP by State, 2005-2013 at Constant 2005 Prices
Supra2 51,013 49,381 50,274 45,990
WP Labuan 2,146 2,551 2,678 2,369
WP Kuala Lumpur1 67,017 71,894 78,302 85,414
Sarawak 57,700 60,265 65,283 65,470
Sabah 32,427 34,221 35,318 39,114
Terengganu 15,562 16,867 18,122 18,500
Selangor 113,185 118,819 128,169 139,877
Perlis 2,845 2,945 3,157 3,250 3,537 3,166
Pulau Pinang 39,186 43,401 46,226 48,749 43,626 50,053 52,571
41,787
54,968
Perak 27,733 29,558 31,048 33,060 32,700
Pahang 23,061 24,693 25,206 26,465
Negeri Sembilan 19,736 21,554 22,680 23,657
Melaka 15,049 16,333 17,422 18,250
Kelantan 9,031 9,658 10,482 11,203
Kedah 17,829 19,255 21,033 21,209
STATE
Johor 50,058 52,539 54,685 56,990
1KDNK mengikut Negeri, 2005-2013 pada Harga Malar 2005 - RM Juta
GDP by State, 2005-2013 at Constant 2005 Prices - RM Million
NEGERI2012
e2011
f2010
f2009
f2008
f2007
f2006
f2005
f
KDNK NEGERI 2013 10
Jenis Aktiviti Ekonomi Pertanian Perlombongan
dan Pengkuarian
Pembuatan Pembinaan Perkhidmatan campur :
Duti Import
KDNK pada
Harga Pembeli
Kind of Economic Activity Agriculture Mining and
Quarrying
Manufacturing Construction Services plus :
Import Duties
GDP at
Purchasers' Prices
1. Johor 6,189 51 19,314 1,671 22,105 729 50,058
2. Kedah 2,206 17 6,439 480 8,577 110 17,829
3. Kelantan 2,345 17 546 177 5,936 11 9,031
4. Melaka 813 8 7,594 340 6,281 13 15,049
5. Negeri Sembilan 1,638 18 10,528 412 7,045 95 19,736
6. Pahang 5,408 101 6,423 575 10,515 40 23,061
7. Pulau Pinang 634 17 21,249 844 16,138 304 39,186
8. Perak 4,686 91 5,548 704 16,637 67 27,733
9. Perlis 726 7 352 103 1,526 131 2,845
10. Selangor 1,701 111 41,648 5,047 60,917 3,762 113,185
11. Terengganu 1,566 10 6,476 414 7,087 9 15,562
12. Sabah 9,647 5,133 3,149 950 13,421 127 32,427
13. Sarawak 7,278 15,493 15,987 1,368 17,346 229 57,700
14. WP Kuala Lumpura
25 3,908 2,998 59,373 711 67,017 2
15. WP Labuan 74 .. 595 24 1,419 34 2,146
16. Supra1
.. 51,013 .. .. .. .. 51,013
Jumlah KDNK pada Harga Pembeli
Total GDP at Purchasers' Prices
Jenis Aktiviti Ekonomi Pertanian Perlombongan
dan Pengkuarian
Pembuatan Pembinaan Perkhidmatan campur :
Duti Import
KDNK pada
Harga Pembeli
Kind of Economic Activity Agriculture Mining and
Quarrying
Manufacturing Construction Services plus :
Import Duties
GDP at
Purchasers' Prices
1. Johor 13.8 0.1 12.9 10.4 8.7 11.4 9.2
2. Kedah 4.9 0.0 4.3 3.0 3.4 1.7 3.3
3. Kelantan 5.2 0.0 0.4 1.1 2.3 0.2 1.7
4. Melaka 1.8 0.0 5.1 2.1 2.5 0.2 2.8
5. Negeri Sembilan 3.6 0.0 7.0 2.6 2.8 1.5 3.6
6. Pahang 12.0 0.1 4.3 3.6 4.1 0.6 4.2
7. Pulau Pinang 1.4 0.0 14.2 5.2 6.3 4.8 7.2
8. Perak 10.4 0.1 3.7 4.4 6.5 1.1 5.1
9. Perlis 1.6 0.0 0.2 0.6 0.6 2.1 0.5
10. Selangor 3.8 0.2 27.8 31.3 24.0 59.0 20.8
11. Terengganu 3.5 0.0 4.3 2.6 2.8 0.1 2.9
12. Sabah 21.5 7.1 2.1 5.9 5.3 2.0 6.0
13. Sarawak 16.2 21.5 10.7 8.5 6.8 3.6 10.6
14. WP Kuala Lumpur - 0.0 2.6 18.6 23.3 11.2 12.30.0
15. WP Labuan 0.2 .. 0.4 0.2 0.6 0.5 0.4
16. Supra1 .. 70.7 .. .. .. .. 9.4
KDNK pada Harga Pembeli
GDP at Purchasers' Prices
a Nilai ditambah adalah kurang daripada RM 5 jutaa Value added is less than RM 5 million
JADUAL
TABLE
JADUAL
TABLE
100.0100.0
3KDNK mengikut Negeri dan Jenis Aktiviti Ekonomi, 2005 pada Harga Malar 2005 - RM Juta
GDP by State and Kind of Economic Activity, 2005 at Constant 2005 Prices - RM Million
4 KDNK mengikut Negeri dan Jenis Aktiviti Ekonomi, 2005 pada Harga Malar 2005 - Pembahagian Peratus KDNK
GDP by State and Kind of Economic Activity, 2005 at Constant 2005 Prices - Percentage Share of GDP
543,578 6,372 254,322 16,107 149,754 72,111 44,912
100.0100.0100.0100.0100.0
KDNK NEGERI 2013 11
Jenis Aktiviti Ekonomi Pertanian Perlombongan
dan Pengkuarian
Pembuatan Pembinaan Perkhidmatan campur :
Duti Import
KDNK pada
Harga Pembeli
Kind of Economic Activity Agriculture Mining and
Quarrying
Manufacturing Construction Services plus :
Import Duties
GDP at
Purchasers' Prices
1. Johor 6,654 48 20,066 1,568 23,482 720 52,539
2. Kedah 2,417 17 6,984 454 9,249 134 19,255
3. Kelantan 2,618 14 511 169 6,336 10 9,658
4. Melaka 962 7 8,313 314 6,723 14 16,333
5. Negeri Sembilan 1,817 18 11,477 403 7,771 69 21,554
6. Pahang 5,770 80 7,111 572 11,138 22 24,693
7. Pulau Pinang 700 17 24,429 813 17,153 288 43,401
8. Perak 4,841 97 6,255 675 17,637 54 29,558
9. Perlis 809 7 345 101 1,582 101 2,945
10. Selangor 2,049 116 42,584 5,028 65,861 3,181 118,819
11. Terengganu 1,683 9 7,204 455 7,507 10 16,867
12. Sabah 9,908 5,305 3,308 1,050 14,537 114 34,221
13. Sarawak 7,199 16,136 17,375 1,387 17,982 187 60,265
14. WP Kuala Lumpura
24 4,024 3,009 64,090 745 71,894 2
15. WP Labuan 104 .. 894 24 1,508 21 2,551
16. Supra1
.. 49,381 .. .. .. .. 49,381
Jumlah KDNK pada Harga Pembeli
Total GDP at Purchasers' Prices
Jenis Aktiviti Ekonomi Pertanian Perlombongan
dan Pengkuarian
Pembuatan Pembinaan Perkhidmatan campur :
Duti Import
KDNK pada
Harga Pembeli
Kind of Economic Activity Agriculture Mining and
Quarrying
Manufacturing Construction Services plus :
Import Duties
GDP at
Purchasers' Prices
1. Johor 7.5 -4.7 3.9 -6.1 6.2 -1.1 5.0
2. Kedah 9.6 -1.6 8.5 -5.4 7.8 22.3 8.0
3. Kelantan 11.7 -14.1 -6.5 -4.3 6.7 -9.2 6.9
4. Melaka 18.2 -8.1 9.5 -7.5 7.0 6.8 8.5
5. Negeri Sembilan 10.9 -1.6 9.0 -2.2 10.3 -26.7 9.2
6. Pahang 6.7 -20.5 10.7 -0.6 5.9 -43.5 7.1
7. Pulau Pinang 10.5 -2.4 15.0 -3.7 6.3 -5.2 10.8
8. Perak 3.3 6.3 12.7 -4.1 6.0 -20.3 6.6
9. Perlis 11.4 -1.5 -1.8 -2.7 3.7 -22.9 3.5
10. Selangor 20.5 4.7 2.2 -0.4 8.1 -15.4 5.0
11. Terengganu 7.5 -16.8 11.2 9.9 5.9 7.7 8.4
12. Sabah 2.7 3.4 5.0 10.5 8.3 -10.0 5.5
13. Sarawak -1.1 4.1 8.7 1.4 3.7 -18.3 4.4
14. WP Kuala Lumpur - -3.8 3.0 0.4 7.9 4.7 7.3-21.6
15. WP Labuan 40.9 .. 50.3 -2.2 6.3 -38.4 18.9
16. Supra1 .. -3.2 .. .. .. .. -3.2
KDNK pada Harga Pembeli
GDP at Purchasers' Prices
JADUAL
TABLE
JADUAL
TABLE 6
5
KDNK mengikut Negeri dan Jenis Aktiviti Ekonomi, 2006 pada Harga Malar 2005 - Perubahan Peratusan Tahunan
GDP by State and Kind of Economic Activity, 2006 at Constant 2005 Prices - Annual Percentage Change
5.8 -1.2 7.4 -0.5 7.2 -11.0 5.6
KDNK mengikut Negeri dan Jenis Aktiviti Ekonomi, 2006 pada Harga Malar 2005 - RM Juta
GDP by State and Kind of Economic Activity, 2006 at Constant 2005 Prices - RM Million
47,533 71,276 160,880 16,022 272,555 5,671 573,936

KDNK NEGERI 2013 12
Jenis Aktiviti Ekonomi Pertanian Perlombongan
dan Pengkuarian
Pembuatan Pembinaan Perkhidmatan campur :
Duti Import
KDNK pada
Harga Pembeli
Kind of Economic Activity Agriculture Mining and
Quarrying
Manufacturing Construction Services plus :
Import Duties
GDP at
Purchasers' Prices
1. Johor 14.0 0.1 12.5 9.8 8.6 12.7 9.2
2. Kedah 5.1 0.0 4.3 2.8 3.4 2.4 3.4
3. Kelantan 5.5 0.0 0.3 1.1 2.3 0.2 1.7
4. Melaka 2.0 0.0 5.2 2.0 2.5 0.2 2.8
5. Negeri Sembilan 3.8 0.0 7.1 2.5 2.9 1.2 3.8
6. Pahang 12.1 0.1 4.4 3.6 4.1 0.4 4.3
7. Pulau Pinang 1.5 0.0 15.2 5.1 6.3 5.1 7.6
8. Perak 10.2 0.1 3.9 4.2 6.5 0.9 5.2
9. Perlis 1.7 0.0 0.2 0.6 0.6 1.8 0.5
10. Selangor 4.3 0.2 26.5 31.4 24.2 56.1 20.7
11. Terengganu 3.5 0.0 4.5 2.8 2.8 0.2 2.9
12. Sabah 20.8 7.4 2.1 6.6 5.3 2.0 6.0
13. Sarawak 15.1 22.6 10.8 8.7 6.6 3.3 10.5
14. WP Kuala Lumpur - 0.0 2.5 18.8 23.5 13.1 12.50.0
15. WP Labuan 0.2 .. 0.6 0.1 0.6 0.4 0.4
16. Supra1
.. 69.3 .. .. .. .. 8.6
KDNK pada Harga Pembeli
GDP at Purchasers' Prices
JADUAL
TABLE 7 KDNK mengikut Negeri dan Jenis Aktiviti Ekonomi, 2006 pada Harga Malar 2005 - Pembahagian Peratus KDNK
GDP by State and Kind of Economic Activity, 2006 at Constant 2005 Prices - Percentage Share of GDP
100.0 100.0100.0 100.0 100.0 100.0 100.0
KDNK NEGERI 2013 13
Jenis Aktiviti Ekonomi Pertanian Perlombongan
dan Pengkuarian
Pembuatan Pembinaan Perkhidmatan campur :
Duti Import
KDNK pada
Harga Pembeli
Kind of Economic Activity Agriculture Mining and
Quarrying
Manufacturing Construction Services plus :
Import Duties
GDP at
Purchasers' Prices
1. Johor 6,349 50 20,663 1,578 25,305 740 54,685
2. Kedah 2,682 18 7,718 521 9,968 127 21,033
3. Kelantan 2,989 16 538 159 6,767 14 10,482
4. Melaka 1,050 8 8,496 486 7,350 32 17,422
5. Negeri Sembilan 1,771 19 11,877 436 8,498 79 22,680
6. Pahang 5,208 110 7,053 576 12,236 24 25,206
7. Pulau Pinang 721 19 25,374 924 18,925 263 46,226
8. Perak 5,003 105 6,343 555 19,017 24 31,048
9. Perlis 932 7 324 100 1,700 94 3,157
10. Selangor 1,926 121 42,880 5,963 74,001 3,279 128,169
11. Terengganu 1,632 8 7,758 603 8,102 18 18,122
12. Sabah 10,474 4,338 3,333 840 16,185 147 35,318
13. Sarawak 7,346 17,638 18,774 1,623 19,659 243 65,283
14. WP Kuala Lumpura
26 3,911 3,007 70,520 837 78,302 2
15. WP Labuan 104 .. 840 18 1,699 17 2,678
16. Supra1
.. 50,274 .. .. .. .. 50,274
Jumlah KDNK pada Harga Pembeli
Total GDP at Purchasers' Prices
Jenis Aktiviti Ekonomi Pertanian Perlombongan
dan Pengkuarian
Pembuatan Pembinaan Perkhidmatan campur :
Duti Import
KDNK pada
Harga Pembeli
Kind of Economic Activity Agriculture Mining and
Quarrying
Manufacturing Construction Services plus :
Import Duties
GDP at
Purchasers' Prices
1. Johor -4.6 4.3 3.0 0.6 7.8 2.7 4.1
2. Kedah 11.0 9.2 10.5 14.8 7.8 -5.9 9.2
3. Kelantan 14.2 9.0 5.3 -6.1 6.8 42.9 8.5
4. Melaka 9.2 9.4 2.2 54.6 9.3 136.5 6.7
5. Negeri Sembilan -2.5 9.0 3.5 8.3 9.4 13.7 5.2
6. Pahang -9.8 37.5 -0.8 0.7 9.9 5.3 2.1
7. Pulau Pinang 3.0 9.5 3.9 13.7 10.3 -8.8 6.5
8. Perak 3.4 8.8 1.4 -17.8 7.8 -54.6 5.0
9. Perlis 15.2 8.7 -6.3 -0.4 7.5 -7.5 7.2
10. Selangor -6.0 4.0 0.7 18.6 12.4 3.1 7.9
11. Terengganu -3.0 -2.7 7.7 32.7 7.9 84.4 7.4
12. Sabah 5.7 -18.2 0.8 -20.0 11.3 29.4 3.2
13. Sarawak 2.0 9.3 8.1 17.0 9.3 30.0 8.3
14. WP Kuala Lumpur - 9.4 -2.8 -0.1 10.0 12.4 8.924.0
15. WP Labuan -0.1 .. -6.1 -23.1 12.7 -18.2 5.0
16. Supra1 .. 1.8 .. .. .. .. 1.8
KDNK pada Harga Pembeli
GDP at Purchasers' Prices
JADUAL
TABLE
JADUAL
TABLE
8
9
KDNK mengikut Negeri dan Jenis Aktiviti Ekonomi, 2007 pada Harga Malar 2005 - RM Juta
GDP by State and Kind of Economic Activity, 2007 at Constant 2005 Prices - RM Million
48,188 72,758 165,879 17,391 299,933 5,937 610,087
KDNK mengikut Negeri dan Jenis Aktiviti Ekonomi, 2007 pada Harga Malar 2005 - Perubahan Peratusan Tahunan
GDP by State and Kind of Economic Activity, 2007 at Constant 2005 Prices - Annual Percentage Change
1.4 2.1 3.1 8.5 10.0 4.7 6.3
KDNK NEGERI 2013 14
Jenis Aktiviti Ekonomi Pertanian Perlombongan
dan Pengkuarian
Pembuatan Pembinaan Perkhidmatan campur :
Duti Import
KDNK pada
Harga Pembeli
Kind of Economic Activity Agriculture Mining and
Quarrying
Manufacturing Construction Services plus :
Import Duties
GDP at
Purchasers' Prices
1. Johor 13.2 0.1 12.5 9.1 8.4 12.5 9.0
2. Kedah 5.6 0.0 4.7 3.0 3.3 2.1 3.4
3. Kelantan 6.2 0.0 0.3 0.9 2.3 0.2 1.7
4. Melaka 2.2 0.0 5.1 2.8 2.5 0.5 2.9
5. Negeri Sembilan 3.7 0.0 7.2 2.5 2.8 1.3 3.7
6. Pahang 10.8 0.2 4.3 3.3 4.1 0.4 4.1
7. Pulau Pinang 1.5 0.0 15.3 5.3 6.3 4.4 7.6
8. Perak 10.4 0.1 3.8 3.2 6.3 0.4 5.1
9. Perlis 1.9 0.0 0.2 0.6 0.6 1.6 0.5
10. Selangor 4.0 0.2 25.8 34.3 24.7 55.2 21.0
11. Terengganu 3.4 0.0 4.7 3.5 2.7 0.3 3.0
12. Sabah 21.7 6.0 2.0 4.8 5.4 2.5 5.8
13. Sarawak 15.2 24.2 11.3 9.3 6.6 4.1 10.7
14. WP Kuala Lumpur - 0.0 2.4 17.3 23.5 14.1 12.80.0
15. WP Labuan 0.2 .. 0.5 0.1 0.6 0.3 0.4
16. Supra1
.. 69.1 .. .. .. .. 8.2
KDNK pada Harga Pembeli
GDP at Purchasers' Prices
JADUAL
TABLE 10 KDNK mengikut Negeri dan Jenis Aktiviti Ekonomi, 2007 pada Harga Malar 2005 - Pembahagian Peratus KDNK
GDP by State and Kind of Economic Activity, 2007 at Constant 2005 Prices - Percentage Share of GDP
100.0 100.0100.0 100.0 100.0 100.0 100.0
KDNK NEGERI 2013 15
Jenis Aktiviti Ekonomi Pertanian Perlombongan
dan Pengkuarian
Pembuatan Pembinaan Perkhidmatan campur :
Duti Import
KDNK pada
Harga Pembeli
Kind of Economic Activity Agriculture Mining and
Quarrying
Manufacturing Construction Services plus :
Import Duties
GDP at
Purchasers' Prices
1. Johor 7,171 54 20,028 1,597 27,296 844 56,990
2. Kedah 2,748 18 6,957 571 10,774 140 21,209
3. Kelantan 3,028 16 572 176 7,394 18 11,203
4. Melaka 1,252 8 8,527 524 7,927 11 18,250
5. Negeri Sembilan 1,832 19 12,038 495 9,155 118 23,657
6. Pahang 5,455 100 7,210 662 12,974 64 26,465
7. Pulau Pinang 750 19 26,348 1,005 20,267 360 48,749
8. Perak 5,068 103 6,605 583 20,679 22 33,060
9. Perlis 936 8 349 101 1,789 66 3,250
10. Selangor 2,306 122 44,795 6,244 81,918 4,492 139,877
11. Terengganu 1,869 10 7,568 572 8,459 22 18,500
12. Sabah 10,095 8,037 3,412 823 16,548 198 39,114
13. Sarawak 7,415 16,465 18,472 1,585 21,222 312 65,470
14. WP Kuala Lumpura
26 3,672 3,194 77,690 830 85,414 2
15. WP Labuan 110 .. 593 21 1,620 26 2,369
16. Supra1
.. 45,990 .. .. .. .. 45,990
Jumlah KDNK pada Harga Pembeli
Total GDP at Purchasers' Prices
Jenis Aktiviti Ekonomi Pertanian Perlombongan
dan Pengkuarian
Pembuatan Pembinaan Perkhidmatan campur :
Duti Import
KDNK pada
Harga Pembeli
Kind of Economic Activity Agriculture Mining and
Quarrying
Manufacturing Construction Services plus :
Import Duties
GDP at
Purchasers' Prices
1. Johor 12.9 7.3 -3.1 1.2 7.9 14.1 4.2
2. Kedah 2.5 1.1 -9.9 9.6 8.1 10.4 0.8
3. Kelantan 1.3 1.4 6.4 10.6 9.3 25.2 6.9
4. Melaka 19.3 1.6 0.4 7.7 7.8 -64.1 4.7
5. Negeri Sembilan 3.5 0.7 1.4 13.5 7.7 49.7 4.3
6. Pahang 4.8 -9.1 2.2 14.9 6.0 169.8 5.0
7. Pulau Pinang 4.0 1.5 3.8 8.8 7.1 36.9 5.5
8. Perak 1.3 -2.1 4.1 4.9 8.7 -11.2 6.5
9. Perlis 0.4 4.8 8.0 1.1 5.2 -29.1 2.9
10. Selangor 19.7 1.0 4.5 4.7 10.7 37.0 9.1
11. Terengganu 14.5 13.0 -2.4 -5.2 4.4 21.8 2.1
12. Sabah -3.6 85.3 2.4 -2.0 2.2 34.4 10.7
13. Sarawak 0.9 -6.7 -1.6 -2.4 7.9 28.0 0.3
14. WP Kuala Lumpur - 1.1 -6.1 6.2 10.2 -0.8 9.1-13.5
15. WP Labuan 5.4 .. -29.4 12.2 -4.7 53.3 -11.5
16. Supra1 .. -8.5 .. .. .. .. -8.5
KDNK pada Harga Pembeli
GDP at Purchasers' Prices
JADUAL
TABLE
JADUAL
TABLE
11
12
KDNK mengikut Negeri dan Jenis Aktiviti Ekonomi, 2008 pada Harga Malar 2005 - RM Juta
GDP by State and Kind of Economic Activity, 2008 at Constant 2005 Prices - RM Million
50,036 70,996 167,148 18,151 325,712 7,523 639,565
KDNK mengikut Negeri dan Jenis Aktiviti Ekonomi, 2008 pada Harga Malar 2005 - Perubahan Peratusan Tahunan
GDP by State and Kind of Economic Activity, 2008 at Constant 2005 Prices - Annual Percentage Change
3.8 -2.4 0.8 4.4 8.6 26.7 4.8

KDNK NEGERI 2013 16
Jenis Aktiviti Ekonomi Pertanian Perlombongan
dan Pengkuarian
Pembuatan Pembinaan Perkhidmatan campur :
Duti Import
KDNK pada
Harga Pembeli
Kind of Economic Activity Agriculture Mining and
Quarrying
Manufacturing Construction Services plus :
Import Duties
GDP at
Purchasers' Prices
1. Johor 14.3 0.1 12.0 8.8 8.4 11.2 8.9
2. Kedah 5.5 0.0 4.2 3.1 3.3 1.9 3.3
3. Kelantan 6.1 0.0 0.3 1.0 2.3 0.2 1.8
4. Melaka 2.5 0.0 5.1 2.9 2.4 0.2 2.9
5. Negeri Sembilan 3.7 0.0 7.2 2.7 2.8 1.6 3.7
6. Pahang 10.9 0.1 4.3 3.6 4.0 0.8 4.1
7. Pulau Pinang 1.5 0.0 15.8 5.5 6.2 4.8 7.6
8. Perak 10.1 0.1 4.0 3.2 6.3 0.3 5.2
9. Perlis 1.9 0.0 0.2 0.6 0.5 0.9 0.5
10. Selangor 4.6 0.2 26.8 34.4 25.2 59.7 21.9
11. Terengganu 3.7 0.0 4.5 3.2 2.6 0.3 2.9
12. Sabah 20.2 11.3 2.0 4.5 5.1 2.6 6.1
13. Sarawak 14.8 23.2 11.1 8.7 6.5 4.1 10.2
14. WP Kuala Lumpur - 0.0 2.2 17.6 23.9 11.0 13.40.0
15. WP Labuan 0.2 .. 0.4 0.1 0.5 0.3 0.4
16. Supra1
.. 64.8 .. .. .. .. 7.2
KDNK pada Harga Pembeli
GDP at Purchasers' Prices
JADUAL
TABLE 13 KDNK mengikut Negeri dan Jenis Aktiviti Ekonomi, 2008 pada Harga Malar 2005 - Pembahagian Peratus KDNK
GDP by State and Kind of Economic Activity, 2008 at Constant 2005 Prices - Percentage Share of GDP
100.0 100.0100.0 100.0 100.0 100.0 100.0
KDNK NEGERI 2013 17
Jenis Aktiviti Ekonomi Pertanian Perlombongan
dan Pengkuarian
Pembuatan Pembinaan Perkhidmatan campur :
Duti Import
KDNK pada
Harga Pembeli
Kind of Economic Activity Agriculture Mining and
Quarrying
Manufacturing Construction Services plus :
Import Duties
GDP at
Purchasers' Prices
1. Johor 7,448 59 17,650 1,817 27,527 767 55,268
2. Kedah 2,758 19 6,416 538 11,219 142 21,092
3. Kelantan 2,941 16 570 195 7,692 22 11,436
4. Melaka 1,450 8 7,992 553 8,439 29 18,472
5. Negeri Sembilan 1,941 20 11,755 540 9,448 101 23,804
6. Pahang 5,449 121 6,693 696 13,163 82 26,203
7. Pulau Pinang 760 19 21,239 982 20,242 383 43,626
8. Perak 5,196 102 5,800 643 20,942 17 32,700
9. Perlis 856 6 290 92 1,841 81 3,166
10. Selangor 2,519 125 41,858 6,585 84,233 3,917 139,237
11. Terengganu 1,497 11 6,918 610 8,672 12 17,720
12. Sabah 9,713 9,635 3,149 880 17,371 237 40,986
13. Sarawak 7,423 15,190 17,490 1,708 22,074 288 64,173
14. WP Kuala Lumpura
27 3,763 3,413 80,428 856 88,488 1
15. WP Labuan 109 .. 568 19 1,735 54 2,486
16. Supra1
.. 41,028 .. .. .. .. 41,028
Jumlah KDNK pada Harga Pembeli
Total GDP at Purchasers' Prices
Jenis Aktiviti Ekonomi Pertanian Perlombongan
dan Pengkuarian
Pembuatan Pembinaan Perkhidmatan campur :
Duti Import
KDNK pada
Harga Pembeli
Kind of Economic Activity Agriculture Mining and
Quarrying
Manufacturing Construction Services plus :
Import Duties
GDP at
Purchasers' Prices
1. Johor 3.9 9.9 -11.9 13.7 0.8 -9.1 -3.0
2. Kedah 0.4 2.1 -7.8 -5.9 4.1 1.4 -0.5
3. Kelantan -2.9 -2.4 -0.3 10.7 4.0 23.4 2.1
4. Melaka 15.8 1.1 -6.3 5.6 6.5 155.2 1.2
5. Negeri Sembilan 5.9 2.4 -2.4 9.1 3.2 -14.4 0.6
6. Pahang -0.1 20.1 -7.2 5.2 1.5 28.6 -1.0
7. Pulau Pinang 1.4 1.2 -19.4 -2.3 -0.1 6.4 -10.5
8. Perak 2.5 -1.4 -12.2 10.4 1.3 -20.3 -1.1
9. Perlis -8.5 -18.5 -16.9 -8.9 2.9 21.4 -2.6
10. Selangor 9.2 2.6 -6.6 5.5 2.8 -12.8 -0.5
11. Terengganu -19.9 17.7 -8.6 6.7 2.5 -45.8 -4.2
12. Sabah -3.8 19.9 -7.7 6.9 5.0 19.7 4.8
13. Sarawak 0.1 -7.7 -5.3 7.8 4.0 -7.5 -2.0
14. WP Kuala Lumpur - 2.5 2.5 6.9 3.5 3.2 3.6-18.3
15. WP Labuan -0.3 .. -4.2 -5.7 7.1 105.7 4.9
16. Supra1 .. -10.8 .. .. .. .. -10.8
KDNK pada Harga Pembeli
GDP at Purchasers' Prices
JADUAL
TABLE
JADUAL
TABLE
14
15
KDNK mengikut Negeri dan Jenis Aktiviti Ekonomi, 2009 pada Harga Malar 2005 - RM Juta
GDP by State and Kind of Economic Activity, 2009 at Constant 2005 Prices - RM Million
50,063 66,386 152,150 19,270 335,027 6,989 629,885
KDNK mengikut Negeri dan Jenis Aktiviti Ekonomi, 2009 pada Harga Malar 2005 - Perubahan Peratusan Tahunan
GDP by State and Kind of Economic Activity, 2009 at Constant 2005 Prices - Annual Percentage Change
0.1 -6.5 -9.0 6.2 2.9 -7.1 -1.5

KDNK NEGERI 2013 18
Jenis Aktiviti Ekonomi Pertanian Perlombongan
dan Pengkuarian
Pembuatan Pembinaan Perkhidmatan campur :
Duti Import
KDNK pada
Harga Pembeli
Kind of Economic Activity Agriculture Mining and
Quarrying
Manufacturing Construction Services plus :
Import Duties
GDP at
Purchasers' Prices
1. Johor 14.9 0.1 11.6 9.4 8.2 11.0 8.8
2. Kedah 5.5 0.0 4.2 2.8 3.3 2.0 3.3
3. Kelantan 5.9 0.0 0.4 1.0 2.3 0.3 1.8
4. Melaka 2.9 0.0 5.3 2.9 2.5 0.4 2.9
5. Negeri Sembilan 3.9 0.0 7.7 2.8 2.8 1.4 3.8
6. Pahang 10.9 0.2 4.4 3.6 3.9 1.2 4.2
7. Pulau Pinang 1.5 0.0 14.0 5.1 6.0 5.5 6.9
8. Perak 10.4 0.2 3.8 3.3 6.3 0.2 5.2
9. Perlis 1.7 0.0 0.2 0.5 0.5 1.2 0.5
10. Selangor 5.0 0.2 27.5 34.2 25.1 56.0 22.1
11. Terengganu 3.0 0.0 4.5 3.2 2.6 0.2 2.8
12. Sabah 19.4 14.5 2.1 4.6 5.2 3.4 6.5
13. Sarawak 14.8 22.9 11.5 8.9 6.6 4.1 10.2
14. WP Kuala Lumpur - 0.0 2.5 17.7 24.0 12.2 14.00.0
15. WP Labuan 0.2 .. 0.4 0.1 0.5 0.8 0.4
16. Supra1
.. 61.8 .. .. .. .. 6.5
KDNK pada Harga Pembeli
GDP at Purchasers' Prices
JADUAL
TABLE 16 KDNK mengikut Negeri dan Jenis Aktiviti Ekonomi, 2009 pada Harga Malar 2005 - Pembahagian Peratus KDNK
GDP by State and Kind of Economic Activity, 2009 at Constant 2005 Prices - Percentage Share of GDP
100.0 100.0100.0 100.0 100.0 100.0 100.0
KDNK NEGERI 2013 19
Jenis Aktiviti Ekonomi Pertanian Perlombongan
dan Pengkuarian
Pembuatan Pembinaan Perkhidmatan campur :
Duti Import
KDNK pada
Harga Pembeli
Kind of Economic Activity Agriculture Mining and
Quarrying
Manufacturing Construction Services plus :
Import Duties
GDP at
Purchasers' Prices
1. Johor 7,598 68 21,037 2,045 29,236 694 60,679
2. Kedah 2,734 19 6,638 541 11,936 130 21,998
3. Kelantan 3,071 16 691 207 7,985 21 11,991
4. Melaka 1,794 8 8,441 570 8,868 8 19,689
5. Negeri Sembilan 2,016 21 12,289 583 10,040 229 25,177
6. Pahang 5,673 179 6,899 782 13,941 10 27,484
7. Pulau Pinang 889 19 24,264 1,022 21,688 279 48,161
8. Perak 5,241 112 6,549 717 21,941 15 34,576
9. Perlis 890 6 302 109 1,937 73 3,318
10. Selangor 2,707 127 50,189 7,248 90,800 4,668 155,739
11. Terengganu 1,502 14 7,215 648 9,094 13 18,487
12. Sabah 9,333 9,981 3,296 1,048 18,249 193 42,101
13. Sarawak 7,695 15,757 18,117 1,877 23,201 301 66,947
14. WP Kuala Lumpura
27 3,757 4,039 88,999 1,006 97,830 1
15. WP Labuan 118 .. 576 21 1,913 19 2,646
16. Supra1
.. 39,827 .. .. .. .. 39,827
Jumlah KDNK pada Harga Pembeli
Total GDP at Purchasers' Prices
Jenis Aktiviti Ekonomi Pertanian Perlombongan
dan Pengkuarian
Pembuatan Pembinaan Perkhidmatan campur :
Duti Import
KDNK pada
Harga Pembeli
Kind of Economic Activity Agriculture Mining and
Quarrying
Manufacturing Construction Services plus :
Import Duties
GDP at
Purchasers' Prices
1. Johor 2.0 15.0 19.2 12.6 6.2 -9.6 9.8
2. Kedah -0.9 1.1 3.5 0.6 6.4 -8.4 4.3
3. Kelantan 4.4 5.8 21.2 6.5 3.8 -6.4 4.9
4. Melaka 23.7 0.4 5.6 3.1 5.1 -73.3 6.6
5. Negeri Sembilan 3.9 4.2 4.5 8.0 6.3 126.5 5.8
6. Pahang 4.1 48.2 3.1 12.4 5.9 -87.2 4.9
7. Pulau Pinang 16.9 -0.5 14.2 4.1 7.1 -27.1 10.4
8. Perak 0.9 9.6 12.9 11.5 4.8 -10.5 5.7
9. Perlis 4.0 -0.1 4.1 17.8 5.2 -9.0 4.8
10. Selangor 7.5 1.9 19.9 10.1 7.8 19.2 11.9
11. Terengganu 0.4 27.0 4.3 6.3 4.9 10.7 4.3
12. Sabah -3.9 3.6 4.7 19.1 5.1 -18.5 2.7
13. Sarawak 3.7 3.7 3.6 9.9 5.1 4.4 4.3
14. WP Kuala Lumpur - 0.9 -0.1 18.4 10.7 17.5 10.6-21.1
15. WP Labuan 8.0 .. 1.4 6.3 10.2 -64.6 6.4
16. Supra1 .. -2.9 .. .. .. .. -2.9
KDNK pada Harga Pembeli
GDP at Purchasers' Prices
JADUAL
TABLE
JADUAL
TABLE
17
18
KDNK mengikut Negeri dan Jenis Aktiviti Ekonomi, 2010 pada Harga Malar 2005 - RM Juta
GDP by State and Kind of Economic Activity, 2010 at Constant 2005 Prices - RM Million
51,263 66,182 170,261 21,459 359,829 7,660 676,653
KDNK mengikut Negeri dan Jenis Aktiviti Ekonomi, 2010 pada Harga Malar 2005 - Perubahan Peratusan Tahunan
GDP by State and Kind of Economic Activity, 2010 at Constant 2005 Prices - Annual Percentage Change
2.4 -0.3 11.9 11.4 7.4 9.6 7.4

KDNK NEGERI 2013 20
Jenis Aktiviti Ekonomi Pertanian Perlombongan
dan Pengkuarian
Pembuatan Pembinaan Perkhidmatan campur :
Duti Import
KDNK pada
Harga Pembeli
Kind of Economic Activity Agriculture Mining and
Quarrying
Manufacturing Construction Services plus :
Import Duties
GDP at
Purchasers' Prices
1. Johor 14.8 0.1 12.4 9.5 8.1 9.1 9.0
2. Kedah 5.3 0.0 3.9 2.5 3.3 1.7 3.3
3. Kelantan 6.0 0.0 0.4 1.0 2.2 0.3 1.8
4. Melaka 3.5 0.0 5.0 2.7 2.5 0.1 2.9
5. Negeri Sembilan 3.9 0.0 7.2 2.7 2.8 3.0 3.7
6. Pahang 11.1 0.3 4.1 3.6 3.9 0.1 4.1
7. Pulau Pinang 1.7 0.0 14.3 4.8 6.0 3.6 7.1
8. Perak 10.2 0.2 3.8 3.3 6.1 0.2 5.1
9. Perlis 1.7 0.0 0.2 0.5 0.5 1.0 0.5
10. Selangor 5.3 0.2 29.5 33.8 25.2 60.9 23.0
11. Terengganu 2.9 0.0 4.2 3.0 2.5 0.2 2.7
12. Sabah 18.2 15.1 1.9 4.9 5.1 2.5 6.2
13. Sarawak 15.0 23.8 10.6 8.7 6.4 3.9 9.9
14. WP Kuala Lumpur - 0.0 2.2 18.8 24.7 13.1 14.50.0
15. WP Labuan 0.2 .. 0.3 0.1 0.5 0.2 0.4
16. Supra1
.. 60.2 .. .. .. .. 5.9
KDNK pada Harga Pembeli
GDP at Purchasers' Prices
JADUAL
TABLE 19 KDNK mengikut Negeri dan Jenis Aktiviti Ekonomi, 2010 pada Harga Malar 2005 - Pembahagian Peratus KDNK
GDP by State and Kind of Economic Activity, 2010 at Constant 2005 Prices - Percentage Share of GDP
100.0 100.0100.0 100.0 100.0 100.0 100.0

KDNK NEGERI 2013 21
Jenis Aktiviti Ekonomi Pertanian Perlombongan
dan Pengkuarian
Pembuatan Pembinaan Perkhidmatan campur :
Duti Import
KDNK pada
Harga Pembeli
Kind of Economic Activity Agriculture Mining and
Quarrying
Manufacturing Construction Services plus :
Import Duties
GDP at
Purchasers' Prices
1. Johor 8,135 71 21,995 2,029 31,642 720 64,592
2. Kedah 2,961 20 7,352 545 12,830 129 23,837
3. Kelantan 3,250 18 720 205 8,563 23 12,780
4. Melaka 1,904 9 8,527 579 9,448 8 20,474
5. Negeri Sembilan 2,126 21 12,895 612 10,586 173 26,414
6. Pahang 6,117 198 7,260 761 14,857 8 29,201
7. Pulau Pinang 944 20 24,567 1,074 23,107 340 50,053
8. Perak 5,627 120 7,268 721 23,247 18 37,001
9. Perlis 828 7 341 105 2,054 51 3,386
10. Selangor 2,767 132 52,570 7,881 96,133 5,268 164,751
11. Terengganu 1,552 16 7,150 630 9,612 19 18,980
12. Sabah 9,763 8,339 3,486 1,127 19,777 189 42,680
13. Sarawak 8,157 16,469 19,237 1,853 24,866 268 70,849
14. WP Kuala Lumpura
29 4,191 4,320 96,657 1,417 106,615 1
15. WP Labuan 117 .. 676 22 2,170 22 3,007
16. Supra1
.. 37,139 .. .. .. .. 37,139
Jumlah KDNK pada Harga Pembeli
Total GDP at Purchasers' Prices
Jenis Aktiviti Ekonomi Pertanian Perlombongan
dan Pengkuarian
Pembuatan Pembinaan Perkhidmatan campur :
Duti Import
KDNK pada
Harga Pembeli
Kind of Economic Activity Agriculture Mining and
Quarrying
Manufacturing Construction Services plus :
Import Duties
GDP at
Purchasers' Prices
1. Johor 7.1 3.5 4.6 -0.8 8.2 3.8 6.4
2. Kedah 8.3 6.4 10.8 0.7 7.5 -0.2 8.4
3. Kelantan 5.8 6.8 4.2 -0.9 7.2 10.7 6.6
4. Melaka 6.1 5.8 1.0 1.5 6.5 8.0 4.0
5. Negeri Sembilan 5.5 3.0 4.9 4.9 5.4 -24.4 4.9
6. Pahang 7.8 10.8 5.2 -2.7 6.6 -22.6 6.2
7. Pulau Pinang 6.2 6.7 1.3 5.1 6.5 22.0 3.9
8. Perak 7.4 7.8 11.0 0.6 6.0 14.2 7.0
9. Perlis -7.0 7.7 13.0 -3.8 6.0 -30.0 2.0
10. Selangor 2.2 3.5 4.7 8.7 5.9 12.9 5.8
11. Terengganu 3.3 11.7 -0.9 -2.8 5.7 40.6 2.7
12. Sabah 4.6 -16.5 5.8 7.5 8.4 -2.3 1.4
13. Sarawak 6.0 4.5 6.2 -1.3 7.2 -11.1 5.8
14. WP Kuala Lumpur - 6.9 11.6 6.9 8.6 40.9 9.05.8
15. WP Labuan -0.6 .. 17.3 8.8 13.5 14.4 13.6
16. Supra1 .. -6.7 .. .. .. .. -6.7
KDNK pada Harga Pembeli
GDP at Purchasers' Prices
JADUAL
TABLE
JADUAL
TABLE
20
21
KDNK mengikut Negeri dan Jenis Aktiviti Ekonomi, 2011 pada Harga Malar 2005 - RM Juta
GDP by State and Kind of Economic Activity, 2011 at Constant 2005 Prices - RM Million
54,250 62,607 178,237 22,464 385,550 8,653 711,760
KDNK mengikut Negeri dan Jenis Aktiviti Ekonomi, 2011 pada Harga Malar 2005 - Perubahan Peratusan Tahunan
GDP by State and Kind of Economic Activity, 2011 at Constant 2005 Prices - Annual Percentage Change
5.8 -5.4 4.7 4.7 7.1 13.0 5.2

KDNK NEGERI 2013 22
Jenis Aktiviti Ekonomi Pertanian Perlombongan
dan Pengkuarian
Pembuatan Pembinaan Perkhidmatan campur :
Duti Import
KDNK pada
Harga Pembeli
Kind of Economic Activity Agriculture Mining and
Quarrying
Manufacturing Construction Services plus :
Import Duties
GDP at
Purchasers' Prices
1. Johor 15.0 0.1 12.3 9.0 8.2 8.3 9.1
2. Kedah 5.5 0.0 4.1 2.4 3.3 1.5 3.3
3. Kelantan 6.0 0.0 0.4 0.9 2.2 0.3 1.8
4. Melaka 3.5 0.0 4.8 2.6 2.5 0.1 2.9
5. Negeri Sembilan 3.9 0.0 7.2 2.7 2.7 2.0 3.7
6. Pahang 11.3 0.3 4.1 3.4 3.9 0.1 4.1
7. Pulau Pinang 1.7 0.0 13.8 4.8 6.0 3.9 7.0
8. Perak 10.4 0.2 4.1 3.2 6.0 0.2 5.2
9. Perlis 1.5 0.0 0.2 0.5 0.5 0.6 0.5
10. Selangor 5.1 0.2 29.5 35.1 24.9 60.9 23.1
11. Terengganu 2.9 0.0 4.0 2.8 2.5 0.2 2.7
12. Sabah 18.0 13.3 2.0 5.0 5.1 2.2 6.0
13. Sarawak 15.0 26.3 10.8 8.2 6.4 3.1 10.0
14. WP Kuala Lumpur - 0.0 2.4 19.2 25.1 16.4 15.00.0
15. WP Labuan 0.2 .. 0.4 0.1 0.6 0.3 0.4
16. Supra1
.. 59.3 .. .. .. .. 5.2
KDNK pada Harga Pembeli
GDP at Purchasers' Prices
JADUAL
TABLE 22 KDNK mengikut Negeri dan Jenis Aktiviti Ekonomi, 2011 pada Harga Malar 2005 - Pembahagian Peratus KDNK
GDP by State and Kind of Economic Activity, 2011 at Constant 2005 Prices - Percentage Share of GDP
100.0 100.0100.0 100.0 100.0 100.0 100.0
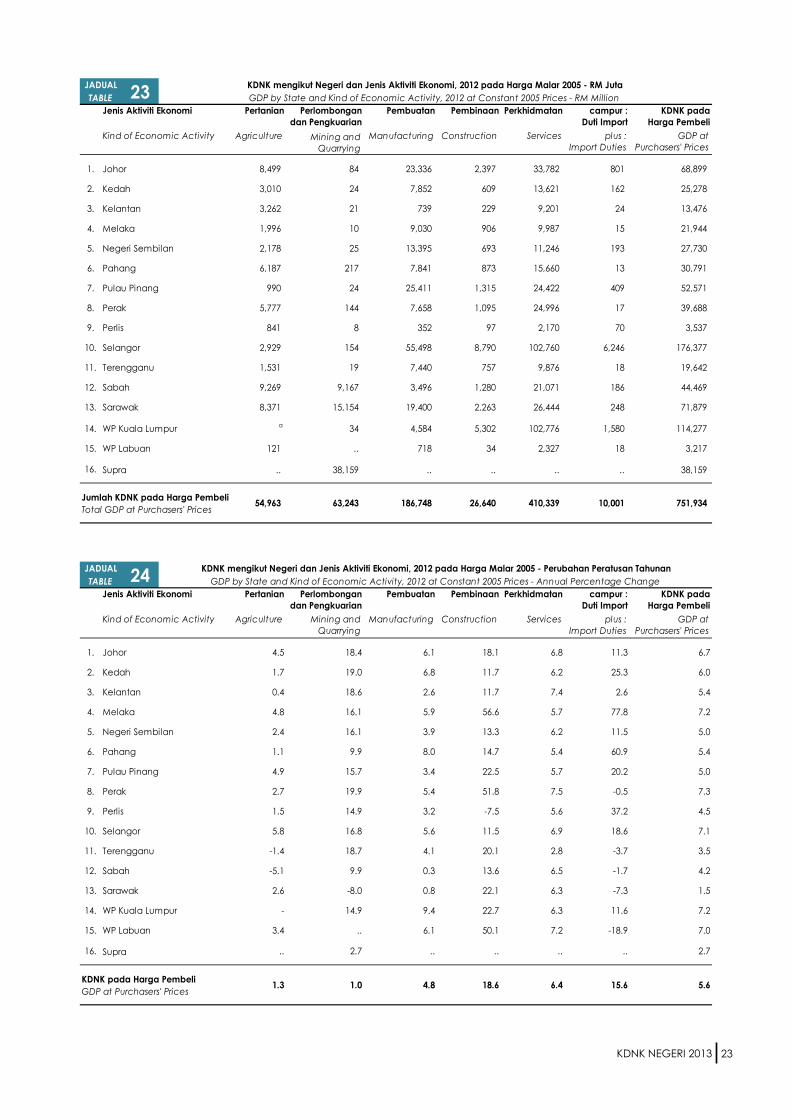
KDNK NEGERI 2013 23
Jenis Aktiviti Ekonomi Pertanian Perlombongan
dan Pengkuarian
Pembuatan Pembinaan Perkhidmatan campur :
Duti Import
KDNK pada
Harga Pembeli
Kind of Economic Activity Agriculture Mining and
Quarrying
Manufacturing Construction Services plus :
Import Duties
GDP at
Purchasers' Prices
1. Johor 8,499 84 23,336 2,397 33,782 801 68,899
2. Kedah 3,010 24 7,852 609 13,621 162 25,278
3. Kelantan 3,262 21 739 229 9,201 24 13,476
4. Melaka 1,996 10 9,030 906 9,987 15 21,944
5. Negeri Sembilan 2,178 25 13,395 693 11,246 193 27,730
6. Pahang 6,187 217 7,841 873 15,660 13 30,791
7. Pulau Pinang 990 24 25,411 1,315 24,422 409 52,571
8. Perak 5,777 144 7,658 1,095 24,996 17 39,688
9. Perlis 841 8 352 97 2,170 70 3,537
10. Selangor 2,929 154 55,498 8,790 102,760 6,246 176,377
11. Terengganu 1,531 19 7,440 757 9,876 18 19,642
12. Sabah 9,269 9,167 3,496 1,280 21,071 186 44,469
13. Sarawak 8,371 15,154 19,400 2,263 26,444 248 71,879
14. WP Kuala Lumpura
34 4,584 5,302 102,776 1,580 114,277 1
15. WP Labuan 121 .. 718 34 2,327 18 3,217
16. Supra1
.. 38,159 .. .. .. .. 38,159
Jumlah KDNK pada Harga Pembeli
Total GDP at Purchasers' Prices
Jenis Aktiviti Ekonomi Pertanian Perlombongan
dan Pengkuarian
Pembuatan Pembinaan Perkhidmatan campur :
Duti Import
KDNK pada
Harga Pembeli
Kind of Economic Activity Agriculture Mining and
Quarrying
Manufacturing Construction Services plus :
Import Duties
GDP at
Purchasers' Prices
1. Johor 4.5 18.4 6.1 18.1 6.8 11.3 6.7
2. Kedah 1.7 19.0 6.8 11.7 6.2 25.3 6.0
3. Kelantan 0.4 18.6 2.6 11.7 7.4 2.6 5.4
4. Melaka 4.8 16.1 5.9 56.6 5.7 77.8 7.2
5. Negeri Sembilan 2.4 16.1 3.9 13.3 6.2 11.5 5.0
6. Pahang 1.1 9.9 8.0 14.7 5.4 60.9 5.4
7. Pulau Pinang 4.9 15.7 3.4 22.5 5.7 20.2 5.0
8. Perak 2.7 19.9 5.4 51.8 7.5 -0.5 7.3
9. Perlis 1.5 14.9 3.2 -7.5 5.6 37.2 4.5
10. Selangor 5.8 16.8 5.6 11.5 6.9 18.6 7.1
11. Terengganu -1.4 18.7 4.1 20.1 2.8 -3.7 3.5
12. Sabah -5.1 9.9 0.3 13.6 6.5 -1.7 4.2
13. Sarawak 2.6 -8.0 0.8 22.1 6.3 -7.3 1.5
14. WP Kuala Lumpur - 14.9 9.4 22.7 6.3 11.6 7.27.6
15. WP Labuan 3.4 .. 6.1 50.1 7.2 -18.9 7.0
16. Supra1 .. 2.7 .. .. .. .. 2.7
KDNK pada Harga Pembeli
GDP at Purchasers' Prices
JADUAL
TABLE
JADUAL
TABLE 23
24
KDNK mengikut Negeri dan Jenis Aktiviti Ekonomi, 2012 pada Harga Malar 2005 - RM Juta
GDP by State and Kind of Economic Activity, 2012 at Constant 2005 Prices - RM Million
54,963 63,243 186,748 26,640 410,339 10,001 751,934
KDNK mengikut Negeri dan Jenis Aktiviti Ekonomi, 2012 pada Harga Malar 2005 - Perubahan Peratusan Tahunan
GDP by State and Kind of Economic Activity, 2012 at Constant 2005 Prices - Annual Percentage Change
1.3 1.0 4.8 18.6 6.4 15.6 5.6
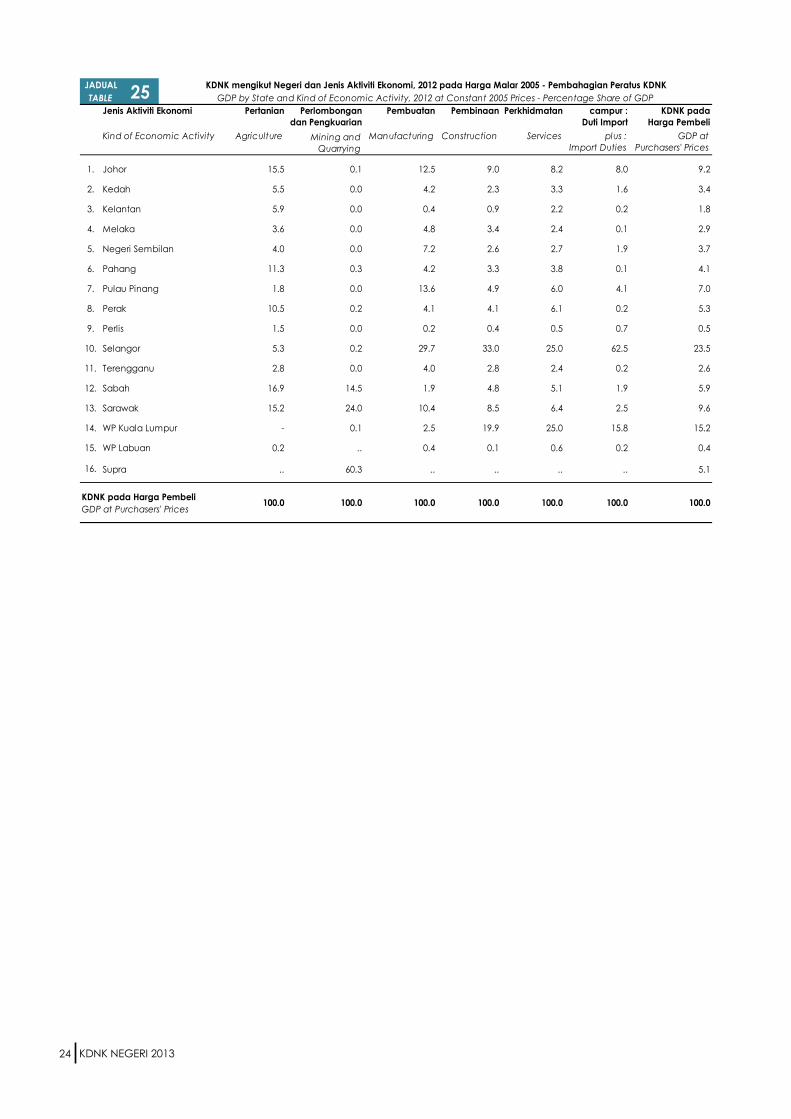
KDNK NEGERI 2013 24
Jenis Aktiviti Ekonomi Pertanian Perlombongan
dan Pengkuarian
Pembuatan Pembinaan Perkhidmatan campur :
Duti Import
KDNK pada
Harga Pembeli
Kind of Economic Activity Agriculture Mining and
Quarrying
Manufacturing Construction Services plus :
Import Duties
GDP at
Purchasers' Prices
1. Johor 15.5 0.1 12.5 9.0 8.2 8.0 9.2
2. Kedah 5.5 0.0 4.2 2.3 3.3 1.6 3.4
3. Kelantan 5.9 0.0 0.4 0.9 2.2 0.2 1.8
4. Melaka 3.6 0.0 4.8 3.4 2.4 0.1 2.9
5. Negeri Sembilan 4.0 0.0 7.2 2.6 2.7 1.9 3.7
6. Pahang 11.3 0.3 4.2 3.3 3.8 0.1 4.1
7. Pulau Pinang 1.8 0.0 13.6 4.9 6.0 4.1 7.0
8. Perak 10.5 0.2 4.1 4.1 6.1 0.2 5.3
9. Perlis 1.5 0.0 0.2 0.4 0.5 0.7 0.5
10. Selangor 5.3 0.2 29.7 33.0 25.0 62.5 23.5
11. Terengganu 2.8 0.0 4.0 2.8 2.4 0.2 2.6
12. Sabah 16.9 14.5 1.9 4.8 5.1 1.9 5.9
13. Sarawak 15.2 24.0 10.4 8.5 6.4 2.5 9.6
14. WP Kuala Lumpur - 0.1 2.5 19.9 25.0 15.8 15.20.0
15. WP Labuan 0.2 .. 0.4 0.1 0.6 0.2 0.4
16. Supra1
.. 60.3 .. .. .. .. 5.1
KDNK pada Harga Pembeli
GDP at Purchasers' Prices
JADUAL
TABLE 25 KDNK mengikut Negeri dan Jenis Aktiviti Ekonomi, 2012 pada Harga Malar 2005 - Pembahagian Peratus KDNK
GDP by State and Kind of Economic Activity, 2012 at Constant 2005 Prices - Percentage Share of GDP
100.0 100.0100.0 100.0 100.0 100.0 100.0
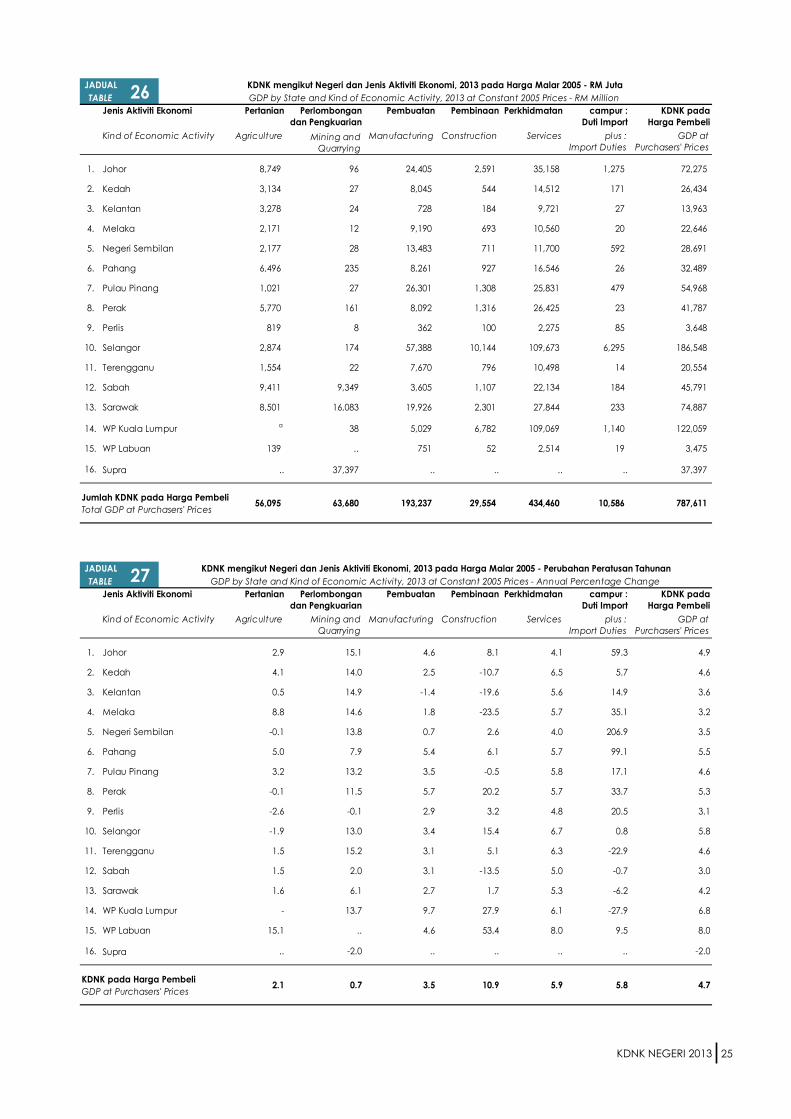
KDNK NEGERI 2013 25
Jenis Aktiviti Ekonomi Pertanian Perlombongan
dan Pengkuarian
Pembuatan Pembinaan Perkhidmatan campur :
Duti Import
KDNK pada
Harga Pembeli
Kind of Economic Activity Agriculture Mining and
Quarrying
Manufacturing Construction Services plus :
Import Duties
GDP at
Purchasers' Prices
1. Johor 8,749 96 24,405 2,591 35,158 1,275 72,275
2. Kedah 3,134 27 8,045 544 14,512 171 26,434
3. Kelantan 3,278 24 728 184 9,721 27 13,963
4. Melaka 2,171 12 9,190 693 10,560 20 22,646
5. Negeri Sembilan 2,177 28 13,483 711 11,700 592 28,691
6. Pahang 6,496 235 8,261 927 16,546 26 32,489
7. Pulau Pinang 1,021 27 26,301 1,308 25,831 479 54,968
8. Perak 5,770 161 8,092 1,316 26,425 23 41,787
9. Perlis 819 8 362 100 2,275 85 3,648
10. Selangor 2,874 174 57,388 10,144 109,673 6,295 186,548
11. Terengganu 1,554 22 7,670 796 10,498 14 20,554
12. Sabah 9,411 9,349 3,605 1,107 22,134 184 45,791
13. Sarawak 8,501 16,083 19,926 2,301 27,844 233 74,887
14. WP Kuala Lumpura
38 5,029 6,782 109,069 1,140 122,059 1
15. WP Labuan 139 .. 751 52 2,514 19 3,475
16. Supra1
.. 37,397 .. .. .. .. 37,397
Jumlah KDNK pada Harga Pembeli
Total GDP at Purchasers' Prices
Jenis Aktiviti Ekonomi Pertanian Perlombongan
dan Pengkuarian
Pembuatan Pembinaan Perkhidmatan campur :
Duti Import
KDNK pada
Harga Pembeli
Kind of Economic Activity Agriculture Mining and
Quarrying
Manufacturing Construction Services plus :
Import Duties
GDP at
Purchasers' Prices
1. Johor 2.9 15.1 4.6 8.1 4.1 59.3 4.9
2. Kedah 4.1 14.0 2.5 -10.7 6.5 5.7 4.6
3. Kelantan 0.5 14.9 -1.4 -19.6 5.6 14.9 3.6
4. Melaka 8.8 14.6 1.8 -23.5 5.7 35.1 3.2
5. Negeri Sembilan -0.1 13.8 0.7 2.6 4.0 206.9 3.5
6. Pahang 5.0 7.9 5.4 6.1 5.7 99.1 5.5
7. Pulau Pinang 3.2 13.2 3.5 -0.5 5.8 17.1 4.6
8. Perak -0.1 11.5 5.7 20.2 5.7 33.7 5.3
9. Perlis -2.6 -0.1 2.9 3.2 4.8 20.5 3.1
10. Selangor -1.9 13.0 3.4 15.4 6.7 0.8 5.8
11. Terengganu 1.5 15.2 3.1 5.1 6.3 -22.9 4.6
12. Sabah 1.5 2.0 3.1 -13.5 5.0 -0.7 3.0
13. Sarawak 1.6 6.1 2.7 1.7 5.3 -6.2 4.2
14. WP Kuala Lumpur - 13.7 9.7 27.9 6.1 -27.9 6.88.5
15. WP Labuan 15.1 .. 4.6 53.4 8.0 9.5 8.0
16. Supra1 .. -2.0 .. .. .. .. -2.0
KDNK pada Harga Pembeli
GDP at Purchasers' Prices4.72.1 0.7 3.5 10.9 5.9 5.8
10,586 787,611
JADUAL27
KDNK mengikut Negeri dan Jenis Aktiviti Ekonomi, 2013 pada Harga Malar 2005 - Perubahan Peratusan Tahunan
TABLE GDP by State and Kind of Economic Activity, 2013 at Constant 2005 Prices - Annual Percentage Change
56,095 63,680 193,237 29,554 434,460
JADUAL26
KDNK mengikut Negeri dan Jenis Aktiviti Ekonomi, 2013 pada Harga Malar 2005 - RM Juta
TABLE GDP by State and Kind of Economic Activity, 2013 at Constant 2005 Prices - RM Million

KDNK NEGERI 2013 26
Jenis Aktiviti Ekonomi Pertanian Perlombongan
dan Pengkuarian
Pembuatan Pembinaan Perkhidmatan campur :
Duti Import
KDNK pada
Harga Pembeli
Kind of Economic Activity Agriculture Mining and
Quarrying
Manufacturing Construction Services plus :
Import Duties
GDP at
Purchasers' Prices
1. Johor 15.6 0.2 12.6 8.8 8.1 12.0 9.2
2. Kedah 5.6 0.0 4.2 1.8 3.3 1.6 3.4
3. Kelantan 5.8 0.0 0.4 0.6 2.2 0.3 1.8
4. Melaka 3.9 0.0 4.8 2.3 2.4 0.2 2.9
5. Negeri Sembilan 3.9 0.0 7.0 2.4 2.7 5.6 3.6
6. Pahang 11.6 0.4 4.3 3.1 3.8 0.2 4.1
7. Pulau Pinang 1.8 0.0 13.6 4.4 5.9 4.5 7.0
8. Perak 10.3 0.3 4.2 4.5 6.1 0.2 5.3
9. Perlis 1.5 0.0 0.2 0.3 0.5 0.8 0.5
10. Selangor 5.1 0.3 29.7 34.3 25.2 59.5 23.7
11. Terengganu 2.8 0.0 4.0 2.7 2.4 0.1 2.6
12. Sabah 16.8 14.7 1.9 3.7 5.1 1.7 5.8
13. Sarawak 15.2 25.3 10.3 7.8 6.4 2.2 9.5
14. WP Kuala Lumpur - 0.1 2.6 22.9 25.1 10.8 15.50.0
15. WP Labuan 0.2 .. 0.4 0.2 0.6 0.2 0.4
16. Supra1
.. 58.7 .. .. .. .. 4.7
KDNK pada Harga Pembeli
GDP at Purchasers' Prices100.0 100.0
JADUAL28
KDNK mengikut Negeri dan Jenis Aktiviti Ekonomi, 2013 pada Harga Malar 2005 - Pembahagian Peratus KDNK
TABLE GDP by State and Kind of Economic Activity, 2013 at Constant 2005 Prices - Percentage Share of GDP
100.0 100.0 100.0 100.0 100.0
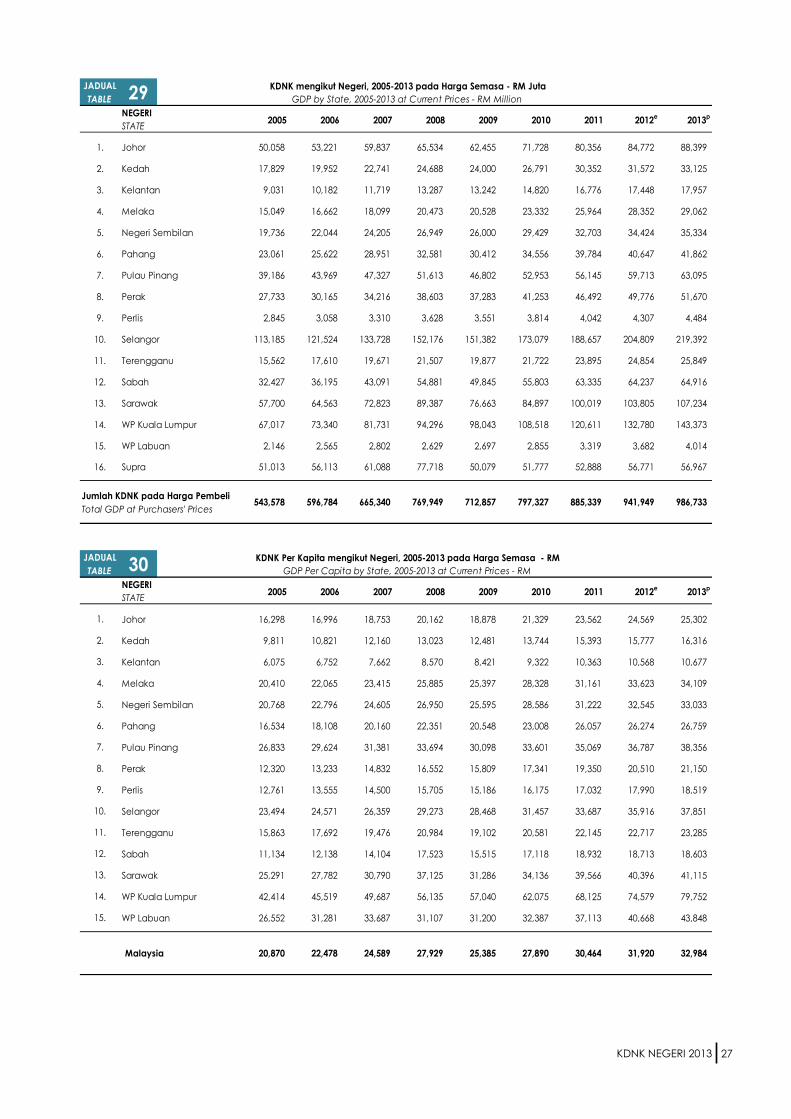
KDNK NEGERI 2013 27
JADUAL
TABLE
NEGERI
STATE
1. Johor 50,058 53,221 59,837 65,534 62,455 71,728 80,356 84,772 88,399
2. Kedah 17,829 19,952 22,741 24,688 24,000 26,791 30,352 31,572 33,125
3. Kelantan 9,031 10,182 11,719 13,287 13,242 14,820 16,776 17,448 17,957
4. Melaka 15,049 16,662 18,099 20,473 20,528 23,332 25,964 28,352 29,062
5. Negeri Sembilan 19,736 22,044 24,205 26,949 26,000 29,429 32,703 34,424 35,334
6. Pahang 23,061 25,622 28,951 32,581 30,412 34,556 39,784 40,647 41,862
7. Pulau Pinang 39,186 43,969 47,327 51,613 46,802 52,953 56,145 59,713 63,095
8. Perak 27,733 30,165 34,216 38,603 37,283 41,253 46,492 49,776 51,670
9. Perlis 2,845 3,058 3,310 3,628 3,551 3,814 4,042 4,307 4,484
10. Selangor 113,185 121,524 133,728 152,176 151,382 173,079 188,657 204,809 219,392
11. Terengganu 15,562 17,610 19,671 21,507 19,877 21,722 23,895 24,854 25,849
12. Sabah 32,427 36,195 43,091 54,881 49,845 55,803 63,335 64,237 64,916
13. Sarawak 57,700 64,563 72,823 89,387 76,663 84,897 100,019 103,805 107,234
14. WP Kuala Lumpur 67,017 73,340 81,731 94,296 98,043 108,518 120,611 132,780 143,373
15. WP Labuan 2,146 2,565 2,802 2,629 2,697 2,855 3,319 3,682 4,014
16. Supra 51,013 56,113 61,088 77,718 50,079 51,777 52,888 56,771 56,967
Jumlah KDNK pada Harga Pembeli
Total GDP at Purchasers' Prices
JADUAL
TABLE
NEGERI
STATE
1. Johor 16,298 16,996 18,753 20,162 18,878 21,329 23,562 24,569 25,302
2. Kedah 9,811 10,821 12,160 13,023 12,481 13,744 15,393 15,777 16,316
3. Kelantan 6,075 6,752 7,662 8,570 8,421 9,322 10,363 10,568 10,677
4. Melaka 20,410 22,065 23,415 25,885 25,397 28,328 31,161 33,623 34,109
5. Negeri Sembilan 20,768 22,796 24,605 26,950 25,595 28,586 31,222 32,545 33,033
6. Pahang 16,534 18,108 20,160 22,351 20,548 23,008 26,057 26,274 26,759
7. Pulau Pinang 26,833 29,624 31,381 33,694 30,098 33,601 35,069 36,787 38,356
8. Perak 12,320 13,233 14,832 16,552 15,809 17,341 19,350 20,510 21,150
9. Perlis 12,761 13,555 14,500 15,705 15,186 16,175 17,032 17,990 18,519
10. Selangor 23,494 24,571 26,359 29,273 28,468 31,457 33,687 35,916 37,851
11. Terengganu 15,863 17,692 19,476 20,984 19,102 20,581 22,145 22,717 23,285
12. Sabah 11,134 12,138 14,104 17,523 15,515 17,118 18,932 18,713 18,603
13. Sarawak 25,291 27,782 30,790 37,125 31,286 34,136 39,566 40,396 41,115
14. WP Kuala Lumpur 42,414 45,519 49,687 56,135 57,040 62,075 68,125 74,579 79,752
15. WP Labuan 26,552 31,281 33,687 31,107 31,200 32,387 37,113 40,668 43,848
Malaysia
2013p
986,733
2013p
32,984
2009f
2010f
2011f
2012e
31,920 30,464 27,890 25,385
2011f
2012e
797,327
29
30
2005f
2006f
2007f
KDNK mengikut Negeri, 2005-2013 pada Harga Semasa - RM Juta
GDP by State, 2005-2013 at Current Prices - RM Million
2008f
941,949
KDNK Per Kapita mengikut Negeri, 2005-2013 pada Harga Semasa - RM
GDP Per Capita by State, 2005-2013 at Current Prices - RM
543,578 596,784 665,340 769,949 712,857
2005f
27,929 24,589 22,478 20,870
885,339
2006f
2007f
2008f
2009f
2010f
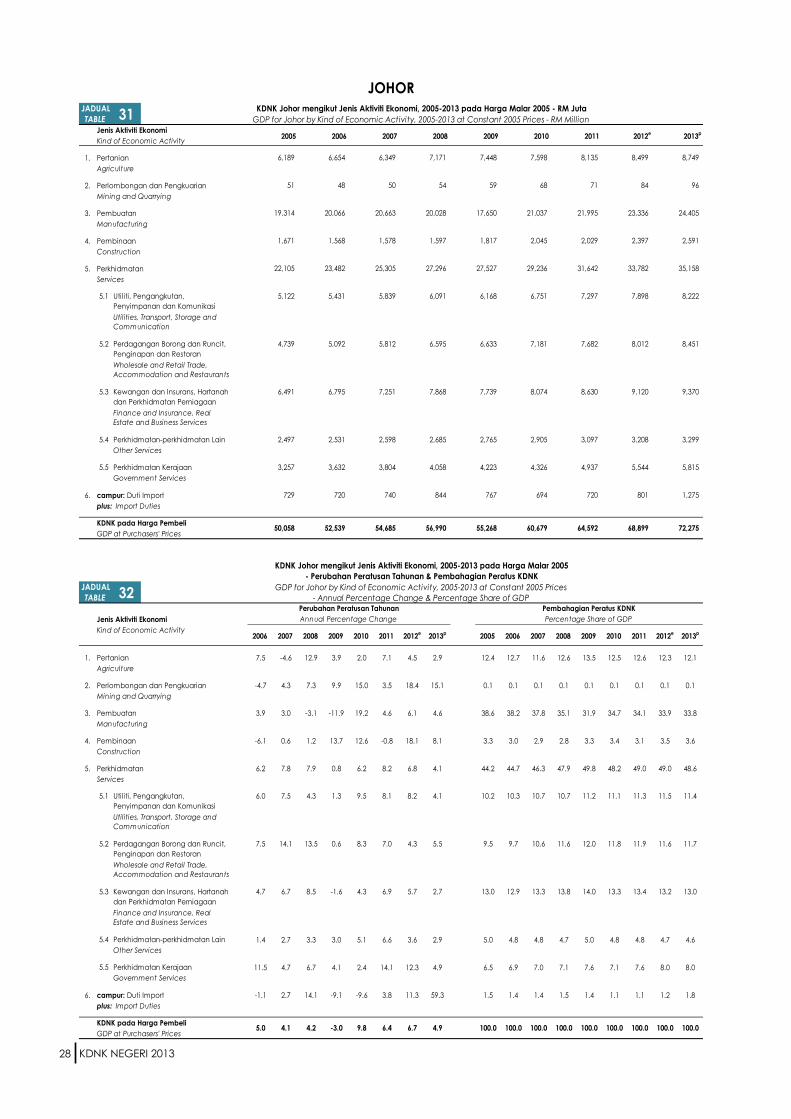
KDNK NEGERI 2013 28
Jenis Aktiviti Ekonomi
Kind of Economic Activity
1. Pertanian
Agriculture
2. Perlombongan dan Pengkuarian
Mining and Quarrying
3. Pembuatan
Manufacturing
4. Pembinaan
Construction
5. Perkhidmatan
Services
5.1
5.2
5.3
5.4
5.5
6. campur: Duti Import
plus: Import Duties
KDNK pada Harga Pembeli
GDP at Purchasers' Prices
Jenis Aktiviti Ekonomi
Kind of Economic Activity
1. Pertanian 7.5 -4.6 12.9 3.9 2.0 7.1 4.5 2.9 12.4 12.7 11.6 12.6 13.5 12.5 12.6 12.3 12.1
Agriculture
2. Perlombongan dan Pengkuarian -4.7 4.3 7.3 9.9 15.0 3.5 18.4 15.1 0.1 0.1 0.1 0.1 0.1 0.1 0.1 0.1 0.1
Mining and Quarrying
3. Pembuatan 3.9 3.0 -3.1 -11.9 19.2 4.6 6.1 4.6 38.6 38.2 37.8 35.1 31.9 34.7 34.1 33.9 33.8
Manufacturing
4. Pembinaan -6.1 0.6 1.2 13.7 12.6 -0.8 18.1 8.1 3.3 3.0 2.9 2.8 3.3 3.4 3.1 3.5 3.6
Construction
5. Perkhidmatan 6.2 7.8 7.9 0.8 6.2 8.2 6.8 4.1 44.2 44.7 46.3 47.9 49.8 48.2 49.0 49.0 48.6
Services
5.1 6.0 7.5 4.3 1.3 9.5 8.1 8.2 4.1 10.2 10.3 10.7 10.7 11.2 11.1 11.3 11.5 11.4
5.2 7.5 14.1 13.5 0.6 8.3 7.0 4.3 5.5 9.5 9.7 10.6 11.6 12.0 11.8 11.9 11.6 11.7
5.3 4.7 6.7 8.5 -1.6 4.3 6.9 5.7 2.7 13.0 12.9 13.3 13.8 14.0 13.3 13.4 13.2 13.0
5.4 1.4 2.7 3.3 3.0 5.1 6.6 3.6 2.9 5.0 4.8 4.8 4.7 5.0 4.8 4.8 4.7 4.6
5.5 11.5 4.7 6.7 4.1 2.4 14.1 12.3 4.9 6.5 6.9 7.0 7.1 7.6 7.1 7.6 8.0 8.0
6. campur: Duti Import -1.1 2.7 14.1 -9.1 -9.6 3.8 11.3 59.3 1.5 1.4 1.4 1.5 1.4 1.1 1.1 1.2 1.8
plus: Import Duties
KDNK pada Harga Pembeli
GDP at Purchasers' Prices
1,275
2013p
4.9 100.0
801
5,544 4,937
3,208
9,120
Percentage Share of GDP
2010f
2009f
2008f
2007f
2006f
2005f
2013p
Perubahan Peratusan Tahunan
Annual Percentage Change
694 720
5.0 100.0100.0
2013p
55,268 60,679 64,592 68,899 72,275
7,448 7,598 8,135 8,499 8,749
59
17,650
1,817
27,527
6,168
6,633
7,739
2,765
4,223
767
68
21,037
2012e
100.0100.0100.0100.0100.0100.06.76.49.8-3.04.24.1
Government Services
Perkhidmatan Kerajaan
Other Services
Perkhidmatan-perkhidmatan Lain
Finance and Insurance, Real
Estate and Business Services
Kewangan dan Insurans, Hartanah
dan Perkhidmatan Perniagaan
Wholesale and Retail Trade,
Accommodation and Restaurants
Perdagangan Borong dan Runcit,
Penginapan dan Restoran
Utilities, Transport, Storage and
Communication
Utiliti, Pengangkutan,
Penyimpanan dan Komunikasi
2011f
JADUAL32
KDNK Johor mengikut Jenis Aktiviti Ekonomi, 2005-2013 pada Harga Malar 2005
TABLE
GDP for Johor by Kind of Economic Activity, 2005-2013 at Constant 2005 Prices
- Perubahan Peratusan Tahunan & Pembahagian Peratus KDNK
- Annual Percentage Change & Percentage Share of GDP
2012e
2011f
2010f
2009f
2008f
2007f
2006f
2012e
Pembahagian Peratus KDNK
JOHOR
56,990 54,685 52,539 50,058
720 740 844
3,632 3,804 4,058 4,326 5,815
2,531 2,598 2,685 2,905 3,299 3,097
6,795 7,251 7,868 8,074 9,370
5,092 5,812 6,595 7,181 8,451 8,012 7,682
8,630
5,431 5,839 6,091 6,751 8,222
23,482 25,305 27,296 35,158
7,898
33,782 31,642
7,297
29,236
1,568 1,578 1,597 2,045 2,591
20,066 20,663 20,028 23,336 24,405
2,397
21,995
2,029
48 50 54 84 96 71
5,122
19,314
729
2,497
3,257
4,739
6,491
22,105
Perkhidmatan Kerajaan
Government Services
2005f
Perdagangan Borong dan Runcit,
Penginapan dan Restoran
Wholesale and Retail Trade,
Accommodation and Restaurants
Kewangan dan Insurans, Hartanah
dan Perkhidmatan Perniagaan
Finance and Insurance, Real
Estate and Business Services
1,671
51
31JADUAL
TABLE
Utiliti, Pengangkutan,
Penyimpanan dan Komunikasi
Utilities, Transport, Storage and
Communication
Perkhidmatan-perkhidmatan Lain
Other Services
KDNK Johor mengikut Jenis Aktiviti Ekonomi, 2005-2013 pada Harga Malar 2005 - RM Juta
GDP for Johor by Kind of Economic Activity, 2005-2013 at Constant 2005 Prices - RM Million
6,189
2006f
2007f
2008f
2009f
2010f
2011f
6,654 6,349 7,171

KDNK NEGERI 2013 29
Jenis Aktiviti Ekonomi
Kind of Economic Activity
1. Pertanian
Agriculture
2. Perlombongan dan Pengkuarian
Mining and Quarrying
3. Pembuatan
Manufacturing
4. Pembinaan
Construction
5. Perkhidmatan
Services
5.1
5.2
5.3
5.4
5.5
6. campur: Duti Import
plus: Import Duties
KDNK pada Harga Pembeli
GDP at Purchasers' Prices
Jenis Aktiviti Ekonomi
Kind of Economic Activity
1. Pertanian 9.6 11.0 2.5 0.4 -0.9 8.3 1.7 4.1 12.4 12.6 12.7 13.0 13.1 12.4 12.4 11.9 11.9
Agriculture
2. Perlombongan dan Pengkuarian -1.6 9.2 1.1 2.1 1.1 6.4 19.0 14.0 0.1 0.1 0.1 0.1 0.1 0.1 0.1 0.1 0.1
Mining and Quarrying
3. Pembuatan 8.5 10.5 -9.9 -7.8 3.5 10.8 6.8 2.5 36.1 36.3 36.7 32.8 30.4 30.2 30.8 31.1 30.4
Manufacturing
4. Pembinaan -5.4 14.8 9.6 -5.9 0.6 0.7 11.7 -10.7 2.7 2.4 2.5 2.7 2.6 2.5 2.3 2.4 2.1
Construction
5. Perkhidmatan 7.8 7.8 8.1 4.1 6.4 7.5 6.2 6.5 48.1 48.0 47.4 50.8 53.2 54.3 53.8 53.9 54.9
Services
5.1 5.7 7.8 8.2 3.8 8.1 7.8 8.0 7.0 7.2 7.1 7.0 7.5 7.8 8.1 8.0 8.2 8.4
5.2 6.0 16.6 12.1 3.7 8.9 4.9 3.1 8.6 11.4 11.1 11.9 13.2 13.8 14.4 13.9 13.5 14.1
5.3 12.9 6.0 8.8 6.2 5.5 9.3 8.7 2.4 8.8 9.2 8.9 9.6 10.2 10.4 10.4 10.7 10.5
5.4 2.4 2.2 6.5 3.9 3.1 4.3 2.5 3.9 9.1 8.6 8.0 8.5 8.9 8.8 8.4 8.1 8.1
5.5 11.3 5.0 4.5 3.4 5.6 11.0 8.6 9.1 11.7 12.1 11.6 12.0 12.5 12.7 13.0 13.3 13.9
6. campur: Duti Import 22.3 -5.9 10.4 1.4 -8.4 -0.2 25.3 5.7 0.6 0.7 0.6 0.7 0.7 0.6 0.5 0.6 0.6
plus: Import Duties
KDNK pada Harga Pembeli
GDP at Purchasers' Prices
KEDAH
JADUAL33
KDNK Kedah mengikut Jenis Aktiviti Ekonomi, 2005-2013 pada Harga Malar 2005 - RM Juta
TABLE GDP for Kedah by Kind of Economic Activity, 2005-2013 at Constant 2005 Prices - RM Million
2011f
2012e
2,206 2,417 2,682
2005f
2006f
2007f
2008f
2009f
2010f
2,748 2,758
2013p
2,734 2,961 3,010 3,134
20 27 18 19 19
6,957
17 17 18
544 571
6,439 6,984 7,718 7,352 8,045 6,416
538
6,638
541
10,774
480 454 521
8,577 9,249 9,968 12,830 14,512 11,219 11,936
1,586
2,802 3,421
1,646 1,918 2,215 1,779
3,164 3,716 2,905
Utiliti, Pengangkutan,
Penyimpanan dan Komunikasi
1,286 1,360 1,465
Perdagangan Borong dan Runcit,
Penginapan dan Restoran
2,024 2,145 2,500
Utilities, Transport, Storage and
Communication
2,161 2,035 2,490 2,773 2,279
Finance and Insurance, Real
Estate and Business Services
Wholesale and Retail Trade,
Accommodation and Restaurants
Kewangan dan Insurans, Hartanah
dan Perkhidmatan Perniagaan
1,562 1,764 1,871
Other Services
Perkhidmatan-perkhidmatan Lain 1,614 1,652 1,689
2012e
17,829 19,255 21,033 26,434
- Perubahan Peratusan Tahunan & Pembahagian Peratus KDNK
2013p
Utiliti, Pengangkutan,
Penyimpanan dan Komunikasi
Utilities, Transport, Storage and
Communication
2006f
2007f
2008f
2009f
2013p
JADUAL34
GDP for Kedah by Kind of Economic Activity, 2005-2013 at Constant 2005 Prices
TABLE - Annual Percentage Change & Percentage Share of GDPPembahagian Peratus KDNK
Percentage Share of GDPAnnual Percentage Change
Perubahan Peratusan Tahunan
2006f
2007f
2008f
2009f
2010f
2011f
2010f
9.2 0.8 -0.5 4.3 8.4 6.0
Perdagangan Borong dan Runcit,
Penginapan dan Restoran
Wholesale and Retail Trade,
Accommodation and Restaurants
Kewangan dan Insurans, Hartanah
dan Perkhidmatan Perniagaan
Finance and Insurance, Real
Estate and Business Services
Perkhidmatan-perkhidmatan Lain
Other Services
Perkhidmatan Kerajaan
Government Services
8.0 4.6 100.0
129
23,837
162
25,278
1,867
2,641
142
21,092
130
21,998
1,798
2,553
140
21,209
KDNK Kedah mengikut Jenis Aktiviti Ekonomi, 2005-2013 pada Harga Malar 2005
2,140
3,668
171 110 134 127
Government Services
Perkhidmatan Kerajaan 2,091 2,328 2,443
1,926
2,789
24
7,852
609
13,621
2,071
2,060
3,361
2,010
3,094
545
2,708
3,317
100.0 100.0100.0 100.0
2005f
100.0 100.0
2011f
2012e
100.0 100.0
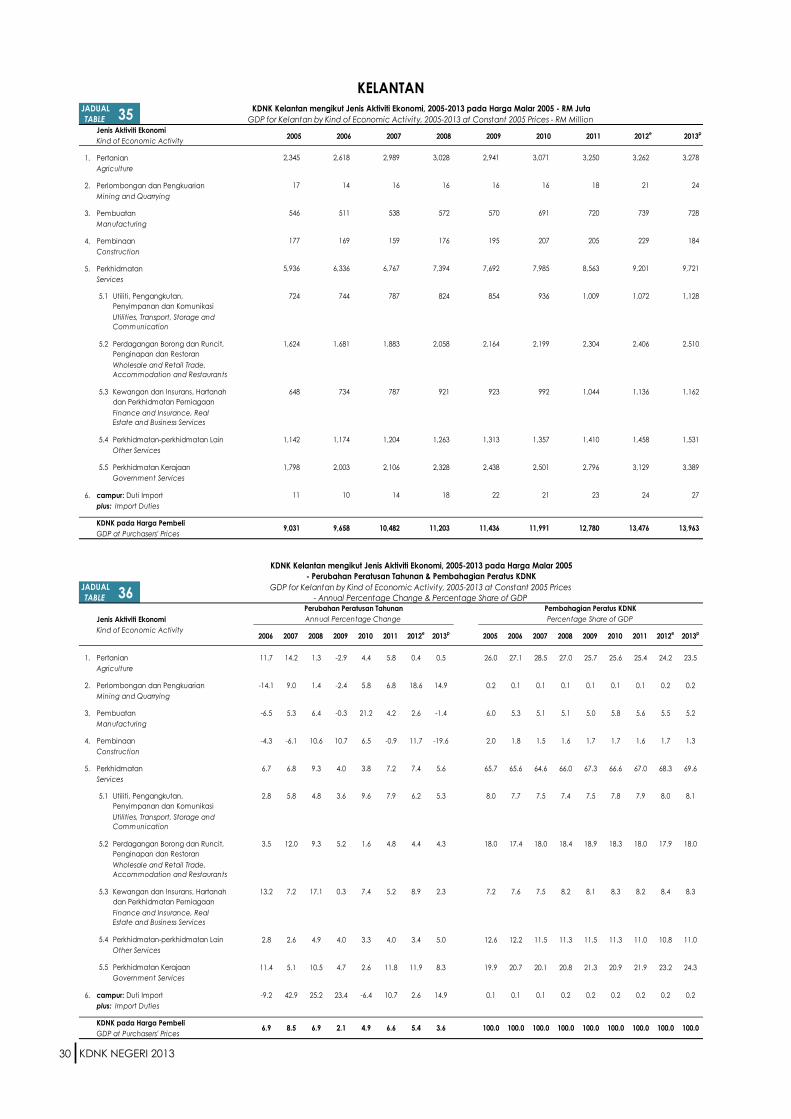
KDNK NEGERI 2013 30
Jenis Aktiviti Ekonomi
Kind of Economic Activity
1. Pertanian
Agriculture
2. Perlombongan dan Pengkuarian
Mining and Quarrying
3. Pembuatan
Manufacturing
4. Pembinaan
Construction
5. Perkhidmatan
Services
5.1
5.2
5.3
5.4
5.5
6. campur: Duti Import
plus: Import Duties
KDNK pada Harga Pembeli
GDP at Purchasers' Prices
Jenis Aktiviti Ekonomi
Kind of Economic Activity
1. Pertanian 11.7 14.2 1.3 -2.9 4.4 5.8 0.4 0.5 26.0 27.1 28.5 27.0 25.7 25.6 25.4 24.2 23.5
Agriculture
2. Perlombongan dan Pengkuarian -14.1 9.0 1.4 -2.4 5.8 6.8 18.6 14.9 0.2 0.1 0.1 0.1 0.1 0.1 0.1 0.2 0.2
Mining and Quarrying
3. Pembuatan -6.5 5.3 6.4 -0.3 21.2 4.2 2.6 -1.4 6.0 5.3 5.1 5.1 5.0 5.8 5.6 5.5 5.2
Manufacturing
4. Pembinaan -4.3 -6.1 10.6 10.7 6.5 -0.9 11.7 -19.6 2.0 1.8 1.5 1.6 1.7 1.7 1.6 1.7 1.3
Construction
5. Perkhidmatan 6.7 6.8 9.3 4.0 3.8 7.2 7.4 5.6 65.7 65.6 64.6 66.0 67.3 66.6 67.0 68.3 69.6
Services
5.1 2.8 5.8 4.8 3.6 9.6 7.9 6.2 5.3 8.0 7.7 7.5 7.4 7.5 7.8 7.9 8.0 8.1
5.2 3.5 12.0 9.3 5.2 1.6 4.8 4.4 4.3 18.0 17.4 18.0 18.4 18.9 18.3 18.0 17.9 18.0
5.3 13.2 7.2 17.1 0.3 7.4 5.2 8.9 2.3 7.2 7.6 7.5 8.2 8.1 8.3 8.2 8.4 8.3
5.4 2.8 2.6 4.9 4.0 3.3 4.0 3.4 5.0 12.6 12.2 11.5 11.3 11.5 11.3 11.0 10.8 11.0
5.5 11.4 5.1 10.5 4.7 2.6 11.8 11.9 8.3 19.9 20.7 20.1 20.8 21.3 20.9 21.9 23.2 24.3
6. campur: Duti Import -9.2 42.9 25.2 23.4 -6.4 10.7 2.6 14.9 0.1 0.1 0.1 0.2 0.2 0.2 0.2 0.2 0.2
plus: Import Duties
KDNK pada Harga Pembeli
GDP at Purchasers' Prices
KELANTAN
JADUAL35
KDNK Kelantan mengikut Jenis Aktiviti Ekonomi, 2005-2013 pada Harga Malar 2005 - RM Juta
TABLE GDP for Kelantan by Kind of Economic Activity, 2005-2013 at Constant 2005 Prices - RM Million
2011f
2012e
2,345 2,618 2,989
2005f
2006f
2007f
2008f
2009f
2010f
2013p
3,028
16 16 17 14 16
176 195
546 511 538 572 570
177 169 159
824 854
5,936 6,336 6,767 7,394 7,692
Utilities, Transport, Storage and
Communication
Utiliti, Pengangkutan,
Penyimpanan dan Komunikasi
724 744 787
Perdagangan Borong dan Runcit,
Penginapan dan Restoran
1,624 1,681 1,883 2,058
921 923
Wholesale and Retail Trade,
Accommodation and Restaurants
Finance and Insurance, Real
Estate and Business Services
Kewangan dan Insurans, Hartanah
dan Perkhidmatan Perniagaan
648 734 787
Other Services
Perkhidmatan-perkhidmatan Lain 1,142 1,174 1,204
Government Services
Perkhidmatan Kerajaan 1,798 2,003 2,106
11 10 14
KDNK Kelantan mengikut Jenis Aktiviti Ekonomi, 2005-2013 pada Harga Malar 2005
- Perubahan Peratusan Tahunan & Pembahagian Peratus KDNK
JADUAL36
GDP for Kelantan by Kind of Economic Activity, 2005-2013 at Constant 2005 Prices
TABLE - Annual Percentage Change & Percentage Share of GDP
9,031 9,658 10,482
Pembahagian Peratus KDNK
Percentage Share of GDP
2006f
2007f
2008f
2009f
2010f
2011f
2010f
2011f
2013p
Perubahan Peratusan Tahunan
Annual Percentage Change
2012e
Utiliti, Pengangkutan,
Penyimpanan dan Komunikasi
Utilities, Transport, Storage and
Communication
2012e
2005f
2006f
2007f
2008f
2009f
2013p
Perkhidmatan-perkhidmatan Lain
Other Services
Perkhidmatan Kerajaan
Government Services
6.9
Perdagangan Borong dan Runcit,
Penginapan dan Restoran
Wholesale and Retail Trade,
Accommodation and Restaurants
Kewangan dan Insurans, Hartanah
dan Perkhidmatan Perniagaan
Finance and Insurance, Real
Estate and Business Services
100.0 100.0100.0 100.0 100.0 100.0 100.0 100.08.5 6.9 2.1 4.9 6.6 5.4
1,263
2,328
18
11,203 11,436 11,991 12,780 13,476
22
2,438
1,313 1,357
2,501
21
2,796
23
3,129
24
18
720
205
8,563
1,009
2,304
1,044
1,410
2,941 3,071
16
691
207
7,985
936
2,199
992
2,164
3,389
27
13,963
3.6 100.0
3,278
24
728
184
9,721
1,128
2,510
1,162
1,531
3,262
21
739
229
9,201
1,072
2,406
1,136
1,458
3,250

KDNK NEGERI 2013 31
Jenis Aktiviti Ekonomi
Kind of Economic Activity
1. Pertanian
Agriculture
2. Perlombongan dan Pengkuarian
Mining and Quarrying
3. Pembuatan
Manufacturing
4. Pembinaan
Construction
5. Perkhidmatan
Services
5.1
5.2
5.3
5.4
5.5
6. campur: Duti Import
plus: Import Duties
KDNK pada Harga Pembeli
GDP at Purchasers' Prices
Jenis Aktiviti Ekonomi
Kind of Economic Activity
1. Pertanian 18.2 9.2 19.3 15.8 23.7 6.1 4.8 8.8 5.4 5.9 6.0 6.9 7.9 9.1 9.3 9.1 9.6
Agriculture
2. Perlombongan dan Pengkuarian -8.1 9.4 1.6 1.1 0.4 5.8 16.1 14.6 0.1 0.0 0.0 0.0 0.0 0.0 0.0 0.0 0.1
Mining and Quarrying
3. Pembuatan 9.5 2.2 0.4 -6.3 5.6 1.0 5.9 1.8 50.5 50.9 48.8 46.7 43.3 42.9 41.6 41.2 40.6
Manufacturing
4. Pembinaan -7.5 54.6 7.7 5.6 3.1 1.5 56.6 -23.5 2.3 1.9 2.8 2.9 3.0 2.9 2.8 4.1 3.1
Construction
5. Perkhidmatan 7.0 9.3 7.8 6.5 5.1 6.5 5.7 5.7 41.7 41.2 42.2 43.4 45.7 45.0 46.1 45.5 46.6
Services
5.1 4.3 4.7 5.9 3.4 7.7 6.2 4.7 10.0 8.4 8.0 7.9 8.0 8.1 8.2 8.4 8.2 8.7
5.2 9.1 15.8 13.6 11.1 2.5 6.6 3.7 5.4 12.4 12.4 13.5 14.6 16.1 15.4 15.8 15.3 15.6
5.3 6.8 9.8 4.8 7.2 7.9 3.2 7.1 0.8 8.5 8.3 8.6 8.6 9.1 9.2 9.1 9.1 8.9
5.4 -2.0 7.0 4.4 3.5 3.9 6.7 3.0 3.9 6.4 5.8 5.8 5.8 5.9 5.7 5.9 5.7 5.7
5.5 16.3 4.3 5.4 1.5 5.2 11.3 12.1 9.4 6.2 6.6 6.4 6.5 6.5 6.4 6.9 7.2 7.6
6. campur: Duti Import 6.8 136.5 -64.1 155.2 -73.3 8.0 77.8 35.1 0.1 0.1 0.2 0.1 0.2 0.0 0.0 0.1 0.1
plus: Import Duties
KDNK pada Harga Pembeli
GDP at Purchasers' Prices
MELAKA
JADUAL37
KDNK Melaka mengikut Jenis Aktiviti Ekonomi, 2005-2013 pada Harga Malar 2005 - RM Juta
TABLE GDP for Melaka by Kind of Economic Activity, 2005-2013 at Constant 2005 Prices - RM Million
813 962 1,050 1,252
2005f
2006f
2007f
2008f
2009f
2010f
2011f
2012e
2013p
1,450 2,171
8 7 8 8
7,594 8,313 8,496 8,527
340 314 486 524
6,281 6,723 7,350 7,927
1,503 1,979 1,618
Perdagangan Borong dan Runcit,
Penginapan dan Restoran
1,861 2,031 2,351 2,670
Utilities, Transport, Storage and
Communication
Utiliti, Pengangkutan,
Penyimpanan dan Komunikasi
1,257 1,311 1,372 1,453
Wholesale and Retail Trade,
Accommodation and Restaurants
Finance and Insurance, Real
Estate and Business Services
Kewangan dan Insurans, Hartanah
dan Perkhidmatan Perniagaan
1,277 1,363 1,496 1,568
Perkhidmatan-perkhidmatan Lain 960 941 1,007 1,052
Other Services
Government Services
Perkhidmatan Kerajaan 927 1,077 1,124 1,184
13 14 32 11
JADUAL38
GDP for Melaka by Kind of Economic Activity, 2005-2013 at Constant 2005 Prices
TABLE - Annual Percentage Change & Percentage Share of GDP
15,049 16,333 17,422 18,250
Utiliti, Pengangkutan,
Penyimpanan dan Komunikasi
Utilities, Transport, Storage and
Communication
2012e
2005f
2006f
2007f
2008f
2009f
2006f
2007f
2008f
2009f
2010f
2011f
Perkhidmatan-perkhidmatan Lain
Other Services
Perkhidmatan Kerajaan
Government Services
8.5
Perdagangan Borong dan Runcit,
Penginapan dan Restoran
Wholesale and Retail Trade,
Accommodation and Restaurants
Kewangan dan Insurans, Hartanah
dan Perkhidmatan Perniagaan
Finance and Insurance, Real
Estate and Business Services
100.0
1,904
9
8,527
579
9,448
1,291
1,726
20
1,408
8
1,579
15
Pembahagian Peratus KDNK
Percentage Share of GDP
2010f
2011f
2013p
1,681 1,873 2,023
2,965
100.0
3,541
100.0 100.0 100.0 100.0 100.0
KDNK Melaka mengikut Jenis Aktiviti Ekonomi, 2005-2013 pada Harga Malar 2005
- Perubahan Peratusan Tahunan & Pembahagian Peratus KDNK
Perubahan Peratusan Tahunan
Annual Percentage Change
2013p
2012e
3.2 100.06.7 4.7 1.2 6.6 4.0 7.2 100.0
8
7,992
553
8,439
1,794
8
8,441
570
8,868
12
9,190
693
10,560
3,040
1,814
1,131
1,996
10
9,030
906
9,987
1,799
3,362
2,006
1,242 1,206
1,719
3,242
1,088
1,202
29
18,472 19,689 20,474 21,944 22,646
1,265
8
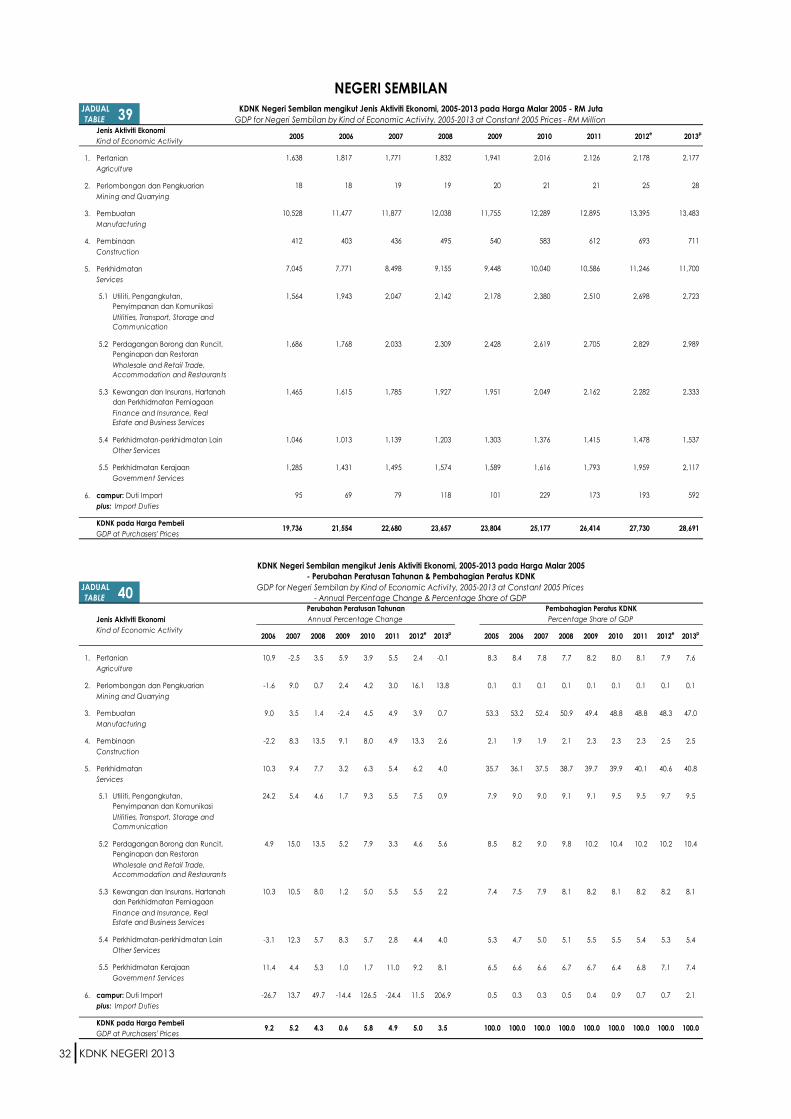
KDNK NEGERI 2013 32
Jenis Aktiviti Ekonomi
Kind of Economic Activity
1. Pertanian
Agriculture
2. Perlombongan dan Pengkuarian
Mining and Quarrying
3. Pembuatan
Manufacturing
4. Pembinaan
Construction
5. Perkhidmatan
Services
5.1
5.2
5.3
5.4
5.5
6. campur: Duti Import
plus: Import Duties
KDNK pada Harga Pembeli
GDP at Purchasers' Prices
Jenis Aktiviti Ekonomi
Kind of Economic Activity
1. Pertanian 10.9 -2.5 3.5 5.9 3.9 5.5 2.4 -0.1 8.3 8.4 7.8 7.7 8.2 8.0 8.1 7.9 7.6
Agriculture
2. Perlombongan dan Pengkuarian -1.6 9.0 0.7 2.4 4.2 3.0 16.1 13.8 0.1 0.1 0.1 0.1 0.1 0.1 0.1 0.1 0.1
Mining and Quarrying
3. Pembuatan 9.0 3.5 1.4 -2.4 4.5 4.9 3.9 0.7 53.3 53.2 52.4 50.9 49.4 48.8 48.8 48.3 47.0
Manufacturing
4. Pembinaan -2.2 8.3 13.5 9.1 8.0 4.9 13.3 2.6 2.1 1.9 1.9 2.1 2.3 2.3 2.3 2.5 2.5
Construction
5. Perkhidmatan 10.3 9.4 7.7 3.2 6.3 5.4 6.2 4.0 35.7 36.1 37.5 38.7 39.7 39.9 40.1 40.6 40.8
Services
5.1 24.2 5.4 4.6 1.7 9.3 5.5 7.5 0.9 7.9 9.0 9.0 9.1 9.1 9.5 9.5 9.7 9.5
5.2 4.9 15.0 13.5 5.2 7.9 3.3 4.6 5.6 8.5 8.2 9.0 9.8 10.2 10.4 10.2 10.2 10.4
5.3 10.3 10.5 8.0 1.2 5.0 5.5 5.5 2.2 7.4 7.5 7.9 8.1 8.2 8.1 8.2 8.2 8.1
5.4 -3.1 12.3 5.7 8.3 5.7 2.8 4.4 4.0 5.3 4.7 5.0 5.1 5.5 5.5 5.4 5.3 5.4
5.5 11.4 4.4 5.3 1.0 1.7 11.0 9.2 8.1 6.5 6.6 6.6 6.7 6.7 6.4 6.8 7.1 7.4
6. campur: Duti Import -26.7 13.7 49.7 -14.4 126.5 -24.4 11.5 206.9 0.5 0.3 0.3 0.5 0.4 0.9 0.7 0.7 2.1
plus: Import Duties
KDNK pada Harga Pembeli
GDP at Purchasers' Prices
NEGERI SEMBILAN
JADUAL39
KDNK Negeri Sembilan mengikut Jenis Aktiviti Ekonomi, 2005-2013 pada Harga Malar 2005 - RM Juta
TABLE GDP for Negeri Sembilan by Kind of Economic Activity, 2005-2013 at Constant 2005 Prices - RM Million
2011f
2012e
1,638 1,817 1,771 1,832
2005f
2006f
2007f
2008f
2009f
2010f
2013p
1,941
18 18 19 19
10,528 11,477 11,877 12,038 11,755
540 412 403 436 495
7,045 7,771 8,498 9,155 9,448
Utiliti, Pengangkutan,
Penyimpanan dan Komunikasi
1,564 1,943 2,047 2,142
2,428
Utilities, Transport, Storage and
Communication
Wholesale and Retail Trade,
Accommodation and Restaurants
Perdagangan Borong dan Runcit,
Penginapan dan Restoran
1,686 1,768 2,033 2,309
Kewangan dan Insurans, Hartanah
dan Perkhidmatan Perniagaan
1,465 1,615 1,785 1,927 1,951
Finance and Insurance, Real
Estate and Business Services
Other Services
Perkhidmatan-perkhidmatan Lain 1,046 1,013 1,139 1,203
Perkhidmatan Kerajaan 1,285 1,431 1,495 1,574
173
Government Services
95 69 79 118
19,736 21,554 22,680 23,657 23,804 25,177 26,414 27,730 28,691
Perubahan Peratusan Tahunan
Annual Percentage Change
2013p
KDNK Negeri Sembilan mengikut Jenis Aktiviti Ekonomi, 2005-2013 pada Harga Malar 2005
- Perubahan Peratusan Tahunan & Pembahagian Peratus KDNK
JADUAL40
GDP for Negeri Sembilan by Kind of Economic Activity, 2005-2013 at Constant 2005 Prices
TABLE - Annual Percentage Change & Percentage Share of GDP
Utiliti, Pengangkutan,
Penyimpanan dan Komunikasi
Utilities, Transport, Storage and
Communication
2012e
2005f
2006f
2007f
2008f
2009f
2013p
2006f
2007f
2008f
2009f
2010f
2011f
Perkhidmatan-perkhidmatan Lain
Other Services
Perkhidmatan Kerajaan
Government Services
9.2
Perdagangan Borong dan Runcit,
Penginapan dan Restoran
Wholesale and Retail Trade,
Accommodation and Restaurants
Kewangan dan Insurans, Hartanah
dan Perkhidmatan Perniagaan
Finance and Insurance, Real
Estate and Business Services
100.0 100.0 100.0 100.0 100.0 100.05.2 4.3 0.6 5.8 4.9 5.0 3.5
1,303
1,589
101
2,016
21
12,289
583
10,040
2,380
2,619
2,049
1,376
1,616
229
2,178
20 25
13,395
693
11,246
2,698
2,829
2,282
1,793
1,415
2,162
2,705
2,510
10,586
612
12,895
21
100.0
1,478
1,959
193
2,177
28
13,483
711
11,700
2,723
2,989
2,333
1,537
2,117
592
100.0 100.0
Pembahagian Peratus KDNK
Percentage Share of GDP
2010f
2011f
2012e
2,126 2,178

KDNK NEGERI 2013 33
Jenis Aktiviti Ekonomi
Kind of Economic Activity
1. Pertanian
Agriculture
2. Perlombongan dan Pengkuarian
Mining and Quarrying
3. Pembuatan
Manufacturing
4. Pembinaan
Construction
5. Perkhidmatan
Services
5.1
5.2
5.3
5.4
5.5
6. campur: Duti Import
plus: Import Duties
KDNK pada Harga Pembeli
GDP at Purchasers' Prices
Jenis Aktiviti Ekonomi
Kind of Economic Activity
1. Pertanian 6.7 -9.8 4.8 -0.1 4.1 7.8 1.1 5.0 23.5 23.4 20.7 20.6 20.8 20.6 20.9 20.1 20.0
Agriculture
2. Perlombongan dan Pengkuarian -20.5 37.5 -9.1 20.1 48.2 10.8 9.9 7.9 0.4 0.3 0.4 0.4 0.5 0.6 0.7 0.7 0.7
Mining and Quarrying
3. Pembuatan 10.7 -0.8 2.2 -7.2 3.1 5.2 8.0 5.4 27.9 28.8 28.0 27.2 25.5 25.1 24.9 25.5 25.4
Manufacturing
4. Pembinaan -0.6 0.7 14.9 5.2 12.4 -2.7 14.7 6.1 2.5 2.3 2.3 2.5 2.7 2.8 2.6 2.8 2.9
Construction
5. Perkhidmatan 5.9 9.9 6.0 1.5 5.9 6.6 5.4 5.7 45.6 45.1 48.5 49.0 50.2 50.7 50.9 50.9 50.9
Services
5.1 0.9 7.4 7.5 0.0 7.2 7.6 6.5 5.6 5.1 4.8 5.1 5.2 5.3 5.4 5.4 5.5 5.5
5.2 4.1 15.6 7.3 0.8 8.5 3.9 4.1 3.1 13.9 13.5 15.3 15.7 16.0 16.5 16.1 15.9 15.6
5.3 5.3 11.2 9.3 2.8 5.7 6.2 9.5 2.9 5.9 5.8 6.4 6.6 6.9 6.9 6.9 7.2 7.0
5.4 1.3 8.1 4.2 2.2 4.4 6.9 3.0 6.8 12.2 11.5 12.2 12.1 12.5 12.5 12.5 12.2 12.4
5.5 19.2 4.2 3.3 1.4 3.1 10.4 7.1 10.3 8.4 9.4 9.5 9.4 9.6 9.5 9.8 10.0 10.4
6. campur: Duti Import -43.5 5.3 169.8 28.6 -87.2 -22.6 60.9 99.1 0.2 0.1 0.1 0.2 0.3 0.0 0.0 0.0 0.1
plus: Import Duties
KDNK pada Harga Pembeli
GDP at Purchasers' Prices
PAHANG
JADUAL41
KDNK Pahang mengikut Jenis Aktiviti Ekonomi, 2005-2013 pada Harga Malar 2005 - RM Juta
TABLE GDP for Pahang by Kind of Economic Activity, 2005-2013 at Constant 2005 Prices - RM Million
2011f
2012e
5,408 5,770 5,208 5,455
2005f
2006f
2007f
2008f
2009f
2010f
2013p
5,449
121 179 101 80 110 100
6,423 7,111 7,053 7,210 6,693 6,899
696 782 575 572 576 662
10,515 11,138 12,236 12,974 13,163
Utiliti, Pengangkutan,
Penyimpanan dan Komunikasi
1,182 1,193 1,282 1,378
4,180
Utilities, Transport, Storage and
Communication
Wholesale and Retail Trade,
Accommodation and Restaurants
Perdagangan Borong dan Runcit,
Penginapan dan Restoran
3,213 3,345 3,866 4,148
Kewangan dan Insurans, Hartanah
dan Perkhidmatan Perniagaan
1,371 1,443 1,604 1,753 1,803
Finance and Insurance, Real
Estate and Business Services
Other Services
Perkhidmatan-perkhidmatan Lain 2,812 2,848 3,078 3,208
Perkhidmatan Kerajaan 1,937 2,310 2,406 2,486
Government Services
40 22 24 64
KDNK Pahang mengikut Jenis Aktiviti Ekonomi, 2005-2013 pada Harga Malar 2005
- Perubahan Peratusan Tahunan & Pembahagian Peratus KDNK
JADUAL42
GDP for Pahang by Kind of Economic Activity, 2005-2013 at Constant 2005 Prices
TABLE - Annual Percentage Change & Percentage Share of GDP
23,061 24,693 25,206 26,465 26,203 27,484 29,201 30,791 32,489
Pembahagian Peratus KDNK
Percentage Share of GDP
2006f
2007f
2008f
2009f
2010f
2011f
2010f
2011f
2012e
Perubahan Peratusan Tahunan
Annual Percentage Change
2013p
Utiliti, Pengangkutan,
Penyimpanan dan Komunikasi
Utilities, Transport, Storage and
Communication
2012e
2005f
2006f
2007f
2008f
2009f
2013p
Perkhidmatan-perkhidmatan Lain
Other Services
Perkhidmatan Kerajaan
Government Services
7.1
Perdagangan Borong dan Runcit,
Penginapan dan Restoran
Wholesale and Retail Trade,
Accommodation and Restaurants
Kewangan dan Insurans, Hartanah
dan Perkhidmatan Perniagaan
Finance and Insurance, Real
Estate and Business Services
100.0 100.0100.0 100.0 100.0 100.0 100.0 100.02.1 5.0 -1.0 4.9 6.2 5.4
3,279
2,522
82 10
2,601
3,423
1,906
4,535
1,477 1,378
3,769
3,077
13
5,673 6,117
198
7,260
761
14,857
1,589
4,713
2,025
13,941
3,393
26
5.5 100.0
6,496
235
8,261
927
16,546
1,786
5,058
2,282
4,027 3,659
2,872
8
6,187
217
7,841
873
15,660
1,691
4,905
2,217

KDNK NEGERI 2013 34
Jenis Aktiviti Ekonomi
Kind of Economic Activity
1. Pertanian
Agriculture
2. Perlombongan dan Pengkuarian
Mining and Quarrying
3. Pembuatan
Manufacturing
4. Pembinaan
Construction
5. Perkhidmatan
Services
5.1
5.2
5.3
5.4
5.5
6. campur: Duti Import
plus: Import Duties
KDNK pada Harga Pembeli
GDP at Purchasers' Prices
Jenis Aktiviti Ekonomi
Kind of Economic Activity
1. Pertanian 10.5 3.0 4.0 1.4 16.9 6.2 4.9 3.2 1.6 1.6 1.6 1.5 1.7 1.8 1.9 1.9 1.9
Agriculture
2. Perlombongan dan Pengkuarian -2.4 9.5 1.5 1.2 -0.5 6.7 15.7 13.2 0.0 0.0 0.0 0.0 0.0 0.0 0.0 0.0 0.0
Mining and Quarrying
3. Pembuatan 15.0 3.9 3.8 -19.4 14.2 1.3 3.4 3.5 54.2 56.3 54.9 54.0 48.7 50.4 49.1 48.3 47.8
Manufacturing
4. Pembinaan -3.7 13.7 8.8 -2.3 4.1 5.1 22.5 -0.5 2.2 1.9 2.0 2.1 2.3 2.1 2.1 2.5 2.4
Construction
5. Perkhidmatan 6.3 10.3 7.1 -0.1 7.1 6.5 5.7 5.8 41.2 39.5 40.9 41.6 46.4 45.0 46.2 46.5 47.0
Services
5.1 5.0 10.5 6.0 0.6 7.9 6.1 8.0 5.0 8.7 8.3 8.6 8.6 9.7 9.5 9.7 10.0 10.0
5.2 7.8 14.3 9.7 -3.0 8.4 5.2 4.0 7.0 11.2 10.9 11.7 12.1 13.1 12.9 13.1 12.9 13.2
5.3 5.7 10.7 6.8 0.5 8.3 5.8 3.9 2.1 12.0 11.5 11.9 12.1 13.6 13.3 13.5 13.4 13.1
5.4 2.7 6.8 5.3 4.0 5.1 3.8 5.1 5.7 4.4 4.1 4.1 4.1 4.8 4.6 4.6 4.6 4.6
5.5 10.0 3.0 4.9 1.0 1.4 15.7 10.7 13.2 4.8 4.8 4.6 4.6 5.2 4.8 5.3 5.6 6.1
6. campur: Duti Import -5.2 -8.8 36.9 6.4 -27.1 22.0 20.2 17.1 0.8 0.7 0.6 0.7 0.9 0.6 0.7 0.8 0.9
plus: Import Duties
KDNK pada Harga Pembeli
GDP at Purchasers' Prices
PULAU PINANG
JADUAL43
KDNK Pulau Pinang mengikut Jenis Aktiviti Ekonomi, 2005-2013 pada Harga Malar 2005 - RM Juta
TABLE GDP for Pulau Pinang by Kind of Economic Activity, 2005-2013 at Constant 2005 Prices - RM Million
2011f
2012e
634 700 721 750
2005f
2006f
2007f
2008f
2009f
2010f
2013p
760
17 17 19 19
21,249 24,429 25,374 26,348 21,239 24,567
982 1,074 844 813 924 1,005
16,138 17,153 18,925 20,267 20,242
Utiliti, Pengangkutan,
Penyimpanan dan Komunikasi
3,423 3,595 3,973 4,212
5,736
Utilities, Transport, Storage and
Communication
Wholesale and Retail Trade,
Accommodation and Restaurants
Perdagangan Borong dan Runcit,
Penginapan dan Restoran
4,378 4,717 5,393 5,915
Kewangan dan Insurans, Hartanah
dan Perkhidmatan Perniagaan
4,706 4,975 5,509 5,883 5,912
Finance and Insurance, Real
Estate and Business Services
Other Services
Perkhidmatan-perkhidmatan Lain 1,744 1,791 1,912 2,014
Perkhidmatan Kerajaan 1,888 2,076 2,139 2,243
304 288 263 360
Government Services
39,186 43,401 46,226 48,749
Perubahan Peratusan Tahunan
Annual Percentage Change
2013p
KDNK Pulau Pinang mengikut Jenis Aktiviti Ekonomi, 2005-2013 pada Harga Malar 2005
- Perubahan Peratusan Tahunan & Pembahagian Peratus KDNK
JADUAL44
GDP for Pulau Pinang by Kind of Economic Activity, 2005-2013 at Constant 2005 Prices
TABLE - Annual Percentage Change & Percentage Share of GDP
Utiliti, Pengangkutan,
Penyimpanan dan Komunikasi
Utilities, Transport, Storage and
Communication
2012e
2005f
2006f
2007f
2008f
2009f
2013p
2006f
2007f
2008f
2009f
2010f
2011f
Perkhidmatan-perkhidmatan Lain
Other Services
Perkhidmatan Kerajaan
Government Services
10.8
Perdagangan Borong dan Runcit,
Penginapan dan Restoran
Wholesale and Retail Trade,
Accommodation and Restaurants
Kewangan dan Insurans, Hartanah
dan Perkhidmatan Perniagaan
Finance and Insurance, Real
Estate and Business Services
100.0 100.0 100.0 100.0 100.0 100.06.5 5.5 -10.5 10.4 3.9 5.0 4.6
2,264
383
43,626 48,161 50,053 52,571 54,968
889
19
24,264
1,022
21,688
4,570
6,218
6,403
2,201
2,296
279 340
2,656
2,284
6,773
6,545
4,235
990
24
25,411
1,315
24,422
5,238
7,038
2,094
4,849
23,107
19 20
100.0
2,400
2,940
409
1,021
479
3,328
2,538
7,184
6,806 7,280
5,501
25,831
1,308
26,301
27
100.0 100.0
Pembahagian Peratus KDNK
Percentage Share of GDP
2010f
2011f
2012e
944

KDNK NEGERI 2013 35
Jenis Aktiviti Ekonomi
Kind of Economic Activity
1. Pertanian
Agriculture
2. Perlombongan dan Pengkuarian
Mining and Quarrying
3. Pembuatan
Manufacturing
4. Pembinaan
Construction
5. Perkhidmatan
Services
5.1
5.2
5.3
5.4
5.5
6. campur: Duti Import
plus: Import Duties
KDNK pada Harga Pembeli
GDP at Purchasers' Prices
Jenis Aktiviti Ekonomi
Kind of Economic Activity
1. Pertanian 3.3 3.4 1.3 2.5 0.9 7.4 2.7 -0.1 16.9 16.4 16.1 15.3 15.9 15.2 15.2 14.6 13.8
Agriculture
2. Perlombongan dan Pengkuarian 6.3 8.8 -2.1 -1.4 9.6 7.8 19.9 11.5 0.3 0.3 0.3 0.3 0.3 0.3 0.3 0.4 0.4
Mining and Quarrying
3. Pembuatan 12.7 1.4 4.1 -12.2 12.9 11.0 5.4 5.7 20.0 21.2 20.4 20.0 17.7 18.9 19.6 19.3 19.4
Manufacturing
4. Pembinaan -4.1 -17.8 4.9 10.4 11.5 0.6 51.8 20.2 2.5 2.3 1.8 1.8 2.0 2.1 1.9 2.8 3.1
Construction
5. Perkhidmatan 6.0 7.8 8.7 1.3 4.8 6.0 7.5 5.7 60.0 59.7 61.2 62.6 64.0 63.5 62.8 63.0 63.2
Services
5.1 5.6 2.5 2.4 2.0 8.3 5.1 9.6 9.0 19.0 18.8 18.4 17.6 18.2 18.6 18.3 18.7 19.4
5.2 6.0 16.2 15.8 -0.9 8.7 7.1 4.5 5.8 12.2 12.1 13.4 14.6 14.6 15.0 15.0 14.6 14.7
5.3 5.2 10.8 11.8 0.4 -0.4 3.2 9.6 1.4 10.8 10.6 11.2 11.8 12.0 11.3 10.9 11.1 10.7
5.4 2.2 7.5 5.7 3.9 0.3 3.6 2.3 3.5 8.2 7.9 8.1 8.0 8.4 8.0 7.7 7.4 7.2
5.5 11.0 4.9 9.9 2.0 2.8 10.6 9.7 5.9 9.8 10.2 10.2 10.5 10.9 10.6 10.9 11.2 11.2
6. campur: Duti Import -20.3 -54.6 -11.2 -20.3 -10.5 14.2 -0.5 33.7 0.2 0.2 0.1 0.1 0.1 0.0 0.0 0.0 0.1
plus: Import Duties
KDNK pada Harga Pembeli
GDP at Purchasers' Prices
PERAK
JADUAL45
KDNK Perak mengikut Jenis Aktiviti Ekonomi, 2005-2013 pada Harga Malar 2005 - RM Juta
TABLE GDP for Perak by Kind of Economic Activity, 2005-2013 at Constant 2005 Prices - RM Million
2011f
2012e
4,686 4,841 5,003 5,068 5,196 5,241 5,627 5,777
2005f
2006f
2007f
2008f
2009f
2010f
2013p
5,770
102 112 120 144 91 97 105 103
643 717 721 1,095
7,268 7,658 5,548 6,255 6,343 6,605 5,800 6,549
704 675 555 583
7,426
23,247 24,996 16,637 17,637 19,017 20,679 20,942 21,941
5,562 5,813
Utilities, Transport, Storage and
Communication
Utiliti, Pengangkutan,
Penyimpanan dan Komunikasi
5,266 5,560 5,697 5,834 5,950 6,445 6,773
Perdagangan Borong dan Runcit,
Penginapan dan Restoran
3,384 3,587 4,166 4,824 4,779 5,194
Wholesale and Retail Trade,
Accommodation and Restaurants
3,897 4,022 4,408
Finance and Insurance, Real
Estate and Business Services
Kewangan dan Insurans, Hartanah
dan Perkhidmatan Perniagaan
2,991 3,146 3,486 3,898 3,914
Other Services
Perkhidmatan-perkhidmatan Lain 2,276 2,326 2,501 2,643
Perkhidmatan Kerajaan 2,721 3,019 3,167 3,481
15 18 17
Government Services
67 54 24 22 17
27,733 29,558 31,048 33,060 32,700 34,576 41,787
2005f
2006f
2007f
2008f
2009f
2013p
- Perubahan Peratusan Tahunan & Pembahagian Peratus KDNK
JADUAL46
GDP for Perak by Kind of Economic Activity, 2005-2013 at Constant 2005 Prices
TABLE - Annual Percentage Change & Percentage Share of GDP
5.0 6.5 -1.1 5.7
Perdagangan Borong dan Runcit,
Penginapan dan Restoran
Wholesale and Retail Trade,
Accommodation and Restaurants
Kewangan dan Insurans, Hartanah
dan Perkhidmatan Perniagaan
6.6
161
8,092
1,316
26,425
8,094
6,150
4,468
3,021
23
2,747
3,552
2,754
Pembahagian Peratus KDNK
Percentage Share of GDP
Perubahan Peratusan Tahunan
Annual Percentage Change
2013p
2006f
2007f
3,652 4,038
2,851 2,918
4,432 4,693
2008f
2009f
2010f
2011f
2010f
2011f
2012e
2012e
100.0 100.0
37,001 39,688
KDNK Perak mengikut Jenis Aktiviti Ekonomi, 2005-2013 pada Harga Malar 2005
7.0 7.3
Perkhidmatan-perkhidmatan Lain
Other Services
Perkhidmatan Kerajaan
Government Services
5.3 100.0100.0 100.0100.0 100.0 100.0 100.0
Finance and Insurance, Real
Estate and Business Services
Utiliti, Pengangkutan,
Penyimpanan dan Komunikasi
Utilities, Transport, Storage and
Communication
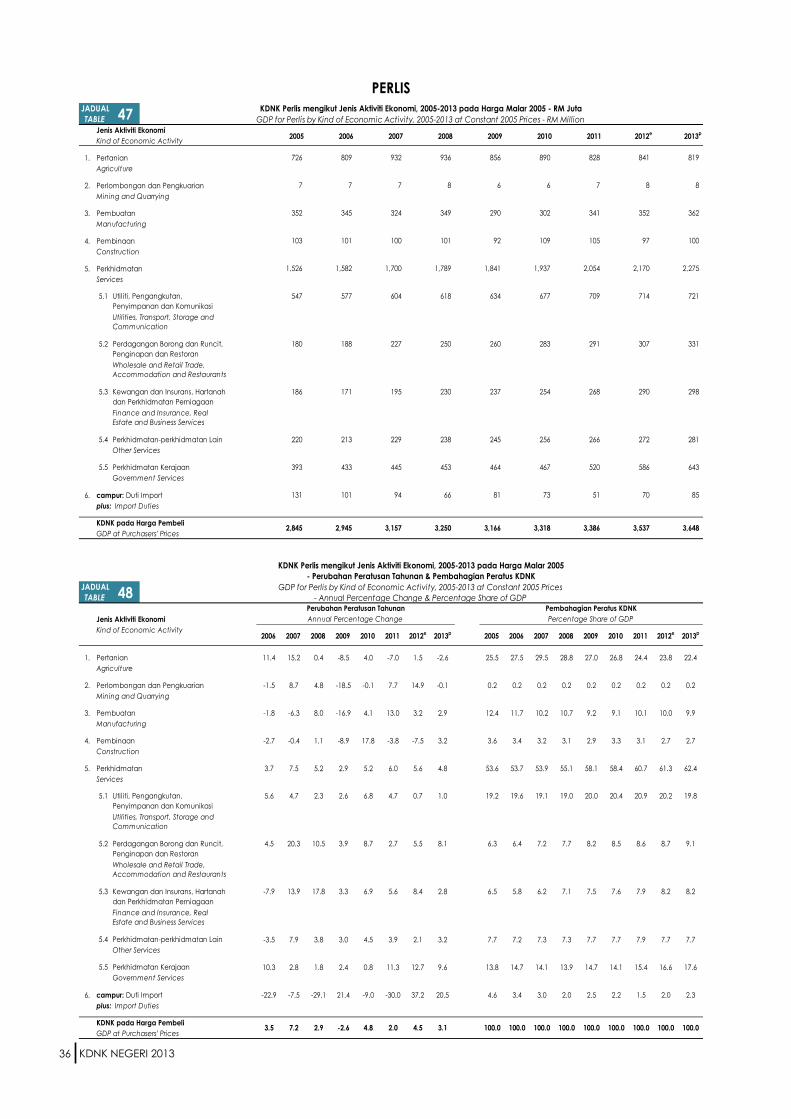
KDNK NEGERI 2013 36
Jenis Aktiviti Ekonomi
Kind of Economic Activity
1. Pertanian
Agriculture
2. Perlombongan dan Pengkuarian
Mining and Quarrying
3. Pembuatan
Manufacturing
4. Pembinaan
Construction
5. Perkhidmatan
Services
5.1
5.2
5.3
5.4
5.5
6. campur: Duti Import
plus: Import Duties
KDNK pada Harga Pembeli
GDP at Purchasers' Prices
Jenis Aktiviti Ekonomi
Kind of Economic Activity
1. Pertanian 11.4 15.2 0.4 -8.5 4.0 -7.0 1.5 -2.6 25.5 27.5 29.5 28.8 27.0 26.8 24.4 23.8 22.4
Agriculture
2. Perlombongan dan Pengkuarian -1.5 8.7 4.8 -18.5 -0.1 7.7 14.9 -0.1 0.2 0.2 0.2 0.2 0.2 0.2 0.2 0.2 0.2
Mining and Quarrying
3. Pembuatan -1.8 -6.3 8.0 -16.9 4.1 13.0 3.2 2.9 12.4 11.7 10.2 10.7 9.2 9.1 10.1 10.0 9.9
Manufacturing
4. Pembinaan -2.7 -0.4 1.1 -8.9 17.8 -3.8 -7.5 3.2 3.6 3.4 3.2 3.1 2.9 3.3 3.1 2.7 2.7
Construction
5. Perkhidmatan 3.7 7.5 5.2 2.9 5.2 6.0 5.6 4.8 53.6 53.7 53.9 55.1 58.1 58.4 60.7 61.3 62.4
Services
5.1 5.6 4.7 2.3 2.6 6.8 4.7 0.7 1.0 19.2 19.6 19.1 19.0 20.0 20.4 20.9 20.2 19.8
5.2 4.5 20.3 10.5 3.9 8.7 2.7 5.5 8.1 6.3 6.4 7.2 7.7 8.2 8.5 8.6 8.7 9.1
5.3 -7.9 13.9 17.8 3.3 6.9 5.6 8.4 2.8 6.5 5.8 6.2 7.1 7.5 7.6 7.9 8.2 8.2
5.4 -3.5 7.9 3.8 3.0 4.5 3.9 2.1 3.2 7.7 7.2 7.3 7.3 7.7 7.7 7.9 7.7 7.7
5.5 10.3 2.8 1.8 2.4 0.8 11.3 12.7 9.6 13.8 14.7 14.1 13.9 14.7 14.1 15.4 16.6 17.6
6. campur: Duti Import -22.9 -7.5 -29.1 21.4 -9.0 -30.0 37.2 20.5 4.6 3.4 3.0 2.0 2.5 2.2 1.5 2.0 2.3
plus: Import Duties
KDNK pada Harga Pembeli
GDP at Purchasers' Prices
PERLIS
JADUAL47
KDNK Perlis mengikut Jenis Aktiviti Ekonomi, 2005-2013 pada Harga Malar 2005 - RM Juta
TABLE GDP for Perlis by Kind of Economic Activity, 2005-2013 at Constant 2005 Prices - RM Million
2011f
2012e
726 809 932 936 856 890 828 841
2005f
2006f
2007f
2008f
2009f
2010f
2013p
819
6 6 7 8 7 7 7 8
92 109 105 97
341 352 352 345 324 349 290 302
103 101 100 101
714
2,054 2,170 1,526 1,582 1,700 1,789 1,841 1,937
291 307
Utilities, Transport, Storage and
Communication
Utiliti, Pengangkutan,
Penyimpanan dan Komunikasi
547 577 604 618 634 677 709
Perdagangan Borong dan Runcit,
Penginapan dan Restoran
180 188 227 250 260 283
Wholesale and Retail Trade,
Accommodation and Restaurants
254
Finance and Insurance, Real
Estate and Business Services
Kewangan dan Insurans, Hartanah
dan Perkhidmatan Perniagaan
186 171 195 230 237
Other Services
Perkhidmatan-perkhidmatan Lain 220 213 229 238
Perkhidmatan Kerajaan 393 433 445 453
81 73 51 70
Government Services
131 101 94 66
3,386 3,537
KDNK Perlis mengikut Jenis Aktiviti Ekonomi, 2005-2013 pada Harga Malar 2005
- Perubahan Peratusan Tahunan & Pembahagian Peratus KDNK
JADUAL48
GDP for Perlis by Kind of Economic Activity, 2005-2013 at Constant 2005 Prices
TABLE - Annual Percentage Change & Percentage Share of GDP
2,845 2,945 3,157 3,250 3,166 3,318 3,648
Pembahagian Peratus KDNK
Percentage Share of GDP
2006f
2007f
2008f
2009f
2010f
2011f
2010f
2011f
2012e
Perubahan Peratusan Tahunan
Annual Percentage Change
2013p
Utiliti, Pengangkutan,
Penyimpanan dan Komunikasi
Utilities, Transport, Storage and
Communication
2012e
2005f
2006f
2007f
2008f
2009f
2013p
Perkhidmatan-perkhidmatan Lain
Other Services
Perkhidmatan Kerajaan
Government Services
3.5
Perdagangan Borong dan Runcit,
Penginapan dan Restoran
Wholesale and Retail Trade,
Accommodation and Restaurants
Kewangan dan Insurans, Hartanah
dan Perkhidmatan Perniagaan
Finance and Insurance, Real
Estate and Business Services
100.0 100.0 100.0 100.0 100.0 100.07.2 2.9 -2.6 4.8 2.0 4.5
85
3.1 100.0
8
362
100
2,275
721
331
298
281
643
245
464
256
467
268
266
520
290
272
586
100.0 100.0
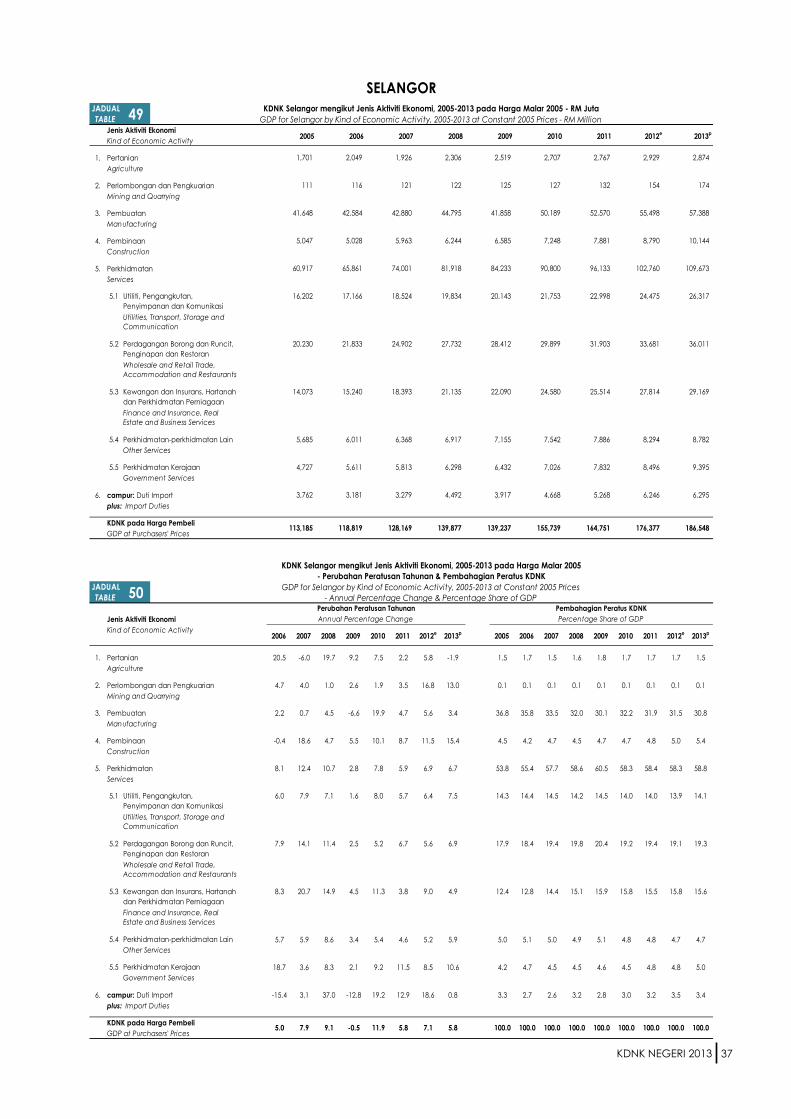
KDNK NEGERI 2013 37
Jenis Aktiviti Ekonomi
Kind of Economic Activity
1. Pertanian
Agriculture
2. Perlombongan dan Pengkuarian
Mining and Quarrying
3. Pembuatan
Manufacturing
4. Pembinaan
Construction
5. Perkhidmatan
Services
5.1
5.2
5.3
5.4
5.5
6. campur: Duti Import
plus: Import Duties
KDNK pada Harga Pembeli
GDP at Purchasers' Prices
Jenis Aktiviti Ekonomi
Kind of Economic Activity
1. Pertanian 20.5 -6.0 19.7 9.2 7.5 2.2 5.8 -1.9 1.5 1.7 1.5 1.6 1.8 1.7 1.7 1.7 1.5
Agriculture
2. Perlombongan dan Pengkuarian 4.7 4.0 1.0 2.6 1.9 3.5 16.8 13.0 0.1 0.1 0.1 0.1 0.1 0.1 0.1 0.1 0.1
Mining and Quarrying
3. Pembuatan 2.2 0.7 4.5 -6.6 19.9 4.7 5.6 3.4 36.8 35.8 33.5 32.0 30.1 32.2 31.9 31.5 30.8
Manufacturing
4. Pembinaan -0.4 18.6 4.7 5.5 10.1 8.7 11.5 15.4 4.5 4.2 4.7 4.5 4.7 4.7 4.8 5.0 5.4
Construction
5. Perkhidmatan 8.1 12.4 10.7 2.8 7.8 5.9 6.9 6.7 53.8 55.4 57.7 58.6 60.5 58.3 58.4 58.3 58.8
Services
5.1 6.0 7.9 7.1 1.6 8.0 5.7 6.4 7.5 14.3 14.4 14.5 14.2 14.5 14.0 14.0 13.9 14.1
5.2 7.9 14.1 11.4 2.5 5.2 6.7 5.6 6.9 17.9 18.4 19.4 19.8 20.4 19.2 19.4 19.1 19.3
5.3 8.3 20.7 14.9 4.5 11.3 3.8 9.0 4.9 12.4 12.8 14.4 15.1 15.9 15.8 15.5 15.8 15.6
5.4 5.7 5.9 8.6 3.4 5.4 4.6 5.2 5.9 5.0 5.1 5.0 4.9 5.1 4.8 4.8 4.7 4.7
5.5 18.7 3.6 8.3 2.1 9.2 11.5 8.5 10.6 4.2 4.7 4.5 4.5 4.6 4.5 4.8 4.8 5.0
6. campur: Duti Import -15.4 3.1 37.0 -12.8 19.2 12.9 18.6 0.8 3.3 2.7 2.6 3.2 2.8 3.0 3.2 3.5 3.4
plus: Import Duties
KDNK pada Harga Pembeli
GDP at Purchasers' Prices
SELANGOR
JADUAL49
KDNK Selangor mengikut Jenis Aktiviti Ekonomi, 2005-2013 pada Harga Malar 2005 - RM Juta
TABLE GDP for Selangor by Kind of Economic Activity, 2005-2013 at Constant 2005 Prices - RM Million
2011f
2012e
1,701 2,049 1,926 2,306 2,874
2005f
2006f
2007f
2008f
2009f
2010f
2,519 2,707
174 125 127 111 116 121 122
10,144 6,585
57,388 41,648 42,584 42,880 44,795 41,858 50,189
7,248 5,047 5,028 5,963 6,244
26,317 20,143
109,673 60,917 65,861 74,001 81,918 84,233 90,800
36,011 28,412 31,903
Utilities, Transport, Storage and
Communication
Utiliti, Pengangkutan,
Penyimpanan dan Komunikasi
16,202 17,166 18,524 19,834
Perdagangan Borong dan Runcit,
Penginapan dan Restoran
20,230 21,833 24,902 27,732
21,753
Wholesale and Retail Trade,
Accommodation and Restaurants
29,169
Finance and Insurance, Real
Estate and Business Services
Kewangan dan Insurans, Hartanah
dan Perkhidmatan Perniagaan
14,073 15,240 18,393 21,135 22,090 25,514
Other Services
Perkhidmatan-perkhidmatan Lain 5,685 6,011 6,368 6,917
Perkhidmatan Kerajaan 4,727 5,611 5,813 6,298
6,295
Government Services
3,762 3,181 3,279 4,492
186,548
KDNK Selangor mengikut Jenis Aktiviti Ekonomi, 2005-2013 pada Harga Malar 2005
- Perubahan Peratusan Tahunan & Pembahagian Peratus KDNK
JADUAL50
GDP for Selangor by Kind of Economic Activity, 2005-2013 at Constant 2005 Prices
TABLE - Annual Percentage Change & Percentage Share of GDP
113,185 118,819 128,169 139,877 164,751 176,377
Pembahagian Peratus KDNK
Percentage Share of GDP
2006f
2007f
2008f
2009f
2010f
2011f
2010f
2011f
2012e
Perubahan Peratusan Tahunan
Annual Percentage Change
2013p
Utiliti, Pengangkutan,
Penyimpanan dan Komunikasi
Utilities, Transport, Storage and
Communication
2012e
2005f
2006f
2007f
2008f
2009f
2013p
Perkhidmatan-perkhidmatan Lain
Other Services
Perkhidmatan Kerajaan
Government Services
5.0
Perdagangan Borong dan Runcit,
Penginapan dan Restoran
Wholesale and Retail Trade,
Accommodation and Restaurants
Kewangan dan Insurans, Hartanah
dan Perkhidmatan Perniagaan
Finance and Insurance, Real
Estate and Business Services
100.0 100.0100.0 100.0 100.0 100.0 100.0 100.07.9 9.1 -0.5 11.9 5.8 7.1
29,899
24,580
7,542
7,026
4,668
2,767
132
52,570
7,881
96,133
22,998
8,782
9,395
5.8 100.0
2013p
7,886
7,832
5,268
2,929
154
55,498
8,790
102,760
24,475
33,681
27,814
8,294
8,496
6,246
7,155
6,432
3,917
139,237 155,739
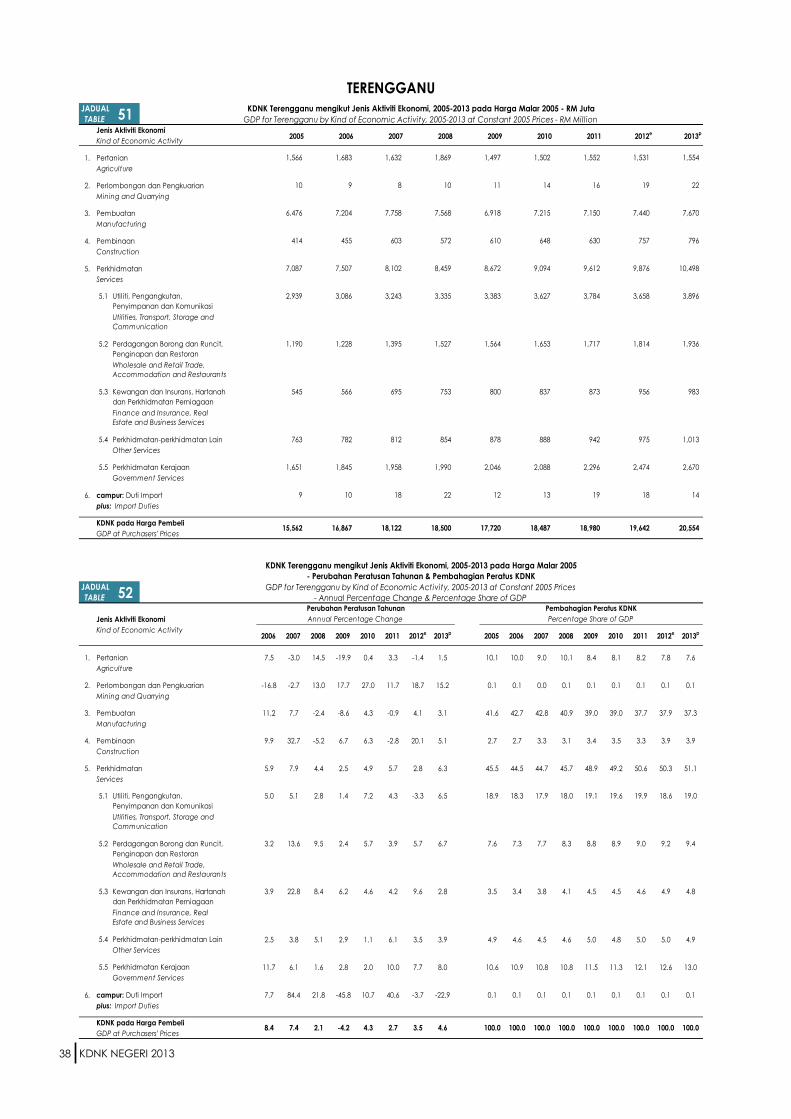
KDNK NEGERI 2013 38
Jenis Aktiviti Ekonomi
Kind of Economic Activity
1. Pertanian
Agriculture
2. Perlombongan dan Pengkuarian
Mining and Quarrying
3. Pembuatan
Manufacturing
4. Pembinaan
Construction
5. Perkhidmatan
Services
5.1
5.2
5.3
5.4
5.5
6. campur: Duti Import
plus: Import Duties
KDNK pada Harga Pembeli
GDP at Purchasers' Prices
Jenis Aktiviti Ekonomi
Kind of Economic Activity
1. Pertanian 7.5 -3.0 14.5 -19.9 0.4 3.3 -1.4 1.5 10.1 10.0 9.0 10.1 8.4 8.1 8.2 7.8 7.6
Agriculture
2. Perlombongan dan Pengkuarian -16.8 -2.7 13.0 17.7 27.0 11.7 18.7 15.2 0.1 0.1 0.0 0.1 0.1 0.1 0.1 0.1 0.1
Mining and Quarrying
3. Pembuatan 11.2 7.7 -2.4 -8.6 4.3 -0.9 4.1 3.1 41.6 42.7 42.8 40.9 39.0 39.0 37.7 37.9 37.3
Manufacturing
4. Pembinaan 9.9 32.7 -5.2 6.7 6.3 -2.8 20.1 5.1 2.7 2.7 3.3 3.1 3.4 3.5 3.3 3.9 3.9
Construction
5. Perkhidmatan 5.9 7.9 4.4 2.5 4.9 5.7 2.8 6.3 45.5 44.5 44.7 45.7 48.9 49.2 50.6 50.3 51.1
Services
5.1 5.0 5.1 2.8 1.4 7.2 4.3 -3.3 6.5 18.9 18.3 17.9 18.0 19.1 19.6 19.9 18.6 19.0
5.2 3.2 13.6 9.5 2.4 5.7 3.9 5.7 6.7 7.6 7.3 7.7 8.3 8.8 8.9 9.0 9.2 9.4
5.3 3.9 22.8 8.4 6.2 4.6 4.2 9.6 2.8 3.5 3.4 3.8 4.1 4.5 4.5 4.6 4.9 4.8
5.4 2.5 3.8 5.1 2.9 1.1 6.1 3.5 3.9 4.9 4.6 4.5 4.6 5.0 4.8 5.0 5.0 4.9
5.5 11.7 6.1 1.6 2.8 2.0 10.0 7.7 8.0 10.6 10.9 10.8 10.8 11.5 11.3 12.1 12.6 13.0
6. campur: Duti Import 7.7 84.4 21.8 -45.8 10.7 40.6 -3.7 -22.9 0.1 0.1 0.1 0.1 0.1 0.1 0.1 0.1 0.1
plus: Import Duties
KDNK pada Harga Pembeli
GDP at Purchasers' Prices
TERENGGANU
JADUAL51
KDNK Terengganu mengikut Jenis Aktiviti Ekonomi, 2005-2013 pada Harga Malar 2005 - RM Juta
TABLE GDP for Terengganu by Kind of Economic Activity, 2005-2013 at Constant 2005 Prices - RM Million
2011f
2012e
1,566 1,683 1,632 1,869
2005f
2006f
2007f
2008f
2009f
2010f
2013p
1,497
10 9 8 10
6,476 7,204 7,758 7,568 6,918
610 414 455 603 572
7,087 7,507 8,102 8,459 8,672
Utiliti, Pengangkutan,
Penyimpanan dan Komunikasi
2,939 3,086 3,243 3,335
1,564 1,717
Utilities, Transport, Storage and
Communication
Wholesale and Retail Trade,
Accommodation and Restaurants
Perdagangan Borong dan Runcit,
Penginapan dan Restoran
1,190 1,228 1,395 1,527
Kewangan dan Insurans, Hartanah
dan Perkhidmatan Perniagaan
545 566 695 753 800 873
Finance and Insurance, Real
Estate and Business Services
Other Services
Perkhidmatan-perkhidmatan Lain 763 782 812 854
Perkhidmatan Kerajaan 1,651 1,845 1,958 1,990
9 10 18 22
Government Services
15,562 16,867 18,122 18,500
Perubahan Peratusan Tahunan
Annual Percentage Change
2012e
KDNK Terengganu mengikut Jenis Aktiviti Ekonomi, 2005-2013 pada Harga Malar 2005
- Perubahan Peratusan Tahunan & Pembahagian Peratus KDNK
JADUAL52
GDP for Terengganu by Kind of Economic Activity, 2005-2013 at Constant 2005 Prices
TABLE - Annual Percentage Change & Percentage Share of GDP
Utiliti, Pengangkutan,
Penyimpanan dan Komunikasi
Utilities, Transport, Storage and
Communication
2012e
2005f
2006f
2007f
2008f
2009f
2013p
2006f
2007f
2008f
2009f
2010f
2011f
Perkhidmatan-perkhidmatan Lain
Other Services
Perkhidmatan Kerajaan
Government Services
8.4
Perdagangan Borong dan Runcit,
Penginapan dan Restoran
Wholesale and Retail Trade,
Accommodation and Restaurants
Kewangan dan Insurans, Hartanah
dan Perkhidmatan Perniagaan
Finance and Insurance, Real
Estate and Business Services
100.0 100.0100.0 100.0 100.0 100.0 100.0 100.07.4 2.1 -4.2 4.3 2.7 3.5 4.6
878
2,046
12
17,720 18,487 18,980 19,642
1,502
14
7,215
648
9,094
3,627
1,653
837
888
2,088
13
1,552
16
7,150
630
9,612
3,784
19
7,440
757
9,876
3,658
1,814
975
2,474
18
956
100.0
1,554
20,554
22
7,670
796
10,498
3,896
1,936
983
1,013
2,670
14
Pembahagian Peratus KDNK
Percentage Share of GDP
2010f
2011f
2013p
3,383
11
942
2,296
19
1,531

KDNK NEGERI 2013 39
Jenis Aktiviti Ekonomi
Kind of Economic Activity
1. Pertanian
Agriculture
2. Perlombongan dan Pengkuarian
Mining and Quarrying
3. Pembuatan
Manufacturing
4. Pembinaan
Construction
5. Perkhidmatan
Services
5.1
5.2
5.3
5.4
5.5
6. campur: Duti Import
plus: Import Duties
KDNK pada Harga Pembeli
GDP at Purchasers' Prices
Jenis Aktiviti Ekonomi
Kind of Economic Activity
1. Pertanian 2.7 5.7 -3.6 -3.8 -3.9 4.6 -5.1 1.5 29.8 29.0 29.7 25.8 23.7 22.2 22.9 20.8 20.6
Agriculture
2. Perlombongan dan Pengkuarian 3.4 -18.2 85.3 19.9 3.6 -16.5 9.9 2.0 15.8 15.5 12.3 20.5 23.5 23.7 19.5 20.6 20.4
Mining and Quarrying
3. Pembuatan 5.0 0.8 2.4 -7.7 4.7 5.8 0.3 3.1 9.7 9.7 9.4 8.7 7.7 7.8 8.2 7.9 7.9
Manufacturing
4. Pembinaan 10.5 -20.0 -2.0 6.9 19.1 7.5 13.6 -13.5 2.9 3.1 2.4 2.1 2.1 2.5 2.6 2.9 2.4
Construction
5. Perkhidmatan 8.3 11.3 2.2 5.0 5.1 8.4 6.5 5.0 41.4 42.5 45.8 42.3 42.4 43.3 46.3 47.4 48.3
Services
5.1 5.4 8.0 6.6 0.7 9.0 6.7 4.8 5.9 8.0 8.0 8.4 8.1 7.7 8.2 8.7 8.7 9.0
5.2 14.2 14.7 8.6 7.1 4.5 8.3 3.7 4.0 11.7 12.6 14.0 13.8 14.1 14.3 15.3 15.2 15.4
5.3 6.9 21.1 -12.3 7.2 7.7 8.9 9.7 2.0 8.6 8.7 10.2 8.1 8.3 8.7 9.3 9.8 9.7
5.4 1.4 3.7 5.8 3.8 2.7 4.4 2.9 4.6 4.4 4.3 4.3 4.1 4.1 4.1 4.2 4.1 4.2
5.5 8.1 3.6 3.2 4.0 0.9 11.7 11.5 9.2 8.6 8.8 8.9 8.3 8.2 8.1 8.9 9.5 10.1
6. campur: Duti Import -10.0 29.4 34.4 19.7 -18.5 -2.3 -1.7 -0.7 0.4 0.3 0.4 0.5 0.6 0.5 0.4 0.4 0.4
plus: Import Duties
KDNK pada Harga Pembeli
GDP at Purchasers' Prices
SABAH
JADUAL53
KDNK Sabah mengikut Jenis Aktiviti Ekonomi, 2005-2013 pada Harga Malar 2005 - RM Juta
TABLE GDP for Sabah by Kind of Economic Activity, 2005-2013 at Constant 2005 Prices - RM Million
2011f
2012e
9,647 9,908 10,474 10,095
2005f
2006f
2007f
2008f
2009f
2010f
2013p
9,713 9,333 9,763
9,635 9,981 5,133 5,305 4,338 8,037
3,149 3,308 3,333 3,412 3,149
950 1,050 840 823
13,421 14,537 16,185 16,548 17,371 18,249
3,176
Utilities, Transport, Storage and
Communication
Utiliti, Pengangkutan,
Penyimpanan dan Komunikasi
2,601 2,740 2,960 3,155
Perdagangan Borong dan Runcit,
Penginapan dan Restoran
3,787 4,323 4,960 5,387
Wholesale and Retail Trade,
Accommodation and Restaurants
Finance and Insurance, Real
Estate and Business Services
Kewangan dan Insurans, Hartanah
dan Perkhidmatan Perniagaan
2,792 2,986 3,615 3,170
Perkhidmatan-perkhidmatan Lain 1,439 1,459 1,513 1,600
Other Services
Government Services
Perkhidmatan Kerajaan 2,802 3,028 3,136 3,236
127 114 147 198
32,427 34,221 35,318 39,114 40,986 42,101 42,680 44,469
Perubahan Peratusan Tahunan
Annual Percentage Change
2013p
KDNK Sabah mengikut Jenis Aktiviti Ekonomi, 2005-2013 pada Harga Malar 2005
- Perubahan Peratusan Tahunan & Pembahagian Peratus KDNK
JADUAL54
GDP for Sabah by Kind of Economic Activity, 2005-2013 at Constant 2005 Prices
TABLE - Annual Percentage Change & Percentage Share of GDP
Utiliti, Pengangkutan,
Penyimpanan dan Komunikasi
Utilities, Transport, Storage and
Communication
2012e
2005f
2006f
2007f
2008f
2009f
2013p
2006f
2007f
2008f
2009f
2010f
2011f
Perkhidmatan-perkhidmatan Lain
Other Services
Perkhidmatan Kerajaan
Government Services
5.5
Perdagangan Borong dan Runcit,
Penginapan dan Restoran
Wholesale and Retail Trade,
Accommodation and Restaurants
Kewangan dan Insurans, Hartanah
dan Perkhidmatan Perniagaan
Finance and Insurance, Real
Estate and Business Services
100.0 100.0 100.0 100.0 100.0 100.03.2 10.7 4.8 2.7 1.4 4.2 3.0
1,048
3,296
1,661
3,364
237 193
3,393
1,706
3,662
6,027
3,461
3,399
5,770
189
9,269
9,167
3,496
1,280
21,071
3,872
6,770
1,832
4,226
186
8,339
3,486
1,127
19,777
3,693
6,529
3,986
100.0
9,411
45,791
4,371 4,460
9,349
3,605
1,107
22,134
4,101
7,043
1,916
4,613
184
100.0 100.0
Pembahagian Peratus KDNK
Percentage Share of GDP
2010f
2011f
2012e
880
1,780
3,789

KDNK NEGERI 2013 40
Jenis Aktiviti Ekonomi
Kind of Economic Activity
1. Pertanian
Agriculture
2. Perlombongan dan Pengkuarian
Mining and Quarrying
3. Pembuatan
Manufacturing
4. Pembinaan
Construction
5. Perkhidmatan
Services
5.1
5.2
5.3
5.4
5.5
6. campur: Duti Import
plus: Import Duties
KDNK pada Harga Pembeli
GDP at Purchasers' Prices
Jenis Aktiviti Ekonomi
Kind of Economic Activity
1. Pertanian -1.1 2.0 0.9 0.1 3.7 6.0 2.6 1.6 12.6 11.9 11.3 11.3 11.6 11.5 11.5 11.6 11.4
Agriculture
2. Perlombongan dan Pengkuarian 4.1 9.3 -6.7 -7.7 3.7 4.5 -8.0 6.1 26.9 26.8 27.0 25.1 23.7 23.5 23.2 21.1 21.5
Mining and Quarrying
3. Pembuatan 8.7 8.1 -1.6 -5.3 3.6 6.2 0.8 2.7 27.7 28.8 28.8 28.2 27.3 27.1 27.2 27.0 26.6
Manufacturing
4. Pembinaan 1.4 17.0 -2.4 7.8 9.9 -1.3 22.1 1.7 2.4 2.3 2.5 2.4 2.7 2.8 2.6 3.1 3.1
Construction
5. Perkhidmatan 3.7 9.3 7.9 4.0 5.1 7.2 6.3 5.3 30.1 29.8 30.1 32.4 34.4 34.7 35.1 36.8 37.2
Services
5.1 0.9 10.2 6.6 -0.2 6.7 5.1 5.5 5.3 7.2 7.0 7.1 7.5 7.7 7.8 7.8 8.1 8.2
5.2 4.1 15.5 12.4 4.7 4.2 7.4 4.4 4.3 7.4 7.4 7.8 8.8 9.4 9.4 9.5 9.8 9.8
5.3 4.3 8.6 10.0 5.5 7.8 6.2 8.3 3.8 7.3 7.3 7.3 8.0 8.6 8.9 9.0 9.6 9.5
5.4 3.7 3.9 4.1 3.8 3.7 6.6 3.6 5.3 3.3 3.3 3.1 3.3 3.4 3.4 3.5 3.5 3.6
5.5 6.1 3.6 1.9 7.0 0.8 11.9 9.6 9.5 4.9 4.9 4.7 4.8 5.3 5.1 5.4 5.8 6.1
6. campur: Duti Import -18.3 30.0 28.0 -7.5 4.4 -11.1 -7.3 -6.2 0.4 0.3 0.4 0.5 0.4 0.4 0.4 0.3 0.3
plus: Import Duties
KDNK pada Harga Pembeli
GDP at Purchasers' Prices
SARAWAK
JADUAL55
KDNK Sarawak mengikut Jenis Aktiviti Ekonomi, 2005-2013 pada Harga Malar 2005 - RM Juta
TABLE GDP for Sarawak by Kind of Economic Activity, 2005-2013 at Constant 2005 Prices - RM Million
2011f
2012e
7,278 7,199 7,346 7,415
2005f
2006f
2007f
2008f
2009f
2010f
7,423 8,157 7,695
15,190 16,469 15,757 15,493 16,136 17,638 16,465
1,708 1,853
15,987 17,375 18,774 18,472 17,490 19,237 18,117
1,877 1,368 1,387 1,623 1,585
17,346 17,982 19,659 21,222 22,074 24,866 23,201
4,917
Utilities, Transport, Storage and
Communication
Utiliti, Pengangkutan,
Penyimpanan dan Komunikasi
4,159 4,195 4,623 4,928
Perdagangan Borong dan Runcit,
Penginapan dan Restoran
4,255 4,431 5,117 5,753
Wholesale and Retail Trade,
Accommodation and Restaurants
Finance and Insurance, Real
Estate and Business Services
Kewangan dan Insurans, Hartanah
dan Perkhidmatan Perniagaan
4,221 4,403 4,783 5,261
Perkhidmatan-perkhidmatan Lain 1,900 1,970 2,047 2,132
Other Services
Government Services
Perkhidmatan Kerajaan 2,811 2,983 3,089 3,148
JADUAL56
GDP for Sarawak by Kind of Economic Activity, 2005-2013 at Constant 2005 Prices
TABLE - Annual Percentage Change & Percentage Share of GDP
57,700 60,265 65,283 65,470
2005f
2006f
2007f
2008f
2009f
Pembahagian Peratus KDNK
Percentage Share of GDP
2006f
2007f
2008f
2009f
2010f
2011f
2010f
2011f
2012e
2012e
8.3 0.3 -2.0 4.3 5.8 1.5 4.2
Perkhidmatan-perkhidmatan Lain
Other Services
Perkhidmatan Kerajaan
Government Services
4.4
Perdagangan Borong dan Runcit,
Penginapan dan Restoran
Wholesale and Retail Trade,
Accommodation and Restaurants
Kewangan dan Insurans, Hartanah
dan Perkhidmatan Perniagaan
Finance and Insurance, Real
Estate and Business Services
Utiliti, Pengangkutan,
Penyimpanan dan Komunikasi
Utilities, Transport, Storage and
Communication
6,747
5,515
100.0 100.0100.0 100.0 100.0 100.0 100.0 100.0
KDNK Sarawak mengikut Jenis Aktiviti Ekonomi, 2005-2013 pada Harga Malar 2005
- Perubahan Peratusan Tahunan & Pembahagian Peratus KDNK
229 187 243 312
15,154
19,400
2,212
3,370
288
64,173 66,947 70,849 71,879
3,398
301 268
3,804
2,446
5,246
6,281
5,981
2,294
248
4,168
2,534
6,880
7,041
6,354
2,263
5,820
5,548
6,026
100.0
2013p
Perubahan Peratusan Tahunan
Annual Percentage Change
2013p
2013p
74,887
8,501
26,444
16,083
19,926
2,301
27,844
6,132
7,340
7,138
2,668
4,565
233
8,371
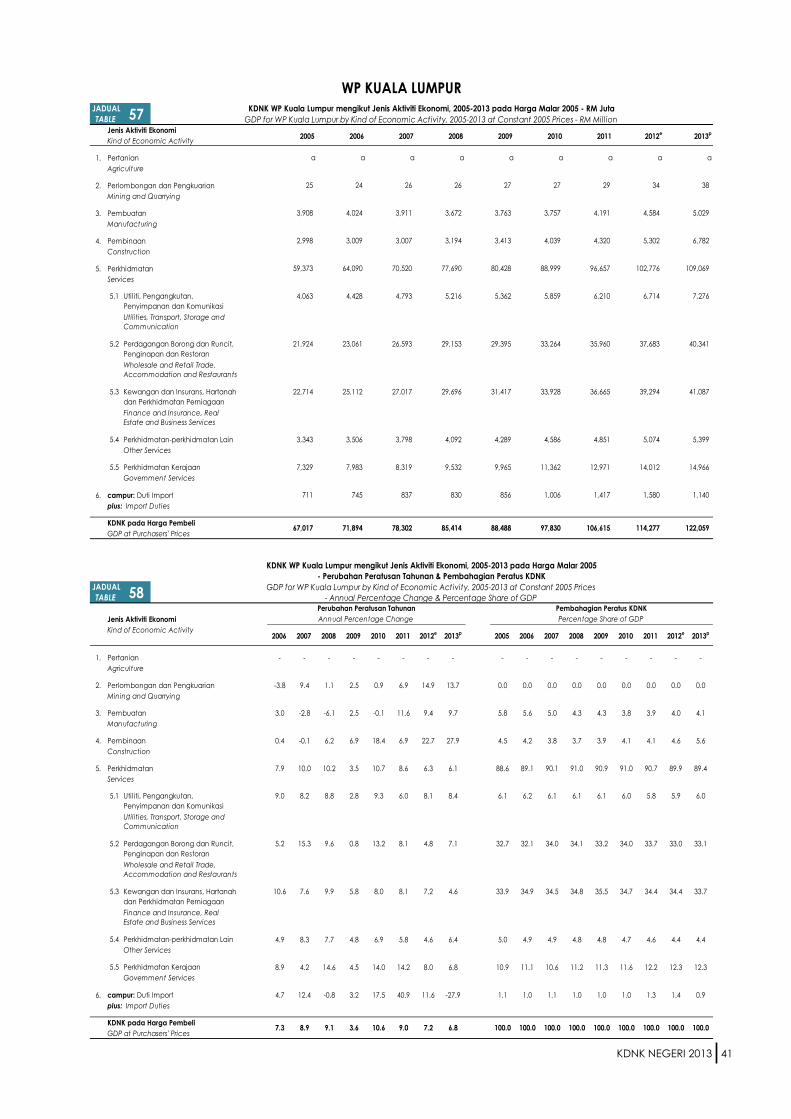
KDNK NEGERI 2013 41
Jenis Aktiviti Ekonomi
Kind of Economic Activity
1. Pertanian
Agriculture
2. Perlombongan dan Pengkuarian
Mining and Quarrying
3. Pembuatan
Manufacturing
4. Pembinaan
Construction
5. Perkhidmatan
Services
5.1
5.2
5.3
5.4
5.5
6. campur: Duti Import
plus: Import Duties
KDNK pada Harga Pembeli
GDP at Purchasers' Prices
Jenis Aktiviti Ekonomi
Kind of Economic Activity
1. Pertanian - - - - - - - - - - - - - - - - -
Agriculture -21.6 24.0 -13.5 -18.3 -21.1 5.8 7.6 8.5 0.0 0.0 0.0 0.0 0.0 0.0 0.0 0.0 0.0
2. Perlombongan dan Pengkuarian -3.8 9.4 1.1 2.5 0.9 6.9 14.9 13.7 0.0 0.0 0.0 0.0 0.0 0.0 0.0 0.0 0.0
Mining and Quarrying
3. Pembuatan 3.0 -2.8 -6.1 2.5 -0.1 11.6 9.4 9.7 5.8 5.6 5.0 4.3 4.3 3.8 3.9 4.0 4.1
Manufacturing
4. Pembinaan 0.4 -0.1 6.2 6.9 18.4 6.9 22.7 27.9 4.5 4.2 3.8 3.7 3.9 4.1 4.1 4.6 5.6
Construction
5. Perkhidmatan 7.9 10.0 10.2 3.5 10.7 8.6 6.3 6.1 88.6 89.1 90.1 91.0 90.9 91.0 90.7 89.9 89.4
Services
5.1 9.0 8.2 8.8 2.8 9.3 6.0 8.1 8.4 6.1 6.2 6.1 6.1 6.1 6.0 5.8 5.9 6.0
5.2 5.2 15.3 9.6 0.8 13.2 8.1 4.8 7.1 32.7 32.1 34.0 34.1 33.2 34.0 33.7 33.0 33.1
5.3 10.6 7.6 9.9 5.8 8.0 8.1 7.2 4.6 33.9 34.9 34.5 34.8 35.5 34.7 34.4 34.4 33.7
5.4 4.9 8.3 7.7 4.8 6.9 5.8 4.6 6.4 5.0 4.9 4.9 4.8 4.8 4.7 4.6 4.4 4.4
5.5 8.9 4.2 14.6 4.5 14.0 14.2 8.0 6.8 10.9 11.1 10.6 11.2 11.3 11.6 12.2 12.3 12.3
6. campur: Duti Import 4.7 12.4 -0.8 3.2 17.5 40.9 11.6 -27.9 1.1 1.0 1.1 1.0 1.0 1.0 1.3 1.4 0.9
plus: Import Duties
KDNK pada Harga Pembeli
GDP at Purchasers' Prices
1
a a a a a a a a
1
2009f
2010f
1 1
2013p
1
a
WP KUALA LUMPUR
JADUAL57
KDNK WP Kuala Lumpur mengikut Jenis Aktiviti Ekonomi, 2005-2013 pada Harga Malar 2005 - RM Juta
TABLE GDP for WP Kuala Lumpur by Kind of Economic Activity, 2005-2013 at Constant 2005 Prices - RM Million
2011f
2012e
2 2 2 2
2005f
2006f
2007f
2008f
29 27 25 24 26 26
3,908 4,024 3,911 3,672 3,763 4,191 3,757
3,413 4,320 4,039 2,998 3,009 3,007 3,194
59,373 64,090 70,520 77,690 80,428
Utiliti, Pengangkutan,
Penyimpanan dan Komunikasi
4,063 4,428 4,793 5,216
29,395
Utilities, Transport, Storage and
Communication
Wholesale and Retail Trade,
Accommodation and Restaurants
Perdagangan Borong dan Runcit,
Penginapan dan Restoran
21,924 23,061 26,593 29,153
Kewangan dan Insurans, Hartanah
dan Perkhidmatan Perniagaan
22,714 25,112 27,017 29,696 31,417
Finance and Insurance, Real
Estate and Business Services
Other Services
Perkhidmatan-perkhidmatan Lain 3,343 3,506 3,798 4,092
Perkhidmatan Kerajaan 7,329 7,983 8,319 9,532
Government Services
JADUAL58
GDP for WP Kuala Lumpur by Kind of Economic Activity, 2005-2013 at Constant 2005 Prices
TABLE - Annual Percentage Change & Percentage Share of GDP
67,017 71,894 78,302 85,414 122,059
Utilities, Transport, Storage and
Communication
2012e
2005f
2006f
2007f
2008f
2009f
Pembahagian Peratus KDNK
Percentage Share of GDP
2006f
2007f
2008f
2009f
2010f
2011f
2010f
2011f
2012e
Perubahan Peratusan Tahunan
Annual Percentage Change
2013p
2013p
711 745 837
8.9 9.1 3.6 10.6 9.0 7.2 6.87.3
830
100.0 100.0 100.0 100.0 100.0 100.0
KDNK WP Kuala Lumpur mengikut Jenis Aktiviti Ekonomi, 2005-2013 pada Harga Malar 2005
- Perubahan Peratusan Tahunan & Pembahagian Peratus KDNK
Perkhidmatan-perkhidmatan Lain
Other Services
Perkhidmatan Kerajaan
Government Services
Perdagangan Borong dan Runcit,
Penginapan dan Restoran
Wholesale and Retail Trade,
Accommodation and Restaurants
Kewangan dan Insurans, Hartanah
dan Perkhidmatan Perniagaan
Finance and Insurance, Real
Estate and Business Services
Utiliti, Pengangkutan,
Penyimpanan dan Komunikasi
38
5,029
6,782
109,069
7,276
40,341
41,087
5,399
14,966
4,289
9,965
856
88,488 97,830 106,615
34
4,584
5,302
5,362 6,210
96,657 88,999
5,859
33,264
33,928
102,776
6,714
37,683
39,294
5,074
36,665
35,960
27
100.0
14,012
1,580
114,277
11,362
1,006 1,417
12,971
4,851 4,586
1,140
100.0 100.0
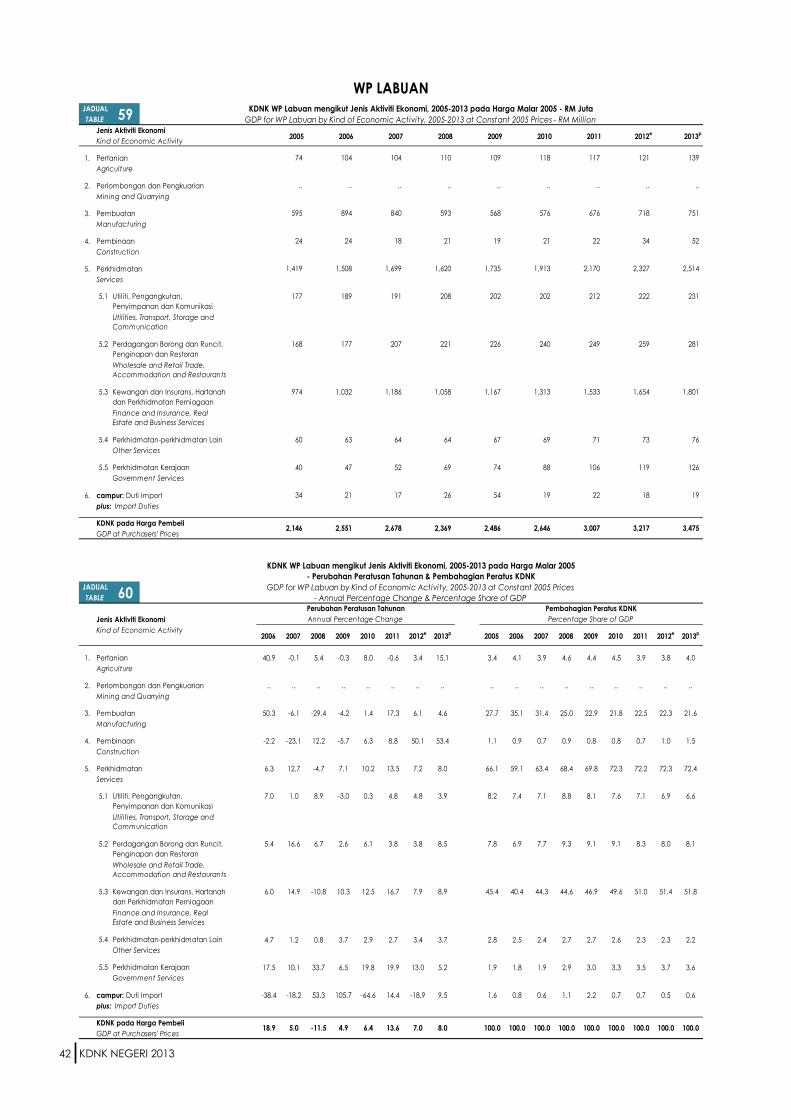
KDNK NEGERI 2013 42
Jenis Aktiviti Ekonomi
Kind of Economic Activity
1. Pertanian
Agriculture
2. Perlombongan dan Pengkuarian
Mining and Quarrying
3. Pembuatan
Manufacturing
4. Pembinaan
Construction
5. Perkhidmatan
Services
5.1
5.2
5.3
5.4
5.5
6. campur: Duti Import
plus: Import Duties
KDNK pada Harga Pembeli
GDP at Purchasers' Prices
Jenis Aktiviti Ekonomi
Kind of Economic Activity
1. Pertanian 40.9 -0.1 5.4 -0.3 8.0 -0.6 3.4 15.1 3.4 4.1 3.9 4.6 4.4 4.5 3.9 3.8 4.0
Agriculture
2. Perlombongan dan Pengkuarian .. .. .. .. .. .. .. .. .. .. .. .. .. .. .. .. ..
Mining and Quarrying
3. Pembuatan 50.3 -6.1 -29.4 -4.2 1.4 17.3 6.1 4.6 27.7 35.1 31.4 25.0 22.9 21.8 22.5 22.3 21.6
Manufacturing
4. Pembinaan -2.2 -23.1 12.2 -5.7 6.3 8.8 50.1 53.4 1.1 0.9 0.7 0.9 0.8 0.8 0.7 1.0 1.5
Construction
5. Perkhidmatan 6.3 12.7 -4.7 7.1 10.2 13.5 7.2 8.0 66.1 59.1 63.4 68.4 69.8 72.3 72.2 72.3 72.4
Services
5.1 7.0 1.0 8.9 -3.0 0.3 4.8 4.8 3.9 8.2 7.4 7.1 8.8 8.1 7.6 7.1 6.9 6.6
5.2 5.4 16.6 6.7 2.6 6.1 3.8 3.8 8.5 7.8 6.9 7.7 9.3 9.1 9.1 8.3 8.0 8.1
5.3 6.0 14.9 -10.8 10.3 12.5 16.7 7.9 8.9 45.4 40.4 44.3 44.6 46.9 49.6 51.0 51.4 51.8
5.4 4.7 1.2 0.8 3.7 2.9 2.7 3.4 3.7 2.8 2.5 2.4 2.7 2.7 2.6 2.3 2.3 2.2
5.5 17.5 10.1 33.7 6.5 19.8 19.9 13.0 5.2 1.9 1.8 1.9 2.9 3.0 3.3 3.5 3.7 3.6
6. campur: Duti Import -38.4 -18.2 53.3 105.7 -64.6 14.4 -18.9 9.5 1.6 0.8 0.6 1.1 2.2 0.7 0.7 0.5 0.6
plus: Import Duties
KDNK pada Harga Pembeli
GDP at Purchasers' Prices100.0 100.0100.0 100.0 100.0 100.0 100.0 100.05.0 -11.5 4.9 6.4 13.6 7.0 8.0
Perkhidmatan-perkhidmatan Lain
Other Services
Perkhidmatan Kerajaan
Government Services
18.9
Perdagangan Borong dan Runcit,
Penginapan dan Restoran
Wholesale and Retail Trade,
Accommodation and Restaurants
Kewangan dan Insurans, Hartanah
dan Perkhidmatan Perniagaan
Finance and Insurance, Real
Estate and Business Services
Utiliti, Pengangkutan,
Penyimpanan dan Komunikasi
Utilities, Transport, Storage and
Communication
2012e
2005f
2006f
2007f
2008f
2009f
Pembahagian Peratus KDNK
Percentage Share of GDP
2006f
2007f
2008f
2009f
2010f
2011f
2010f
2011f
2012e
KDNK WP Labuan mengikut Jenis Aktiviti Ekonomi, 2005-2013 pada Harga Malar 2005
- Perubahan Peratusan Tahunan & Pembahagian Peratus KDNK
JADUAL60
GDP for WP Labuan by Kind of Economic Activity, 2005-2013 at Constant 2005 PricesTABLE - Annual Percentage Change & Percentage Share of GDP
2,146 2,551 2,678 2,369
34 21 17 26
Perkhidmatan Kerajaan 40 47 52 69
Government Services
Other Services
Perkhidmatan-perkhidmatan Lain 60 63 64 64
Finance and Insurance, Real
Estate and Business Services
Kewangan dan Insurans, Hartanah
dan Perkhidmatan Perniagaan
974 1,032 1,186 1,058
Wholesale and Retail Trade,
Accommodation and Restaurants
Utilities, Transport, Storage and
Communication
Perdagangan Borong dan Runcit,
Penginapan dan Restoran
168 177 207 221
1,735 2,170
Utiliti, Pengangkutan,
Penyimpanan dan Komunikasi
177 189 191 208 202 212
1,913
202
1,419 1,508 1,699 1,620
676
24 24 18 21 19 22
595 894 840 593 568 576
21
.. .. ...... .. .. ..
WP LABUANJADUAL
59KDNK WP Labuan mengikut Jenis Aktiviti Ekonomi, 2005-2013 pada Harga Malar 2005 - RM Juta
TABLE GDP for WP Labuan by Kind of Economic Activity, 2005-2013 at Constant 2005 Prices - RM Million
2011f
2012e
74 104 104 110
2005f
2006f
2007f
2008f
2009f
2010f
109 117 118
240
1,313
69
222
259
1,654
73 67
74
71
1,533
249 226
1,167
54
2,486 2,646 3,007 3,217
88
19 22
106
100.0
119
18
2013p
Perubahan Peratusan Tahunan
Annual Percentage Change
2013p
2013p
139
..
751
3,475
52
2,514
231
281
1,801
76
126
19
121
718
34
2,327
NOTA TEKNIKAL
TECHNICAL NOTES
KDNK NEGERI 2013 I GDP BY STATE 2013
3

KDNK NEGERI 2013
NOTA TEKNIKAL
43
1. PENGENALAN
2. KONSEP KELUARAN
DALAM NEGERI KASAR
2.1 Pendekatan
Pengeluaran
Penyusunan Keluaran Dalam Negeri Kasar (KDNK) mengikut
Negeri di Malaysia merangkumi 13 buah negeri,
WP Kuala Lumpur (termasuk WP Putrajaya) dan WP Labuan.
Penerbitan ini menyediakan anggaran tahunan pada harga
malar 2005 bagi tahun 2005 hingga 2013 mengikut kaedah
pengeluaran. Konsep dan kaedah yang digariskan adalah
berasaskan System of National Accounts 1993 (1993 SNA) dan
beberapa saranan daripada System of National Accounts
2008 (2008 SNA) yang ditakrifkan oleh Pertubuhan Bangsa-
Bangsa Bersatu.
KDNK boleh diukur dengan menggunakan tiga kaedah iaitu,
Kaedah Pengeluaran (penjumlahan nilai ditambah),
Perbelanjaan (penjumlahan perbelanjaan akhir) dan
Pendapatan (penjumlahan pendapatan yang diagihkan oleh
unit pengeluar residen). Walau bagaimanapun, penerbitan ini
hanya menumpu kepada Kaedah Pengeluaran sahaja.
Pada asasnya KDNK ialah konsep nilai ditambah. Ia adalah
jumlah nilai ditambah bagi semua pengeluar residen ditambah
dengan cukai dan ditolak subsidi atas produk yang tidak
termasuk dalam pengiraan output.
KDNK berasaskan pendekatan pengeluaran (output) boleh
didefinisikan sebagai jumlah nilai barangan dan perkhidmatan
yang dikeluarkan di Malaysia setelah ditolak dengan
barangan dan perkhidmatan yang digunakan dalam proses
pengeluaran (penggunaan perantaraan) sebelum ditolak
penggunaan modal tetap.
Kaedah ini turut dikenali sebagai kaedah nilai ditambah
kerana ia bersamaan dengan penjumlahan nilai ditambah
iaitu jumlah perbezaan di antara nilai output kasar unit
pengeluaran residen (yang diukur dalam harga pengeluar)
dengan nilai penggunaan perantaraan (yang diukur dalam
nilai pembeli) dan ditambah dengan duti import. Perbezaan di
antara output kasar dengan penggunaan perantaraan
adalah nilai ditambah. Kaedah ini akan dapat menunjukkan
sumbangan setiap aktiviti ekonomi terhadap keseluruhan
KDNK.
KDNK NEGERI 2013
NOTA TEKNIKAL
44
2.2 Pusat Kepentingan
Ekonomi Utama
2.3 Supra State
Unit pengeluaran dianggap sebagai residen yang mana;
individu atau isi rumah yang tinggal atau menetap di sesebuah
negeri bagi tempoh tidak kurang dari satu tahun, manakala
bagi pertubuhan pula ialah apabila ia mengekalkan pusat
kepentingan ekonominya di wilayah ekonomi negeri tersebut
sepanjang tempoh rujukan berkenaan. Wilayah ekonomi
adalah terdiri daripada mana-mana kawasan geografi yang
ditadbir oleh Kerajaan Negeri, di mana orang, barang,
perkhidmatan, dan modal adalah bergerak secara bebas.
KDNK pada harga pasaran/pembeli mewakili keputusan akhir
daripada aktiviti pengeluaran oleh unit pengeluar residen.
Sesuatu unit institusi dianggap residen bagi sesebuah wilayah
ekonomi apabila wujudnya perkaitan yang kuat antara unit
institusi tersebut di wilayah ekonomi tertentu, dengan kata lain,
pusat kepentingan ekonomi utama (2008 SNA).
Pusat Kepentingan Ekonomi Utama merangkumi kawalan
efektif sesebuah kerajaan negeri terhadap aktiviti ekonomi
yang dilakukan khususnya ke atas hak pemilikan. Wilayah
ekonomi adalah termasuk tanah, ruang udara, pengairan, hak
ke atas perikanan, minyak atau mineral. Biasanya, kawalan
efektif kerajaan negeri boleh dilihat melalui pemberian lesen,
kawalan operasi dan sebagainya.
Sesuatu unit institusi mempunyai pusat kepentingan ekonomi
yang dominan dalam sesebuah wilayah ekonomi apabila
wujudnya lokasi, tempat kediaman, tempat pengeluaran atau
lain-lain premis. Setiap unit tersebut terlibat dalam aktiviti
ekonomi dan transaksi berskala besar bagi satu tempoh masa
yang panjang.
Berdasarkan System of National Accounts 1993, terdapat tiga
jenis unit institusi iaitu yang mempunyai pusat kepentingan
ekonomi dan kebanyakan aktiviti adalah di dalam lingkungan
satu wilayah; unit pelbagai wilayah dengan pusat
kepentingannya di beberapa wilayah tetapi bukan seluruh
negara; dan unit yang beroperasi pada peringkat nasional,
KDNK NEGERI 2013
NOTA TEKNIKAL
45
2.4 KDNK pada Harga
Malar
3. SKOP DAN LIPUTAN
iaitu pusat kepentingannya tidak boleh dikaitkan dengan
kedudukan geografi (Supra State).
Supra State pada peringkat negeri adalah bersamaan dengan
organisasi luar wilayah pada peringkat nasional. Di Malaysia,
Supra State merangkumi aktiviti pengeluaran yang melangkaui
pusat kepentingan ekonomi utama bagi mana-mana negeri.
KDNK pada harga malar adalah nilai KDNK tanpa kesan harga
berdasarkan tingkat harga terpilih pada tahun rujukan/asas.
Sebagai satu kaedah mengukur pengeluaran, KDNK mengukur
jumlah nilai pengeluaran barangan dan perkhidmatan oleh
residen sesebuah negara dalam tempoh tertentu sebelum
ditolak peruntukan untuk penggunaan modal tetap.
Pengukuran nilai barangan dan perkhidmatan dalam bentuk
wang (Ringgit Malaysia) bergantung kepada perubahan
harga dan kuantiti. Pengasingan kesan harga daripada
penganggaran nilai adalah penting bagi membolehkan
perbandingan sebenar iaitu perubahan tingkat/kuantiti
barang dan perkhidmatan yang berlaku dalam aktiviti
ekonomi dapat diukur.
Kaedah deflasi yang terbahagi kepada deflasi tunggal dan
deflasi berganda digunakan untuk mendapatkan siri harga
malar. Kaedah deflasi tunggal mengeluarkan pengaruh harga
daripada output atau input yang telah dianggarkan
manakala kaedah deflasi berganda pula mengeluarkan
pengaruh harga daripada kedua-dua output dan input. Oleh
yang demikian nilai ditambah adalah perbezaan daripada
hasil tolak output dan input. Kaedah deflasi berganda
digunakan secara meluas dalam KDNK bagi kaedah
pengeluaran.
Penyusunan KDNK Mengikut Negeri mengguna pakai Klasifikasi
Standard Perindustrian Malaysia (MSIC) 2000 sebagai asas
penyusunan. Ini adalah sejajar dengan liputan banci dan
penyiasatan yang dijalankan oleh Jabatan Perangkaan
Malaysia. MSIC 2000 adalah berasaskan ISIC Rev. 3.
KDNK NEGERI 2013
NOTA TEKNIKAL
46
4. SEMAKAN DAN
PENYELARASAN
Walau bagaimanapun, bagi tujuan penyusunan ini, aktiviti
ekonomi telah diagregatkan mengikut kesediaan data.
Penerbitan ini memberikan anggaran dan jadual terbitan dari
tahun 2005 hingga 2013. Anggaran tersebut adalah
berdasarkan penyiasatan/banci tahunan/dwi-tahunan dan
akaun syarikat/perusahaan individu sehingga tahun 2012.
Untuk tahun 2013 dan sebahagian aktiviti ekonomi untuk tahun
2012, anggaran adalah berdasarkan kepada sumber data
suku tahunan. Siri ini akan dikemaskini setiap tahun dan
sebarang perubahan dalam metodologi dan sumber data
akan diperjelaskan.
KDNK Mengikut Negeri diterbitkan dalam tiga versi untuk
tempoh masa tertentu. Dua versi sementara disusun sebelum
versi muktamad diterbitkan. Versi pertama anggaran
permulaan diterbitkan sepuluh bulan selepas tahun rujukan
berdasarkan akaun negara tahunan. Anggaran ini disemak
dalam dua versi berikutnya selepas data penyiasatan/banci
tahunan/dwi-tahunan dan akaun syarikat/perusahaan individu
diperoleh.
KDNK NEGERI 2013
TECHNICAL NOTES
47
1. INTRODUCTION
2. CONCEPTS OF GROSS
DOMESTIC PRODUCT
2.1 Production Approach
The compilation of Gross Domestic Product (GDP) by state in
Malaysia covers 13 states, WP Kuala Lumpur (includes
WP Putrajaya) and WP Labuan. This publication is compiled
annually at constant 2005 price for reference years 2005 to
2013 based on production approach. The concepts and
guidelines are based on the System of National Accounts 1993
(1993 SNA) and selected recommendation from System of
National Accounts 2008 (2008 SNA) defined by the United
Nations.
GDP can be measured by using three approaches namely,
production approach (the sum of value added), expenditure
approach (the sum of final expenditure) and income
approach (the sum of income distributed by resident producer
unit). However, this publication focuses on production
approach only.
Basically GDP is a concept of value added. It is a total value
added of all resident producer plus taxes and minus subsidies
on products which are excluded in the calculation of output.
GDP based on production approach (output) can be defined
as the sum of value of goods and services produced in
Malaysia after subtracting goods and services used in the
production process (intermediate consumption) before
deducting the consumption of fixed capital.
This approach is also known as value added approach
because it is equal to the summation of value added, that is,
total differences between gross output value of resident
producing unit (measured at producer price) and value of
intermediate consumption (measured at purchaser’s price)
and added with import duties. Difference between gross
output and intermediate consumption is value added. This
approach will be able to show the contribution of each
economic activity on overall GDP.
KDNK NEGERI 2013
TECHNICAL NOTES
48
2.2 Predominant
Economic Interest
2.3 Supra State
A production unit is regarded as resident; an individual or
household stays or resides in a certain states for a period not
less than one year, while for an establishment is when it retains
its central economic interest in economic territory of the states
for the whole reference period. Economic territory comprises
any geographic area administered by the States Government,
whereby persons, goods, services and capital move
independently. GDP at market/purchaser’s price represents
final result from production activities of resident production unit.
The residence of each institutional unit is the economic territory
with which it has the strongest connection, in other words, its
centre of predominant economic interest (2008 SNA).
Predominant Economic Interest incorporates effective
economic control of a single government in terms of rights to
ownership. The economic territory includes the land area,
airspace, territorial waters, including jurisdiction over fishing
rights and rights to fuels or minerals. Generally, effective control
by the government can be seen through license approval,
control on operation and so on.
An institutional unit has a centre of predominant economic
interest in an economic territory when there exists, within the
economic territory, some locations, dwellings, place of
productions, or other premises on which or from which the unit
engages and intends to continue engaging, either indefinitely
or over a finite but long period of time, in economic activities
and transactions on a significant scale.
The 1993 SNA has identified three types of institutional units, e.g.
those with centre of interest in and most of its activities
confined to one region; multi-regional units with centre of
interest in more than one region, but does not relate to the
entire country; and units functioning at a national dimension –
whose centre of interest cannot be attached to geographical
domains of the country (Supra State).
KDNK NEGERI 2013
TECHNICAL NOTES
49
2.4 GDP at Constant Price
3. SCOPE AND COVERAGE
Supra state territory at the state level is equivalent to extra-
territorial organizations at the national level. In the case of
Malaysia, Supra State covers production activities that are
beyond the centre of predominant economic interest for any
state.
GDP estimation at real price is the value of GDP without price
effect, based on the selected price level at reference year/
base. As a method of measuring production, GDP measures
total production values of goods and services by residents of a
state in a certain period before deducting the allocation for
consumption of fixed capital.
Measurement of goods and services in value of money (Ringgit
Malaysia) depends on the changes of price and quantity.
Isolation of price change effect from estimation value is
important to allow the actual comparison, which is the change
in level/volume of goods and services from economic activity.
The direct deflation method which consists of single deflation
and double deflation is used to obtain real price series. The
single deflation method takes out the price effect from the
output or the input, while double deflation method takes out
the price effect from both output and input. Hence, value
added is derived as the residual from output and input. Double
deflation method is widely used in GDP for production
approach.
Malaysia Standard Industrial Classification (MSIC) 2000 is used
as a base of GDP by States compilation. This is in line with
censuses and surveys conducted by Department of Statistics
Malaysia. MSIC 2000 conforms with the ISIC Rev.3.
However, for this compilation, economic activities have been
aggregated due to the availability of data.
KDNK NEGERI 2013
TECHNICAL NOTES
50
4. REVISIONS AND
RECONCILIATION
This publication presents estimates and derived tables for the
years 2005 to 2013. Estimates are based on annual/biennial
surveys/census and individual company/enterprise accounts
up to year 2012. For year 2013 and in some economic activities
for 2012, the estimates are based on quarterly sources.
This series will be updated annually and any changes in
methodology and data sources will be elaborated.
The GDP by state for a specific time is published in three
versions. Two provisional versions of the estimates are compiled
before the final version is published. The first preliminary
estimation version is published ten months after the reference
year and is based on the annual national accounts. These
results are revised in the subsequent versions after the data
from annual/biennial surveys/census and individual company/
enterprise accounts are made available.
METODOLOGI
METHODOLOGY
KDNK NEGERI 2013 I GDP BY STATE 2013
4

KDNK NEGERI 2013
METODOLOGI
51
KELUARAN DALAM
NEGERI KASAR (KDNK)
OUTPUT
INPUT PERANTARAAN
NILAI DITAMBAH
KDNK adalah jumlah nilai barangan dan perkhidmatan yang
dikeluarkan di Malaysia yang tidak termasuk pengiraan dua
kali, dalam tempoh tertentu selepas ditolak kos barangan dan
perkhidmatan yang digunakan dalam proses pengeluaran.
Nilai ini merupakan nilai sebelum ditolak nilai peruntukan bagi
modal tetap; iaitu jumlah nilai ditambah pada nilai pengeluar
bagi pengeluar residen ditambah dengan duti import.
KDNK merupakan sistem perakaunan catatan beregu dan di
dalam penerbitan ini, ianya menggunakan kaedah berikut:
(a) Jumlah nilai ditambah kasar bagi semua pengeluar
yang terlibat dalam ekonomi; atau
(b) Perbezaan antara output kasar bagi semua pengeluar
tolak input perantaraan.
Output ialah nilai barangan dan perkhidmatan yang
dikeluarkan. Ini termasuk pengeluaran untuk pasaran,
pengeluaran untuk kegunaan sendiri dan pengeluaran bukan
pasaran (kerajaan dan institusi swasta bukan berasaskan
keuntungan yang memberi perkhidmatan kepada isi rumah).
Pengeluaran barangan dan perkhidmatan tidak semestinya
untuk dijual atau perolehan syarikat/pertubuhan.
Input perantaraan ialah nilai barangan dan perkhidmatan
yang digunakan (sebagai input) dalam proses pengeluaran
barang dan perkhidmatan yang tidak termasuk gaji dan upah,
susut nilai daripada modal dan faedah bersih yang dibayar.
Nilai ditambah ialah perbezaan di antara output dan input
perantaraan. Ia merupakan pertambahan nilai ditambah
terhadap barangan dan perkhidmatan hasil daripada aktiviti
perindustrian. Oleh itu, ia hampir menyamai dengan
Penyusunan data akaun negara yang ditunjukkan dalam penerbitan ini meliputi beberapa
perkara daripada sistem perakaunan negara yang merekodkan semua aktiviti ekonomi. Sistem
perakaunan negara meliputi pengeluaran, perbelanjaan, penjanaan dan pengagihan
pendapatan, pembiayaan, tabungan dan pelaburan bagi keseluruhan ekonomi. Sistem
perakaunan ini ditakrifkan oleh Bangsa-Bangsa Bersatu dan transaksi yang diberikan adalah
mengikut panduan System of National Accounts 1993 (1993 SNA) dan 2008 (2008 SNA).
KDNK Σ Nilai Ditambah Kasar
Output Input Nilai Ditambah
KDNK NEGERI 2013
METODOLOGI
52
CUKAI
Cukai Tidak Langsung
Cukai Langsung
PERUBAHAN DAN
PENAMBAHBAIKAN
keuntungan perniagaan, gaji dan upah, susut nilai dan cukai
tidak langsung campur faedah yang dibayar dan tolak
faedah yang diterima.
Di dalam perakaunan negara, cukai dinyatakan dalam dua
bentuk iaitu :
Cukai tidak langsung yang dianggap sebagai kos
pengeluaran, oleh itu ia dicampurkan pada nilai barangan
dan perkhidmatan. Ia dianggap sebagai sebahagian
daripada komponen nilai ditambah. Cukai tidak langsung
termasuklah cukai jualan, cukai nilai ditambah, duti eksais,
cukai pintu, dan lain-lain.
Cukai langsung ialah cukai ke atas keuntungan atau
pendapatan. Ia merupakan pengagihan semula pendapatan
dari sektor swasta kepada sektor kerajaan dan bukan dalam
bentuk kos pengeluaran. Dalam konteks Malaysia cukai
langsung yang utama ialah cukai pendapatan.
(i) Penambahbaikan dalam metodologi penyusunan dan
sumber data
Penyusunan Jadual Supply and Use telah memberi satu
tanda aras baru bagi nilai KDNK bagi tahun 2005. Secara
prinsipnya data ini dijadikan sebagai asas perubahan
nilai KDNK yang dibuat. Di samping itu, beberapa industri
dan komponen perbelanjaan telah dikaji semula dari segi
metodologi dan sumber.
(a) Utiliti
Secara konsepnya sebarang kehilangan dan
pembaziran di dalam pengeluaran dan semasa
pengedaran tidak dianggap sebagai output. Bagi
kes utiliti, jumlah janaan elektrik tidak
menggambarkan jumlah output sebenar
memandangkan terdapat pembaziran dan
kehilangan sepanjang proses pengedarannya
kepada pengguna. Oleh itu, jumlah kuantiti jualan
digunakan sebagai penggerak untuk memberi
gambaran sebenar industri ini.
(b) Pertanian
Selain daripada hasil tanaman, output pertanian
juga termasuk anggaran bagi tanaman yang
belum mengeluarkan hasil. Dalam hal ini, tanaman
KDNK NEGERI 2013
METODOLOGI
53
PEMBANGUNAN MASA
HADAPAN
yang boleh mengeluarkan hasil berulang kali seperti
kelapa sawit, getah, koko, kelapa, buah-buahan,
teh dan kopi akan dikategorikan sebagai modal
tetap sementara tanaman yang mengeluarkan
hasil hanya sekali seperti pokok balak, sayur-sayuran
dan bijirin akan dikategorikan sebagai inventori.
Bagi kes tanaman yang dikategorikan sebagai
modal tetap, penambahbaikan dilakukan dengan
mengambil kira kos tanaman bagi setiap tahun
sebelum tanaman tersebut mengeluarkan hasil.
Data kos ini diperolehi dari agensi berkaitan.
Sebelum ini anggaran kos dibuat berdasarkan
struktur input tanaman berkenaan.
(c) Perdagangan Borong dan Runcit
Banci Perdagangan Edaran bagi tahun rujukan
2008 telah memberi satu tanda aras baru kepada
penganggaran aktiviti perdagangan borong dan
runcit. Data ini telah diambil kira di dalam
pengasasan semula KDNK.
(ii) Penambahbaikan dalam klasifikasi
Aktiviti berkaitan stok broker sama ada yang dijalankan
oleh institusi perbankan atau institusi kewangan yang lain
telah dikategorikan di bawah subsektor Kewangan.
Sebelum ini aktiviti ini dikategorikan di bawah subsektor
Perkhidmatan Perniagaan. Aktiviti-aktiviti tersebut adalah:
67121 Broker stok, saham dan bon
67122 Broker dan peniaga komoditi
67191 Perkhidmatan tukaran wang asing
67199 Aktiviti sokongan kepada kewangan t.t.t.l.
Maklumat dalam penerbitan ini menerangkan kaedah-kaedah
yang digunakan sehingga kini. Walau bagaimanapun, apabila
terdapat sumber data baru, analisis lanjut akan dibuat untuk
memperbaiki kaedah yang digunakan. Oleh yang demikian,
adalah dijangkakan perubahan terhadap kaedah akan
dilakukan secara berterusan. Perubahan-perubahan
seumpama ini akan diperkenalkan bagi mengekalkan
kesinambungan data siri masa.
KDNK NEGERI 2013
METODOLOGI
INDUSTRI METODOLOGI
54
GETAH
KELAPA SAWIT
TERNAKAN
PERTANIAN LAIN
Output pada harga malar diperoleh dengan menggunakan
kuantiti pengeluaran getah dan maklumat harga mengikut
negeri.
Anggaran input perantaraan pada harga malar diperoleh
dengan menggunakan nisbah input-output tahun 2005. Nisbah
ini dikemas kini berdasarkan data terkini. Selain itu nilai FISIM
turut diambil kira sebagai input perantaraan. Nilai ditambah
adalah hasil perbezaan antara output dan input perantaraan.
Output pada harga malar diperoleh dengan menggunakan
kuantiti pengeluaran mengikut negeri dan maklumat harga
sawit mengikut zon.
Anggaran input perantaraan pada harga malar diperoleh
dengan menggunakan nisbah input-output tahun 2005. Nisbah
ini dikemas kini berdasarkan data terkini. Selain itu nilai FISIM
turut diambil kira sebagai input perantaraan. Nilai ditambah
adalah hasil perbezaan antara output dan input perantaraan.
Nilai output diperoleh dengan menggunakan maklumat
kuantiti dan harga bagi setiap jenis ternakan mengikut negeri.
Output ini juga termasuk anggaran bagi baka ternakan yang
dianggap sebagai aset tetap.
Anggaran input perantaraan pada harga malar diperoleh
dengan menggunakan nisbah input-output tahun 2005. Nisbah
ini dikemas kini berdasarkan data terkini. Selain itu nilai FISIM
turut diambil kira sebagai input perantaraan. Nilai ditambah
adalah hasil perbezaan antara output dan input perantaraan.
Output pada harga malar diperoleh dengan menggunakan
harga mengikut jenis tanaman dan kuantiti pengeluaran di
setiap negeri. Output juga termasuk bagi pembentukan modal
tetap tanaman baru yang belum mengeluarkan hasil.
Anggaran input perantaraan pada harga malar diperoleh
dengan menggunakan nisbah input-output tahun 2005. Nisbah
ini dikemas kini berdasarkan data terkini. Selain itu nilai FISIM
turut diambil kira sebagai input perantaraan. Nilai ditambah
adalah hasil perbezaan antara output dan input perantaraan.
KDNK NEGERI 2013
METODOLOGI
INDUSTRI METODOLOGI
55
PERHUTANAN DAN
PEMBALAKAN
PERIKANAN
PENGELUARAN MINYAK
MENTAH DAN GAS ASLI
PERLOMBONGAN LAIN
Output pada harga malar diperoleh dari jumlah kuantiti balak
mengikut negeri dan harga mengikut spesies bagi
Semenanjung Malaysia, Sabah dan Sarawak. Output juga
mengambil kira anggaran balak yang ditanam tetapi belum
mencapai tempoh matang untuk ditebang sebagai
pembentukan modal.
Anggaran input perantaraan pada harga malar diperoleh
dengan menggunakan nisbah input-output tahun 2005. Selain
itu nilai FISIM turut diambil kira sebagai input perantaraan. Nilai
ditambah adalah hasil perbezaan antara output dan input
perantaraan.
Output pada harga malar diperoleh dengan menggunakan
kuantiti pendaratan ikan laut dan pengeluaran akuakultur
mengikut negeri serta harga mengikut spesies.
Nilai input-output tahun 2005 digunakan pada harga malar.
Anggaran input perantaraan pada harga malar diperoleh
dengan menggunakan nisbah input-output tahun 2005. Selain
itu nilai FISIM turut diambil kira sebagai input perantaraan. Nilai
ditambah adalah hasil perbezaan antara output dan input
perantaraan.
Nilai ditambah bagi industri ini adalah dianggarkan
berdasarkan banci tahunan pertubuhan sehingga tahun 2012
dan maklumat kuantiti pengeluaran oleh Petroliam Nasional
Berhad (PETRONAS) bagi penganggaran tahun 2013. Kaedah
deflasi berganda digunakan untuk mendapatkan nilai
ditambah pada harga malar. FISIM telah diambil kira sebagai
input perantaraan. Nilai ditambah diperoleh daripada hasil
perbezaan output dan input.
Industri ini termasuk penggalian timah, emas, tembaga, bijih
besi, ilmenit dan logam lain serta perlombongan dan
penggalian pasir, kelikir, dan lain-lain. Data Banci 2010
menyediakan maklumat output dan input pada harga semasa
dan nilai ditambah adalah hasil perbezaan output dan input.
Kaedah deflasi berganda digunakan untuk mendapatkan nilai
ditambah pada harga malar.
Nilai FISIM telah diambil kira sebagai input perantaraan. Bagi
tahun seterusnya, data pengeluaran daripada Jabatan
KDNK NEGERI 2013
METODOLOGI
INDUSTRI METODOLOGI
56
PEMBUATAN
PEMBINAAN
ELEKTRIK, GAS DAN AIR
PERDAGANGAN BORONG
DAN RUNCIT
Mineral & Geosains Malaysia digunakan untuk mendapatkan
anggaran pada harga malar. Nilai ditambah diperoleh
daripada hasil perbezaan output dan input.
Banci/Penyiasatan Tahunan Pembuatan menyediakan data
bagi kedua-dua output dan input. Data tahunan penyiasatan
sehingga tahun 2010 telah digunakan dalam penganggaran
sektor ini. Untuk tahun berikutnya sehingga tahun 2013 data
Penyiasatan Pembuatan Bulanan digunakan dalam membuat
anggaran nilai ditambah. Pelarasan kepada output dibuat
bagi pemasangan/pemprosesan yang dibuat secara kontrak
atau bayaran oleh pihak lain.
Nilai ditambah pada harga malar diperoleh dengan
mendeflasi kedua-dua output and input. FISIM turut diambil kira
sebagai input perantaraan.
Penyiasatan/Banci Tahunan Pembinaan sehingga tahun 2010
digunakan bagi penganggaran harga semasa. Bagi tahun di
mana banci tidak diperolehi, data dari Penyiasatan Binaan
Suku Tahunan digunakan dalam penganggaran. Sebagai
tambahan, maklumat sekunder mengenai aktiviti pembinaan
yang berkaitan dengan aktiviti hiliran bagi industri minyak dan
gas juga digunakan. Nilai FISIM telah diambil kira sebagai input
perantaraan.
Maklumat akaun tahunan daripada pengeluar dan pengedar
bekalan elektrik dan air sektor swasta menyediakan sukatan
atau ukuran bagi nilai semasa. Data seperti ini juga dikumpul
daripada industri pengedaran gas.
Bagi tahun yang berikutnya di mana akaun tidak diperoleh,
maklumat berkenaan kuantiti elektrik dan air yang dijual dan
dikeluarkan digunakan untuk menggerakkan ukuran pada
harga malar. Nilai FISIM telah diambil kira sebagai input
perantaraan.
Industri ini terbahagi kepada tiga aktiviti utama iaitu borong,
runcit dan kenderaan bermotor. Bagi aktiviti runcit ia termasuk
aktiviti jualan minyak kenderaan serta membaik pulih
peralatan isi rumah. Manakala aktiviti kenderaan bermotor
termasuk aktiviti membaik pulih kenderaan. Nilai output
KDNK NEGERI 2013
METODOLOGI
INDUSTRI METODOLOGI
57
PENGINAPAN
RESTORAN
PENGANGKUTAN DAN
PENYIMPANAN
menggunakan data Banci Perdagangan Edaran 2008 sebagai
asas. Indeks harga yang bersesuaian bagi setiap aktiviti
digunakan untuk mendapatkan nilai pada harga malar. Bagi
tahun di mana tiada data banci diperolehi, maklumat
daripada penyiasatan suku tahunan digunakan untuk
menggerakkan output. Nilai FISIM telah diambil kira sebagai
input perantaraan.
Banci Tahunan Perkhidmatan Penginapan sehingga tahun
2010 digunakan bagi menganggarkan nilai output dan
penggunaan perantaraan pada harga semasa. Bagi tahun di
mana tiada data banci diperolehi, maklumat daripada
penyiasatan suku tahunan digunakan untuk menggerakkan
output. Kaedah deflasi berganda digunakan untuk
mendapatkan anggaran pada harga malar menggunakan
indeks yang bersesuaian. Nilai ditambah pada harga malar
ialah perbezaan antara output dan input perantaraan. Nilai
FISIM telah diambil kira sebagai input perantaraan.
Banci Perkhidmatan Makanan & Minuman 2010 dan
Penyiasatan Perkhidmatan Suku Tahunan digunakan untuk
menganggarkan nilai output pada harga semasa. Anggaran
pada harga malar diperoleh dengan menggunakan Indeks
Harga Pengguna dan Indeks Harga Pengeluar sebagai
pendeflasi bagi output dan input pada harga semasa. Nilai
ditambah pada harga malar ialah perbezaan antara output
dan input perantaraan. Nilai FISIM telah diambil kira sebagai
input perantaraan.
Maklumat tentang output dan input diperoleh daripada Banci
Tahunan/Dwi-tahunan sehingga tahun 2010. Bagi tahun-tahun
di mana banci tidak diperolehi, Penyiasatan Perkhidmatan
Suku Tahunan digunakan sebagai penggerak kepada output.
Bagi sub aktiviti pengangkutan air, pengangkutan udara,
operasi pelabuhan dan lapangan terbang, indikator yang
bersesuaian digunakan untuk pengagihan maklumat output
dan input mengikut negeri.
Deflasi berganda digunakan untuk membuat anggaran nilai
ditambah pada harga malar. Nilai FISIM telah diambil kira
sebagai input perantaraan.
KDNK NEGERI 2013
METODOLOGI
INDUSTRI METODOLOGI
58
KOMUNIKASI
KEWANGAN
PERKHIDMATAN
PENGANTARAAN
KEWANGAN YANG DIUKUR
SECARA TIDAK LANGSUNG
(FISIM)
INSURANS
Maklumat output dan input diperoleh dari Banci/Penyiasatan
Tahunan sehingga tahun 2011. Bagi tahun-tahun di mana
banci tidak diperolehi, Penyiasatan Perkhidmatan Suku
Tahunan digunakan sebagai penggerak kepada output. Bagi
aktiviti telekomunikasi dan pos nasional, maklumat output dan
input pertubuhan-pertubuhan utama diagihkan mengikut
indikator yang bersesuaian. Nilai FISIM telah diambil kira
sebagai input perantaraan.
Indeks Harga Pengguna dan Indeks Harga Pengeluar
digunakan untuk mendeflasi output dan input pada harga
semasa. Nilai harga malar diperoleh menggunakan kaedah
deflasi berganda.
Anggaran untuk industri kewangan adalah berasaskan data
pinjaman dan deposit yang dibekalkan oleh Bank Negara
Malaysia mengikut sektor dan negeri. Indeks Harga Pengguna
digunakan untuk menghasilkan penunjuk nilai pada harga
malar. Nilai ditambah pada harga malar diperoleh menerusi
perbezaan antara output dengan input perantaraan. Nilai
FISIM telah diambil kira sebagai input perantaraan.
Caj perkhidmatan ke atas penyimpan dan peminjam untuk
deposit dan pinjaman oleh perantara kewangan seperti bank
yang diukur secara tak langsung (FISIM) kini dimasukkan
sebagai penggunaan perantaraan bagi pengeluar barang
dan perkhidmatan.
Agihan FISIM mengikut negeri dibuat berdasarkan komposisi
nilai ditambah bagi setiap industri. Indeks harga yang
bersesuaian digunakan untuk mendapatkan anggaran pada
harga malar.
Anggaran untuk insurans dibuat dengan menggunakan
beberapa indikator berkaitan termasuk bilangan kenderaan
berdaftar bagi mendapatkan output pada harga semasa.
Pengiraan input pada harga semasa juga menggunakan
nisbah input-output peringkat nasional. Indeks Harga
Pengguna digunakan untuk menghasilkan penunjuk nilai pada
harga malar. Nilai FISIM telah diambil kira sebagai input
perantaraan.
KDNK NEGERI 2013
METODOLOGI
INDUSTRI METODOLOGI
59
HARTANAH
PERKHIDMATAN PERNIAGAAN
PEMILIKAN TEMPAT KEDIAMAN
YANG DIDIAMI PEMILIK
PENDIDIKAN SWASTA
Anggaran untuk hartanah menggunakan pelbagai penunjuk
termasuk anggaran bilangan unit rumah yang baru, ruang
niaga kompleks perniagaan diduduki, ruang pejabat binaan
khas diduduki dan aktiviti dalam industri utama yang berkait
dengan industri hartanah. Banci Perkhidmatan Terpilih
sehingga tahun 2010 membekalkan maklumat output dan
input bagi aktiviti ejen hartanah. Nilai FISIM telah diambil kira
sebagai input perantaraan.
Banci Perkhidmatan Profesional, Saintifik & Teknikal dan
Perkhidmatan Pentadbiran & Sokongan sehingga tahun 2010
serta Banci Perkhidmatan Maklumat & Komunikasi sehingga
tahun 2011 digunakan dalam penganggaran. Bagi aktiviti lain,
anggaran diperoleh dengan menggunakan penggerak
daripada industri utama. Bagi tahun-tahun di mana banci
tidak diperolehi, Penyiasatan Perkhidmatan Suku Tahunan atau
indikator yang berkaitan digunakan sebagai penggerak harga
semasa.
Nilai ditambah pada harga semasa ditentukan daripada baki
output ditolak input perantaraan, manakala nilai ditambah
pada harga malar diperoleh dengan menggunakan kaedah
deflasi berganda.
Anggaran stok kediaman dibuat ke atas bilangan rumah yang
didiami pemilik. Bilangan kediaman yang didiami pemilik
diperoleh dengan menggunakan maklumat Banci Penduduk
dan Perumahan 2010.
Bagi tahun-tahun berikutnya, nilai ditambah pada harga malar
digerakkan menggunakan perubahan penduduk dengan
mengambil kira faktor pertambahan perkadaran penduduk
yang memiliki rumah sendiri dan perubahan kualiti kediaman.
Nilai FISIM telah diambil kira sebagai input perantaraan.
Anggaran output dan input diperoleh melalui data Banci/
Penyiasatan Pendidikan Swasta sehingga tahun 2010. Bagi
tahun di mana data banci tidak diperoleh, data Penyiasatan
Perkhidmatan Suku Tahunan digunakan untuk menggerakkan
output pada harga semasa. Nilai FISIM telah diambil kira
sebagai input perantaraan.
KDNK NEGERI 2013
METODOLOGI
INDUSTRI METODOLOGI
60
KESIHATAN SWASTA
PERKHIDMATAN
PERSENDIRIAN LAIN
PERKHIDMATAN KERAJAAN
INSTITUSI BUKAN UNTUNG
SWASTA YANG MEMBERI
PERKHIDMATAN KEPADA
ISIRUMAH
PERKHIDMATAN DOMESTIK
KEPADA ISIRUMAH
DUTI IMPORT
Anggaran output dan input diperoleh melalui data Banci/
Penyiasatan Kesihatan Swasta sehingga tahun 2010. Bagi
tahun di mana data banci tidak diperoleh, data Penyiasatan
Perkhidmatan Suku Tahunan digunakan untuk menggerakkan
output pada harga semasa. Nilai FISIM telah diambil kira
sebagai input perantaraan.
Anggaran mengikut negeri adalah berdasarkan pelbagai
indikator antaranya Penyiasatan Khas Akaun Negara
Muktamad, Penyiasatan Aktiviti Pelancongan Terpilih dan
Penyiasatan Tenaga Buruh. Nilai FISIM telah diambil kira
sebagai input perantaraan.
Industri ini dikategorikan sebagai pengeluar bukan pasaran,
oleh yang demikian nilai ditambah diperoleh daripada nilai
pampasan pekerja, pencen yang diperuntukkan kepada
pekerja yang sedang bekerja dan penggunaan modal tetap.
Ia disusun berdasarkan aktiviti Kerajaan Persekutuan, Kerajaan
Negeri, Badan Berkanun dan Pihak Berkuasa Tempatan.
Anggaran mengikut negeri adalah berdasarkan struktur
Penyiasatan Khas Akaun Negara Muktamad dan bilangan
pekerja daripada Penyiasatan Tenaga Buruh. Output pada
harga semasa digerakkan menggunakan indikator yang
bersesuaian manakala nilai pada harga malar diperolehi
menggunakan indeks yang bersesuaian.
Anggaran mengikut negeri adalah berdasarkan bilangan
pekerja daripada Penyiasatan Tenaga Buruh dan data ini juga
digunakan sebagai penggerak bagi penganggaran harga
malar untuk tahun yang berikutnya.
Ukuran muktamad diperoleh daripada laporan tahunan
Jabatan Akauntan Negara. Jabatan Kastam Diraja Malaysia
memberikan akaun bulanan dari rekod pentadbiran
berdasarkan kepada pusat pungutan dan ia digunakan untuk
anggaran pada peringkat negeri.
KDNK NEGERI 2013
METHODOLOGY
61
GROSS DOMESTIC PRODUCT
(GDP)
OUTPUT
INTERMEDIATE CONSUMPTION
VALUE ADDED
The national accounts data presented in this publication cover some of the items in the national
accounting system, which record all economic activities. The national accounting system covers
production, expenditure, income generation and distribution, financing, savings and investment
of the whole economy. This accounting system is defined by the United Nations and the
transactions presented here are based on the recommendations of the System of National
Accounts 1993 (1993 SNA) and 2008 (2008 SNA).
GDP Σ Gross Value Added
GDP is the total value of all goods and services free of
duplication produced in a certain period after deducting the
cost of goods and services used up in the process of
production. This value is before deducting allowances for
consumption of fixed capital i.e. the sum of value added of
resident producer in producers’ price plus import duties.
GDP is an item in a double entry accounting system and in this
publication, it is presented in the following ways:
(a) The sum of the gross value added of all producers
engaged in production in the economy; or
(b) The difference between gross output of all producers
less the intermediate consumption.
Output is the value of goods and services produced. This
includes market production, production for own final use, and
non-market production (government and non-profit institutions
serving households). Production of goods and services should
not be mistakenly understood for sale or turnover of
establishment.
Intermediate consumption is the value of goods and services
consumed (as inputs) in the production process of goods and
services excluded salaries and wages, depreciation of capital
and net interest paid.
Value added is the difference between output and
intermediate consumption. It represents the additional value
added to goods and services by an industrial activity. Hence, it
is approximately equivalent to commercial profit, salaries and
wages, depreciation and indirect taxes plus interest paid less
interest received.
Output Input Value Added
KDNK NEGERI 2013
METHODOLOGY
62
TAXES
Indirect taxes
Direct taxes
CHANGES AND
IMPROVEMENT
In national accounts, taxes are expressed in two forms:
Indirect taxes which are regarded as cost of production and
thus added to the value of goods and services. They are
constituent part of value added which include sales tax, value
added taxes, excise duties, quit rent, etc.
Direct taxes which are taxes on profits or incomes constitute a
redistribution of income from the private sector to the
government and it is not in the form of production cost.
In Malaysian context, income tax is the most significant direct
tax.
(i) Improvement in compilation methodology and data
sources
The compilation of Supply and Use Table gives a new
benchmark to the GDP value for year 2005. In principle,
this data will become the base for the change of GDP
value. Besides, some industries and expenditure
components has been reviewed in methodology and
data sources that are :-
(a) Utilities
Conceptually all losses and wastage in production
and during distribution are not treated as output. In
the case of utilities, total electricity generated does
not reflect the real total output as there is some
wastage and loss during the distribution process to
the consumer. Therefore, total quantity sold is used
as mover to give the real picture of this industry.
(b) Agriculture
Besides crop products, output of agriculture also
include estimates of capital development. On
expenditure, it can be categorised as capital
formation or inventories. In this matter,
non-perennial crops such as oil palm, rubber,
cocoa, coconut, fruits, tea and coffee will be
categorised as capital formation while perennial
crops such as timber, vegetable and cereal will be
categorised as inventories.
For crops that are categorised as fixed capital,
improvements made by taking into account the
cost of crops per year before the crop yield. The
data was obtained from the relevant agencies.
KDNK NEGERI 2013
METHODOLOGY
63
FUTURE DEVELOPMENTS
Previous cost estimates are based on the structure
of crop inputs.
(c) Wholesale and Retail Trade
Census of Distributive Trade for reference year 2008
has given a new benchmark to the estimation of
wholesale and retail trade activity. This data has
been taken into account in the rebased GDP.
(ii) Improvement in classification
Activity related to stock broker whether it is carried out
by banking institution or other related financial institutions
is categorised under Finance sub-sector. Prior to rebase,
these activities were categorised under Business Services
sub-sector. The activities are :
67121 Stock, share and bond brokers
67122 Commodity brokers and dealers
67191 Foreign exchange services
67199 Activities auxiliary to finance n.e.c
The information which is provided in this publication describes
the methods used to date. However, as new data sources
become available, further research will be made to improve
the current methods. Hence, it is expected that the changes
on methods are made on a continuous basis. Such changes
will be introduced so as to maintain the continuity of the time
series.
KDNK NEGERI 2013
INDUSTRY METHODOLOGY
METHODOLOGY
64
RUBBER
PALM OIL
LIVESTOCK
OTHER AGRICULTURE
Output at constant prices is derived by using the quantity of
rubber produced and price information on rubber by state.
Output also includes estimation of fixed capital formation
arising from new planting.
Estimation of intermediate consumption for constant price is
obtained from input-output ratio of year 2005. This ratio is
updated based on the latest data obtained. Besides, the value
of FISIM is also taken into account as intermediate
consumption. Value added is derived as the difference
between output and intermediate consumption.
Output at constant price is derived by using the quantity of
palm oil production by state and price information by zone.
Output also includes estimation of fixed capital formation
arising from new planting.
Estimation of intermediate consumption for constant price is
obtained from input-output ratio of year 2005. This ratio is
updated based on the latest data obtained. Besides, the value
of FISIM is also taken into account as intermediate
consumption. Value added is derived as the difference
between output and intermediate consumption.
Output value is obtained by using information of quantity and
price of each type of livestock by state. The output also
includes estimates for livestock breeding which is considered as
fixed asset.
Estimation of intermediate consumption for constant price is
obtained from input-output ratio of year 2005. This ratio is
updated based on the latest data obtained. Besides, the value
of FISIM is also taken into account as intermediate
consumption. Value added is derived as the difference
between output and intermediate consumption.
Output at constant price as a whole is derived by using the
quantity of production according to the type of crops and
price by state. Output also includes estimation of fixed capital
formation arising from new planting.
Estimation of intermediate consumption for constant price is
obtained from input-output ratio of year 2005. This ratio is
updated based on the latest data obtained. Besides, the value
of FISIM is also taken into account as intermediate
consumption. Value added is derived as the difference
between output and intermediate consumption.
KDNK NEGERI 2013
INDUSTRY METHODOLOGY
METHODOLOGY
65
FORESTRY AND LOGGING
FISHING
CRUDE PETROLEUM AND
NATURAL GAS
OTHER MINING
MANUFACTURING
Output at constant price is obtained from the total quantity of
logs by state and price by species for Peninsular Malaysia,
Sabah and Sarawak. Output also includes estimation of
planted logs but have not yet matured to chop as capital
formation.
Estimation of intermediate consumption for constant price is
obtained from input-output ratio of year 2005. Besides, the
value of FISIM is also taken into account as Intermediate
consumption. Value added is derived as the difference
between output and intermediate consumption.
Output at constant price is derived by using the quantity of
marine fish landed and aquaculture production by state and
price by species.
Estimation of intermediate consumption for constant price is
obtained from input-output ratio of year 2005. Besides, the
value of FISIM is also taken into account as Intermediate
consumption. Value added is derived as the difference
between output and intermediate consumption.
Value added for this industry is estimated based on annual
census of establishment up to 2012 and production data from
Petroliam Nasional Berhad (PETRONAS) is used to estimate
value added for year 2013. The double deflation method is
used to arrive value added at constant price. FISIM has been
included as intermediate consumption. Value added is
obtained as a residual from output and input.
This industry includes the extraction of tin, gold, iron ore,
ilmenite and other metals as well as the mining and quarrying
of sand, gravel and other aggregates. Census data of 2010
provides information on output and input at current price and
the value added will be the residual. The double deflation
method is used to arrive value added at constant price. FISIM
has been included as intermediate consumption. For
subsequent years, production data from Mineral & Geoscience
Department is used for the estimates at constant price.
The Annual Survey/Census of Manufacturing provides the
necessary data for both output and input. In this publication,
annual survey/census data for years up to 2010 have been
included in the estimates for this sector. For subsequent years
up to 2013, data of monthly manufacturing survey is used in
estimating value added. The adjustments to output have been
made to allow for assembling/processing done on contract or
for a fee by others.
KDNK NEGERI 2013
INDUSTRY METHODOLOGY
METHODOLOGY
66
CONSTRUCTION
ELECTRICITY, GAS AND WATER
WHOLESALE AND RETAIL
TRADE
ACCOMMODATION
RESTAURANTS
Constant price value added is obtained by deflating both
output and input. FISIM is treated as intermediate consumption.
The estimation of current value is based on the Biennial Survey/
Census of Construction up to year 2010. In the absence of
annual survey, Quarterly Construction Survey data is used for
the estimation. In addition, secondary information on
construction associated with the upstream activity of the oil
and gas industry are also included. FISIM has been included as
intermediate consumption.
The annual accounting information of private sector producers
and distributors of electricity and water provides the measure
of current value. Data are also collected from the gas
distribution industry.
For subsequent years where accounts are not available,
information collected in volume of electricity and water sold or
produced is used to move the constant price measures. FISIM
has been included as intermediate consumption.
There are three main activities covered under this industry
which are wholesale, retail and motor vehicle. Retail activity
includes retail of automotive fuel and repair of personal and
household goods, while motor vehicle activities covered repair
of motor vehicles. The data from Census of Distributive Trade
2008 is used as a benchmark for the industry. The relevant
prices for each activity are used to get the value at constant
price. For year where census data is not available, information
from quarterly survey is used as mover for the output. FISIM has
been included as intermediate consumption.
Census of Accommodation Services up to 2010 is used to
estimate output and intermediate consumption value at
current prices. For subsequent years, information from Quarterly
Services Survey is used as a mover for the output. Double
deflation method is applied to obtain constant price
estimations by using appropriate index. The constant price
value added is the difference between output and
intermediate consumption. FISIM has been included as
intermediate consumption.
Census of Food & Beverage Services 2010 and Quarterly
Services Survey are used to estimate output at current value.
Consumer Price Index and Producer Price Index are used to
deflate output and intermediate consumption at current price.
The constant price value added is the difference between
output and intermediate consumption. FISIM has been
included as intermediate consumption.
KDNK NEGERI 2013
INDUSTRY METHODOLOGY
METHODOLOGY
67
TRANSPORT AND STORAGE
COMMUNICATION
FINANCE
FINANCIAL
INTERMEDIATION SERVICES
INDIRECTLY MEASURED
(FISIM)
INSURANCE
REAL ESTATE
Information of output and input are obtained from Annual/
Biennial Census up to 2010. For the years where survey is not
available, Quarterly Services Survey is used as a mover for the
output. For sub activities of water transport, air transport, port
and airport operations a suitable indicators were used to
allocate information of output and input by states.
Double deflation is applied to estimate constant price value
added. FISIM has been included as intermediate consumption.
The information of output and input is obtained from Annual
Census/Survey up to 2011. For the years where survey is not
available, Quarterly Services Survey is used as a mover for the
output. For the telecommunications and national postal
activities, information of input and output of major
establishments were distributed by suitable indicators. FISIM has
been included as intermediate consumption.
Consumer Price Index and Producer Price Index are used to
deflate current output and input. Constant price value is
obtained by using the double deflation method.
Estimation for financial industry is built by using data on loans
and deposits by sectors and states provided by Central Bank of
Malaysia. Consumer Price Index is used as constant price value
indicator. Value added at constant price is derived as the
difference between output and intermediate consumption.
FISIM has been included as intermediate consumption.
Service charges on depositors and borrowers for deposits, loans
by financial intermediaries such as banks that are indirectly
measures (FISIM) are now included as intermediate
consumption of producers of goods and services.
Allocation of FISIM by state is based on the composition of
value added for all industries. Relevant price indices are used
to derive the constant price estimates.
Estimation for insurance is done by using a variety of indicators
to derive output at current price including number of registered
motor vehicles. Input-output ratio at current price at national
level is used to estimate input at the current price. Consumer
Price Index is used as a deflator to derive the constant price.
FISIM has been included as intermediate consumption.
Real estate estimates are derived by using a variety of
indicators including estimates of the number of existing new
housing units, occupied retail space in shopping complex,
occupied space in purpose built office and activities in the
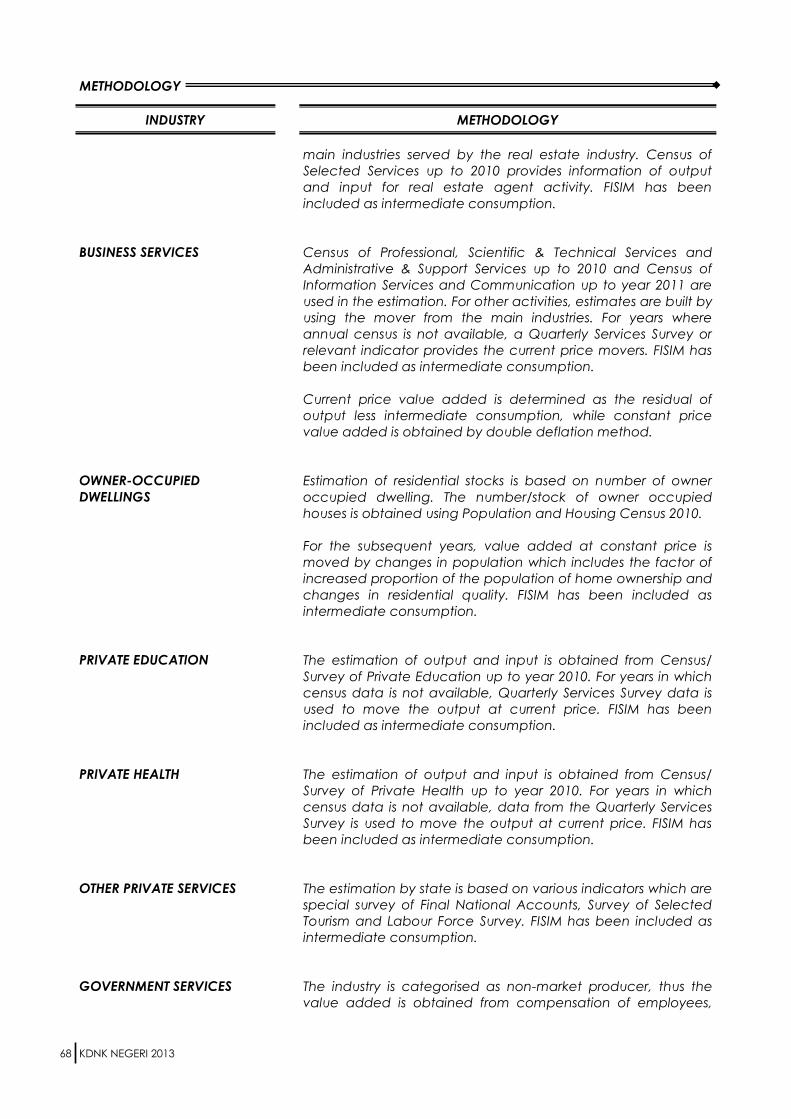
KDNK NEGERI 2013
INDUSTRY METHODOLOGY
METHODOLOGY
68
BUSINESS SERVICES
OWNER-OCCUPIED
DWELLINGS
PRIVATE EDUCATION
PRIVATE HEALTH
OTHER PRIVATE SERVICES
GOVERNMENT SERVICES
main industries served by the real estate industry. Census of
Selected Services up to 2010 provides information of output
and input for real estate agent activity. FISIM has been
included as intermediate consumption.
Census of Professional, Scientific & Technical Services and
Administrative & Support Services up to 2010 and Census of
Information Services and Communication up to year 2011 are
used in the estimation. For other activities, estimates are built by
using the mover from the main industries. For years where
annual census is not available, a Quarterly Services Survey or
relevant indicator provides the current price movers. FISIM has
been included as intermediate consumption.
Current price value added is determined as the residual of
output less intermediate consumption, while constant price
value added is obtained by double deflation method.
Estimation of residential stocks is based on number of owner
occupied dwelling. The number/stock of owner occupied
houses is obtained using Population and Housing Census 2010.
For the subsequent years, value added at constant price is
moved by changes in population which includes the factor of
increased proportion of the population of home ownership and
changes in residential quality. FISIM has been included as
intermediate consumption.
The estimation of output and input is obtained from Census/
Survey of Private Education up to year 2010. For years in which
census data is not available, Quarterly Services Survey data is
used to move the output at current price. FISIM has been
included as intermediate consumption.
The estimation of output and input is obtained from Census/
Survey of Private Health up to year 2010. For years in which
census data is not available, data from the Quarterly Services
Survey is used to move the output at current price. FISIM has
been included as intermediate consumption.
The estimation by state is based on various indicators which are
special survey of Final National Accounts, Survey of Selected
Tourism and Labour Force Survey. FISIM has been included as
intermediate consumption.
The industry is categorised as non-market producer, thus the
value added is obtained from compensation of employees,
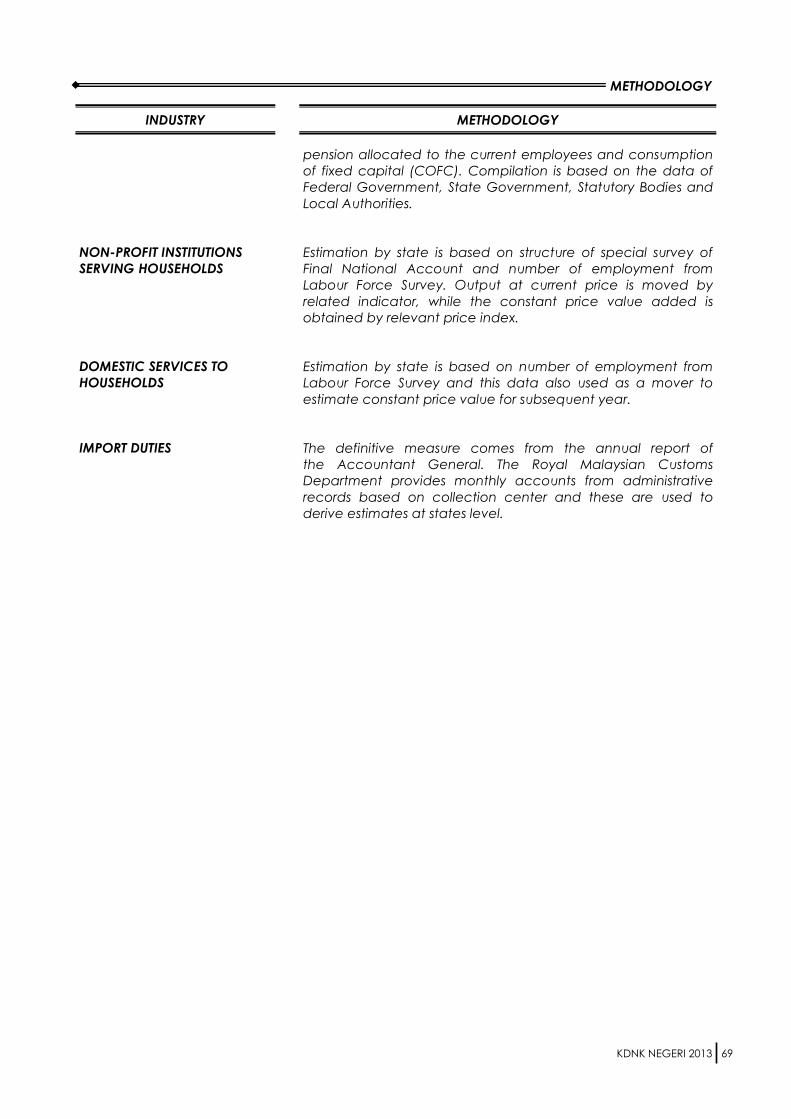
KDNK NEGERI 2013
INDUSTRY METHODOLOGY
METHODOLOGY
69
NON-PROFIT INSTITUTIONS
SERVING HOUSEHOLDS
DOMESTIC SERVICES TO
HOUSEHOLDS
IMPORT DUTIES
pension allocated to the current employees and consumption
of fixed capital (COFC). Compilation is based on the data of
Federal Government, State Government, Statutory Bodies and
Local Authorities.
Estimation by state is based on structure of special survey of
Final National Account and number of employment from
Labour Force Survey. Output at current price is moved by
related indicator, while the constant price value added is
obtained by relevant price index.
Estimation by state is based on number of employment from
Labour Force Survey and this data also used as a mover to
estimate constant price value for subsequent year.
The definitive measure comes from the annual report of
the Accountant General. The Royal Malaysian Customs
Department provides monthly accounts from administrative
records based on collection center and these are used to
derive estimates at states level.

KDNK NEGERI 2013
Mukasurat ini sengaja dibiarkan kosong
This page is deliberately left blank
70
SUMBER DATA
DATA SOURCES
KDNK NEGERI 2013 I GDP BY STATE 2013
5

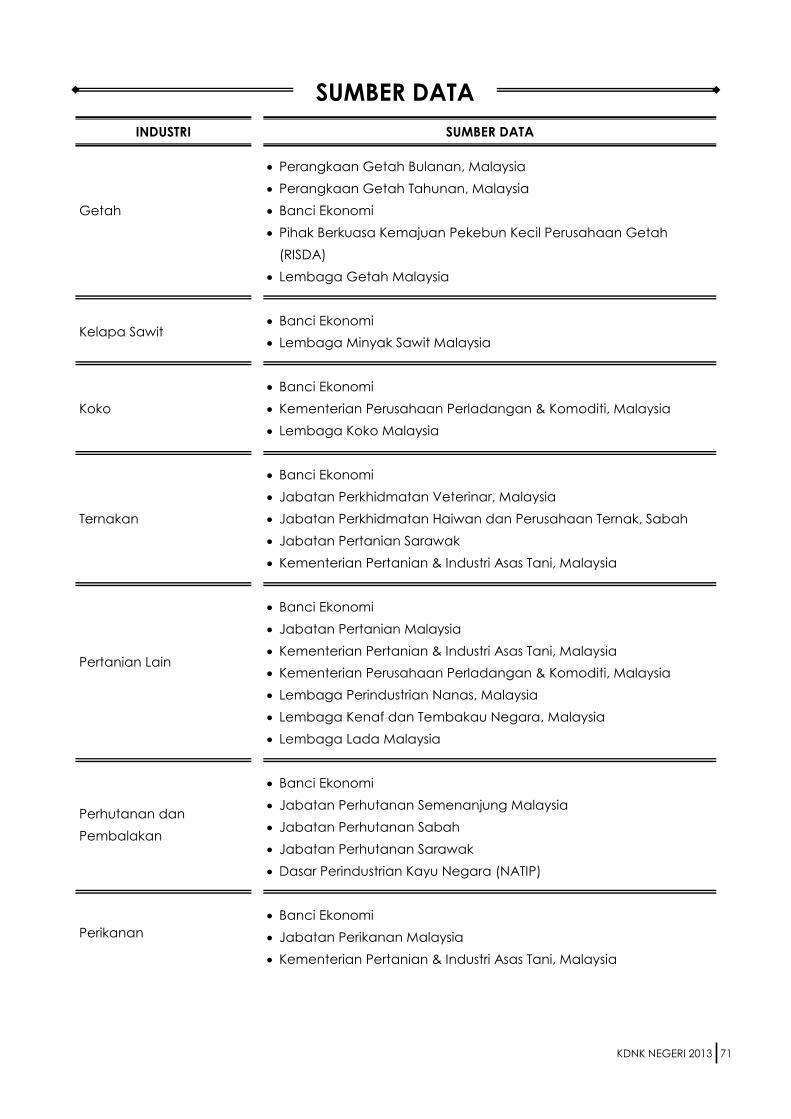
KDNK NEGERI 2013
SUMBER DATA
INDUSTRI SUMBER DATA
71
Getah
Kelapa Sawit
Koko
Ternakan
Pertanian Lain
Perhutanan dan
Pembalakan
Perikanan
Perangkaan Getah Bulanan, Malaysia
Perangkaan Getah Tahunan, Malaysia
Banci Ekonomi
Pihak Berkuasa Kemajuan Pekebun Kecil Perusahaan Getah
(RISDA)
Lembaga Getah Malaysia
Banci Ekonomi
Lembaga Minyak Sawit Malaysia
Banci Ekonomi
Kementerian Perusahaan Perladangan & Komoditi, Malaysia
Lembaga Koko Malaysia
Banci Ekonomi
Jabatan Perkhidmatan Veterinar, Malaysia
Jabatan Perkhidmatan Haiwan dan Perusahaan Ternak, Sabah
Jabatan Pertanian Sarawak
Kementerian Pertanian & Industri Asas Tani, Malaysia
Banci Ekonomi
Jabatan Pertanian Malaysia
Kementerian Pertanian & Industri Asas Tani, Malaysia
Kementerian Perusahaan Perladangan & Komoditi, Malaysia
Lembaga Perindustrian Nanas, Malaysia
Lembaga Kenaf dan Tembakau Negara, Malaysia
Lembaga Lada Malaysia
Banci Ekonomi
Jabatan Perhutanan Semenanjung Malaysia
Jabatan Perhutanan Sabah
Jabatan Perhutanan Sarawak
Dasar Perindustrian Kayu Negara (NATIP)
Banci Ekonomi
Jabatan Perikanan Malaysia
Kementerian Pertanian & Industri Asas Tani, Malaysia
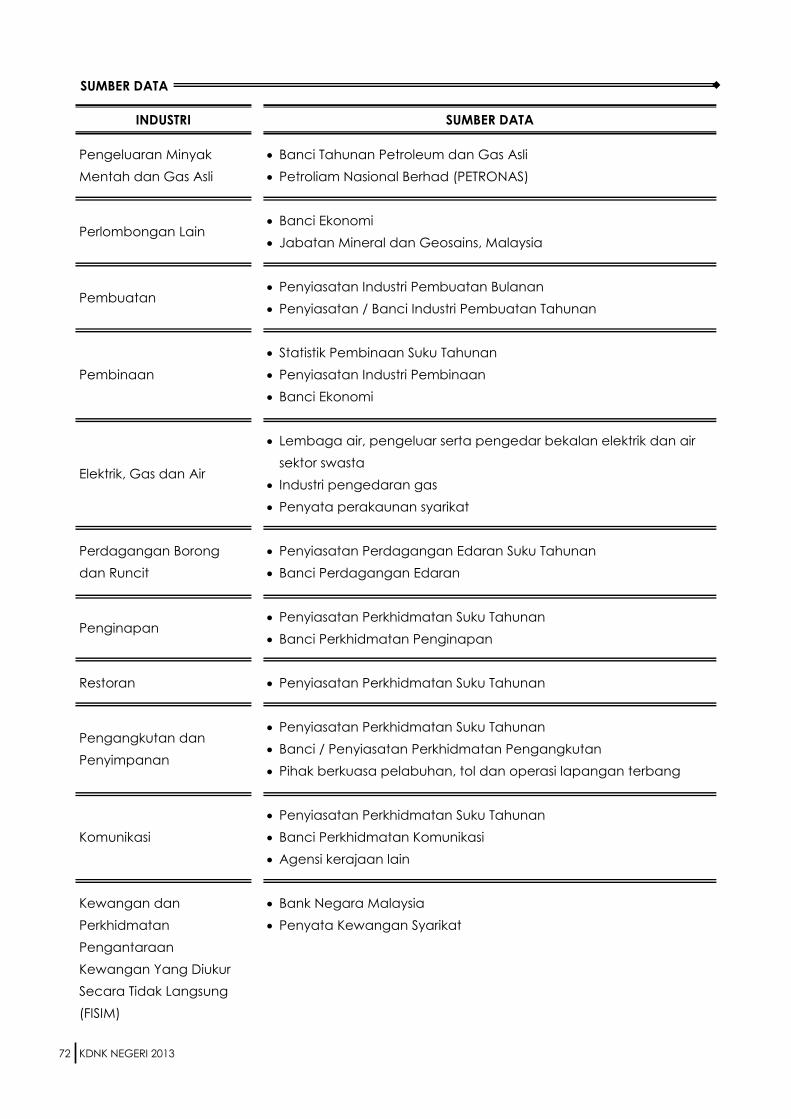
KDNK NEGERI 2013
SUMBER DATA
INDUSTRI SUMBER DATA
72
Pengeluaran Minyak
Mentah dan Gas Asli
Perlombongan Lain
Pembuatan
Pembinaan
Elektrik, Gas dan Air
Perdagangan Borong
dan Runcit
Penginapan
Restoran
Pengangkutan dan
Penyimpanan
Komunikasi
Kewangan dan
Perkhidmatan
Pengantaraan
Kewangan Yang Diukur
Secara Tidak Langsung
(FISIM)
Banci Tahunan Petroleum dan Gas Asli
Petroliam Nasional Berhad (PETRONAS)
Banci Ekonomi
Jabatan Mineral dan Geosains, Malaysia
Penyiasatan Industri Pembuatan Bulanan
Penyiasatan / Banci Industri Pembuatan Tahunan
Statistik Pembinaan Suku Tahunan
Penyiasatan Industri Pembinaan
Banci Ekonomi
Lembaga air, pengeluar serta pengedar bekalan elektrik dan air
sektor swasta
Industri pengedaran gas
Penyata perakaunan syarikat
Penyiasatan Perdagangan Edaran Suku Tahunan
Banci Perdagangan Edaran
Penyiasatan Perkhidmatan Suku Tahunan
Banci Perkhidmatan Penginapan
Penyiasatan Perkhidmatan Suku Tahunan
Penyiasatan Perkhidmatan Suku Tahunan
Banci / Penyiasatan Perkhidmatan Pengangkutan
Pihak berkuasa pelabuhan, tol dan operasi lapangan terbang
Penyiasatan Perkhidmatan Suku Tahunan
Banci Perkhidmatan Komunikasi
Agensi kerajaan lain
Bank Negara Malaysia
Penyata Kewangan Syarikat
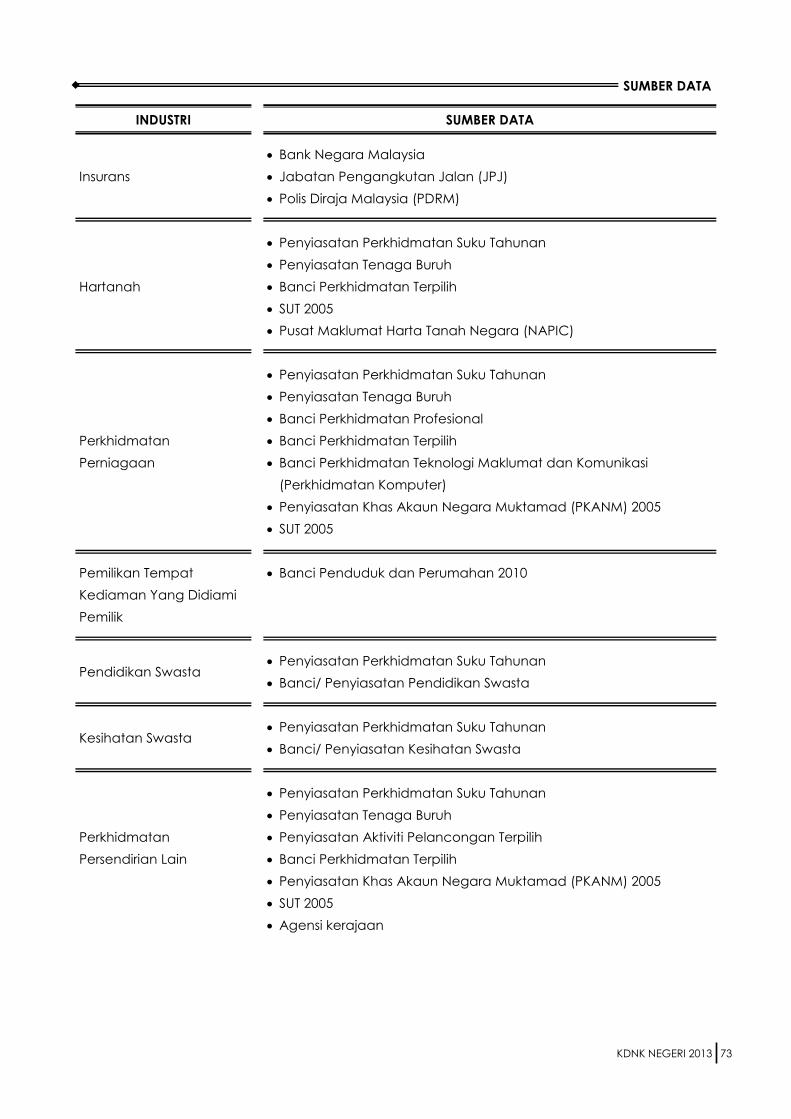
KDNK NEGERI 2013
SUMBER DATA
INDUSTRI SUMBER DATA
73
Insurans
Hartanah
Perkhidmatan
Perniagaan
Pemilikan Tempat
Kediaman Yang Didiami
Pemilik
Pendidikan Swasta
Kesihatan Swasta
Perkhidmatan
Persendirian Lain
Bank Negara Malaysia
Jabatan Pengangkutan Jalan (JPJ)
Polis Diraja Malaysia (PDRM)
Penyiasatan Perkhidmatan Suku Tahunan
Penyiasatan Tenaga Buruh
Banci Perkhidmatan Terpilih
SUT 2005
Pusat Maklumat Harta Tanah Negara (NAPIC)
Penyiasatan Perkhidmatan Suku Tahunan
Penyiasatan Tenaga Buruh
Banci Perkhidmatan Profesional
Banci Perkhidmatan Terpilih
Banci Perkhidmatan Teknologi Maklumat dan Komunikasi
(Perkhidmatan Komputer)
Penyiasatan Khas Akaun Negara Muktamad (PKANM) 2005
SUT 2005
Banci Penduduk dan Perumahan 2010
Penyiasatan Perkhidmatan Suku Tahunan
Banci/ Penyiasatan Pendidikan Swasta
Penyiasatan Perkhidmatan Suku Tahunan
Banci/ Penyiasatan Kesihatan Swasta
Penyiasatan Perkhidmatan Suku Tahunan
Penyiasatan Tenaga Buruh
Penyiasatan Aktiviti Pelancongan Terpilih
Banci Perkhidmatan Terpilih
Penyiasatan Khas Akaun Negara Muktamad (PKANM) 2005
SUT 2005
Agensi kerajaan
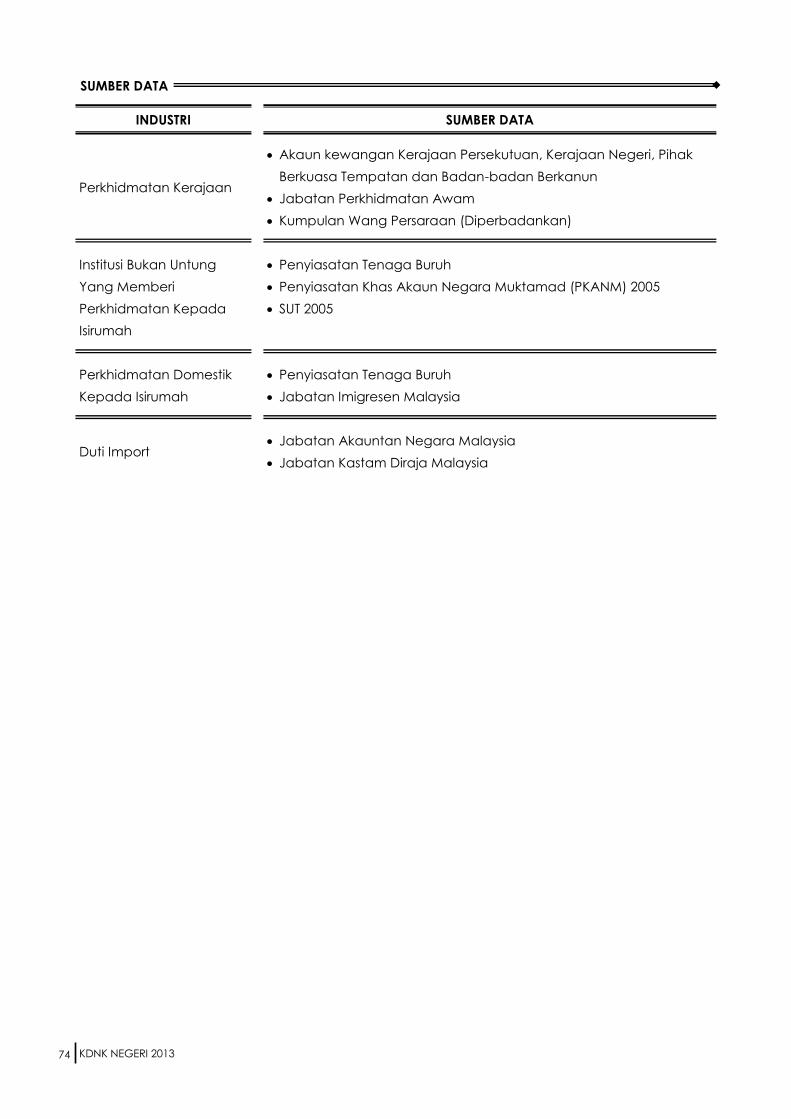
KDNK NEGERI 2013
SUMBER DATA
INDUSTRI SUMBER DATA
74
Perkhidmatan Kerajaan
Institusi Bukan Untung
Yang Memberi
Perkhidmatan Kepada
Isirumah
Perkhidmatan Domestik
Kepada Isirumah
Duti Import
Akaun kewangan Kerajaan Persekutuan, Kerajaan Negeri, Pihak
Berkuasa Tempatan dan Badan-badan Berkanun
Jabatan Perkhidmatan Awam
Kumpulan Wang Persaraan (Diperbadankan)
Penyiasatan Tenaga Buruh
Penyiasatan Khas Akaun Negara Muktamad (PKANM) 2005
SUT 2005
Penyiasatan Tenaga Buruh
Jabatan Imigresen Malaysia
Jabatan Akauntan Negara Malaysia
Jabatan Kastam Diraja Malaysia
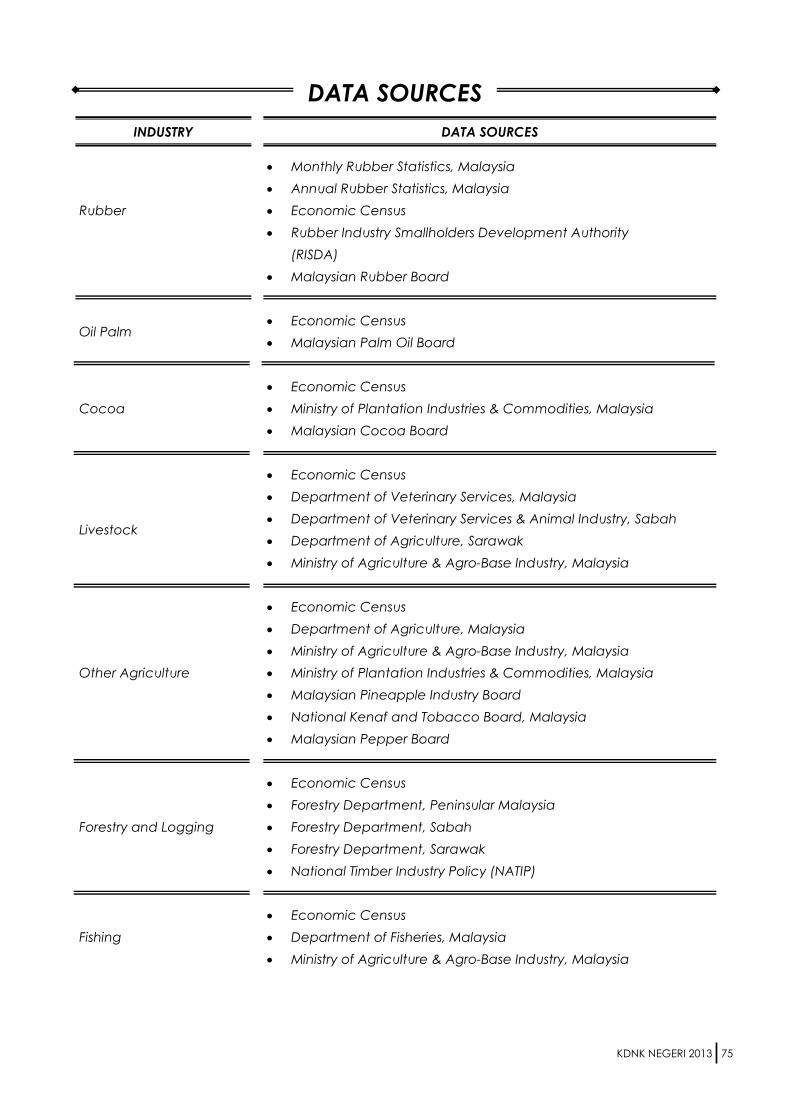
KDNK NEGERI 2013
DATA SOURCES
INDUSTRY DATA SOURCES
75
Rubber
Oil Palm
Cocoa
Livestock
Other Agriculture
Forestry and Logging
Fishing
Monthly Rubber Statistics, Malaysia
Annual Rubber Statistics, Malaysia
Economic Census
Rubber Industry Smallholders Development Authority
(RISDA)
Malaysian Rubber Board
Economic Census
Malaysian Palm Oil Board
Economic Census
Ministry of Plantation Industries & Commodities, Malaysia
Malaysian Cocoa Board
Economic Census
Department of Veterinary Services, Malaysia
Department of Veterinary Services & Animal Industry, Sabah
Department of Agriculture, Sarawak
Ministry of Agriculture & Agro-Base Industry, Malaysia
Economic Census
Department of Agriculture, Malaysia
Ministry of Agriculture & Agro-Base Industry, Malaysia
Ministry of Plantation Industries & Commodities, Malaysia
Malaysian Pineapple Industry Board
National Kenaf and Tobacco Board, Malaysia
Malaysian Pepper Board
Economic Census
Forestry Department, Peninsular Malaysia
Forestry Department, Sabah
Forestry Department, Sarawak
National Timber Industry Policy (NATIP)
Economic Census
Department of Fisheries, Malaysia
Ministry of Agriculture & Agro-Base Industry, Malaysia
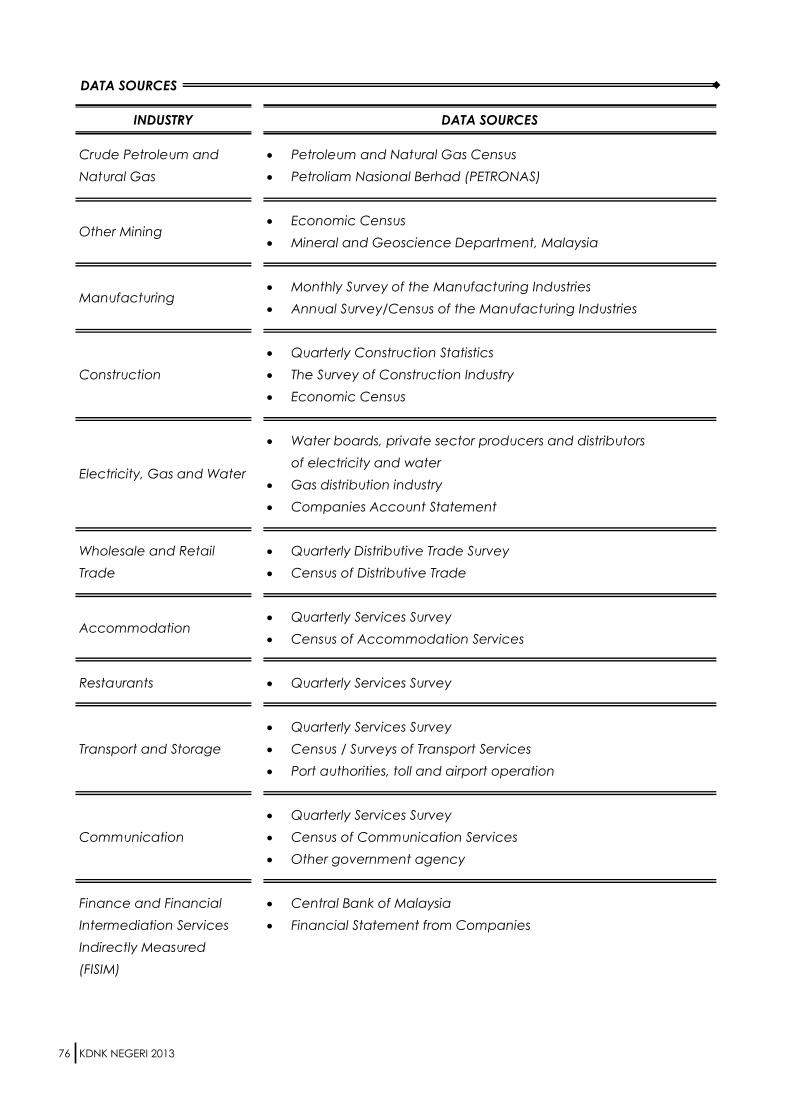
KDNK NEGERI 2013
DATA SOURCES
INDUSTRY DATA SOURCES
76
Crude Petroleum and
Natural Gas
Other Mining
Manufacturing
Construction
Electricity, Gas and Water
Wholesale and Retail
Trade
Accommodation
Restaurants
Transport and Storage
Communication
Finance and Financial
Intermediation Services
Indirectly Measured
(FISIM)
Petroleum and Natural Gas Census
Petroliam Nasional Berhad (PETRONAS)
Economic Census
Mineral and Geoscience Department, Malaysia
Monthly Survey of the Manufacturing Industries
Annual Survey/Census of the Manufacturing Industries
Quarterly Construction Statistics
The Survey of Construction Industry
Economic Census
Water boards, private sector producers and distributors
of electricity and water
Gas distribution industry
Companies Account Statement
Quarterly Distributive Trade Survey
Census of Distributive Trade
Quarterly Services Survey
Census of Accommodation Services
Quarterly Services Survey
Quarterly Services Survey
Census / Surveys of Transport Services
Port authorities, toll and airport operation
Quarterly Services Survey
Census of Communication Services
Other government agency
Central Bank of Malaysia
Financial Statement from Companies
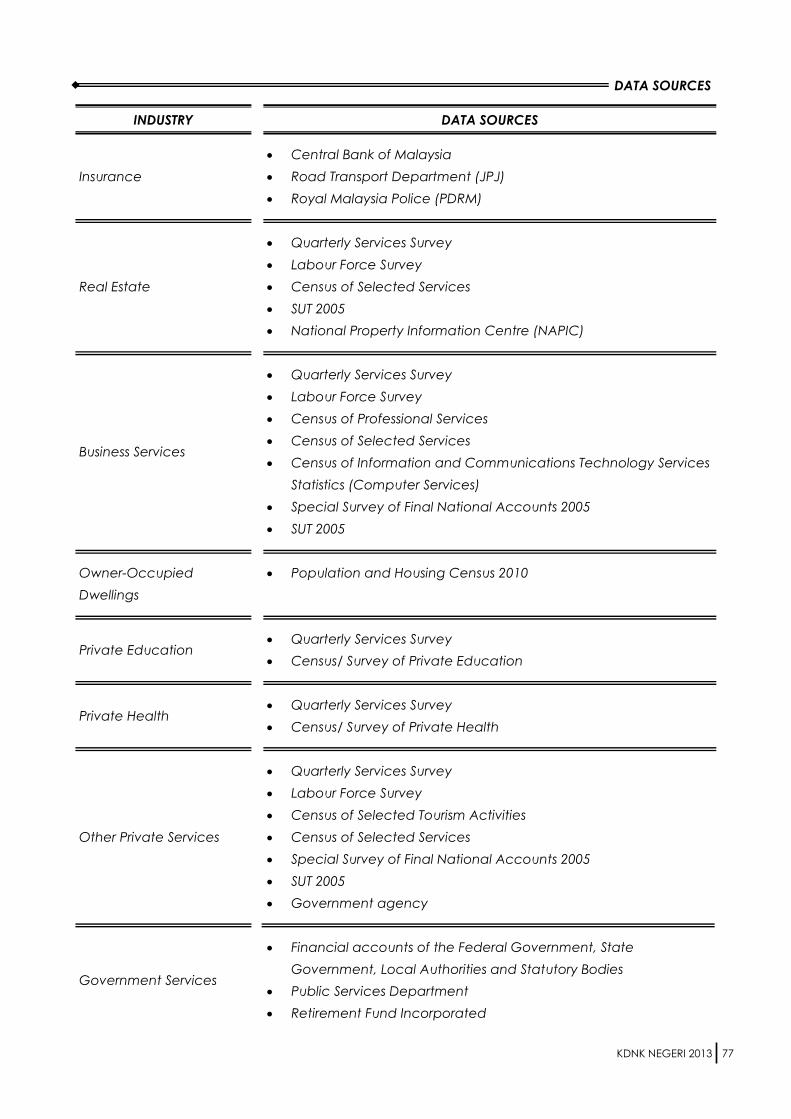
KDNK NEGERI 2013
DATA SOURCES
INDUSTRY DATA SOURCES
77
Insurance
Real Estate
Business Services
Owner-Occupied
Dwellings
Private Education
Private Health
Other Private Services
Government Services
Central Bank of Malaysia
Road Transport Department (JPJ)
Royal Malaysia Police (PDRM)
Quarterly Services Survey
Labour Force Survey
Census of Selected Services
SUT 2005
National Property Information Centre (NAPIC)
Quarterly Services Survey
Labour Force Survey
Census of Professional Services
Census of Selected Services
Census of Information and Communications Technology Services
Statistics (Computer Services)
Special Survey of Final National Accounts 2005
SUT 2005
Population and Housing Census 2010
Quarterly Services Survey
Census/ Survey of Private Education
Quarterly Services Survey
Census/ Survey of Private Health
Quarterly Services Survey
Labour Force Survey
Census of Selected Tourism Activities
Census of Selected Services
Special Survey of Final National Accounts 2005
SUT 2005
Government agency
Financial accounts of the Federal Government, State
Government, Local Authorities and Statutory Bodies
Public Services Department
Retirement Fund Incorporated
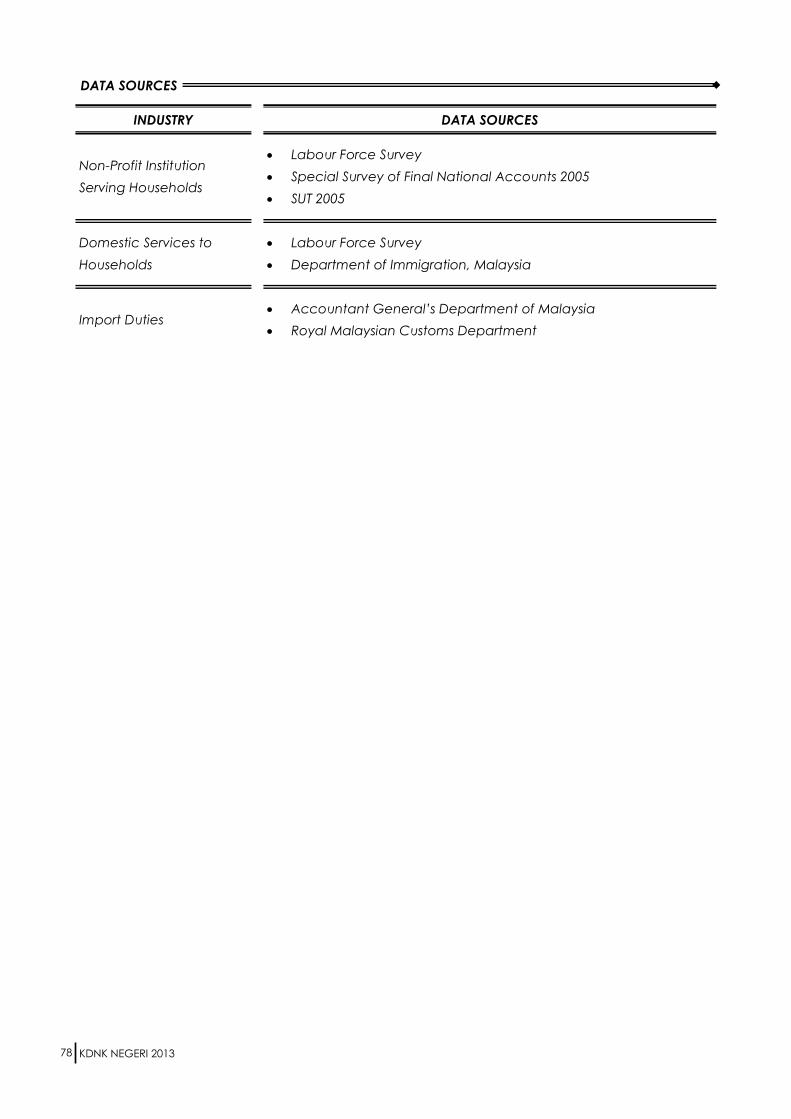
KDNK NEGERI 2013
DATA SOURCES
INDUSTRY DATA SOURCES
78
Non-Profit Institution
Serving Households
Domestic Services to
Households
Import Duties
Labour Force Survey
Special Survey of Final National Accounts 2005
SUT 2005
Labour Force Survey
Department of Immigration, Malaysia
Accountant General’s Department of Malaysia
Royal Malaysian Customs Department
GLOSARI
GLOSSARY
KDNK NEGERI 2013 I GDP BY STATE 2013
6

Glossary The following glossary of terms is drawn from 1993 & 2008 SNA
KDNK NEGERI 2013 79
A
Account
An account is a tool which records, for a given aspect of
economic life, the uses and resources or the changes in
assets and the changes in liabilities and/or the stock of
assets and liabilities existing at a certain time.
Accrual accounting
Accrual accounting records flows at the time economic
value is created, transformed, exchanged, transferred or
extinguished, so flows which imply a change of ownership
are entered when ownership passes, services are recorded
when provided, output at the time products are created
and intermediate consumption when materials and
supplies are being used.
Actual final consumption of general government
Actual final consumption of general government is
measured by the value of the collective consumption
services provided to the community, or large sections of the
community, by general government; it is derived from their
final consumption expenditure by subtracting the value of
social transfers in kind payable.
Actual final consumption of households
Actual final consumption of households is the value of the
consumption goods acquired by households, whether by
purchase or by transfer from government units or NPISHs,
and used by them for the satisfaction of their needs and
wants; it is derived from their final consumption expenditure
by adding the value of social transfers in kind receivable.
Ancillary activity
An ancillary activity is a supporting activity undertaken
within an enterprise in order to create the conditions within
which the principal or secondary activities can be carried
out.
Asset
An asset is a store of value representing a benefit or series
of benefits accruing to the economic owner by holding or
using the entity over a period of time. It is a means of
carrying forward value from one accounting period to
another.
B
Balance of payments
The balance of payments is a statistical statement that
systematically summarises, for a specific time period, the
economic transactions of an economy with the rest of the
world.
Balance of primary income
Balance of primary incomes is defined as the total value of
the primary incomes receivable by an institutional unit or
sector less the total of the primary incomes payable.
Base period
The period that provides the weights for an index is
described as the base period.
Basic price
The basic price is the amount receivable by the producer
from the purchaser for a unit of a good or service produced
as output minus any tax payable, and plus any subsidy
receivable, on that unit as a consequence of its production
or sale; it excludes any transport charges invoiced
separately by the producer.
C
Cash accounting
Cash accounting records only cash payments and record
them at the times these payments occur.
Central bank
A central bank is the public financial corporation which is a
monetary authority: that is, which issues banknotes and
sometimes coins and may hold all or part of the
international reserves of the country.
Central government
Central government is the body whose political authority
extends over the entire territory of the country and which
has the authority to impose taxes on all resident and non-
resident units engaged in economic activities within the
country.
Centre of economic interest
An institutional unit is said to have a centre of economic
interest within a country when there exists some location
within the economic territory of the country on, or from,
which it engages, and intends to continue to engage, in
economic activities and transactions on a significant scale,
either indefinitely or over a finite but long period of time.
Changes in inventories (including work-in-progress)
Changes in inventories are measured by the value of the
entries into inventories less the value of withdrawals and less
the value of any recurrent losses of goods held in
inventories during the accounting period.
C.i.f. price
The c.i.f. price (i.e. cost, insurance and freight price) is the
price of a good delivered at the frontier of the importing
country, or the price of a service delivered to a resident
before the payment of any import duties or other taxes on
imports or trade and transport margins within the country.
Collective consumption service
A collective consumption service is a service provided by
general government simultaneously to all members of the
community or to all members of a particular section of the
community, such as all households living in a particular
region.
Compensation of employees
Compensation of employees is the total remuneration, in
cash or in kind, payable by an enterprise to an employee in
return for work done by the latter during the accounting
period.
Computer software
Computer software consists of computer programs,
program descriptions and supporting materials for both
systems and applications software.
Constant prices
Constant prices are obtained by directly factoring changes
over time in the values of flows of goods and services into
two components reflecting changes in the prices of the
goods and services concerned and changes in their
volumes (i.e. changes in "constant price terms").
Consumption
Consumption is an activity in which institutional units use up
goods or services; consumption can be either intermediate
or final.
Glossary continued The following glossary of terms is drawn from 1993 & 2008 SNA
KDNK NEGERI 2013 80
Consumption of fixed capital
Consumption of fixed capital represents the reduction in
the value of the fixed assets used in production during the
accounting period resulting from physical deterioration,
normal obsolescence or nominal accidental damage.
Cultivated assets
Cultivated assets are livestock for breeding, dairy, draught,
etc. and vineyards, orchards and other plantations of trees
yielding repeat products that are under the direct control,
responsibility and management of institutional units.
Current account (balance of payments)
The current account (balance of payments) shows details
of goods and services, income, and current transfers.
Current transfer
A current transfer is a transaction in which one institutional
unit provides a good, service or asset to another unit
without receiving from the latter any good, service or asset
directly in return as counterpart and does not oblige one or
both parties to acquire, or dispose of, an asset.
D
Domestic output
Domestic output is output produced by resident enterprises.
Double deflation
Double deflation is a method whereby gross value added is
measured at constant prices by subtracting intermediate
consumption at constant prices from output at constant
prices.
Durable goods
Durable goods are one which may be used repeatedly or
continuously over a period of more than a year, assuming a
normal or average rate of physical usage.
Disposable income
Disposable income is the balancing item in the secondary
distribution of income account. It is derived from the
balance of primary incomes of an institutional unit or sector
by adding all current transfers, except social transfers in
kind, receivable by that unit or sector and subtracting all
current transfers, except social transfers in kind, payable by
that unit or sector.
E
Economic territory (of a country)
The economic territory of a country consists of the
geographic territory administered by a government within
which persons, goods, and capital circulate freely.
Economic territory (of an international organisation)
The economic territory of an international organisation
consists of the territorial enclave, or enclaves, over which it
has jurisdiction; these consist of clearly demarcated areas
of land or structures which the international organisation
owns or rents and which it uses for the purposes for which
the organisation was created by formal agreement with
the country, or countries, in which the enclave or enclaves
are physically located.
Economically significant prices
Prices are said to be economically significant when they
have a significant influence on the amounts the producers
are willing to supply and on the amounts purchasers wish to
buy.
Establishment
An establishment is an enterprise, or part of an enterprise,
that is situated in a single location and in which only a
single (non-ancillary) productive activity is carried out or in
which the principal productive activity accounts for most of
the value added.
Expenditures
Expenditures are the values of the amounts that buyers
pay, or agree to pay, to sellers in exchange for goods or
services that sellers provide to them or to other institutional
units designated by the buyers.
Excise duties
Excise duties consist of special taxes levied on specific kinds
of goods, typically alcoholic beverages, tobacco and fuels;
they may be imposed at any stage of production or
distribution and are usually assessed by reference to the
weight or strength or quantity of the product.
Export duties
Export duties consist of general or specific taxes on goods
or services that become payable when the goods leave
the economic territory or when the services are delivered to
non-residents; profits of export monopolies and taxes
resulting from multiple exchange rates are excluded.
Export taxes
Export taxes consists of taxes on goods or services that
become payable to government when the goods leave
the economic territory or when the services are delivered to
non-residents.
Exports of goods
Exports of goods consist of exports of the following items
from residents to non-residents, generally with a change of
ownership being involved: general merchandise, goods for
processing, repairs on goods, goods procured in foreign
ports by domestic carriers and non-monetary gold.
Exports of services
Exports of services consist of the following services provided
by residents to non-residents: transportation; travel;
communications; construction; insurance; financial;
computer and information; royalties and licence fees; other
business services; personal, cultural, and recreational
services; and government services n.i.e.
F
Final consumption
Final consumption consists of goods and services used by
individual households or the community to satisfy their
individual or collective needs or wants.
Final consumption expenditure of government
General government final consumption expenditure
consists of expenditure, including expenditure whose value
must be estimated indirectly, incurred by general
government on both individual consumption goods and
services and collective consumption services.
Final consumption expenditure of households
Household final consumption expenditure consists of the
expenditure, including expenditure whose value must be
estimated indirectly, incurred by resident households on
individual consumption goods and services, including those
sold at prices that are not economically significant and
including consumption goods and services acquired
abroad.
Glossary continued The following glossary of terms is drawn from 1993 & 2008 SNA
KDNK NEGERI 2013 81
Final consumption expenditure of NPISHs
Final consumption expenditure of NPISHs consists of the
expenditure, including expenditure whose value must be
estimated indirectly, incurred by resident NPISHs on
individual consumption goods and services and possibly on
collective consumption services.
Financial auxiliaries
Financial auxiliaries consist of financial corporations that are
principally engaged in activities associated with
transactions in financial assets and liabilities or with
providing the regulatory context for these transactions but
in circumstances that do not involve the auxiliary taking
ownership of the financial assets and liabilities being
transacted.
Financial intermediaries
Financial intermediaries are units which incur liabilities on
their own account on financial markets by borrowing funds
which they lend on different terms and conditions to other
institutional units.
Financial intermediation
Financial intermediation is a productive activity in which an
institutional unit incurs liabilities on its own account for the
purpose of acquiring financial assets by engaging in
financial transactions on the market.
Financial intermediation services indirectly measured
(FISIM)
Financial intermediation services indirectly measured (FISIM)
is an indirect measure of the value of financial
intermediation services provided but for which financial
institutions do not charge explicitly.
Financial lease
A financial lease is a contract between lessor and lessee
whereby the lessor purchases a good that is put at the
disposal of the lessee and the lessee pays rentals that
enable the lessor, over the period of the contract to cover
all or virtually all costs, including interest.
Finished goods - inventories
Inventories of finished goods consist of goods that are
ready for sale or shipment by the producer but which are
still held by the producer.
Fixed asset - existing
An existing fixed asset is one which has already been
acquired by at least one resident user, or produced on own
account, and whose value has, therefore, already been
included in the gross fixed capital formation of at least one
user at some earlier point in time in the current or some
previous accounting period.
F.o.b. price
The f.o.b. price (free on board price) is the c.i.f. price less
the costs of transportation, together with insurance
charges, between the customs frontier of the exporting
(importing) country and that of the importing (exporting)
country.
Functional classifications
Functional classifications provide a means of classifying, by
purpose or socio-economic objective, certain transactions
of producers and of three institutional sectors - namely
households, general government and non-profit institutions
serving households (NPISHs).
G
General government
The general government sector consists of the totality of
institutional units which, in addition to fulfilling their political
responsibilities and their role of economic regulation,
produce principally non-market services (possibly goods) for
individual or collective consumption and redistribute
income and wealth.
Goods
Goods are physical objects for which a demand exists, over
which ownership rights can be established and whose
ownership can be transferred from one institutional unit to
another by engaging in transactions on markets.
Goods for resale - inventories
Inventories of goods for resale are goods acquired by
enterprises, such as wholesalers and retailers, for the
purpose of reselling them without further processing (that is,
not transformed other than by presenting them in ways that
are attractive to the customer).
Government final consumption expenditure
Government final consumption expenditure consists of
expenditure, including imputed expenditure, incurred by
general government on both individual consumption goods
and services and collective consumption services.
Gross
The term "gross" is a common means of referring to values
before deducting consumption of fixed capital (generally
used as in "gross capital stock" or "gross domestic product").
Gross capital formation
Gross capital formation is measured by the total value of
the gross fixed capital formation, changes in inventories
and acquisitions less disposals of valuables for a unit or
sector.
Gross domestic product (GDP) - expenditure based
Consumption expenditure-based gross domestic product is
total final expenditures at purchasers' prices, less the f.o.b.
value of imports of goods and services.
Gross domestic product (GDP) - income based
Income-based gross domestic product is compensation of
employees, plus taxes less subsidies on production and
imports, plus gross mixed income, plus gross operating
surplus.
Gross domestic product (GDP) at output based
Output-based gross domestic product is the sum of the
gross values added of all resident producers at basic prices,
plus all taxes less subsides on products.
Gross domestic product (GDP) - market prices
Gross domestic product at market prices is the sum of the
gross values added of all resident producers at market
prices, plus taxes less subsidies on imports.
Gross fixed capital formation
Gross fixed capital formation is measured by the total value
of a producer's acquisitions, less disposals, of fixed assets
during the accounting period plus certain additions to the
value of non-produced assets (such as land or subsoil
assets) realised by the productive activity of institutional
units.
Glossary continued The following glossary of terms is drawn from 1993 & 2008 SNA
KDNK NEGERI 2013 82
Gross national disposable income
Gross national disposable income may be derived from
gross national income by adding all current transfers in cash
or in kind receivable by resident institutional units from non-
resident units and subtracting all current transfers in cash or
in kind payable by resident institutional units to non-resident
units.
Gross national income (GNI)
Gross national income (GNI) is the aggregate value of the
balances of gross primary incomes for all sectors; (gross
national income is identical to gross national product (GNP)
as hitherto understood in national accounts generally).
Gross saving
Gross saving is gross disposable income less final
consumption expenditure.
Gross value added
Gross value added is the value of output less the value of
intermediate consumption; it is a measure of the
contribution to GDP made by an individual producer,
industry or sector.
Gross value added at basic prices
Gross value added at basic prices is output valued at basic
prices less intermediate consumption valued at purchasers'
prices.
Gross value added at producers' prices
Gross value added at producers' prices is output valued at
producers' prices less intermediate consumption valued at
purchasers' prices.
H
Holding gains
Positive or negative holding gains may accrue during the
accounting period to the owners of financial and non-
financial assets and liabilities as a result of a change in their
prices (holding gains are sometimes referred to as "capital
gains").
Household
A household is a group of persons who share the same
living accommodation, who pool some, or all, of their
income and wealth and who consume certain types of
goods and services collectively, mainly housing and food.
Household actual final consumption
Household actual final consumption consists of the
consumption goods or services acquired by individual
households by expenditures or through social transfers in
kind received from government units or non-profit
institutions serving households (NPISHs).
Household final consumption expenditure
Household final consumption expenditure consists of the
expenditure, including expenditure whose value must be
estimated indirectly, incurred by resident households on
individual consumption goods and services, including those
sold at prices that are not economically significant
and including consumption goods and services acquired
abroad.
I
Illegal production
Illegal production is the production of goods or services
whose sale, distribution or possession is forbidden by law;
and production activities which are usually legal but which
become illegal when carried out by unauthorised
producers. The scope of illegal production varies
depending on the laws in place in individual countries (e.g.
prostitution is legal in some countries but illegal in others).
Import duties
Import duties consist of customs duties, or other import
charges, that are payable on goods of a particular type
when they enter the economic territory.
Imports of goods
Imports of goods consist of imports of the following items
from non-residents to residents, generally with a change of
ownership being involved; general merchandise, goods for
processing, repairs on goods, goods procured in foreign
ports by domestic carriers and non-monetary gold.
Imports of services
Imports of services consist of the following services
purchased by residents from non-residents: transportation;
travel; communications; construction; insurance; financial;
computer and information; royalties and licence fees; other
business services; personal, cultural, and recreational
services; and government services n.i.e.
Income
Income is the maximum amount that a household, or other
unit, can consume without reducing its real net worth.
Income from abroad - net
Net income from abroad is the difference between the
total values of the primary incomes receivable from and
payable to non-residents.
Income in kind received by employees
Income in kind received by employees is measured by the
value of the goods and services provided by employers to
their employees in remuneration for work done.
Industry
An industry consists of a group of establishments engaged
in the same, or similar, kinds of activity.
Indirect taxes
As traditionally understood, indirect taxes are taxes that
supposedly can be passed on, in whole or in part, to other
institutional units by increasing the prices of the goods or
services sold.
Insurance
The activity of insurance is intended to provide individual
institutional units exposed to certain risks with financial
protection against the consequences of the occurrence of
specified events; it is also a form of financial intermediation
in which funds are collected from policyholders and
invested in financial or other assets which are held as
technical reserves to meet future claims arising from the
occurrence of the events specified in the insurance
policies.
Intellectual property products
Intellectual property products are the result of research,
development, investigation or innovation leading to
knowledge that the developers can market or use to their
own benefit in production because use of the knowledge is
restricted by means of legal or other protection.
Interest
Interest is a form of income that is receivable by the owners
of certain kinds of financial assets, namely: deposits, debt
securities, loans and (possibly) other accounts receivable
for putting the financial asset at the disposal of another
institutional unit
Glossary continued The following glossary of terms is drawn from 1993 & 2008 SNA
KDNK NEGERI 2013 83
Intermediate consumption
Intermediate consumption consists of the value of the
goods and services consumed as inputs by a process of
production, excluding fixed assets whose consumption is
recorded as consumption of fixed capital.
Inventories
Inventories consist of stocks of outputs that are still held by
the units that produced them prior to their being further
processed, sold, delivered to other units or used in other
ways and stocks of products acquired from other units that
are intended to be used for intermediate consumption or
for resale without further processing.
Inventories of finished goods
Inventories of finished goods consist of goods that are
ready for sale or shipment, but held by the producer.
Inventories of goods for resale
Inventories of goods for resale consist of goods acquired by
enterprises, such as wholesalers and retailers, for the
purpose of reselling them without further processing (that is,
not transformed other than by presenting them in ways that
are attractive to the customer).
Inventories of materials and supplies
Inventories of materials and supplies are goods that their
owners intend to use as intermediate inputs in their own
production processes, not to resell.
Inventories of work-in progress
Inventories of work-in progress consist of goods and services
that are partially completed but that are not usually turned
over to other units without further processing or that are not
mature and whose production process will be continued in
a subsequent period by the same producer.
K
Kind-of-activity unit
A kind-of-activity unit is an enterprise, or a part of an
enterprise, which engages in only one kind of (non-
ancillary) productive activity or in which the principal
productive activity accounts for most of the value added.
L
Land
Land consists of the ground, including the soil covering and
any associated surface waters, over which ownership rights
are enforced and from which economic benefits can be
derived by their owners by holding or using them.
Land improvements
Land improvements are the result of actions that lead to
major improvements in the quantity, quality or productivity
of land, or prevent its deterioration.
Land under cultivation
Land under cultivation is land on which agricultural or
horticultural production is carried on for commercial or
subsistence purposes, including, in principle, land under
plantations, orchards and vineyards.
Laspeyres price index
A Laspeyres price index is a weighted arithmetic average
of price relatives using the values of the earlier period as
weights.
Laspeyres volume index
A Laspeyres volume index is a weighted arithmetic average
of quantity relatives using the values of the earlier period as
weights.
Legal entity
Legal entity a legal or social entity is one whose existence is
recognized by law or society independently of the persons,
or other entities, that may own or control it.
Livestock for breeding, dairy, draught, etc.
Livestock for breeding, dairy, draught, etc consist of
livestock that are cultivated for the products they provide
year after year.
Loans
Loans are financial assets that are created when a creditor
lends funds directly to a debtor, and are evidenced by
documents that are not negotiable.
Local government
Local government units are institutional units whose fiscal,
legislative and executive authority extends over the
smallest geographical areas distinguished for administrative
and political purposes.
M
Machinery and equipment
Machinery and equipment cover transport equipment,
machinery for information, communication and
telecommunications (ICT) equipment, and other machinery
and equipment.
Margin (trade)
A trade margin is the difference between the actual or
imputed price realised on a good purchased for resale
(either wholesale or retail) and the price that would have to
be paid by the distributor to replace the good at the time it
is sold or otherwise disposed of.
Market establishments
Market establishments produce mostly goods and services
for sale at prices which are economically significant.
Market non-profit institutions serving businesses
Market non-profit institutions serving businesses are created
by associations of the businesses whose interests they are
designed to promote and usually financed by contributions
or subscriptions from the group of businesses concerned;
the subscriptions are treated not as transfers but as
payments for services rendered.
Market output
Market output consists of output intended for sale at
economically significant prices.
Market prices
Market prices for transactions are the amounts of money
willing buyers pay to acquire something from willing sellers.
Market producers
Market producers are establishments, all or most of whose
output is market production.
Market price equivalents
Market price equivalents are proxies, or substitute measures,
for market prices in those cases for which no actual market
prices have been set; a customary approach is to construct
such prices by analogy with known market prices
established under conditions that are considered essentially
the same.
Glossary continued The following glossary of terms is drawn from 1993 & 2008 SNA
KDNK NEGERI 2013 84
Materials and supplies inventories
Inventories of materials and supplies are goods that their
owners intend to use as intermediate inputs in their own
production processes, not to resell.
Mineral exploration
Mineral exploration consists of the value of expenditures on
exploration for petroleum and natural gas and for non-
petroleum deposits. it includes prelicence costs, licence
and acquisition costs, appraisal costs and the costs of
actual test drilling and boring, as well as the costs of aerial
and other surveys, transportation costs, etc, incurred to
make it possible to carry out the tests.
N
National income
At the level of the total economy, national income is the
total value of the primary incomes receivable within the
economy less the total of the primary incomes payable by
resident units.
Net domestic product (NDP)
Net domestic product (NDP) is defined as gross domestic
product (GDP) less the consumption of fixed capital.
Net value added
Net value added is the value of output less the values of
both intermediate consumption and consumption of fixed
capital.
Non-durable good
A non-durable good is one which is used up entirely in less
than a year, assuming a normal or average rate of physical
usage.
Non-life insurance claims
Non-life insurance claims are the amounts payable in
settlement of damages that result from an event covered
by a non-life insurance policy during the current
accounting period.
Non-life insurance premiums
Non-life insurance premiums comprise both the actual
premiums payable by policyholders to obtain insurance
cover during the accounting period (premiums earned)
and the premium supplements payable out of the property
income attributed to insurance policyholders, but excluding
social contributions.
Non-market producers
Non-market producers consist of establishments owned by
government units or NPISHs that supply goods or services
free, or at prices that are not economically significant, to
households or the community as a whole.
Non-profit institutions (NPIs)
Non-profit institutions (NPIs) are legal or social entities
created for the purpose of producing goods and services
whose status does not permit them to be a source of
income, profit or other financial gain for the units that
establish, control or finance them.
Non-profit institutions engaged in market production
Non-profit institutions engaged in market production consist
of those NPIs which charge fees determined by their costs
of production and which are sufficiently high to have a
significant influence on the demand for their services, but
any surpluses such institutions make must be retained within
those institutions as their status as "Non-profit institutions
(NPIs)" prevents them from distributing them to others.
Non-profit institutions engaged in non-market production
Non-profit institutions engaged in non-market production
are NPIs that are incapable of providing financial gain to
the units which control or manage them, and which must
rely principally on funds other than receipts from sales to
cover their costs of production or other activities.
Non-profit institutions serving households (NPISHs)
Non-profit institutions serving households (NPISHs) consist of
non-market NPIs that are not controlled by government.
Non-resident
A unit is non-resident if its centre of economic interest is not
in the domestic economic territory (i.e. it operates from
abroad).
Non-residential buildings
Non-residential buildings are buildings other than dwellings,
including fixtures, facilities and equipment that are integral
parts of the structures and costs of site clearance and
preparation.
NPISH final consumption expenditure
Final consumption expenditure of NPISHs consists of the
expenditure, including imputed expenditure, incurred by
resident NPISHs on individual consumption goods and
services.
O
Operating lease
An operating lease is one where the legal owner is also the
economic owner and accepts the operating risks and
receives the economic benefits from the asset by using it
in a productive activity.
Operating surplus
Operating surplus is described as mixed income because it
implicitly contains an element of remuneration for work
done by the owner, or other members of the household,
that cannot be separately identified from the return to the
owner as entrepreneur.
Output produced for own final use
Output for own final use consists of products retained by
the producer for his own use as final consumption or capital
formation
Output
Output is defined as the goods and services produced by
an establishment, excluding the value of any goods and
services used in an activity for which the establishment does
not assume the risk of using the products in production, and
excluding the value of goods and services consumed by
the same establishment except for goods and services used
for capital formation (fixed capital or changes in
inventories) or own final consumption.
Own - account producers
Own - account producers consist of establishments
engaged in gross fixed capital formation for the enterprises
of which they form part or unincorporated enterprises
owned by households all or most of whose output is
intended for final consumption or gross fixed capital
formation by those households.
Own-account workers
Own-account workers are self-employed persons without
paid employees.
Glossary continued The following glossary of terms is drawn from 1993 & 2008 SNA
KDNK NEGERI 2013 85
P
Paasche price index
A Paasche price index is the harmonic average of price
relatives using the values of the later period as weights.
Paasche volume index
A Paasche volume index is the harmonic average of
volume relatives using the values of the later period as
weights.
Payments in kind other than remuneration in kind
Payments in kind other than remuneration in kind occur
when any of a wide variety of payments are made in the
form of goods and services rather than money.
Pension funds
Pension funds are units established for purposes of providing
benefits on retirement for specific groups of employees;
they have their own assets and liabilities, and they engage
in financial transactions in the market on their own
account; these funds are organised, and directed, by
individual private or government employers, or jointly by
individual employers and their employees.
Price
The price of a good or service is defined as the value of
one unit of that good or service.
Price index
A price index is an average of the proportionate changes
in the prices of a specified set of goods and services
between two periods of time.
Primary incomes
Primary incomes are incomes that accrue to institutional
units as a consequence of their involvement in processes of
production or ownership of assets that may be needed for
purposes of production.
Principal activity
The principal activity of a producer unit is the activity whose
value added exceeds that of any other activity carried out
within the same unit.
Producer's price
A producer's price is the amount receivable by the
producer from the purchaser for a unit of a good or service
produced as output minus any VAT, or similar deductible
tax, invoiced to the purchaser; it excludes any transport
charges invoiced separately by the producer.
Production
Production is an activity, carried out under the responsibility,
control and management of an institutional unit, that uses
inputs of labour, capital, and goods and services to
produce outputs of goods and services.
Production account
The production account records the activity of producing
goods and services as defined within the SNA.
Production boundary
The production boundary includes all production actually
destined for the market, whether for sale or barter, all
goods or services provided free to individual households or
collectively to the community by government units or
NPISHs, all goods produced for own use, own-account
production of housing services and services produced by
employing paid domestic staff.
Property income
Property income is the sum of investment income and rent.
Purchaser’s price
The purchaser’s price is the amount paid by the purchaser,
excluding any VAT or similar tax deductible by the
purchaser, in order to take delivery of a unit of a good or
service at the time and place required by the purchaser.
The purchaser’s price of a good includes any transport
charges paid separately by the purchaser to take delivery
at the required time and place.
Purchasing power parity (PPP)
A purchasing power parity (PPP) is defined as the number
of units of B’s currency that are needed in B to purchase
the same quantity of individual good or service as one unit
of A’s currency will purchase in A.
Q
Quasi-corporations
Quasi - corporations are unincorporated enterprises that
function as if they were corporations, and which have
complete sets of accounts, including balance sheets.
R
Real holding gains and losses
A real holding gain (loss) is the amount by which the value
of an asset increases (decreases) over the neutral holding
gain for the period, in the absence of transactions and
other changes in the volume of assets.
Real interest
Real interest is the difference between an actual payment
of nominal interest and a payment equal to the loss of
purchasing power on the monetary value of the principal
during the accounting period.
Reference rate of interest
The reference rate of interest (to be used in allocating
FISIM) is the pure cost of borrowing funds (i.e. a rate from
which the risk premium has been eliminated to the greatest
extent possible and which does not include any
intermediation services).
Remuneration in kind
Remuneration in kind occurs when an employee accepts
payment in the form of goods and services instead of
money.
Rent
Rent is the income receivable by the owner of a natural
resource (the lessor or landlord) for putting the natural
resource at the disposal of another institutional unit (a
lessee or tenant) for use of the natural resource in
production.
Rental
The rental is the amount payable by the user of a fixed
asset to its owner, under an operating lease or similar
contract, for the right to use that asset in production for a
specified period of time.
Rents on subsoil assets
Rents on subsoil assets are a form of property income; they
consist of the payments made to the owners of the subsoil
assets by institutional units permitting them to extract the
subsoil deposits over a specified period.
Glossary continued The following glossary of terms is drawn from 1993 & 2008 SNA
KDNK NEGERI 2013 86
Research and development
Research and development consists of the value of
expenditures on creative work undertaken on a systematic
basis in order to increase the stock of knowledge, including
knowledge of man, culture and society, and use of this
stock of knowledge to devise new applications. This does
not extend to including human capital as assets within the
SNA.
Residence
The residence of each institutional unit is the economic
territory with which it has the strongest connection, in other
words, its centre of predominant economic interest.
Rest of the world
The rest of the world consists of all non-resident institutional
units that enter into transactions with resident units, or have
other economic links with resident units.
S
Saving
Saving represents that part of disposable income (adjusted
for the change in pension entitlements) that is not spent on
final consumption goods and services.
Services
Services are the result of a production activity that changes
the conditions of the consuming units, or facilitates the
exchange of products or financial assets.
Single indicator method of deflation
A single indicator method of deflation is a means of
estimating the volume movements of value added directly
using only one time series instead of double deflation.
Social security schemes
Social security schemes are schemes imposed and
controlled by government units for the purpose of providing
social benefits to members of the community as a whole, or
of particular sections of the community.
Social transfers in kind
Social transfers in kind consist of goods and services
provided to households by government and NPISHs either
free or at prices that are not economically significant.
State government
State governments are institutional units exercising some of
the functions of government at a level below that of central
government and above that of the governmental
institutional units existing at a local level; they are
institutional units whose fiscal, legislative and executive
authority extends only over the individual "states" (often
referred to as "provinces") into which the country as a
whole may be divided.
Subsidies
Subsidies are current unrequited payments that
government units, including non-resident government units,
make to enterprises on the basis of the levels of their
production activities or the quantities or values of the goods
or services which they produce, sell or import.
T
Taxes on products
Taxes on products, excluding VAT, import and export taxes,
consist of taxes on goods and services that become
payable as a result of the production, sale, transfer, leasing
or delivery of those goods or services, or as a result of their
use for own consumption or own capital formation.
Taxes and duties on imports
Taxes and duties on imports, excluding VAT, consist of taxes
on goods and services that become payable at the
moment when the goods cross the national or customs
frontiers of the economic territory or when the services are
delivered by non-resident producers to resident institutional
units.
Taxes on entertainment
Taxes on entertainment consist of any taxes which are
levied specifically on the entertainment itself (such as on an
entry ticket) and which are not part of some broader tax
such as a VAT.
Taxes on imports
Taxes on imports consist of taxes and duties on imports that
become payable when goods enter the economic territory
by crossing the frontier or when services are delivered to
resident units by non-resident units.
Taxes on international transactions
Taxes on international transactions consist of taxes on travel
abroad, foreign remittances, foreign investments, etc.
except those payable by producers (such taxes payable
by producers are part of taxes on production while those
payable by non-producers are part of other current taxes).
Taxes on land, buildings or other structures
Taxes on land, buildings or other structures consist of taxes
payable regularly, usually each year, in respect of the use
or ownership of land, buildings or other structures utilised by
enterprises in production, whether the enterprises own or
rent such assets.
Taxes on lotteries, gambling and betting
Taxes on lotteries, gambling and betting consist of any
taxes, other than taxes on winnings, which are levied on
these types of operations; they are typically levied as a
percentage of the operator’s turnover.
Taxes less subsidies on production
Taxes less subsidies on production consist of taxes payable
or subsidies receivable on goods or services produced as
outputs and other taxes or subsidies on production, such as
those payable on the labour, machinery, buildings or other
assets used in production.
Taxes on specific services
Taxes on specific services consist of all taxes assessed on
the payment for specific services such as taxes on
transportation, communications, insurance, advertising,
hotels or lodging, restaurants, entertainment, gambling and
lotteries, sporting events, etc.
Taxes on the use of fixed assets
Taxes on the use of fixed assets include taxes levied
periodically on the use of vehicles, ships, aircraft or other
machinery or equipment used by enterprises for purposes of
production, whether such assets are owned or rented.
Time of acquisition
The times at which goods and services are acquired are
when the change of ownership occurs or the delivery of the
services is completed.
Time of recording
Transactions between institutional units have to be
recorded when claims and obligations arise, are
transformed or are cancelled - that is, on an accrual basis.
Glossary continued The following glossary of terms is drawn from 1993 & 2008 SNA
KDNK NEGERI 2013 87
Total economy
The total economy is defined as the entire set of resident
institutional units.
Total final consumption
Total final consumption is the total value of all expenditures
on individual and collective consumption goods and
services incurred by resident households, resident NPISHs
serving households and general government units.
Trade margin
A trade margin is the difference between the actual or
imputed price realised on a good purchased for resale
(either wholesale or retail) and the price that would have to
be paid by the distributor to replace the good at the time it
is sold or otherwise disposed of.
Trading gains and losses
The trading gain or loss from changes in the terms of trade is
the difference between real GDI and GDP in volume terms.
Transfer
A transfer is a transaction in which one institutional unit
provides a good, service or asset to another unit without
receiving from the latter any good, service or asset in return
as a direct counterpart.
Transport equipment
Transport equipment consists of equipment for moving
people and objects.
Transport margins
A transport margin consists of those transport charges paid
separately by the purchaser in taking delivery at the
required time and place.
V
Valuables
Valuables are produced goods of considerable value that
are not used primarily for production or consumption but
are held as store of value over time.
Value added - gross
Gross value added is the value of output less the value of
intermediate consumption; it is a measure of the
contribution to GDP made by an individual producer,
industry or sector.
Volume index
A volume index is an average of the proportionate
changes in the quantities of a specified set of goods or
services between two periods of time.
W
Weapons systems
Weapon Systems include vehicles and other equipment
such as warships, submarines, military aircraft, tanks, missile
carriers and launchers, etc. are recognised as produced
assets.
Wages and salaries
Wages and salaries consist of the sum of wages and salaries
in cash and wages and salaries in kind.
Wages and salaries in cash
Wages and salaries in cash consist of wages or salaries
payable at regular weekly, monthly or other intervals,
including payments by results and piecework payments;
plus allowances such as those for working overtime; plus
amounts paid to employees away from work for on holiday;
plus ad hoc bonuses and similar payments; plus
commissions, gratuities and tips received by employees.
Wages and salaries in kind
Wages and salaries in kind consist of remuneration in the
form of goods and/or services that are not necessary for
work and can be used by employees in their own time,
and at their own discretion, for the satisfaction of their own
needs or want or those of other members of their
households.
Work-in-progress
Work-in-progress consists of output produced by an
enterprise that is not yet sufficiently processed to be in a
state in which it is normally supplied to other institutional
units.
Work-in-progress on cultivated biological resources
Work-in-progress on cultivated biological resources consists
of output that is not yet sufficiently mature to be in a state
in which it is normally supplied to other institutional units.
KDNK NEGERI 2013 88
Untuk Mendapatkan Maklumat Lanjut
Hubungan untuk mendapatkan maklumat lanjut berkaitan Akaun Negara Malaysia yang disemak
adalah seperti di bawah ini. Di penghujung Seksyen ini juga diberikan maklumat bagi
mendapatkan salinan buku System of National Accounts 1993 (1993 SNA) dan 2008 (2008 SNA).
Pertanyaan berhubung penerbitan ini dan perangkaan atau perkhidmatan yang berkaitan boleh
dikemukakan kepada:
Bahagian Perangkaan Akaun Negara,
Jabatan Perangkaan Malaysia,
Tingkat 3, Unit 01-05, Wisma Minlon,
Batu 12, Lebuhraya Sungai Besi, Seri Kembangan,
43300 Selangor Darul Ehsan,
Malaysia
Tel : 603-8947 9083 , Faks : 603-8945 9735 , E-mel : [email protected]
Penerbitan berkenaan boleh dibeli dari:
Unit Khidmat Pengguna, Unit Khidmat Pengguna (Kaunter),
Jabatan Perangkaan Malaysia, Jabatan Perangkaan Malaysia,
Aras 1, Blok C6, Wilayah Persekutuan Kuala Lumpur,
Pusat Pentadbiran Kerajaan Persekutuan, Tingkat 14 & 15 , Wisma Sime Darby,
62514 Putrajaya, Jalan Raja Laut,
Malaysia. 50350 Kuala Lumpur,
Malaysia.
Tel : 603 – 8885 7000
Faks : 603 – 8888 9248 Tel : 603 – 2267 2400 samb. 2407
E-mel : [email protected] Faks : 603 – 2691 0639
Penerbitan ini juga boleh dicapai sepenuhnya melalui portal jabatan di
http://www.statistics.gov.my
Buku System of National Accounts 1993 (1993 SNA) dan 2008 (2008 SNA) tidak boleh diperoleh dari
Jabatan Perangkaan Malaysia. Walau bagaimanapun, buku berkenaan boleh dibeli dari
organisasi berikut :
1) United Nations, Sales Section,
300 East 42nd Street
Room IN-927A
New York, NY 10017 USA
Tel : 1 (212) 963 8302 , Faks : 1 (212) 963 3489
2) International Monetary Fund (IMF)
Publication Services
700 19th St NW
Washington DC 20431 USA
Tel : 1 (202) 263 7340 , Faks : 1 (202) 623 7201
KDNK NEGERI 2013 89
Contacts for Further Information
The contacts for further information relating to the revised Malaysian National Accounts are
provided below. The contact information for copies of System of National Accounts 1993 (1993
SNA) and 2008 (2008 SNA) is provided at the end of this section.
Enquiries about this publication and related statistics or services should be directed to :
National Accounts Statistics Division,
Department of Statistics, Malaysia
Level 3, Unit 01-05, Wisma Minlon,
Batu 12, Lebuhraya Sungai Besi, Seri Kembangan,
43300 Selangor Darul Ehsan,
Malaysia.
Tel : 603-8947 9083 , Fax : 603-8945 9735 , E-mail : [email protected]
Copies of these publications can be purchased from:
Customer Service Unit, Customer Service Unit (Counter),
Department of Statistics Malaysia, Department of Statistics Malaysia,
Level 1, Block C6, Wilayah Persekutuan Kuala Lumpur,
Federal Government Administrative Centre, Level 14 & 15 , Wisma Sime Darby,
62514 Putrajaya, Jalan Raja Laut,
Malaysia. 50350 Kuala Lumpur,
Malaysia.
Tel : 603 – 8885 7000
Fax : 603 – 8888 9248 Tel : 603 – 2267 2400 ext. 2407
E-mail : [email protected] Fax : 603 – 2691 0639
This publication can be fully downloaded at http://www.statistics.gov.my
Copies of System of National Accounts 1993 (1993 SNA) and 2008 (2008 SNA) are not available for
purchase from the Department of Statistics, Malaysia. However, the contact information where
they can be purchased includes the following:
1) United Nations, Sales Section,
300 East 42nd Street
Room IN-927A
New York, NY 10017 USA
Tel: 1 (202) 963 8302 , Fax: 1 (212) 963 3489
2) International Monetary Fund (IMF)
Publication Services
700 19th St NW
Washington DC 20431 USA
Tel: 1 (202) 263 7340 , Fax: 1 (202) 623 7201
KDNK NEGERI 2013 90
Pengarah
Jabatan Perangkaan Malaysia Negeri Johor
Tingkat 14, Menara Tabung Haji,
Jalan Ayer Molek,
80000 Johor Bahru, Johor.
Tel : 07 - 2253700
Fax : 07 - 2249972
e-mel : [email protected]
Pengarah
Jabatan Perangkaan Malaysia Negeri Pulau Pinang
Tingkat 6, Bangunan Persekutuan,
10400 Jalan Anson,
Pulau Pinang.
Tel : 04 - 2266244
Fax : 04 - 2299499
e-mel : [email protected]
Pengarah
Jabatan Perangkaan Malaysia Negeri Kedah
Tingkat 1 & 5, Blok C, Zon C, Wisma Persekutuan,
Pusat Pentadbiran Kerajaan Persekutuan,
Bandar Muadzam Shah,
06550 Anak Bukit, Kedah.
Tel : 04 - 7001240
Fax : 04 - 7338412
e-mel : [email protected]
Pengarah
Jabatan Perangkaan Malaysia Negeri Perak
Tingkat 3, Blok A,
Bangunan Persekutuan Greentown,
Jalan Dato' Seri Ahmad Said,
30450 Ipoh, Perak.
Tel : 05 -2554963
Fax : 05 - 2551073
e-mel : [email protected]
Pengarah
Jabatan Perangkaan Malaysia Negeri Kelantan
Tingkat 8, Wisma Persekutuan,
Jalan Bayam,
15514 Kota Bharu, Kelantan.
Tel : 09 - 7419449
Fax : 09 - 7482142
e-mel : [email protected]
Pengarah
Jabatan Perangkaan Malaysia Negeri Terengganu
Tingkat 9, Wisma Persekutuan,
Jalan Sultan Ismail,
20200 Kuala Terengganu, Terengganu.
Tel : 09 - 6223062
Fax : 09 - 6229659
e-mel : [email protected]
Pengarah
Jabatan Perangkaan Malaysia Negeri Melaka
Aras 7 & 8, Wisma Persekutuan,
Jalan MITC, Hang Tuah Jaya,
75450 Ayer Keroh,
Melaka.
Tel : 06 - 2522725
Fax : 06 - 2522711
e-mel : [email protected]
Pengarah
Jabatan Perangkaan Malaysia Negeri Sabah
Aras 1-3, Blok C,
Kompleks Pentadbiran Kerajaan Persekutuan Sabah,
Jalan UMS, Beg Berkunci 2046,
88999 Kota Kinabalu, Sabah.
Tel : 088 - 484602
Fax : 088 - 484659
e-mel : [email protected]
Pengarah
Jabatan Perangkaan Malaysia Negeri Sembilan
Tingkat 12, Wisma Persekutuan,
Jalan Dato' Abdul Kadir,
70000 Seremban, Negeri Sembilan.
Tel : 06 - 7655000
Fax : 06 - 7655002
e-mel : [email protected]
Pengarah
Jabatan Perangkaan Malaysia Negeri Sarawak
Tingkat 5, 7 & 8, Bangunan Tun Datuk
Patinggi Tuanku Haji Bujang,
Jalan Simpang Tiga,
93514 Kuching, Sarawak.
Tel : 082 - 240287/8
Fax : 082 - 242609
e-mel : [email protected]
Pengarah
Jabatan Perangkaan Malaysia Negeri Pahang
Tingkat 7, Wisma Persekutuan,
Jalan Gambut,
25000 Kuantan, Pahang.
Tel : 09 - 5163931/7
Fax : 09 - 5144636
e-mel : [email protected]
Pengarah
Jabatan Perangkaan Malaysia Negeri Selangor
Tingkat 9, Bangunan Darul Ehsan,
No.3, Jalan Indah, Seksyen 14,
40000 Shah Alam, Selangor.
Tel : 03 - 55150200
Fax : 03 - 55180408
e-mel : [email protected]
Pengarah
Jabatan Perangkaan Malaysia
Wilayah Persekutuan Kuala Lumpur
Tingkat 14 & 15 , Wisma Sime Darby,
Jalan Raja Laut,
50350 Kuala Lumpur.
Tel : 03 - 22672400
Fax : 03 - 26910639
e-mel : [email protected]
Pengarah
Jabatan Perangkaan Malaysia Negeri Perlis
Bangunan Perodua Kangar,
No. 2C, Persiaran Jubli Perak,
01000 Kangar, Perlis.
Tel : 04 - 9767381/9769025
Fax : 04 - 9768950
e-mel : [email protected]
PERTANYAAN BERHUBUNG DENGAN PENERBITAN INI DAN PENERBITAN LAIN BOLEH JUGA DIBUAT DI PEJABAT
PERANGKAAN NEGERI BERIKUT: ENQUIRIES ABOUT THIS AND OTHER PUBLICATIONS CAN ALSO BE MADE AT THE FOLLOWING STATE STATISTICS OFFICES: