imaging concentration profile using laser based … · adalah untuk mengkaji penggunaan kaedah...
TRANSCRIPT
IMAGING CONCENTRATION PROFILE USING LASER BASED TOMOGRAPHY
ADIE BIN MOHD. KHAFE
A project report submitted in partial fulfilment of the
requirements for the award of the degree of
Master of Electrical Engineering
(Mechatronics & Automatic Control)
Faculty of Electrical Engineering
Universiti Teknologi Malaysia
APRIL 2007

ii

iii
ACKNOWLEDGEMENT
First of all, I would like to thanks my supervisor, Dr. Sallehuddin Bin Ibrahim
for his effort, guidance and support throughout this project. Without his advice,
suggestions and guidance, the project would have not been successful.
I also want to express my appreciation to En. Mohd Amri Bin Md. Yunus and
En. Mohd. Sazli Bin Saad for their advice and help until this project completed. Special
thanks to my employer, Universiti Teknikal Malaysia Melaka for funding me throughout
my study here.
Lastly, thanks to my family and my fellow postgraduate colleagues who have
helped me a lot and give me support to assure this project run smoothly and
successfully.
iv
ABSTRACT
This project describes an investigation of the use of laser based tomography
in the measurement of concentration profile of flowing particles. The main purpose
is to investigate the use of an optical tomography method for on-line monitoring of
particles. The novelty of this method is that it can be used to provide cross-sectional
image of material distribution i.e. the concentration profile. This image is formed by
reconstruction of data obtained from the array of sensors. Images of the flow
captured using optical sensors are digitized into a form suitable for computer
processing of the flow pictures. The advantages of this method is that it is cheaper
and safer than most of the current methods which mostly made use of radioactive
methods. Various process industries such as petroleum and food processing can
benefit from such invention to improve their products and reduce the amount of
wastage. Laser diode was used as the light source and photodiode are used as the
receiving sensor in this project. The laser beam will be passed through the cross
sectional area of the conveyer pipe and the emitted light will strike the photodiode
located across the pipe. Besides the hardware, this project will include the use of
user friendly, Visual Basic program to visualize the concentration profile of the
flowing particles.
v
ABSTRAK
Projek ini bertujuan mengkaji penggunaan laser untuk proses tomografi bagi
mengenalpasti profil penumpuan untuk objek yang bergerak. Tujuan utamanya
adalah untuk mengkaji penggunaan kaedah tomografi optik bagi kegunaan
pengawasan partikel secara on-line. Keunikan kaedah ini adalah ia dapat memberi
imej keratan rentas taburan bahan yang melalui satu paip penghantaran. Imej ini
diperolehi melalui pemprosesan semula data yang diperolehi daripada jujukan
sensor yang diletakkan di bahagian luar paip penghantar. Imej-imej bagi pergerakan
partikel yang dikesan oleh sensor diubah kepada bentuk digital yang sesuai untuk
diproses oleh komputer. Kebaikan kaedah ini adalah ianya lebih murah dan lebih
selamat daripada kebanyakan kaedah yang digunakan kini yang mana
kebanyakannya adalah menggunakan kaedah radioaktif. Beberapa industri
pemprosesan seperti petroleum dan makanan boleh memanfaatkan hasil kajian ini
bagi menambahbaik produk mereka dan juga pengurangan bahan terbuang. Bagi
projek ini, potodiod digunakan sebagai penerima (sensor) dan sumber laser iaitu
laser diod digunakan sebagai pemancar. Cahaya laser akan dipancarkan melalui
keratan rentas paip penghantar dan cahaya yang dipancarkan ini akan mengenai
potodiod yang diletak pada satu lagi bahagian yang merentasi paip tersebut. Sistem
ini menggunakan dua ortogonal projeksi bersama 16 sumber laser diod. Selain dari
perkakasan dan litar yang digunakan di atas, projek ini juga akan menggunakan
program Visual Basic bagi tujuan penghasilan imej visual profil penumpuan bagi
partikel yang bergerak tersebut.
vi
TABLE OF CONTENTS
CHAPTER TITLE PAGE
DECLARATION ii
ACKNOWLEDGEMENT iii
ABSTRACT iv
ABSTRAK v
TABLE OF CONTENTS vi
LIST OF TABLES ix
LIST OF FIGURES x
LIST OF SYMBOLS xii
LIST OF APPENDICES xiv
I INTRODUCTION 1
1.1 Tomography Overview 2
1.2 Aims and Objectives of the Project 4
1.3 Thesis Outline 5
II BRIEF REVIEW OF TOMOGRAPHIC TECHNOLOGY 7
2.1 Basic Tomographic System 7
2.2 Sensor Type and Selection 13
2.2.1 Electrical Capacitance Tomography 14
2.2.2 Ultrasonic Tomography 15
2.2.3 Gamma Ray Tomography 17
2.2.4 Optical Tomography 18
vii
2.3 The Proposed Optical Tomography System 20
III EMITTER AND RECEIVER 21
3.1 Basic Principle of Laser 22
3.2 Convergence and Divergence of Laser Beam 23
3.3 Collimation of Laser Beam 26
3.4 Difficulties of Laser Beam Delivery 27
3.5 Laser Diode : A Brief History 28
3.5.1 Semiconductor Laser Diode 29
3.5.2 Type of Semiconductor Laser Diode –
Double Heterostructure Laser 32
3.5.3 Type of Semiconductor Laser Diode –
Quantum Well Laser 34
3.5.4 Type of Semiconductor Laser Diode –
Separate Confinement Heterostructure
Laser 35
3.6 The Photodiode 36
3.7 Photodiode Sensitivity 38
3.8 PIN Photodiode 38
IV RESEARCH METHODOLOGY 40
4.1 Introduction of the Process 40
4.2 Basic Structure of the Process 41
4.3 Sensor Array Arrangement 44
4.4 Principle of Measurement for Optical
Tomography 44
4.5 Functional Block Diagram of The Measurement
System 46
4.6 Data Acquisition System 48
4.7 Image Reconstruction 49
viii
4.7.1 Linear Back Projection (LBP) 50
4.8 Software Development 54
V HARDWARE DEVELOPMENT & MEASUREMENT 55
5.1 Sensor’s Jig & Fixture 55
5.1.1 Projection Modeling 57
5.1.2 Sensor Output for Non Flow Condition 61
5.1.3 Sensor Output for Single Flowing Object 62
5.2 Improvement of Non Uniform Measurement 64
5.3 Emitter & Receiver Circuit 65
5.4 Concentration Profile Measurement of Flowing
Object 68
VI RESULT, CONCLUSION AND FUTURE WORK
SUGGESTION 69
6.1 Concentration Profile and the Color Scale 70
6.2 Result of Image Reconstruction 71
6.3 Summary 75
6.4 Conclusion 765
6.6 Suggestion for Future Work 77
REFERENCES 78
Appendices A – D 80 -131

ix
LIST OF TABLES
TABLE TITLE PAGE 2.1 Sensor Grouping 13
x
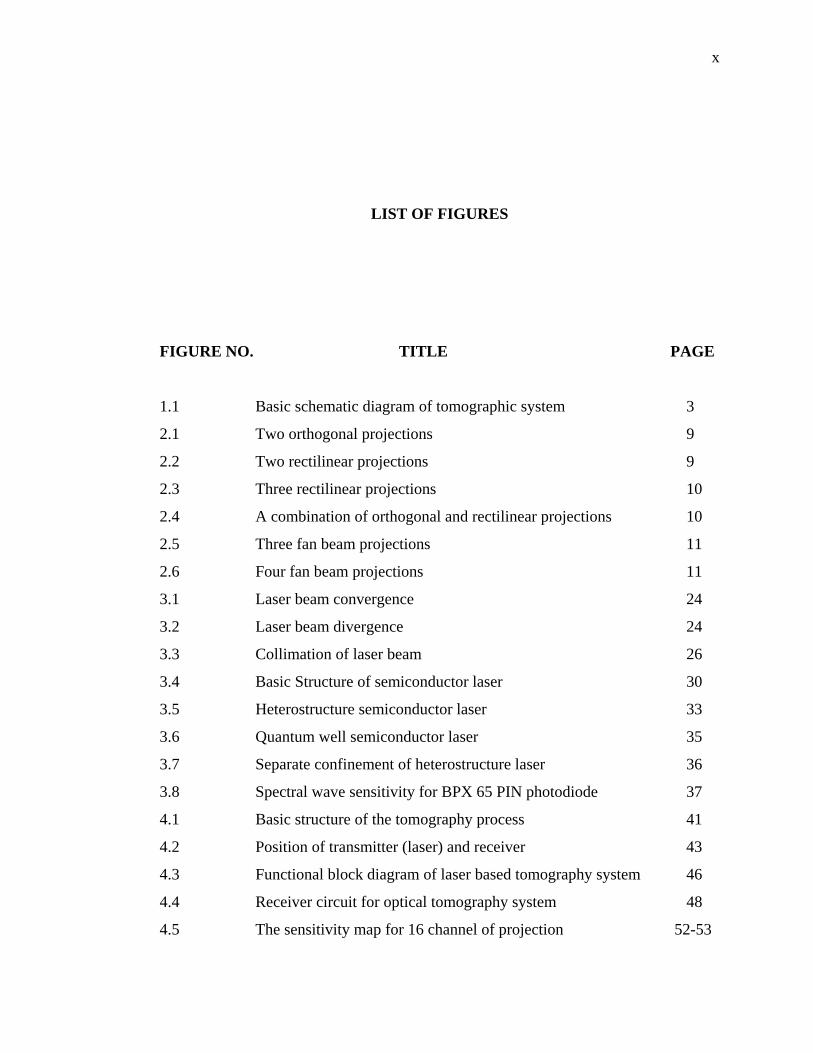
LIST OF FIGURES
FIGURE NO. TITLE PAGE
1.1 Basic schematic diagram of tomographic system 3
2.1 Two orthogonal projections 9
2.2 Two rectilinear projections 9
2.3 Three rectilinear projections 10
2.4 A combination of orthogonal and rectilinear projections 10
2.5 Three fan beam projections 11
2.6 Four fan beam projections 11
3.1 Laser beam convergence 24
3.2 Laser beam divergence 24
3.3 Collimation of laser beam 26
3.4 Basic Structure of semiconductor laser 30
3.5 Heterostructure semiconductor laser 33
3.6 Quantum well semiconductor laser 35
3.7 Separate confinement of heterostructure laser 36
3.8 Spectral wave sensitivity for BPX 65 PIN photodiode 37
4.1 Basic structure of the tomography process 41
4.2 Position of transmitter (laser) and receiver 43
4.3 Functional block diagram of laser based tomography system 46
4.4 Receiver circuit for optical tomography system 48
4.5 The sensitivity map for 16 channel of projection 52-53
xi
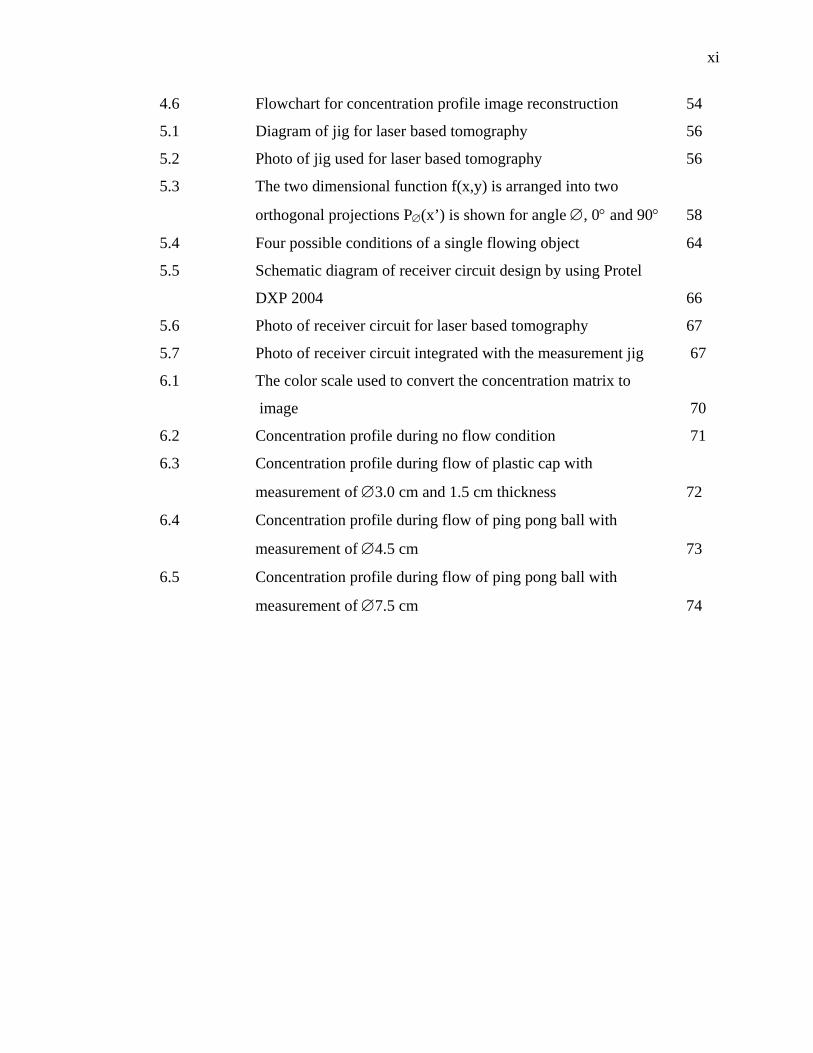
4.6 Flowchart for concentration profile image reconstruction 54
5.1 Diagram of jig for laser based tomography 56
5.2 Photo of jig used for laser based tomography 56
5.3 The two dimensional function f(x,y) is arranged into two
orthogonal projections P∅(x’) is shown for angle ∅, 0° and 90° 58
5.4 Four possible conditions of a single flowing object 64
5.5 Schematic diagram of receiver circuit design by using Protel
DXP 2004 66
5.6 Photo of receiver circuit for laser based tomography 67
5.7 Photo of receiver circuit integrated with the measurement jig 67
6.1 The color scale used to convert the concentration matrix to
image 70
6.2 Concentration profile during no flow condition 71
6.3 Concentration profile during flow of plastic cap with
measurement of ∅3.0 cm and 1.5 cm thickness 72
6.4 Concentration profile during flow of ping pong ball with
measurement of ∅4.5 cm 73
6.5 Concentration profile during flow of ping pong ball with
measurement of ∅7.5 cm 74
xii
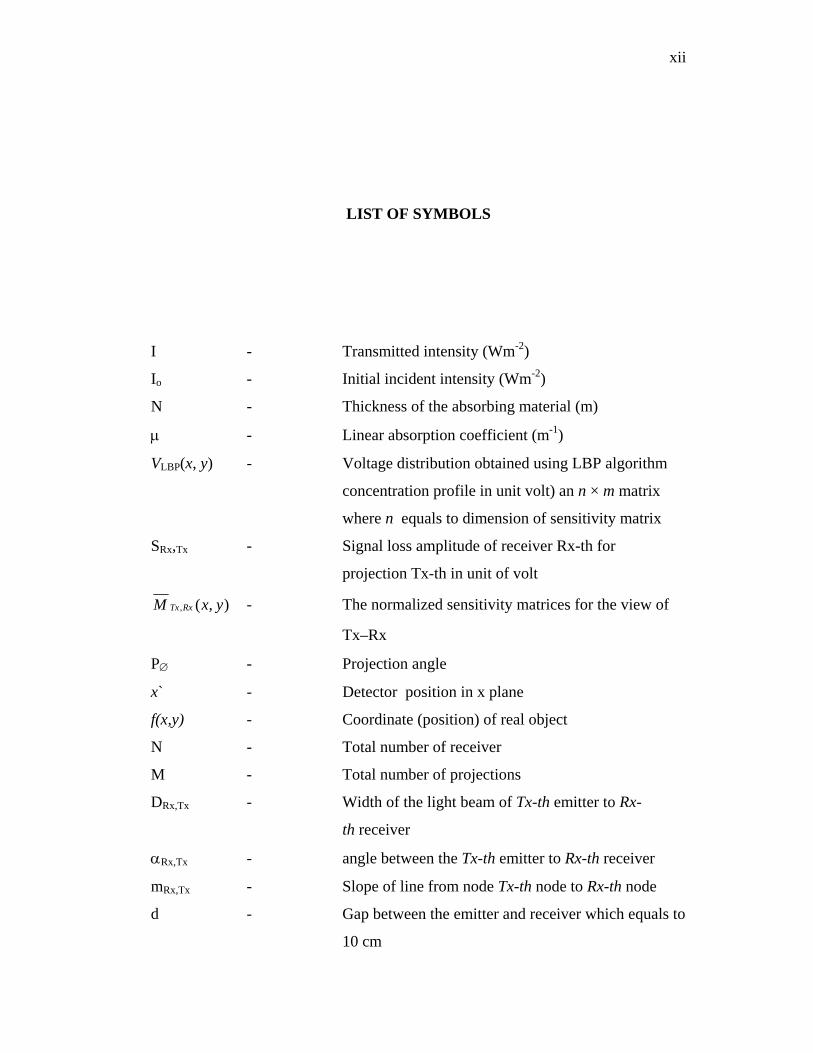
LIST OF SYMBOLS
I - Transmitted intensity (Wm-2)
Io - Initial incident intensity (Wm-2)
N - Thickness of the absorbing material (m)
μ - Linear absorption coefficient (m-1)
VLBP(x, y) - Voltage distribution obtained using LBP algorithm
concentration profile in unit volt) an n × m matrix
where n equals to dimension of sensitivity matrix
SRx,Tx - Signal loss amplitude of receiver Rx-th for
projection Tx-th in unit of volt
),(, yxM RxTx - The normalized sensitivity matrices for the view of
Tx–Rx
P∅ - Projection angle
x` - Detector position in x plane
f(x,y) - Coordinate (position) of real object
N - Total number of receiver
M - Total number of projections
DRx,Tx - Width of the light beam of Tx-th emitter to Rx-
th receiver
αRx,Tx P - angle between the Tx-th emitter to Rx-th receiver
mRx,Tx P - Slope of line from node Tx-th node to Rx-th node
d P - Gap between the emitter and receiver which equals to
10 cm
xiii
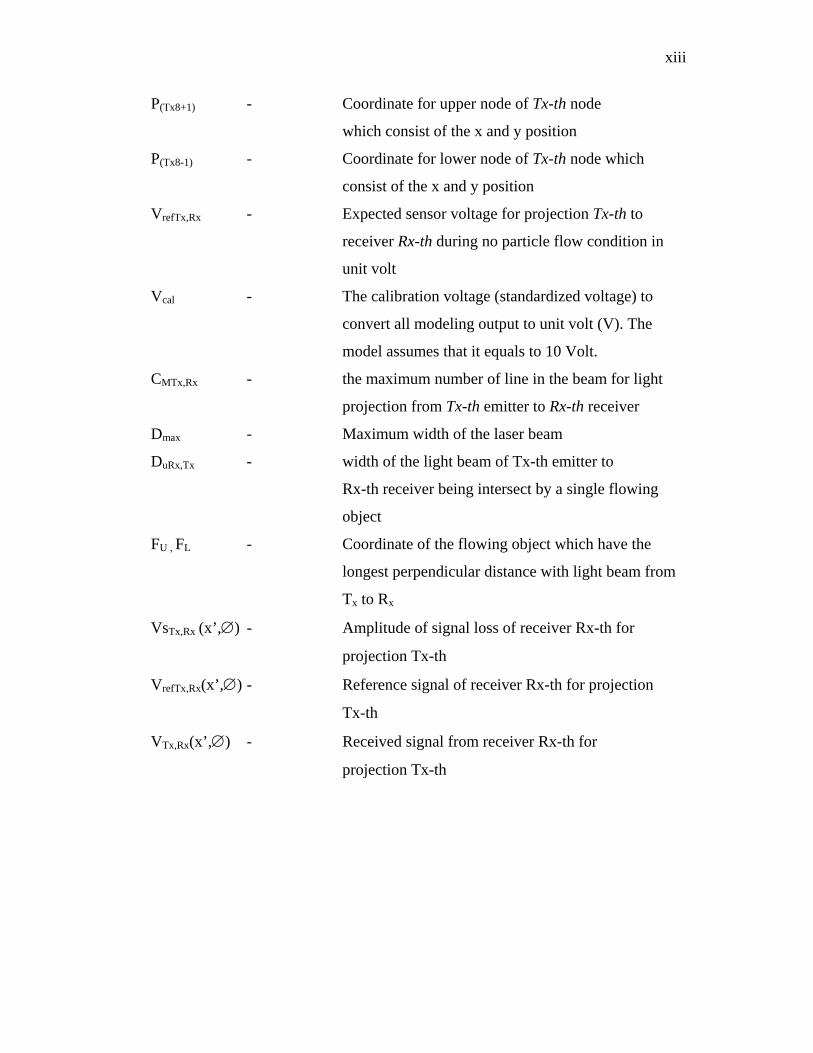
P(Tx8+1) P - Coordinate for upper node of Tx-th node
which consist of the x and y position
P(Tx8-1)P - Coordinate for lower node of Tx-th node which
consist of the x and y position
VrefTx,Rx P - Expected sensor voltage for projection Tx-th to
receiver Rx-th during no particle flow condition in
unit volt
Vcal P - The calibration voltage (standardized voltage) to
convert all modeling output to unit volt (V). The
model assumes that it equals to 10 Volt.
CMTx,Rx P - the maximum number of line in the beam for light
projection from Tx-th emitter to Rx-th receiver
Dmax P - Maximum width of the laser beam
DuRx,Tx - width of the light beam of Tx-th emitter to
Rx-th receiver being intersect by a single flowing
object
FU , FL - Coordinate of the flowing object which have the
longest perpendicular distance with light beam from
Tx to Rx
VsTx,Rx (x’,∅) - Amplitude of signal loss of receiver Rx-th for
projection Tx-th
VrefTx,Rx(x’,∅) - Reference signal of receiver Rx-th for projection
Tx-th
VTx,Rx(x’,∅) - Received signal from receiver Rx-th for
projection Tx-th

xvii
LIST OF APPENDICES
APPENDIX TITLE PAGE
A BPX65 Photodiode Data Sheet 80-84
B TL084 IC Data Sheet 85-104
C Layout of PCB Circuit 105
D Source Code Program 106 - 131
A Open loop response 105
B M-file program 113
C Response of the system with controller 115
D Presentation slides 131
CHAPTER I
INTRODUCTION
As defined in one encyclopedia (Helicon 1991), the word “tomography” is
derived from the Greek language, which tomo means “slice” and graph means
“picture”. In another word, tomography is a method of viewing the plane section
image of an object .
Process tomography provides several real time methods of viewing the
cross-section of a process to provide information relating to the material
distribution. This involves by taking numerous measurement from sensors which
placed around the section of the process being investigated and processing the data
to reconstruct an image. The process involves the use of noninvasive sensors to
acquire vital information in order to produce two or three-dimensional images of
the dynamic internal characteristic of process system. Information on the flow
regime, vector velocity, and concentration distribution may be determined from the
images. Such information can assist in the design of process equipment,
verification of existing computational modeling and simulation techniques, or to
assist in process control and monitoring.
2
Process tomography refers to any tomographic method used to measure the
internal state of a chemical process (e.g. material distribution in a reactor,
multiphase flow fields in piping or concentration uniformity in mixers). By
tomographic techniques, it can measure quantities such as the flow rate or solid
concentration of material flowing through a pipeline and the distribution of
material inside a chemical reactors or a mixer. This type of information is not
usually obtainable with the sensor traditionally used by engineer, therefore these
techniques gives a better understanding of the flow of material through the plant
and the data can be used to design better process equipment and to control certain
processes to maximize yield and quality. Basically, in a tomography system several
sensors are installed around the pipe or vessel to be imaged. The sensor output
signals depend on the position of the component boundaries within their sensing
zones. A computer is used to reconstruct a tomographic image of the cross-section
being interrogated by the sensors. Real time images can be obtained which measure
the dynamic evolution of the parameters being detect at the sensors [1].
1.1 Tomography Overview
Process tomography involves the use of non-invasive sensors to acquire
vital information in order to produce two or three dimensional images of the
dynamic internal characteristics of process systems. Information can assist in the
design of process equipment, verification of existing computational modeling and
simulation techniques, or to assist in process control and monitoring.
At present, the usual objectives of using tomographic systems is to obtain
concentration profiles of moving components of interest within the measurement
3
section in the form of a visual image, which is updated at a refreshment rate
dependent upon the process being investigated.
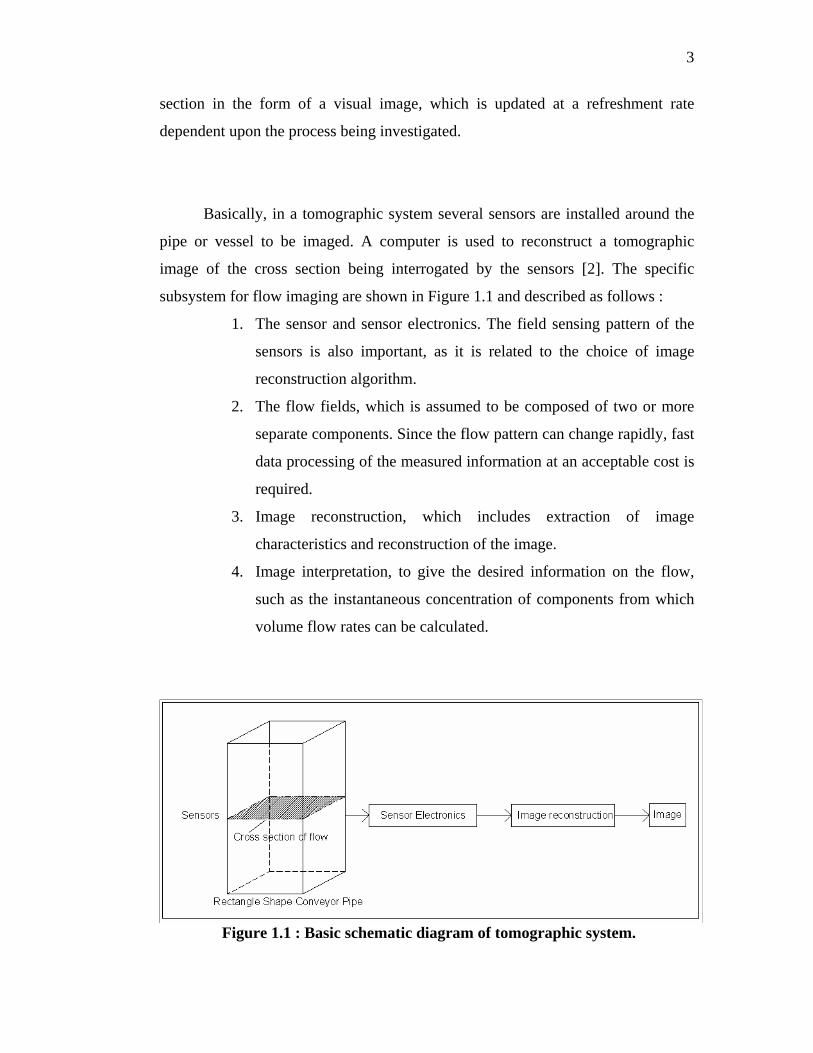
Basically, in a tomographic system several sensors are installed around the
pipe or vessel to be imaged. A computer is used to reconstruct a tomographic
image of the cross section being interrogated by the sensors [2]. The specific
subsystem for flow imaging are shown in Figure 1.1 and described as follows :
1. The sensor and sensor electronics. The field sensing pattern of the
sensors is also important, as it is related to the choice of image
reconstruction algorithm.
2. The flow fields, which is assumed to be composed of two or more
separate components. Since the flow pattern can change rapidly, fast
data processing of the measured information at an acceptable cost is
required.
3. Image reconstruction, which includes extraction of image
characteristics and reconstruction of the image.
4. Image interpretation, to give the desired information on the flow,
such as the instantaneous concentration of components from which
volume flow rates can be calculated.
Figure 1.1 : Basic schematic diagram of tomographic system.

4
Basically, in a tomography system, several sensors are installed around the
pipe or vessel to be imaged. The sensor output signals depend on the position of the
component boundaries within their sensing zone. A computer is used to reconstruct
a tomographic image of the cross section being interrogated by the sensors. Real
time images can be obtained which measure the dynamic evolution of the
parameters being detect at the sensor. And all that is required for a practical system
is an image updated frequently enough for the smallest relevant feature of the flow
to be observed [3].
1.2 Aims and Objectives of the Project
This project aims to investigate the use of tomographic measurement for on-
line monitoring of two-component mixtures especially providing cross-sectional
image of material distribution i.e. the concentration profile. The specific objectives
of this project are :
1. To investigate the use of laser based tomography in measurement of
concentration profile of flowing particles.
2. To search information regarding hardware fabrication techniques and the
suitable optical sensor for measurement application.
3. To implement the using of laser diode laser as the transmitter or source.
4. To utilize photodiode as a detector.
5. To develop cross-sectional image using suitable software.
6. To measure the concentration profile and visualize an online image
reconstruction using suitable software.

5
7. To interface the hardware & software system by using a suitable interfacing
card.
8. Propose improvement & solution for the problem for future investigation.
1.3 Thesis Outline
This thesis consists of six chapters. Chapter 1 gives the introduction of the
system, overview of process tomography, aims and objectives of the project and
the thesis outline.
Chapter 2 provides literature review of this project. It includes the
introduction about tomography, type of tomography system and type of projection
can be used in tomography process. It also gives brief explanation about this
project.
Chapter 3 illustrates some ideas about the emitter and receiver being used in
this project.
Chapter 4 is the explanation about methodology of this project, start from
the theory of the laser based tomography, overview hardware feature, signal
conditioning circuit and the software development on image reconstruction.

6
Chapter 5 presents the process of hardware modeling and fabrication steps.
It also discussed about emitter and receiver circuit and also brief explanation about
the measurement steps.
Chapter 6 draws the conclusion of the whole project. This chapter also
contains the suggestions for future improvement.
78
REFERENCES 1. Elmy Johana Mohamad, Ruzairi Abdul Rahim, Sallehudin Ibrahim,
Shaharum Sulaiman, Mohamad Shukri Manaf (2005). Flame Imaging
Using Laser-Based Transmision Tomography. Sensors and Actuators A 127
(2006) : 332-339.
.
2. S Ibrahim, R G Green, K Dutton, K Evans R Abdul Rahim and A Goude
(1999). Optical Sensor Configurations for Process Tomography. Meas. Sci.
Technol. 10 (1999) : 1079-1086.
3. W.P. Dugdale (1994). An Optical Instrumentation System for the Imaging
of Two Component Flow. Sheffield Hallam University : Ph.D Thesis.
4. Elmy Johana Mohamad (2005). Flame Imaging Using Laser-Based
Transmission Tomography. Universiti Teknologi Malaysia : Master Thesis.
5. Chan Kok San, R Abdul Rahim (2002). Optical Tomography Sensor
Configuration. 2nd World Eng. Cong. Sarawak, Malaysia.
6. Chan Kok San (2001), “Image Reconstruction For Optical Tomography”,
Universiti Teknologi Malaysia : Bachelor Degree Thesis.
7. Yong Yang (1996). Mass Flow Measurement of Bulk Solids in Pneumatic
Pipelines. Meas. Sci. Technol. : page 1687-1706.
8. Yong Yang (1996). Mass Flow Measurement of Bulk Solids in Pneumatic
Pipelines. Meas. Sci. Technol. : page 1687-1706.
9. S Ibrahim (2000). Measurement of Gas Bubbles in a Vertical Water
Column Using Optical Tomography. Sheffield Hallam University : Ph.D
Thesis.
79
10. Hans P Zappe (2004). Laser Diode Microsystems. Springer Publication.
11. John P Bentley (2005). Principles of Measurement System. Fourth Edition.
Pearson – Prentice Hall Publication.
12. “http://en.wikipedia.org/wiki/Laser_diode
13. David F.Stout(1976).Handbook of operational amplifier circuit design.
United States. McGraw-Hill.