estimating biomass in logged tropical forest using l-band ... hamidan omar.pdf · is in the type of...
TRANSCRIPT

Sains Malaysiana 44(8)(2015): 1085–1093
Estimating Biomass in Logged Tropical Forest Using L-Band SAR (PALSAR) Data and GIS
(Penganggaran Biojisim dalam Hutan Tropika telah Diteroka menggunakan Data SAR Berjalur L (PALSAR) dan GIS)
HAMDAN OMAR*, MOHD HASMADI ISMAIL, KHALI AZIZ HAMZAH, HELMI ZULHAIDI MOHD SHAFRI & NORIZAH KAMARUDIN
ABSTRACT
The use of remote sensing imagery, to some extends geographic information system (GIS), have been identified as the most recent and effective technologies to assess forest biomass. Depending on the approaches and methods employed, estimating biomass by using these technologies sometimes can lead to uncertainties. The study was conducted to investigate appropriate methods for estimating aboveground biomass (AGB) by using synthetic aperture radar (SAR) data. A total of 60187 ha in Dungun Timber Complex (DTC) were selected as the study area. Thirty seven sample plots, measuring 30×30 m were established in early 2012 covering both natural and logged forests. Phase Array Type L-Band SAR (Palsar) images that were acquired in 2010 were used as primary remote sensing input and shapefile polygons comprised logging records was used as supporting information. By using these data, two estimation methods, which were ‘stratify and multiply’ (SM) and ‘direct remote sensing’ (DR) have been adopted and the results were compared. The estimated total AGB were about 20.1 and 22.3 million Mg, from SM and DR methods, respectively. The study found that the images that incorporated texture measures produced more accurate estimates as compared to the images without texture measures. The study suggests that SM method still a viable and reliable technique for quick assessment of AGB in a large area. The DR method is also relevant provided that an appropriate type and processing techniques of SAR data are utilized.
Keywords: Biomass estimate; GIS; L-band SAR; tropical forest
ABSTRAK
Penggunaan citra penderiaan jauh dan seiringan dengan sistem maklumat geografi (GIS), telah dikenal pasti sebagai teknologi terkini yang paling efektif untuk penilaian biojisim hutan. Penganggaran biojisim menggunakan teknologi ini bergantung kepada pendekatan dan kaedah yang diguna pakai kerana kadangkala ia boleh membawa kepada kesilapan. Kajian ini dijalankan untuk menentukan kaedah yang sesuai untuk menganggar biojisim atas tanah (BAT) menggunakan data bukaan radar sintetik (SAR). Sejumlah 60187 ha di dalam kawasan Kompleks Kayu-Kayan Dungun (DTC) telah dipilih sebagai kawasan kajian. Tiga puluh tujuh plot sampel berukuran 30×30 m telah disediakan di dalam kawasan kajian pada awal tahun 2012 merangkumi kedua-dua hutan asli dan hutan yang telah dibalak. Fasa tatasusunan jenis SAR berjalur L (Palsar) merupakan data penderiaan jauh yang dicerap pada tahun 2010 telah digunakan sebagai input utama, manakala poligon yang mengandungi rekod pembalakan telah digunakan sebagai maklumat sokongan. Dengan menggunakan data-data tersebut, dua kaedah penganggaran iaitu ‘mengelas dan mendarab’ (SM) dan juga ‘penderiaan jauh langsung’ (DR) telah diguna pakai dan hasil daripada kedua-duanya dibandingkan. Kajian menganggarkan BAT yang masing-masing 20.1 dan 22.3 juta Mg dijalankan melalui kaedah SM dan DR. Kajian juga mendapati bahawa imej yang telah menggunakan ukuran tekstur menghasilkan anggaran yang lebih tepat berbanding imej tanpa ukuran tekstur. Kajian ini menyarankan bahawa kaedah SM masih relevan untuk penilaian segera AGB bagi kawasan yang luas. Kaedah DR juga relevan dengan syarat teknik pemprosesan data SAR yang sesuai digunakan.
Kata kunci: Anggaran biojisim; GIS; hutan tropika; SAR berjalur L
INTRODUCTION
Tropical forests are known to store larger amount of biomass than the other forest types found in the world. Peninsular Malaysia that has about 5.8 million ha of tropical forest stores a considerable amount of carbon in terms of living biomass. Out of this, about 2.7 million ha is in the type of lowland dipterocarp forest. This kind of forest is a central for local timber productions and wood extractions, where logging activities often take place under
sustainable management system. The stock and changes of biomass in these areas are dynamic as the trees are selectively felled for timber production and the remaining stands are left for the next cutting cycle. Biomasswasidentifiedasanessentialclimatevariable(ECV) by the United Nations Framework Convention on Climate Change (UNFCCC),which is needed to fill theknowledge gaps of the climate system (Sessa & Dolman 2008). Further strong impetus to improve methods for

1086
measuring global biomass comes from the Reduction of Emissions due to Deforestation and Forest Degradation (REDD) mechanism, which was introduced in the UNFCCC Committee of the Parties (COP-13) Bali Action Plan. REDD is dedicated to the developing countries around the world including Malaysia, where there is expected to be high deforestation rate. Its implementation relies fundamentally on systems to monitor carbon emissions due to loss of biomass from deforestation and forest degradation (Le Toan et al. 2011). Besides measuring the biomass, there is also an increasing recognition of the protective roles of the forests such as the conservation of biodiversity, protection of soil and water resources and stabilizing the climate. These concerns finally brought the ‘plus’ in REDD+. In Malaysia the REDD+ mechanism under the UNFCCC currently being discussed, presents an incentive that may encourage implementation of improved management practices to reduce forest degradation. One of the elements of REDD+ is the development of a reference level, where biomass of forests are measured to be compared in the future. This will be followed by monitoring(and/ormeasuring),reportingandverification(MRV) processes when the REDD+ mechanism is commenced. Therefore, accurate methods for estimating aboveground biomass (AGB) in logged forest are needed to estimate the effects of carbon sequestration after logging and to evaluate the baseline for nations’ carbon storage on the REDD+ scheme (Gibbs et al. 2007). This kind of forest also needs for new research utilizing new technology and current trend of forest management (Jong et al. 2001; Wright 2010). National REDD+ strategy is currently considering the MRV method during implementations steps proceeding. Other countries are also in similar status. Since then, many studies have been carried out to measure forest biomass at various levels, i.e. pilot sites, sub-national and national. In this concern, remote sensing has been recognized as one of the primary spatial inputs for this process (Angelsen et al. 2009; Gibbs et al. 2007). Space-borne remote sensing are currently tested widely and suggested as a tool in REDD+ MRV. However in many parts of the world, especially in tropical region, the frequent cloud conditions often restrain the acquisition of high-quality remotely sensed data by optical sensors. The acquisition of cloud-free, wall-to-wall optical satellite images in tropical countries is almost impossible (Asner 2001). Thus, synthetic aperture radar (SAR) data become the only feasible way of acquiring remotely sensed data within a given timeframe because the SAR systems are independent of cloud coverage, weather and light conditions. While SAR system offers some advantages in estimating forest biomass, the saturation problem is common in the data (Quinones & Hoekman 2004). It means that the sensitivity of the returned signal (i.e. backscatter intensity) will cease atcertainthresholdofbiomass.Thishasbeenidentifiedas a critical challenge since the last few decades (Lu 2006). The relatively low saturation level causes dramatic limitations on the applicability of radar methodology for
biomass estimation in tropical forests that typically have high levels of biomass. Hence tactical methods need to be developed to overcome or at least minimize this problem. Realizing that the methods adopted could affect the accuracy AGB estimates, this study therefore was conducted. Two estimation methods namely ‘stratify and multiply’ (SM) and ‘direct remote sensing’ (DR) have been adopted to investigate their capability in estimating AGB in natural and logged forests. The SM method is performed by assigning a single value (or a range of values) to each value on land cover, forest type or other thematic map classes that have been derived from satellite data (or other map sources) and placed into various categories (such as natural lowland forest, logged and secondary forest). These thematic classes are then multiplied by the assigned values to estimate the total biomass values. Geographic information system (GIS) is more useful tool to conduct this method. The DR approach is more consistent in producing spatially distributed biomass maps. It extends the satellite measurementsdirectlytoamapaftercalibratingwithfieldAGB estimates. In the simplest terms this approach makes useofasetoffieldmeasurementstotrainanalgorithmto develop a set of rules by which any combination of satellite data (whether SAR, optical or a combination of them) produce a unique solution in terms of ‘observed’ (i.e.fieldestimated)AGB (Goetz et al. 2009). Although there are options to use multiple sensors in DR method, this study focused only on the use of phased array L-band SAR (Palsar) on board the Japanese Advanced Land Observing Satellite (Alos) for the assessment. The objectives of this study were to estimate AGB of natural and logged lowland dipterocarp forest by using SM and DR methods; to establish a method for accurate AGB estimations; and to investigate variability of AGB distribution within forest strata.
MATERIALS AND METHODS
THE STUDY AREA
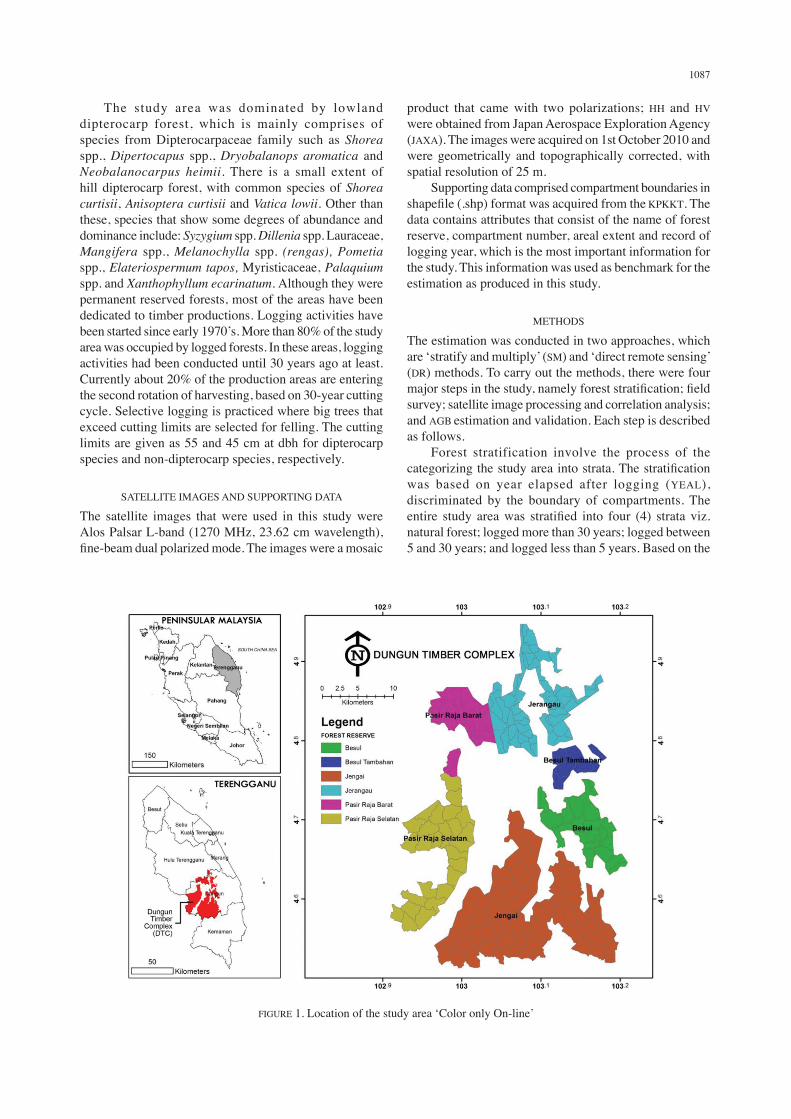
The study area is located within 4.95oN, 102.90oE (upper left) and 4.50oN, 103.25oE (lower right). It is part of the Dungun Timber Complex (DTC), which is located about 120 km to the southwest of the State capital Kuala Terengganu, in the administrative district of Dungun (Figure 1). The study area consists of six Permanent Reserved Forests (PRFs) namely Besul, Besul Tambahan, Jengai, Jerangau, Pasir Raja Barat and Pasir Raja Selatan, which made up a total areal extent of 60187 ha. It is currently being managed by Kumpulan Kayu Kayan Terengganu Sdn Bhd (KPKKT), a forest concessioner appointed by the Terengganu State Government. The area has a typical tropical monsoon climate with uniformly high temperatures (from 24.2 to 29.9oC), high humidity (from 70 to 98%) and a relatively high rainfall of up to in excess of 4000 mm per year. The topography in the study area was heterogeneous, comprisesflatriverplainsandswamps,undulatinghillsand mountainous areas, especially in the western areas.
1087
The study area was dominated by lowland dipterocarp forest, which is mainly comprises of species from Dipterocarpaceae family such as Shorea spp., Dipertocapus spp., Dryobalanops aromatica and Neobalanocarpus heimii. There is a small extent of hill dipterocarp forest, with common species of Shorea curtisii, Anisoptera curtisii and Vatica lowii. Other than these, species that show some degrees of abundance and dominance include: Syzygium spp. Dillenia spp. Lauraceae, Mangifera spp., Melanochylla spp. (rengas), Pometia spp., Elateriospermum tapos, Myristicaceae, Palaquium spp. and Xanthophyllum ecarinatum. Although they were permanent reserved forests, most of the areas have been dedicated to timber productions. Logging activities have been started since early 1970’s. More than 80% of the study area was occupied by logged forests. In these areas, logging activities had been conducted until 30 years ago at least. Currently about 20% of the production areas are entering the second rotation of harvesting, based on 30-year cutting cycle. Selective logging is practiced where big trees that exceed cutting limits are selected for felling. The cutting limits are given as 55 and 45 cm at dbh for dipterocarp species and non-dipterocarp species, respectively.
SATELLITE IMAGES AND SUPPORTING DATA
The satellite images that were used in this study were Alos Palsar L-band (1270 MHz, 23.62 cm wavelength), fine-beamdualpolarizedmode.Theimageswereamosaic
product that came with two polarizations; HH and HV were obtained from Japan Aerospace Exploration Agency (JAXA). The images were acquired on 1st October 2010 and were geometrically and topographically corrected, with spatial resolution of 25 m. Supporting data comprised compartment boundaries in shapefile(.shp)formatwasacquiredfromthe KPKKT. The data contains attributes that consist of the name of forest reserve, compartment number, areal extent and record of logging year, which is the most important information for the study. This information was used as benchmark for the estimation as produced in this study.
METHODS
The estimation was conducted in two approaches, which are ‘stratify and multiply’ (SM) and ‘direct remote sensing’ (DR) methods. To carry out the methods, there were four majorstepsinthestudy,namelyforeststratification;fieldsurvey; satellite image processing and correlation analysis; and AGB estimation and validation. Each step is described as follows. Forest stratification involve the process of the categorizingthestudyareaintostrata.Thestratificationwas based on year elapsed after logging (YEAL), discriminated by the boundary of compartments. The entire study areawas stratified into four (4) strata viz.natural forest; logged more than 30 years; logged between 5 and 30 years; and logged less than 5 years. Based on the
FIGURE 1. Location of the study area ‘Color only On-line’
1088
strata,thefieldsurveyprocesswascarriedout.Atotalof43 plots, measuring 30×30 m were established in early 2012employingstratifiedrandomsamplingdesign.Theextents of these strata were used in SM method to estimate total AGB. Out of the total plots, 37 plots were used for sampling and the remaining 6 plots were retained for validation. In each plot, all stands measuring 5 cm and above of diameter at breast height (dbh) were measured. The allometric function of trees and the calculation of AGB were carried out according to Kato et al. (1978). The aboveground living biomass of a tree can be calculated as
1/H = 1/(2.0*D) + 1/61. (1)
From the values of D and H, the dry mass of stem, branches and leaves of the tree is estimated as following:
Ms=0.0313*(D2H)
0.9733 . (2)
Mb=0.136*Ms
1.070. (3)
1/Mll=1/(0.124Ms
0.794)+1/125. (4)
where H denotes the total tree height; D is the stem diameter at breast height; Ms, Mb, and Ml denote the dry mass of stem, branches and leaves, respectively. The AGB that was calculated for each tree was summed to produce a plot-based AGB. Plot-based biomass was calculated in mass per hectare, where all plots yielded AGB in Mg ha-1. The Alos Palsar image that was used in this study was built on 16-bit data type and all pixels have digital numbers (DN) ranging from 0-65535. These DNs however do not represent the radar signal of features or objects on the ground. Therefore, the DNs have to be converted to backscatter coefficients (radar signals) known as normalized radar cross section (NRCS) and represented in decibels (dB). The equation that was used for the calculation of NRCS for Palsar are slightly different from other sensors in the usual sine term that has already been included in the DN values. Thus the equation for NRSC of any of the polarization component can be obtained by the following formula with single calibration factor, which can be expressed as (5) for distributed scatterers (Shimada et al. 2009).
10 × log10(DN2) + CF, (5)
where CF = -83.0.
Studies by Robinson et al. (2013), Saatchi et al. (2011) and Sarker et al. (2012) have demonstrated that the image with incorporation of texture measure improved the accuracy of forest biomass estimations. Studies by Franklin et al. (2000) and Kandasawamy et al. (2005) also showed that the incorporation of texture measure can improveclassificationofSAR images. Texture measure or known as gray-level co-occurrence matrix (GLCM) uses a
gray-tone spatial dependence matrix to calculate texture values. This matrix will calculate relative frequencies with which pixel values occur in two neighboring processingwindowsseparatedbyaspecifieddistanceanddirection, with a central pixel at the center of the windows. For thispurpose texturehasbeendefinedas repeatingpattern of local variations in image intensity which is too finetobedistinguishedasseparateclassattheobservedresolution. Thus, a connected set of pixels satisfying a given gray-level properties which occur repeatedly in an image region constitute a textured region. It shows the number of occurrences of the relationship between a pixel (P) of row (i) and column (j)anditsspecifiedneighbor.Mean-type GLCM (µ), with a windows size of 5×5 pixels (or 125×125 m) was then applied to the original image to obtain a measurement unit of about 1 ha. The GLCM canbedefinedas:
(6)
With both sampling plots information and satellite images (original and textured) datasets ready, regression analysis was then conducted. The plot-based AGB was correlated with the corresponding pixel value to produce empirical estimation model. In this case, only HV polarization was used for the analysis as suggested by Hamdan et al. (2011), Lucas et al. (2010) and Sandberg et al. (2011). Validation was then performed on the estimation results to determine magnitude of error and reliability of the estimates.
RESULTS AND DISCUSSION
SAMPLING PLOTS
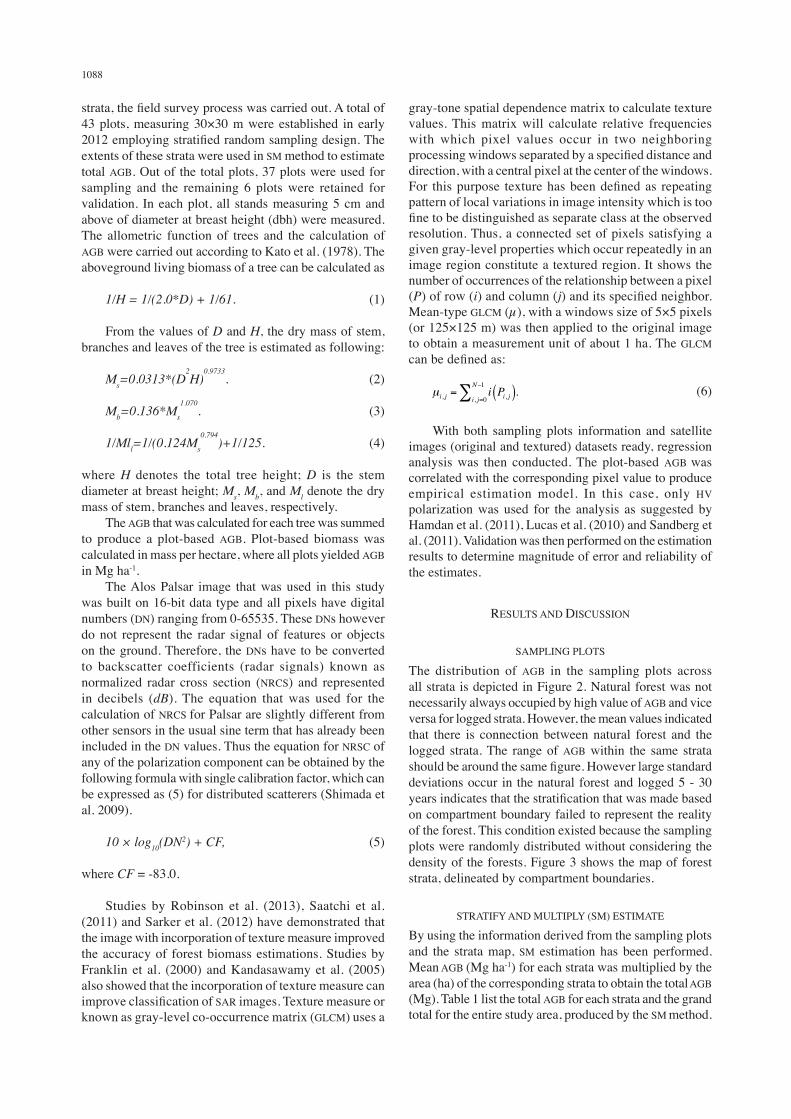
The distribution of AGB in the sampling plots across all strata is depicted in Figure 2. Natural forest was not necessarily always occupied by high value of AGB and vice versa for logged strata. However, the mean values indicated that there is connection between natural forest and the logged strata. The range of AGB within the same strata shouldbearoundthesamefigure.Howeverlargestandarddeviations occur in the natural forest and logged 5 - 30 yearsindicatesthatthestratificationthatwasmadebasedon compartment boundary failed to represent the reality of the forest. This condition existed because the sampling plots were randomly distributed without considering the density of the forests. Figure 3 shows the map of forest strata, delineated by compartment boundaries.
STRATIFY AND MULTIPLY (SM) ESTIMATE
By using the information derived from the sampling plots and the strata map, SM estimation has been performed. Mean AGB (Mg ha-1) for each strata was multiplied by the area (ha) of the corresponding strata to obtain the total AGB (Mg). Table 1 list the total AGB for each strata and the grand total for the entire study area, produced by the SM method.
1089
The total AGB within the study area was estimated at about 20.1 million Mg, with average of 340.1 Mg ha-1. Another option to calculate the total AGB is by averaging the mean AGB in Table 1 and multiplied by the total extent of study area of 60187 ha. The result will return 20,469,598.70 Mg, which is 374,134.66 Mg higher than the estimation that was based on strata mean.
DIRECT REMOTE SENSING (DR) ESTIMATES
Regression analysis, which correlating both image variables with the AGB from the sampling plots was conducted. The results showed that there was a slight increaseofcoefficientofdetermination(R2) when texture measure was applied to the original image. Although there wasenoughstatisticalevidence(i.e.significancevalue<0.05) to show that the HV backscatteringcoefficientsfrom original image has a correlation with the AGB, the textured image showed better relationship with higher R2. These results are attributed to the synergy among texture processing on the one hand, which were able to average
TABLE 1. Stratify and multiply estimates of AGB
Strata Mean AGB(Mg ha-1)
Extent(ha)
Total AGB(Mg)
Natural forestLogged > 30 yearsLogged 5 - 30 yearsLogged < 5 years
405.90377.78320.33256.39
7,35311,30234,2957,237
2,984,582.704,269,669.5610,985,717.351,855,494.43
Total - 60,187 20,095,464.04
TABLE 2. Model summary and parameter estimates
Image variablesModel summary Parameter estimates
R2 n Significance Constant CoefficientOriginal image*Textured image**
0.4030.660
3737
0.0030.001
4070.709306900
0.2130.481
Dependent Variable: AGBBothestimationsaresignificantatp-valueof0.05andconfidenceintervalof95%*TheindependentvariableisHV(σ,dB)**The independent variable is texture values of HV (unitless)
FIGURE 2. Boxplots of AGBinthesamplingplots.Thefigureabove each box represents distribution mean of corresponding
strata, indicated by the horizontal line inside the box
FIGURE 3. Strata of forests in the study area ‘Color only On-line’
out random speckle noise that presence in the original image (Sarker et al. 2012). This demonstrated that the estimation of AGB by using SAR imagery is affected by the noise. Table 2 summarizes the statistical information extracted from the analysis and Figure 4 shows the scatter plots of the data.

1090
The model can be written in mathematical form as:
AGB = 4070.709*e0.213(HV) (6)
AGB = 306900*e0.481(TexHV) (7)
where e indicates the equations as exponential form, HV isthebackscatteringcoefficientof HV polarization (σ, dB) from original image and TexHV is the pixel values derived from Mean co-occurrence matrix of HV polarization with 5×5 windows size. By using the models developed, the distribution of AGB for the entire study area was estimated on pixel basis. Each pixel value on the images was converted in AGB values and the estimations produced from both image by using (6) and (7). Figure 5 shows spatial distribution of AGB in the entire study area. Qualitatively, both maps look identical in distribution pattern but there was a considerable difference
in terms of quantitative distribution, as shown in Figure 6. From the graph, it is obvious that a large variation of AGB distribution exist between both image variables. (A) The distribution of AGB is concentrating around the mean of 236 Mg ha-1, which the most frequent pixel occurred within the range of 200 - 250 Mg ha-1. (B) The distribution of AGB is concentrating around the mean of 355 Mg ha-1, which the most frequent pixel occurred within the range of 320 - 380 Mg ha-1. From the distribution, total AGB for the study area was calculated from both image variables. Table 3 summarizes the distribution, with the total AGB estimates included. Estimation that was based on original image yielded a relative low value, with only about 14.2 million Mg as compared to the estimation by textured image that returned a total AGB of about 22.3 million Mg. The difference is about 8 million Mg, with average shift of about 135.31 Mg ha-1. Based on conventional inventory method, estimated AGB in natural forest is normally
FIGURE 4. Scatter plots between the measured AGB and image variables of (a) original image and (b) textured image
FIGURE 5. Spatial distribution of AGB in the study area, estimated from (a) original image and (b) textured image ‘Color only On-line and Press’

1091
around 350 - 550 and 300 - 400 Mg ha-1 for logged forest, depending on site conditions (Abdul Rashid et al. 2009). Therefore the estimate produced by original image has underestimated the AGB in the study area, thus suggesting that the estimate from textured image is more reliable.
VALIDATION OF THE RESULTS
The results were validated using 6 independent plots that were established together with the sampling plots. The predicted AGB values extracted from the estimations were compared with the validation plots (Figure 7). The scatter plots include the values of measured AGB on the ground against the predicted AGB from the two estimation models. The result showed that the model using original image has underestimated about 2.6%, while textured image overestimated about 0.3%. Root mean square error (RMSE) for the original image estimation was at ±44.76 Mg ha-1.
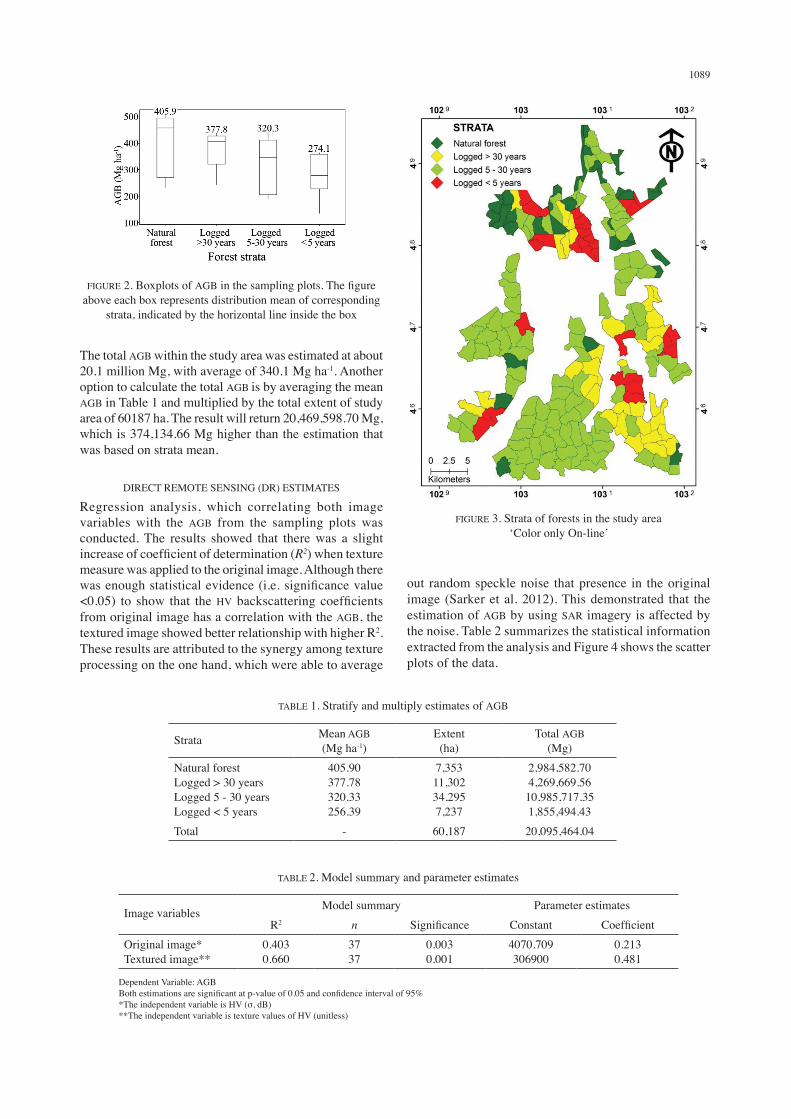
In contrast the RMSE for textured image estimation was at ±21.47 Mg ha-1, which was about half of the original image estimation. About similar RMSE (i.e. 22 Mg ha-1) was observed by Saatchi et al. (2011), that used L-band data with generalization technique in the spatial variables. Spatial variability of structure and speckle noise in SAR measurements is actually contributed equally to degrading the sensitivity of the radar measurements to AGB at large spatial scales. To expand the results, AGB from each strata was extracted from the spatial distribution map, produced from textured image model. Figure 8 shows the variation of the distribution in the study area according to the strata. Natural forest strata keep the highest AGB, with a mean of about 364 Mg ha-1, followed by logged <30, 5-30 and <5 years, with average of about 360, 322 and 308 Mg ha-1, respectively. Although there are variations exist among
TABLE 3. Summary of AGB distribution in the study area
ImageStatistic of the distribution
(Mg ha-1) Total AGB (Mg)
Min Max MeanOriginalTextured
3.0452.36
567.16565.54
235.77 355.52
14,190,172.1222,333,824.81
FIGURE 6. Comparison of AGB distribution extracted from (a) original and (b) textured images estimates of the study area
FIGURE 7. Correlation between measured and predicted AGB from independent validation plots. The lines represent relationships between predicted and observed AGB. This indicates that the developed model by using original images underestimated the AGB of about 2.6%,
while textured images overestimated about 0.3% of the AGB
1092
the strata, the study proved that biomass of the forests should be viewed in general at a landscape level and not at individual pixel. This concept can be visualized clearly through SM method, but when it applied in DR method, the concept was seemed to be acceptable for biomass estimation of forests. Understanding the advantages and limitations offered by the methods, the study suggests that, depending on the availability of data, both methods are practical on certain conditions as listed in Table 4.
CONCLUSION
The study has successfully produced AGB estimations by using two methods, SM and DR. The study area was stratifiedintofourstrata,whichwerenaturalforest,logged>30 years, logged 5 - 30 years and logged <5 years. By using 37 sampling plots, the AGB estimation was carried out for the entire study area. The results from both methods were compared and the accuracy of the estimates was investigated. The performance of texture measure on the L-band Palsar image in estimating AGB was also studied. The SM method estimated the total AGB in the study area was about 20.1 million Mg, with average of 340.1 Mg ha-1. Alos Palsar L-band with HV polarization was used for the DR method. In this method, the estimation was conducted in two techniques, with and without applying texture measure. Two empirical models were developed and AGB was estimated from both techniques. Estimation that was
based on original image without texture measure showed that the AGB was ranging from 3.04 to 567.16 Mg ha-1 with average of 236 Mg ha-1. Image with texture measure estimated higher AGB, which ranged between 52.36 and 565.54 Mg ha-1 with the mean at 355 Mg ha-1. Total AGB in the study area was estimated at 14.2 and 22.3 million Mg by original and textured images, respectively. The difference was about 8 million Mg, with average shift of about 135 Mg ha-1. The results indicated that the model using original image has underestimated about 2.6%, while textured image overestimated about 0.3%, with RMSE of about ±45 and ±21 Mg ha-1, respectively. The SM method was, somehow, found to be an effective method in estimating AGB provided that the logging history and management records are available. This method allows quick but reliable assessment of AGB over the large area. For DR method, selection of appropriate image processing needs to be considered to obtain results in good accuracy.The integration offield survey data,good quality management record with GIS database and remote sensing data can produce a reliable AGB estimates a map that include spatial distribution of biomass. These technologies are increasingly important for biomass estimation and monitoring. Empirically derived biomass estimation models combined with comprehensive sample plots would be of useful for monitoring purposes in REDD+ and other similar activities aiming to promote preservation of biomass in tropical forest ecosystems.
FIGURE 8. Interval plot indicates the distribution of AGB for each strata extracted from the estimation,withthefiguresdenotethemeandistribution.Thehorizontal
line indicates the overall mean of the distribution
TABLE 4. Comparison of the estimation methods
AspectDirect remote sensing (DR) Stratify and multiply
(SM)Original image Textured imageSpatial distribution Continuous distribution Continuous distribution Discrete (or negligible) distributionInformation contents Keep the detail due to original
pixel valueLoss some levels of detail due to the generalization
The levels of detail is depending on the strata boundary
Spatial accuracy Less accurate but precise Accurate but less precision Less accurate and less precisionOverall estimation Tend to serious underestimate Reasonable estimate Reasonable estimateCross validation Can be validated Can be validated Cannot be validated

1093
ACKNOWLEDGEMENTS
This work has been undertaken within the framework of the JAXA Kyoto & Carbon Initiative (Phase 3). Special thanks to JAXA for the provision of the Alos Palsar dataset through RESTEC EORC. Special gratitude also goes to KPKKT whose provide the supporting data and allowing the research team to conduct the study in its concession forest.
REFERENCES
Abdul Rashid, A.M., Shamsudin, I., Ismail, P. & Fletcher, S.C. 2009. The Role of FRIM in Addressing Climate-Change Issues. Research Pamphlet No. 128, Forest Research Institute Malaysia, Kepong.
Angelsen, A., Brown, S., Loisel, C., Peskett, C., Streck, C. & Zarin, D. 2009. Reducing emission from deforestation and degradation (REDD): An options assessment report. A report prepared for the government of Norway. Meridian Institute. p. 100.
Asner, G.P. 2001. Cloud cover in Landsat observations of the Brazilian Amazon. International Journal of Remote Sensing 22: 3855-3862.
Franklin, S.E., Hall, R.J., Moskal, L.M., Maudie, A.J. & Lavigne, M.B.2000.Incorporatingtextureintoclassificationofforestspecies composition from airborne multispectral images. International Journal of Remote Sensing 21(1): 61-79.
Gibbs, H.K., Brown, S., O’Niles, J. & Foley, J.A. 2007. Monitoring and estimating tropical forest carbon stocks: Making REDD a reality. Environmental Research Letter 2: 1-13.
Goetz, S.J., Baccini, A., Laporte, N.T., Johns, T., Walker, W., Kellndorfer, J., Houghton, R.A. & Sun, M. 2009. Mapping and monitoring carbon stocks with satellite observations: A comparison of methods. Carbon Balance and Management 4(2): 1-7.
Hamdan, O., Khali Aziz, H. & Abd Rahman, K. 2011. Remotely sensed L-Band SAR data for tropical forest biomass estimation. Journal of Tropical Forest Science 23(3): 318-327.
Jong, W., Chokkalingam, U., Smith, J. & Sabogal, C. 2001. Tropical secondary forests in Asia: Introduction and synthesis. Journal of Tropical Forest Science 13(4): 563-576.
Kandaswamy,U.,Adjeroh,D.A.&Lee,M.C.2005.Efficienttexture analysis of SAR imagery. IEEE Transaction on Geosciences and Remote Sensing 43(9): 2075-2083.
Kato, R., Tadaki, Y. & Ogawa, H. 1978. Plant biomass and growth increment studies in Pasoh forest. Malayan Nature Journal 30: 211-224.
Le Toan, T., Quegan, S., Davidson, M.W.J., Balzter, H., Paillou, P., Papathanassiou, K., Plummer, S., Rocca, F., Saatchi, S., Shugart, H. & Ulander, L. 2011. The BIOMASS mission: Mapping global forest biomass to better understand the terrestrial carbon cycle. Remote Sensing of Environment 115(11): 2850-2860.
Lu, D. 2006. The potential and challenge of remote sensing-based biomass estimation. International Journal of Remote Sensing 27: 1297-1328.
Lucas, R., Armston, J., Fairfax, R., Fesham, R., Accad, A., Carreiras, J., Kelley, J., Bunting, P., Clewley, D., Bray, S., Metcalfe, D., Dwyer, J., Bowen, M., Eyre, T., Laidlaw, M. & Shimada, M. 2010. An evaluation of the PALSAR L-band backscatter - Above ground biomass relationship Queensland, Autralia: Impacts of surface moisture condition and vegetation structure. IEEE Journal of Selected Topics on Applied Earth Observations and Remote Sensing 3(4): 576-593.
Quinones, M.J. & Hoekman, D.H. 2004. Exploration of factors limiting biomass estimation by polarimetric radar in tropical forests. IEEE Transaction on Geosciences and Remote Sensing 42: 86-104.
Robinson, C., Saatchi, S., Neumann, M. & Gillespie, T. 2013. Impacts of spatial variability on aboveground biomass estimation from L-band radar in a temperate forest. Remote Sensing 5: 1001-1023.
Saatchi, S.S., Marlier, M., Chazdon, R.L., Clark, D.B. & Russell, A.E. 2011. Impact of spatial variability of tropical forest structure on radar estimation of aboveground biomass. Remote Sensing of Environment 115(11): 2836-2849.
Sandberg, G., Ulander, L., M.H., Fransson, J.E.S., Holmgren, J. & Le Toan, T. 2011. Land P-band backscatter intensity for biomass retrieval in hemi boreal forest. Remote Sensing of Environment 115(11): 2874-2886.
Sarker, L.R., Nichol, J., Ahmad, B., Busu, I. & Rahman, A.A. 2012. Potential of texture measurements of two-date dual polarization PALSAR data for the improvement of forest biomass estimation. ISPRS Journal of Photogrammetry 69: 146-166.
Sessa, R. & Dolman, H. 2008. Terrestrial essential climate variables for climate change assessment, mitigation and adaptation. Rome: FAO GTOS-52.
Shimada, M., Isoguchi, O., Tadono, T. & Isono, K. 2009. PLASAR radiometric calibration and geometric calibration. IEEE Transaction on Geosciences and Remote Sensing 3: 765-768.
Wright, S.J. 2010. The future of tropical forests. Annals of the New York Academy of Sciences. Ecological Conservation and Biology 1195: 1-27.
Hamdan Omar* & Khali Aziz Hamzah Forest Research Institute Malaysia (FRIM)52109 Kepong, Selangor Darul Ehsan Malaysia
Mohd Hasmadi Ismail, Helmi Zulhaidi Mohd Shafri & Norizah KamarudinUniversiti Putra Malaysia 43400 Serdang, Selangor Darul Ehsan Malaysia
*Corresponding author; email: [email protected]
Received: 28 June 2014Accepted: 5 March 2015