electrical discharge machining of siliconized silicon...
TRANSCRIPT
Jurnal Mekanikal
June 2014, No 37, 81-100
81
ELECTRICAL DISCHARGE MACHINING OF SILICONIZED
SILICON CARBIDE USING GRAPHITE ELECTRODE
Muhammad Hafiz Adnan1, Hamidon Musa
2
1Production Technology Department,
German Malaysian Institute,
43000 Kajang, Selangor
2Faculty of Mechanical Engineering,
Universiti Teknologi Malaysia,
81200 Skudai, Johor Bahru
ABSTRACT
Siliconized silicon carbide (SiSiC) is an advanced engineering ceramic, and it has
excellent properties such as high hardness, high strength, high wear resistance and good
chemical inertness at elevated temperature. Thus it has been used in cutting tools, seal
rings, valve seats, bearing parts, and a variety of engine parts. The purpose of this study
to determine suitable parameters setting on SiSiC by electrical discharge machining
(EDM) using graphite electrode. In this work, a study on the influence of the most
relevant EDM factors over surface roughness (Ra), material removal rate (MRR) and
electrode wear ratio (TWR) has been carried out. Design of Experiment (DOE) with full
factorial design experiments was employed as experimental design procedure to
investigate the significant effects of each design factors. In order to test for curvature and
measuring stability of process, four centre points will be added into the experiments. The
mathematical model then was proposed based from the substantial result that would give
impact to the SiSiC EDM performance. The design factors selected in this case were:
peak current (IP), pulse on time (ONN), voltage (V) and pulse off time (OFF). Those
parameters was widely used and interest by the machinists or researchers to control the
EDM machine generator precisely to obtain desire machining output whether finishing,
roughing or minimizing tool wear. Besides, prediction equation was proposed in order to
obtain multiple desires machining output when machining SiSiC using graphite electrode.
Keywords: EDM, SiSiC, Ra, MRR, graphite
1.0 Introduction
EDM is the most important and cost-effective of non-traditional methods of machining
extremely hard and brittle material such as ceramic. In EDM, material removal processes
based on thermal energy, removed the conducting surfaces of workpiece by means of
rapid, repeated spark or electrical discharges from electric pulse generators with the help
of dielectric fluid flushing between the electrode and workpiece [1].
In recent years, there has been an enormous increase of significance use in advance
ceramic material. As a result of this interest, important advances in their development and
its application have been used widely. Silicon carbide (SiC) is an advanced engineering
ceramic, and it has excellent properties such as high hardness, high strength, high wear
resistance and good chemical inertness at elevated temperature [2]. Thus it has been used
in cutting tools, seal rings, valve seats, bearing parts, and a variety of engine parts [3].
Jurnal Mekanikal June 2014
82
However, due to its brittleness and high hardness, the traditional methods of machining
silicon carbide ceramic mostly using diamond grinding or diamond turning which are
time consuming and high cost of diamond tools, hence also can cause degradation of
strength due to the formation of finish surface and subsurface cracks or other defects
[4,5]. EDM enables to machine extremely hard materials and complex shapes that can be
produced with high precision. Therefore, EDM is a potential and attractive technology for
the machining of ceramics, providing that these materials have a sufficiently high
electrical conductivity [6].
EDM is one of non-conventional machining methods which are applying the thermal
energy consumption. Commonly it is used for machining conductive material no matter
how hard it is or when the time would be impractically to be machined with conventional
techniques. It is also extensively used especially in mould, die, automotive, surgical and
aerospace industries for cutting complicated contours in order to obtain fine surface finish
of parts that would be hard to produce with conventional machining methods or other
machine tools. The benefits using EDM are free of residual stress, vibration and chatter
problems during machining. By the way, critical limitation when using EDM is only
working with electrically conductive material with presence of a dielectric fluid [7,8].
Manufacturing silicon carbide is critical due to high cost of material. Lack of
machining suitable conditions and improper planning will lead to time consuming,
redundant job, waste of material and increase manufacturing lead time. In case of this
situation, it shows that how important research implementation on this field of study
needs to be carried out.
2.0 Experimental Detail
The experiment was done by EDM process on SiSiC. Response values such as material
removal rate and electrode wear ratio was determined. Meanwhile, surface roughness was
measured using surface roughness tester. After obtaining all valuable data, DOE software
was employed in order to proceed with analysis of variance (ANOVA). The purpose of
this ANOVA is to determine the significant parameters which might affect on the
responses studied. The curvature test will determine whether the response model requires
second order model or not. The predicted mathematical model for optimization of all
responses will be gained. Finally, the conformation run in will be conducted in order to
validate the model obtained.
3.0 Dependent Variables
Dependent variables refer to the performance of EDM characteristic. Three dependent
variables are selected to be examined for these studies which are Ra, MRR and TWR. In
order to achieve the optimum parameter settings for EDM process, all the dependent
variables mentioned must be justified. It would be tremendous contribution for industrial
manufacturing sector which is fabricate a product using SiSiC material by EDM process.
Basically, Ra is referring to arithmetic mean average in µm. In addition, Surfcom
1800D Ra tester was employed for this study. The average of Ra values inside the cavity
surface finish was measured with the three different spots with maximum distance is 10
mm.
MRR is the amount of material removed per unit time. MRR is expressed as the ratio
of the workpiece volumetric removed divide by machining time [9,10].
(1)
Jurnal Mekanikal June 2014
83
Higher value of MRR is favourable condition when EDM initial or roughing process to
fast stock removal before finishing allowance.
TWR is expressed as the ratio of volume removed from electrode to volume removed
from workpiece during the EDM process. This volumetric removal can be end wear or
corner wear, and it is measured linearly or volumetrically but is most often expressed as
per cent, measured linearly [9,10].
x 100 (2)
Various number of machining performances has been studied by the previous
researchers on EDM characteristics. For this study, four proficient independent variables
influence in EDM performance has been chosen for the experimentation.
i. Peak Current (IP)
ii. Pulse On Time (ON)
iii. Voltage (V)
iv. Pulse OFF Time (OFF)
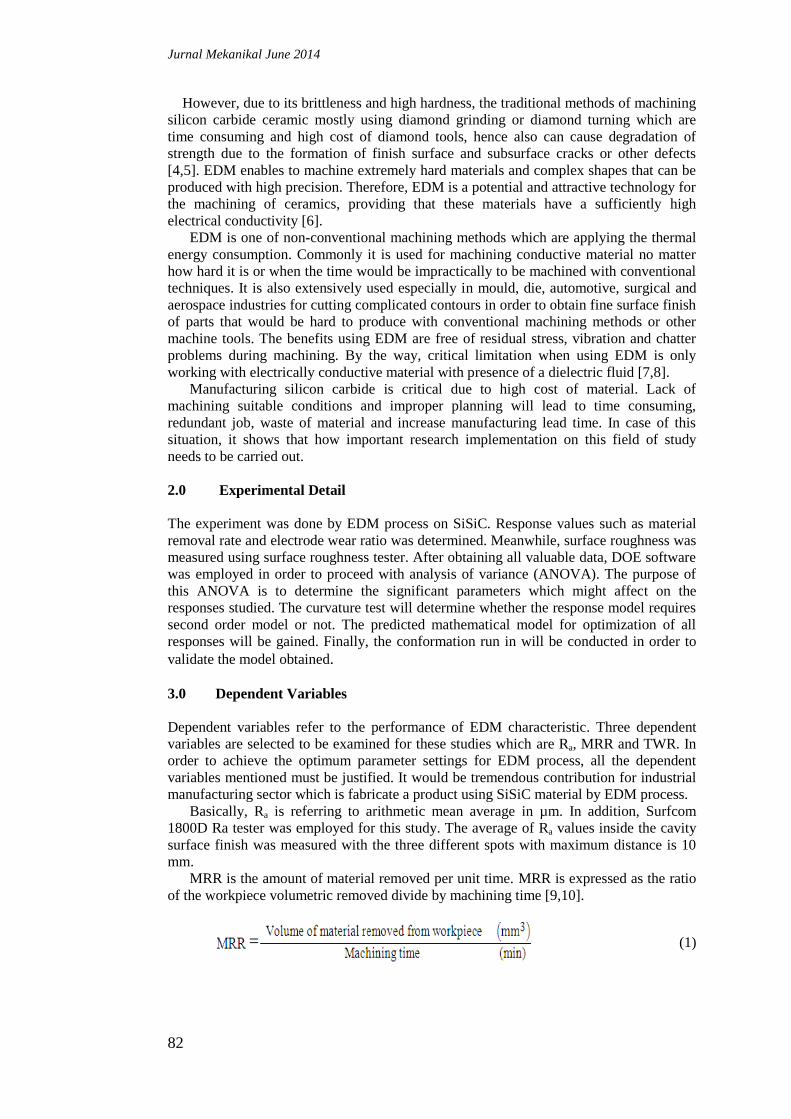
Table 1 shows the complete experimental design for parameters used with the specific
range of values. Meanwhile, Table 2 shows the full factorial design.
Table 3.1: The parameter design values
Parameters
Unit Level
Centre point Low (-) High (+)
IP Amperes 6 12 9
ON µs 25 100 62.5
V Volts 80 120 160
OFF µs 25 100 62.5
Table 3.2: Full factorial design
Run IP
Amperes
ON
µs
V
Volts
OFF
µs
1 6 25 80 25
2 12 25 80 25
3 6 100 80 25
4 12 100 80 25
5 6 25 160 25
6 12 25 160 25
7 6 100 160 25
8 12 100 160 25
9 6 25 80 100
10 12 25 80 100
11 6 100 80 100
12 12 100 80 100
13 6 25 160 100
14 12 25 160 100
15 6 100 160 100
16 12 100 160 100
17 9 62.5 120 62.5
18 9 62.5 120 62.5
19 9 62.5 120 62.5

Jurnal Mekanikal June 2014
84
20 9 62.5 120 62.5
4.0 Experimental Results
All the results obtained after the machining process, such as machining time, weight of
electrode removed before and after, weight of workpiece removed before and after
machining was calculated. Hence, changing unit weight from gram to unit volume mm3.
After that, employed equations (1) and (2) to find MRR and TWR. Finally, data was
transferred into the Design Expert software for further analysis.
4.1 DOE Analysis
All the measured data was analyzed using Design Expert software in order to validate and
evaluate experiment results before come up with mathematical modelling for responses
selected.
4.2 Analysis on Surface Roughness, Ra
The half-normal probability graph as shown in Figure 4.1 indicates significant effects
which are suitable to fit in the model. Normally, main effects located at upper right or on
the right side of line. While chosen the main effects it will result the line shifted away and
re-fitted on the line with remaining non-selected effect points. Factor A and B are chosen
as significant effects which are positive effects behaviour.
Figure 4.1: Half-Normal Probability Graph (Ra)
From the ANOVA Report (Ra) as depicted in Figure 4.2, the most important term
need to verify is P-value. P-value represent as a probability for the model. By default,
Design Expert considers values of 0.05 or less to be significant effects. If bigger than that,
the factor is considered as not significant to model. This analysis shows that the
significant effects are factor A and B and also known as main effects. No interaction
between the factors was found in the model. The model shows significant effect. Besides,
the curvature is the term used in comparing the average response of the factorial points to
the average response of the centre points to test for non-linearity between the factorial
points in three-dimensional response surface. The „not significant‟ curvature shows in the
ANOVA Report (Ra) indicates that the three-dimensional response surface for the model
is a flat surface to fits the model responses. Therefore, only the first order model is
Jurnal Mekanikal June 2014
85
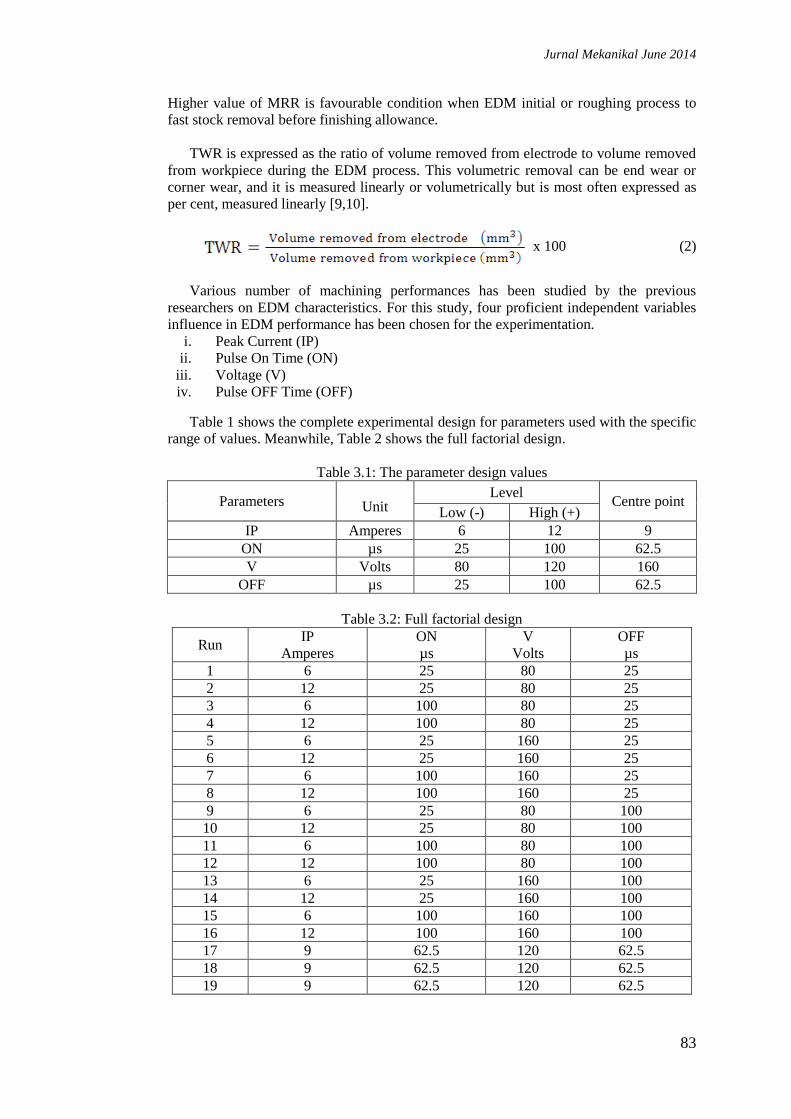
involved. The model fits the data well as the lack of fit is not significant. No need to add
axial-points for further analysis.
Figure 4.2: ANOVA Report (Ra)
Figure 4.3: Determination of R-Squared (Ra)
Since the R-Squared as shown in Figure 4.3 is 0.9163, it indicates that all the sources
of variation during investigation are under controlled in order to obtain optimum
parameters setting within the particular range of investigation selected. In addition, Adeq
Precision measures the signal to noise ratio. A ratio greater than 4 is desirable. The ratio
of 24.896 obtained indicates an adequate signal which means no further investigation is
needed.
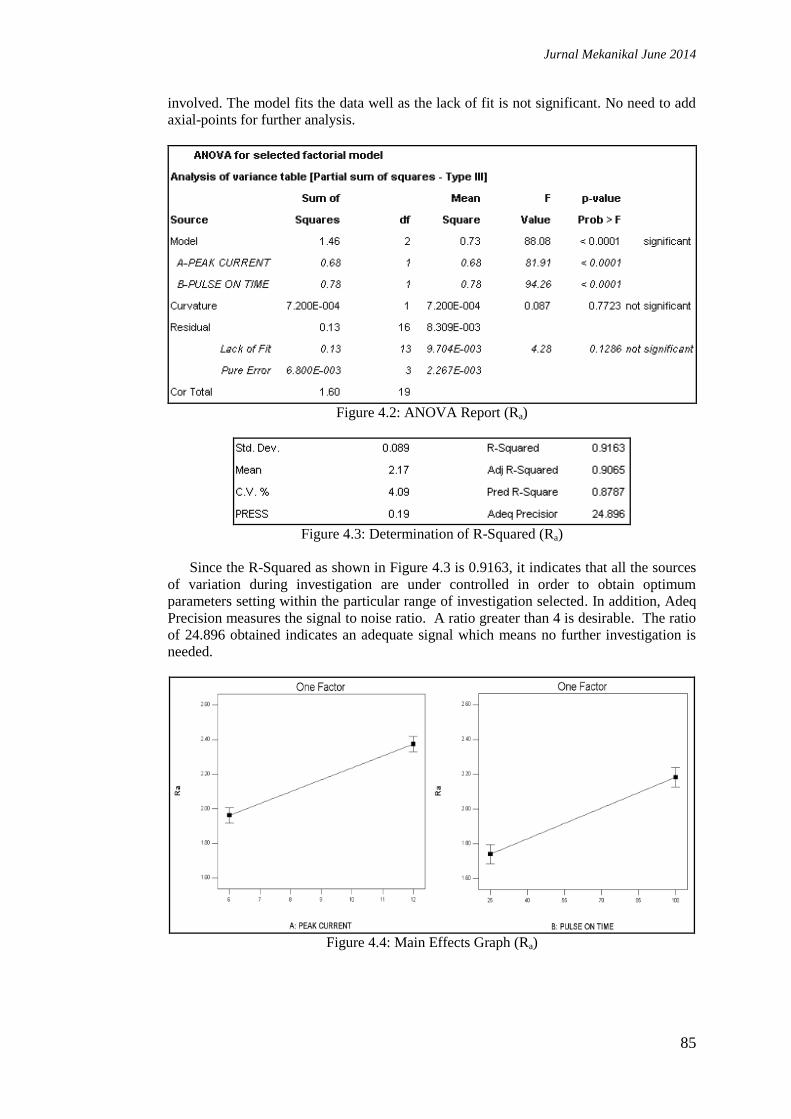
Figure 4.4: Main Effects Graph (Ra)
Jurnal Mekanikal June 2014
86
From the main effects graph shows in Figure 4.4, when factors A and B at low level,
it will provides low value of Ra, 1.74 µm. All factors of main effects are positive effects
for Ra.
4.3 Analysis on Material Removal Rate
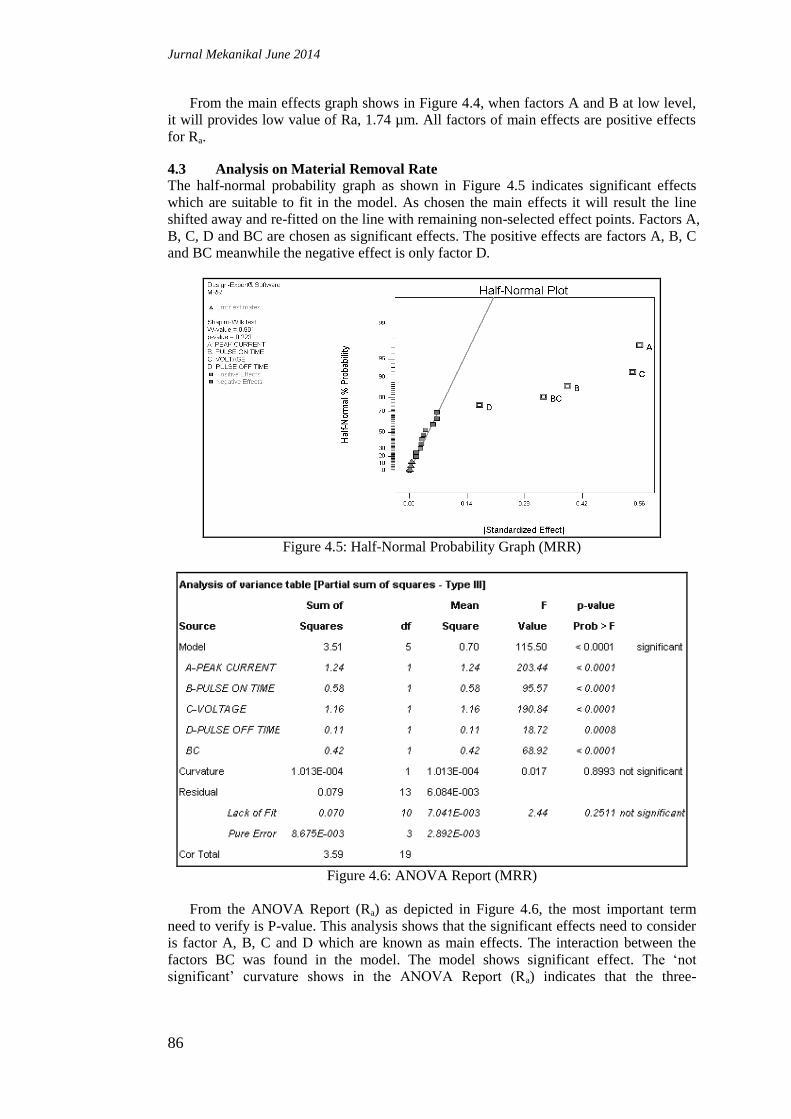
The half-normal probability graph as shown in Figure 4.5 indicates significant effects
which are suitable to fit in the model. As chosen the main effects it will result the line
shifted away and re-fitted on the line with remaining non-selected effect points. Factors A,
B, C, D and BC are chosen as significant effects. The positive effects are factors A, B, C
and BC meanwhile the negative effect is only factor D.
Figure 4.5: Half-Normal Probability Graph (MRR)
Figure 4.6: ANOVA Report (MRR)
From the ANOVA Report (Ra) as depicted in Figure 4.6, the most important term
need to verify is P-value. This analysis shows that the significant effects need to consider
is factor A, B, C and D which are known as main effects. The interaction between the
factors BC was found in the model. The model shows significant effect. The „not
significant‟ curvature shows in the ANOVA Report (Ra) indicates that the three-

Jurnal Mekanikal June 2014
87
dimensional response surface for the model is a flat surface to fits the model responses.
Therefore, only the first order model is involved. The model fits the data well as the lack
of fit is not significant. No need to add axial-points for further analysis.
Figure 4.7: Determination of R-Squared (MRR)
The R-Squared as shown in Figure 4.7 is 0.9780. It indicates that all the sources of
variation during investigation are under controlled in order to obtain optimum parameters
setting within the particular range of investigation selected. In addition, Adeq Precision
measures the signal to noise ratio. A ratio greater than 4 is desirable. The ratio of 39.934
obtained indicates an adequate signal which means no further investigation is needed.
Figure 4.8: Main Effects Graph (MRR)
From the main effects graph shows in Figure 4.8, when factors A, B, C at high level,
it will provides greater value of MRR, 2.05 mm3/min. All factors of main effects are
positive effects for except factor D.
Jurnal Mekanikal June 2014
88
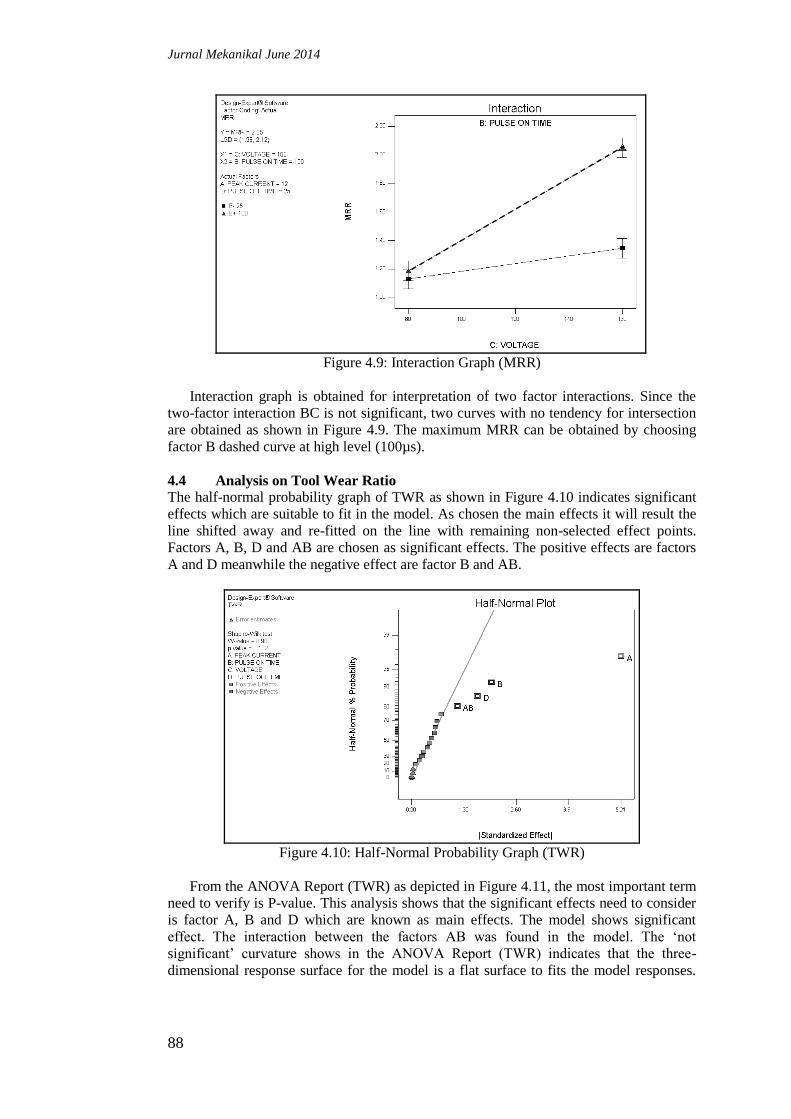
Figure 4.9: Interaction Graph (MRR)
Interaction graph is obtained for interpretation of two factor interactions. Since the
two-factor interaction BC is not significant, two curves with no tendency for intersection
are obtained as shown in Figure 4.9. The maximum MRR can be obtained by choosing
factor B dashed curve at high level (100µs).
4.4 Analysis on Tool Wear Ratio The half-normal probability graph of TWR as shown in Figure 4.10 indicates significant
effects which are suitable to fit in the model. As chosen the main effects it will result the
line shifted away and re-fitted on the line with remaining non-selected effect points.
Factors A, B, D and AB are chosen as significant effects. The positive effects are factors
A and D meanwhile the negative effect are factor B and AB.
Figure 4.10: Half-Normal Probability Graph (TWR)
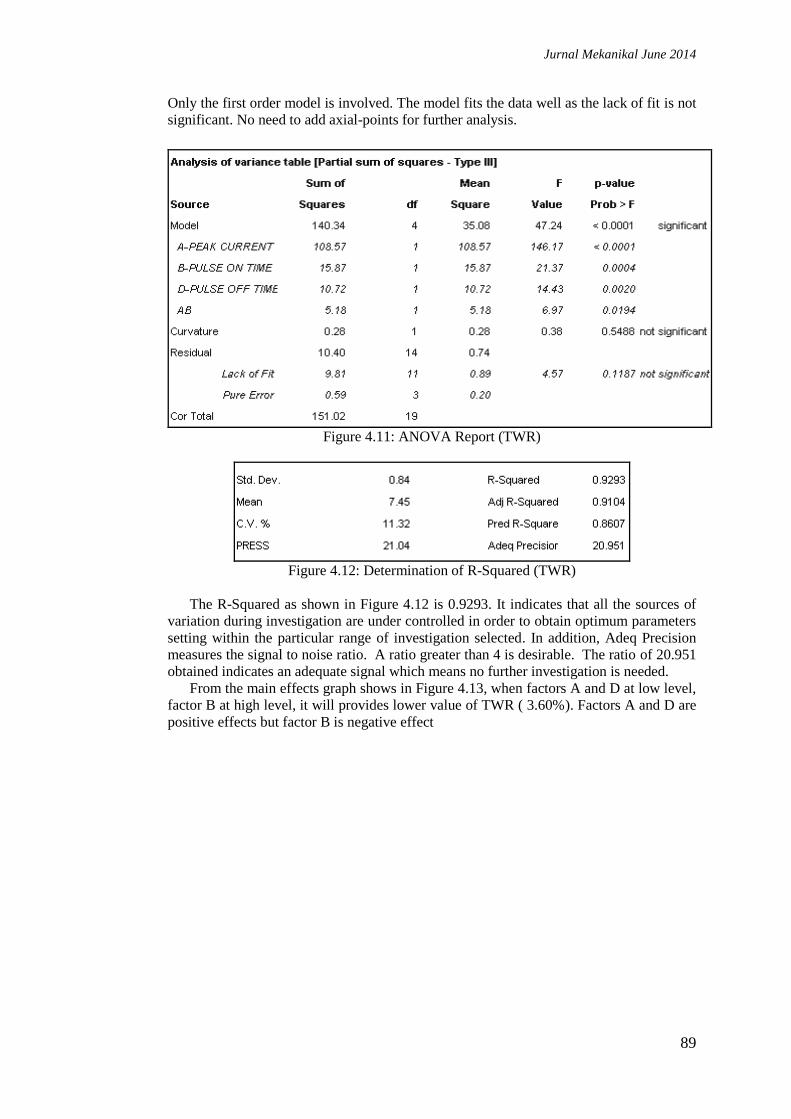
From the ANOVA Report (TWR) as depicted in Figure 4.11, the most important term
need to verify is P-value. This analysis shows that the significant effects need to consider
is factor A, B and D which are known as main effects. The model shows significant
effect. The interaction between the factors AB was found in the model. The „not
significant‟ curvature shows in the ANOVA Report (TWR) indicates that the three-
dimensional response surface for the model is a flat surface to fits the model responses.
Jurnal Mekanikal June 2014
89
Only the first order model is involved. The model fits the data well as the lack of fit is not
significant. No need to add axial-points for further analysis.
Figure 4.11: ANOVA Report (TWR)
Figure 4.12: Determination of R-Squared (TWR)
The R-Squared as shown in Figure 4.12 is 0.9293. It indicates that all the sources of
variation during investigation are under controlled in order to obtain optimum parameters
setting within the particular range of investigation selected. In addition, Adeq Precision
measures the signal to noise ratio. A ratio greater than 4 is desirable. The ratio of 20.951
obtained indicates an adequate signal which means no further investigation is needed.
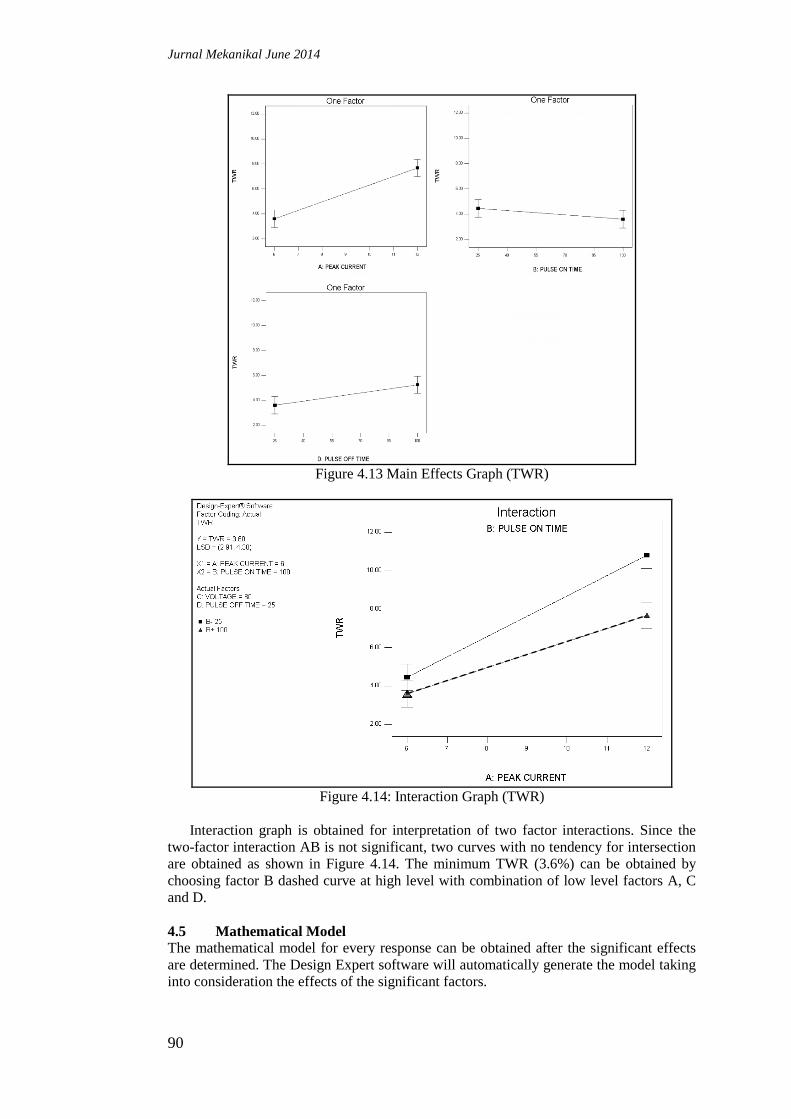
From the main effects graph shows in Figure 4.13, when factors A and D at low level,
factor B at high level, it will provides lower value of TWR ( 3.60%). Factors A and D are
positive effects but factor B is negative effect
Jurnal Mekanikal June 2014
90
Figure 4.13 Main Effects Graph (TWR)
Figure 4.14: Interaction Graph (TWR)
Interaction graph is obtained for interpretation of two factor interactions. Since the
two-factor interaction AB is not significant, two curves with no tendency for intersection
are obtained as shown in Figure 4.14. The minimum TWR (3.6%) can be obtained by
choosing factor B dashed curve at high level with combination of low level factors A, C
and D.
4.5 Mathematical Model
The mathematical model for every response can be obtained after the significant effects
are determined. The Design Expert software will automatically generate the model taking
into consideration the effects of the significant factors.
Jurnal Mekanikal June 2014
91
Model for Ra
The final equation in terms of coded factors:
Ra = 2.17 + 0.21(A) + 0.22(B)
The final equation in terms of actual factors:
Ra = 1.18050 + 0.068750(IP) + 5.9x10⁻³
(ON)
Model for MRR
The final equation in terms of coded factors:
MRR = +1.07 + 0.28(A) + 0.19(B) + 0.27(C) 0.084(D) + 0.16(B)(C)
The final equation in terms of actual factors:
MRR = 0.056792 + 0.092708(IP) 7.86667x10⁻³
(ON) 1.04167x10⁻⁵
(V) 2.25000x10
-3 (OFF) + 1.07917x10
-4(ON)(V)
Model for TWR
The final equation in terms of coded factors:
TWR = 7.45 + 2.60(A) 1.00(B) + 0.82(D) 0.57(A)(B)
The final equation in terms of actual factors:
TWR= 2.91123 + 1.18439(IP) + 0.018953(ON) + 0.021823(OFF) 5.05715x10
-3 (IP)(ON)
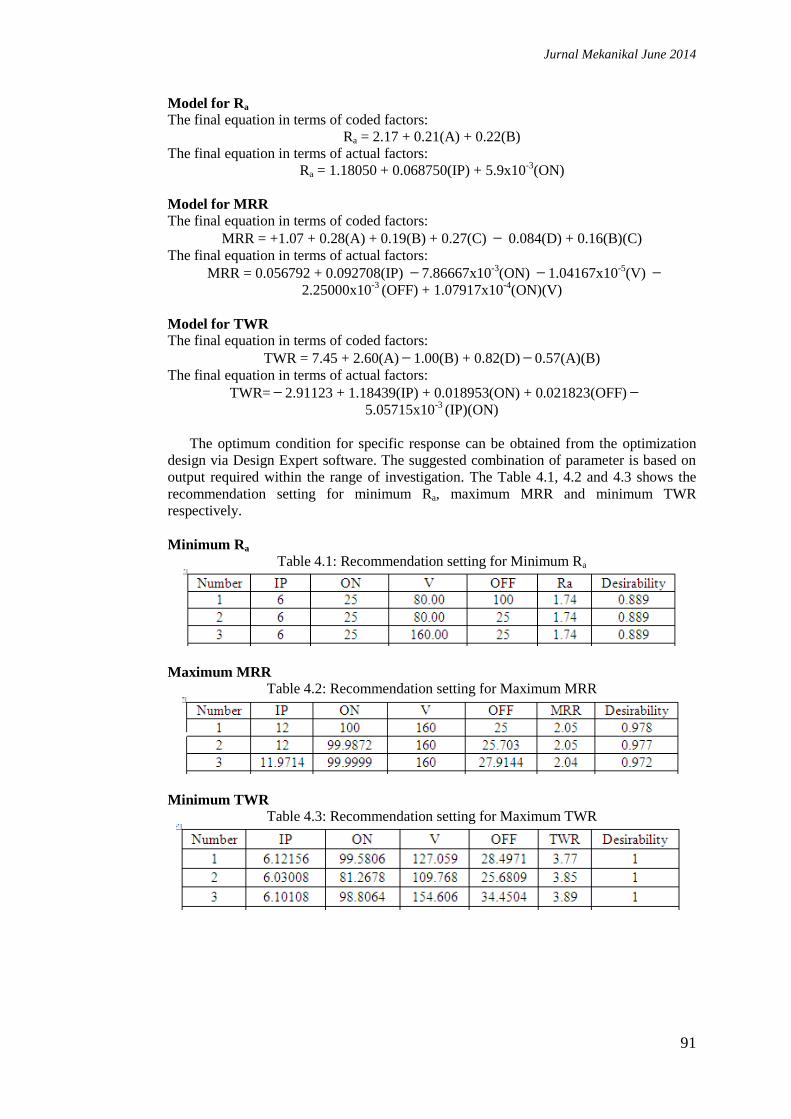
The optimum condition for specific response can be obtained from the optimization
design via Design Expert software. The suggested combination of parameter is based on
output required within the range of investigation. The Table 4.1, 4.2 and 4.3 shows the
recommendation setting for minimum Ra, maximum MRR and minimum TWR
respectively.
Minimum Ra
Table 4.1: Recommendation setting for Minimum Ra
Maximum MRR
Table 4.2: Recommendation setting for Maximum MRR
Minimum TWR
Table 4.3: Recommendation setting for Maximum TWR
Jurnal Mekanikal June 2014
92
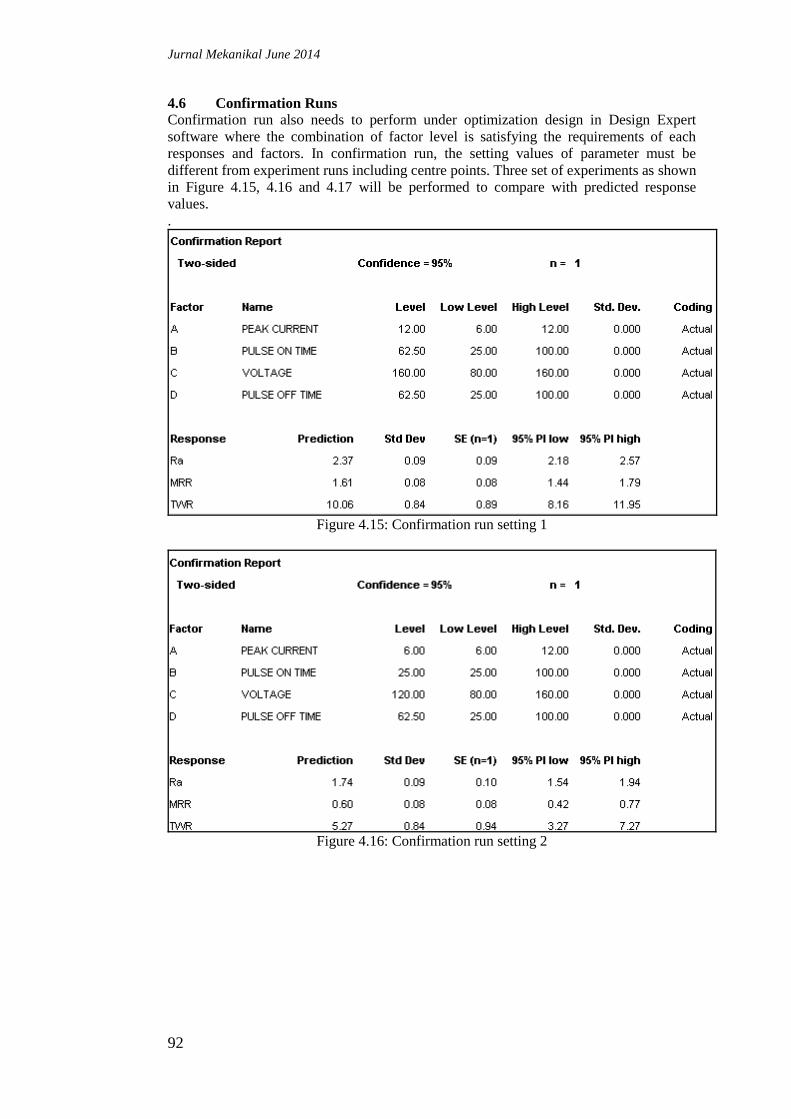
4.6 Confirmation Runs
Confirmation run also needs to perform under optimization design in Design Expert
software where the combination of factor level is satisfying the requirements of each
responses and factors. In confirmation run, the setting values of parameter must be
different from experiment runs including centre points. Three set of experiments as shown
in Figure 4.15, 4.16 and 4.17 will be performed to compare with predicted response
values.
.
Figure 4.15: Confirmation run setting 1
Figure 4.16: Confirmation run setting 2
Jurnal Mekanikal June 2014
93
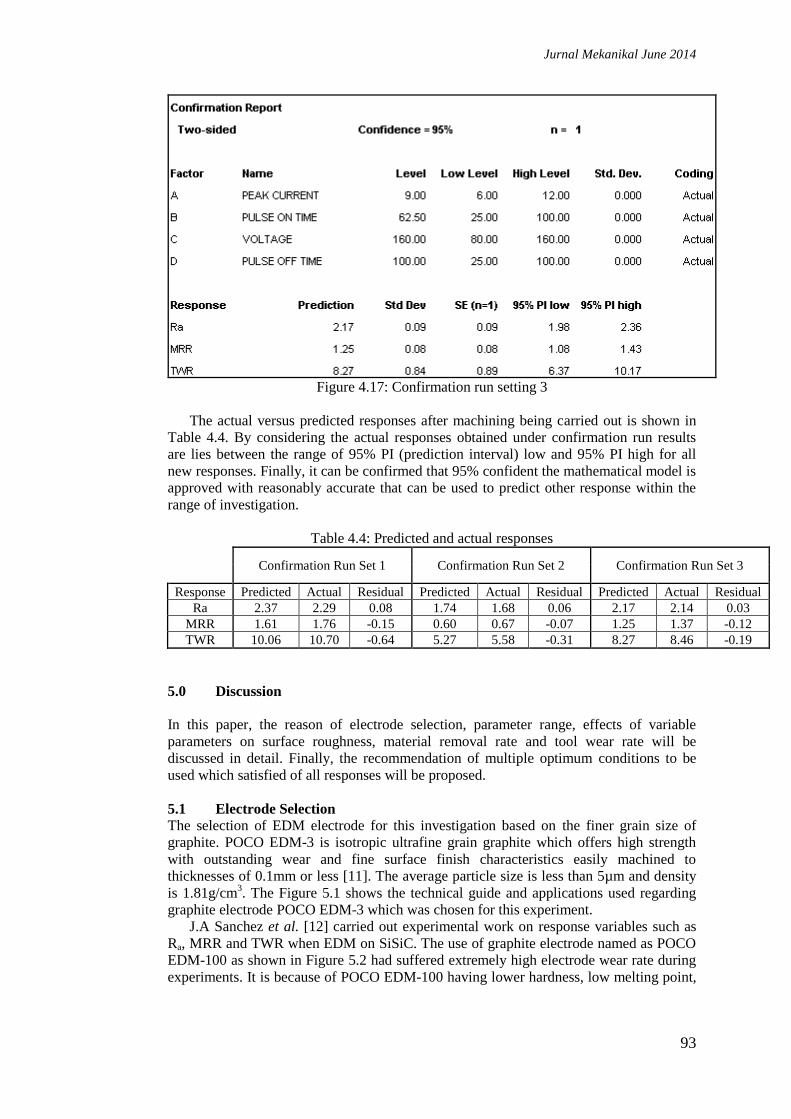
Figure 4.17: Confirmation run setting 3
The actual versus predicted responses after machining being carried out is shown in
Table 4.4. By considering the actual responses obtained under confirmation run results
are lies between the range of 95% PI (prediction interval) low and 95% PI high for all
new responses. Finally, it can be confirmed that 95% confident the mathematical model is
approved with reasonably accurate that can be used to predict other response within the
range of investigation.
Table 4.4: Predicted and actual responses
Confirmation Run Set 1 Confirmation Run Set 2 Confirmation Run Set 3
Response Predicted Actual Residual Predicted Actual Residual Predicted Actual Residual
Ra 2.37 2.29 0.08 1.74 1.68 0.06 2.17 2.14 0.03
MRR 1.61 1.76 -0.15 0.60 0.67 -0.07 1.25 1.37 -0.12
TWR 10.06 10.70 -0.64 5.27 5.58 -0.31 8.27 8.46 -0.19
5.0 Discussion
In this paper, the reason of electrode selection, parameter range, effects of variable
parameters on surface roughness, material removal rate and tool wear rate will be
discussed in detail. Finally, the recommendation of multiple optimum conditions to be
used which satisfied of all responses will be proposed.
5.1 Electrode Selection
The selection of EDM electrode for this investigation based on the finer grain size of
graphite. POCO EDM-3 is isotropic ultrafine grain graphite which offers high strength
with outstanding wear and fine surface finish characteristics easily machined to
thicknesses of 0.1mm or less [11]. The average particle size is less than 5µm and density
is 1.81g/cm3. The Figure 5.1 shows the technical guide and applications used regarding
graphite electrode POCO EDM-3 which was chosen for this experiment.
J.A Sanchez et al. [12] carried out experimental work on response variables such as
Ra, MRR and TWR when EDM on SiSiC. The use of graphite electrode named as POCO
EDM-100 as shown in Figure 5.2 had suffered extremely high electrode wear rate during
experiments. It is because of POCO EDM-100 having lower hardness, low melting point,

Jurnal Mekanikal June 2014
94
low density, bigger average grain size compare to POCO EDM-3 which are well-suited to
be used to EDM on SiSiC during investigation.
Figure 5.1: POCO EDM-3 Graphite Technical Guide.
Figure 5.2: POCO EDM-100 Graphite Technical Guide.
5.2 Selection of Parameter Range
The selection of parameter range base on two basic criteria, initially the trial and error
method and second criteria based on previous researcher had conducted experiments
earlier with suitable range of parameters used. According to S. Clijsters et al. [10], they
proposed range of parameters as shown in Figure 5.3 using copper infiltrated graphite
electrode which are most suitable electrode of machining the advanced ceramics. By the
way, the disadvantage of copper infiltrated graphite electrode is material cost is very high
compare to pure graphite even the finest grain less than 1µm. In addition, the range values
of each parameter are varies depending on the finishing or roughing process as required.
Figure 5.3: Levels of the Parameters by Previous Researcher [10].
(Legend: ie - discharge current, ui - open gap voltage, te - discharge duration and to - pulse
interval)
Jurnal Mekanikal June 2014
95
Final selection of parameter range is determined after a few experiments were
conducted to confirm the capability and precision of EDM machine regards with those
experiments setting without having uncontrollable variation or noise occurs when
performing the actual investigation according to design of experiment chosen earlier.
Through observation, using low pulse off time will lead to unstable machining
condition because of high carbon deposition at electrode bottom face coming from loose
grains of SiSiC. By comparing same parameters setting or procedures on machining of
steel at lower pulse off time (10µs or less), nothing unstable process happen. As a
conclusion can be made, it is because of graphite electrode and SiSiC comes from carbon
substance. Therefore, the loose grains generated inside the gap is easily bond or deposit
on graphite electrode bottom face, in that case it will spoil the machined surface. By
giving much time or increase pulse off time (25µs or more) the side flushing process will
flush away those loose grains near or inside the gap to prevent deposition problem, hence
the machining condition will remain stable.
A set of trials was carried out in order to finding suitable machining condition
regarding polarity setting. Therefore, it was observed that when using negative polarity of
electrode, the process became unstable, leading to high energy sparks that produced
extensive damage both on the graphite electrode and on the workpiece [12].
According to fundamental theory of EDM [13], by choosing low peak current and low
pulse on time, the machined surface becomes better but at the same time reducing the
material removal rate. With appropriate level when considering time constraint and
finishing demanded, suitable range of parameter for this investigation chosen as peak
current ranging from 6A to12A, pulse on time ranging from 25µs to 100µs, voltage
ranging from 80V to 160V and pulse off time ranging from 25µs to 100µs.
5.3 Surface Roughness, Ra
The significant parameter for surface roughness based on ANOVA analysis is peak
current (A) and pulse on time (B) with both positive effects. The rest of factors not
significant for surface roughness although changing the high or low setting for pulse time
off and voltage during investigation. Only the machining time will be different between
experiments when using high or low pulse off time and voltage. However there is no
significant effect on the surface roughness quality of silicon carbide by changing those
values.
Increasing peak current and pulse on time will increase the surface roughness value
which is worsen the surface finish of SiSiC [12][14]. This is because, with longer pulse
on time apply on the machining process, it will produces bigger size of crater on the
surface. The material removal is directly proportional to the amount of energy applied
during the pulse on time [15]. This energy is controlled by the peak current and the length
of the pulse on time. With longer pulse on time, more workpiece material will be melted
away. These resulting crater sizes will be broader and deeper than a crater produced by
shorter pulse on time. Finally, the recast layer will be larger and the heat affected zone
will be deeper layer on the machined surface.
From the experimental results, the best Ra was obtained is 1.62µm and the worst Ra is
2.71µm.
5.4 Material Removal Rate, MRR
Material removal rate significant parameter according to ANOVA analysis is peak current
(A), pulse on time (B), voltage (C) and pulse off time (D). Only pulse off time is negative
effect. The rest all is positive effects. Interaction BC seems to be significant effect
especially when increasing peak current, pulse on time and voltage at the same time.
Pulse off time at low level will be affected much because it will reduce time of
machining, thus increase the material removal rate. At the same time precaution must be
Jurnal Mekanikal June 2014
96
taken if unstable machining occurs due to excessive carbon being produced inside the gap
that will cause carbon deposition on the tool surface.
Sufficient flushing pressure must be taking into account in order to maintain the
machining stability when peak current, pulse on time and voltage at high level. As
described by previous researcher [10], in order to increase the machining speed and MRR,
the discharge current should be chosen in a moderate value, maximize the open gap
voltage and prolong the discharge interval.
From the result experiments was carried out, the highest MRR was obtained is
2.09mm3/min. The lowest MRR is 0.36mm
3/min.
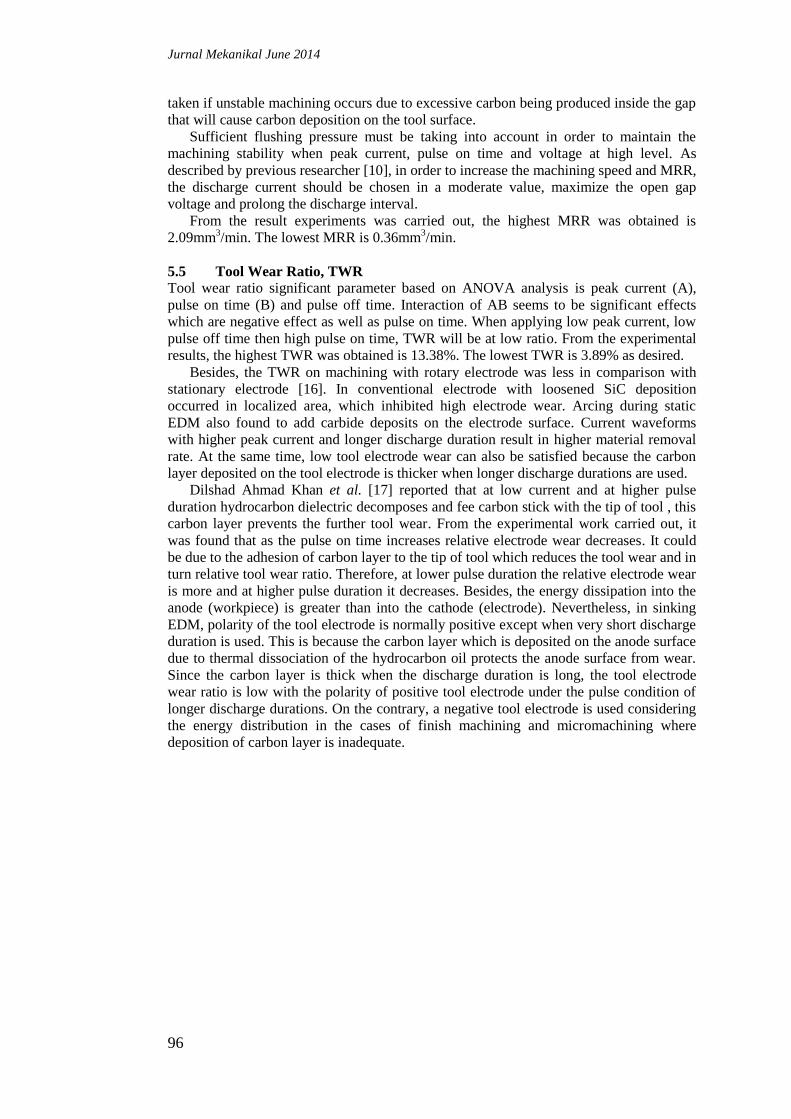
5.5 Tool Wear Ratio, TWR
Tool wear ratio significant parameter based on ANOVA analysis is peak current (A),
pulse on time (B) and pulse off time. Interaction of AB seems to be significant effects
which are negative effect as well as pulse on time. When applying low peak current, low
pulse off time then high pulse on time, TWR will be at low ratio. From the experimental
results, the highest TWR was obtained is 13.38%. The lowest TWR is 3.89% as desired.
Besides, the TWR on machining with rotary electrode was less in comparison with
stationary electrode [16]. In conventional electrode with loosened SiC deposition
occurred in localized area, which inhibited high electrode wear. Arcing during static
EDM also found to add carbide deposits on the electrode surface. Current waveforms
with higher peak current and longer discharge duration result in higher material removal
rate. At the same time, low tool electrode wear can also be satisfied because the carbon
layer deposited on the tool electrode is thicker when longer discharge durations are used.
Dilshad Ahmad Khan et al. [17] reported that at low current and at higher pulse
duration hydrocarbon dielectric decomposes and fee carbon stick with the tip of tool , this
carbon layer prevents the further tool wear. From the experimental work carried out, it
was found that as the pulse on time increases relative electrode wear decreases. It could
be due to the adhesion of carbon layer to the tip of tool which reduces the tool wear and in
turn relative tool wear ratio. Therefore, at lower pulse duration the relative electrode wear
is more and at higher pulse duration it decreases. Besides, the energy dissipation into the
anode (workpiece) is greater than into the cathode (electrode). Nevertheless, in sinking
EDM, polarity of the tool electrode is normally positive except when very short discharge
duration is used. This is because the carbon layer which is deposited on the anode surface
due to thermal dissociation of the hydrocarbon oil protects the anode surface from wear.
Since the carbon layer is thick when the discharge duration is long, the tool electrode
wear ratio is low with the polarity of positive tool electrode under the pulse condition of
longer discharge durations. On the contrary, a negative tool electrode is used considering
the energy distribution in the cases of finish machining and micromachining where
deposition of carbon layer is inadequate.
Jurnal Mekanikal June 2014
97
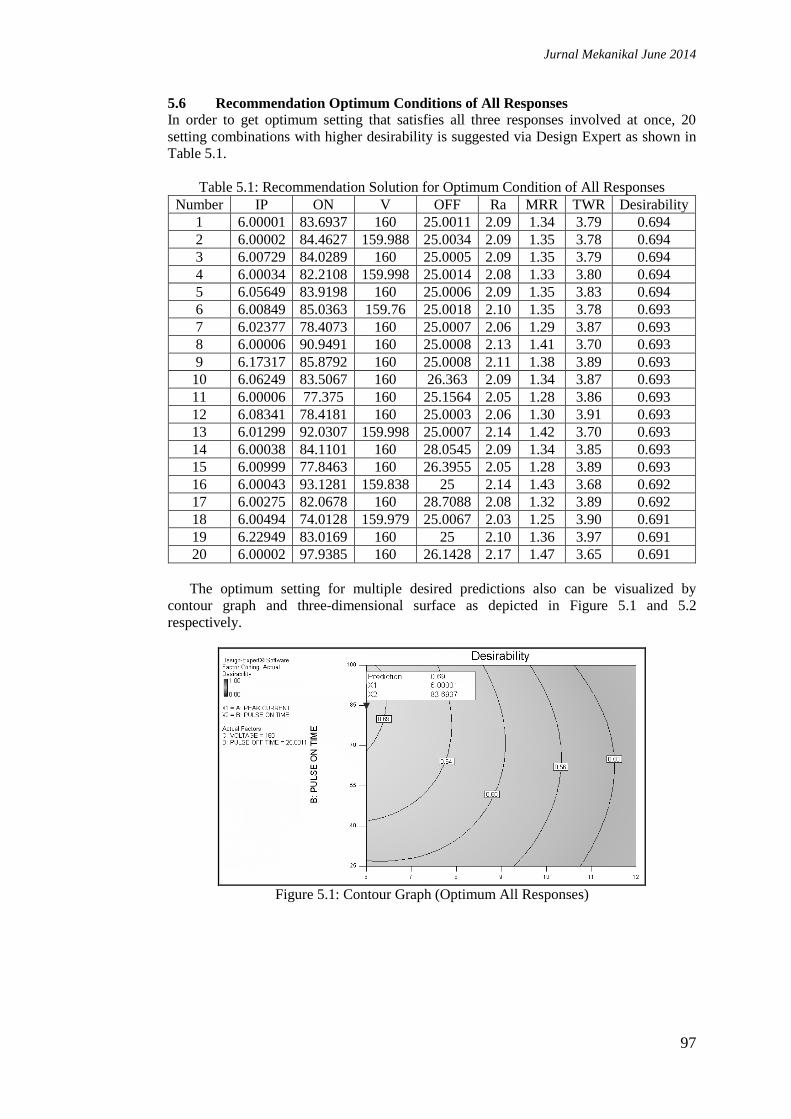
5.6 Recommendation Optimum Conditions of All Responses
In order to get optimum setting that satisfies all three responses involved at once, 20
setting combinations with higher desirability is suggested via Design Expert as shown in
Table 5.1.
Table 5.1: Recommendation Solution for Optimum Condition of All Responses
Number IP ON V OFF Ra MRR TWR Desirability
1 6.00001 83.6937 160 25.0011 2.09 1.34 3.79 0.694
2 6.00002 84.4627 159.988 25.0034 2.09 1.35 3.78 0.694
3 6.00729 84.0289 160 25.0005 2.09 1.35 3.79 0.694
4 6.00034 82.2108 159.998 25.0014 2.08 1.33 3.80 0.694
5 6.05649 83.9198 160 25.0006 2.09 1.35 3.83 0.694
6 6.00849 85.0363 159.76 25.0018 2.10 1.35 3.78 0.693
7 6.02377 78.4073 160 25.0007 2.06 1.29 3.87 0.693
8 6.00006 90.9491 160 25.0008 2.13 1.41 3.70 0.693
9 6.17317 85.8792 160 25.0008 2.11 1.38 3.89 0.693
10 6.06249 83.5067 160 26.363 2.09 1.34 3.87 0.693
11 6.00006 77.375 160 25.1564 2.05 1.28 3.86 0.693
12 6.08341 78.4181 160 25.0003 2.06 1.30 3.91 0.693
13 6.01299 92.0307 159.998 25.0007 2.14 1.42 3.70 0.693
14 6.00038 84.1101 160 28.0545 2.09 1.34 3.85 0.693
15 6.00999 77.8463 160 26.3955 2.05 1.28 3.89 0.693
16 6.00043 93.1281 159.838 25 2.14 1.43 3.68 0.692
17 6.00275 82.0678 160 28.7088 2.08 1.32 3.89 0.692
18 6.00494 74.0128 159.979 25.0067 2.03 1.25 3.90 0.691
19 6.22949 83.0169 160 25 2.10 1.36 3.97 0.691
20 6.00002 97.9385 160 26.1428 2.17 1.47 3.65 0.691
The optimum setting for multiple desired predictions also can be visualized by
contour graph and three-dimensional surface as depicted in Figure 5.1 and 5.2
respectively.
Figure 5.1: Contour Graph (Optimum All Responses)
Jurnal Mekanikal June 2014
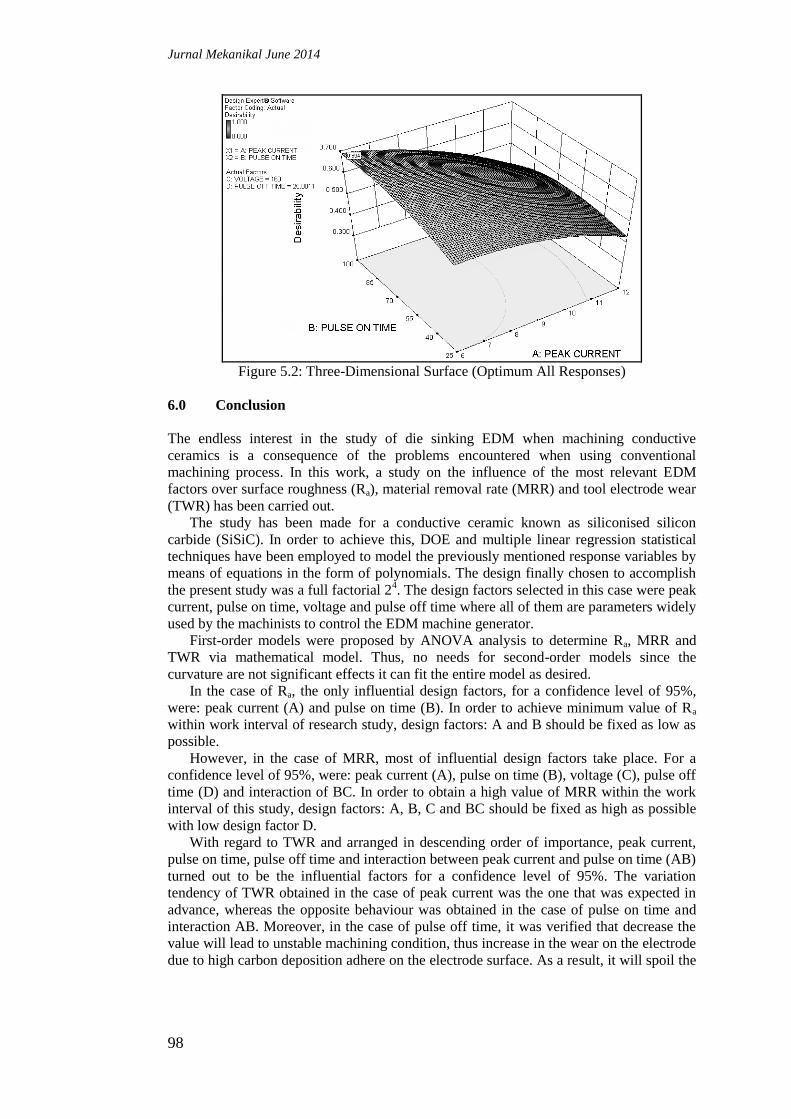
98
Figure 5.2: Three-Dimensional Surface (Optimum All Responses)
6.0 Conclusion
The endless interest in the study of die sinking EDM when machining conductive
ceramics is a consequence of the problems encountered when using conventional
machining process. In this work, a study on the influence of the most relevant EDM
factors over surface roughness (Ra), material removal rate (MRR) and tool electrode wear
(TWR) has been carried out.
The study has been made for a conductive ceramic known as siliconised silicon
carbide (SiSiC). In order to achieve this, DOE and multiple linear regression statistical
techniques have been employed to model the previously mentioned response variables by
means of equations in the form of polynomials. The design finally chosen to accomplish
the present study was a full factorial 24. The design factors selected in this case were peak
current, pulse on time, voltage and pulse off time where all of them are parameters widely
used by the machinists to control the EDM machine generator.
First-order models were proposed by ANOVA analysis to determine Ra, MRR and
TWR via mathematical model. Thus, no needs for second-order models since the
curvature are not significant effects it can fit the entire model as desired.
In the case of Ra, the only influential design factors, for a confidence level of 95%,
were: peak current (A) and pulse on time (B). In order to achieve minimum value of Ra
within work interval of research study, design factors: A and B should be fixed as low as
possible.
However, in the case of MRR, most of influential design factors take place. For a
confidence level of 95%, were: peak current (A), pulse on time (B), voltage (C), pulse off
time (D) and interaction of BC. In order to obtain a high value of MRR within the work
interval of this study, design factors: A, B, C and BC should be fixed as high as possible
with low design factor D.
With regard to TWR and arranged in descending order of importance, peak current,
pulse on time, pulse off time and interaction between peak current and pulse on time (AB)
turned out to be the influential factors for a confidence level of 95%. The variation
tendency of TWR obtained in the case of peak current was the one that was expected in
advance, whereas the opposite behaviour was obtained in the case of pulse on time and
interaction AB. Moreover, in the case of pulse off time, it was verified that decrease the
value will lead to unstable machining condition, thus increase in the wear on the electrode
due to high carbon deposition adhere on the electrode surface. As a result, it will spoil the

Jurnal Mekanikal June 2014
99
finish surface. Flushing pressure must be sufficient enough in order to wash away high
carbon or loose grain generated near the cutting area.
The optimization to all design factors which reflect to particular response as desired
has been established with confidence level of 95%. In order to optimize or propose the
cutting condition, it is depending on what kind of process output or finishing allowance is
required when EDM on silicon carbide as follows four criteria:
i. Minimize surface roughness (Finishing process)
ii. Maximize material removal rate (Roughing process)
iii. Minimize tool wear rate (Micromachining process)
iv. Combination of optimum cutting condition
ACKNOWLEDGEMENTS
The authors would like to acknowledge the support of Faculty of Mechanical Engineering,
Universiti Teknologi Malaysia and Production Technology Department of German Malaysian
Institute.
REFERENCES
[1] M.P. Jahan, M. Rahman, Y.S. Wong, “A Review on The Conventional and
Micro-Electro discharge Machining of Tungsten Carbide.” International Journal of
Machine Tools & Manufacture 51 (2011) 837–858.
[2] Guo XZ, Yang H, Zhang LJ, Zhu XY. “Sintering behavior, microstructure and
mechanical properties of silicon carbide ceramics containing different nano-TiN
additive.” Ceramics International, 36 (2010) 161–5.
[3] Okada A. “Automotive and industrial applications of structural ceramics in
Japan.” Journal of the European Ceramic Society, 28 (2008) 1097–104.
[4] Agarwal S, Rao PV. “Experimental investigation of surface or subsurface damage
formation and material removal mechanisms in SiC grinding.” International Journal of
Machine Tools Manufacture, 48 (2008) 698–710.
[5] L. Yin, E. Y. J. Vancoille, L. C. Lee, H. Huang, K. Ramesh and X. D. Liu.
“High-quality grinding of polycrystalline silicon carbide spherical surfaces.” Wear, 256
(1-2) (2004) 197-207.
[6] Frantiska Frajkorova , Miroslav Hnatko, Zoltan Lences, Pavol Sajgalik.
“Electrically conductive silicon carbide with the addition of Ti NbC.” Journal of the
European Ceramic Society 32 (2012) 2513–2518.
[7] K.H. Ho, S.T. Newman. “State of the art electrical discharge machining (EDM).”
International Journal of Machine Tools & Manufacture 43 (2003) 1287–1300
[8] Renjie Ji, Yonghong Liu, Yanzhen Zhang, Baoping Cai, Jianmin Ma, Xiaopeng
Li. “Influence of dielectric and machining parameters on the process performance for
electric discharge milling of SiC ceramic.” Int J Adv Manuf Technol (2012) 59 127–136.
[9] C.J. Luis, I. Puertas, G. Villa. “Material removal rate and electrode wear study on
the EDM of silicon carbide.” Journal of Materials Processing Technology 164–165
(2005) 889–896.
[10] S. Clijsters, K. Liu, D. Reynaerts, B. Lauwers. “EDM technology and strategy
development for the manufacturing of complex parts in SiSiC” Journal of Materials
Processing Technology 210 (2010) 631–641.
[11] www.poco.com “POCO®, EDM-100®, EDM-3®, EDM-AF5®, EDM-C3® and
EDM-200C® are registered trademarks of Poco Graphite, Inc. ” EDM-95967-0312.
[12] J. A. Sanchez, I. Cabanes, L. N. Lopez de Lacalle, A. Lamikiz. “Development of
Optimum Electrodischarge Machining Technology for Advanced Ceramics” The
International Journal of Advanced Manufacturing Technology (2001) 18:897–905.
Jurnal Mekanikal June 2014
100
[13] Hassan El-Hofy. “Advanced Machining Processes: Nontraditional and Hybrid
Machining Processes.” The McGraw-Hill Companies, Inc, New York (2005).
[14] I. Puertas, C.J. Luis, G. Villa. “Spacing roughness parameters study on the EDM
of silicon carbide.” Journal of Materials Processing Technology 164–165 (2005) 1590–
1596.
[15] H.K. Kansal, Sehijpal Singh, P. Kumar. “Parametric optimization of powder
mixed electrical discharge machining by response surface methodology.” Journal of
Materials Processing Technology 169 (2005) (3), 427–436.
[16] B.Mohan, A.Rajadurai, K.G.Satyanarayana.“Effect of SiC and rotation of
electrode on electric discharge machining of Al-SiC composite.” Journal of Materials
Processing Technology 124 (2002) 297-304.
[17] Dilshad Ahmad Khan, Mohammad Hameedullah. “Effect of tool polarity on the
machining characteristics in electric discharge machining of silver steel and statistical
modelling of the process.” International Journal of Engineering Science and Technology.