classification of emotional states from electrocardiogram
TRANSCRIPT
Selvaraj et al. BioMedical Engineering OnLine 2013, 12:44http://www.biomedical-engineering-online.com/content/12/1/44
RESEARCH Open Access
Classification of emotional states fromelectrocardiogram signals: a non-linear approachbased on hurstJerritta Selvaraj*, Murugappan Murugappan, Khairunizam Wan and Sazali Yaacob
* Correspondence:[email protected] Signal ProcessingResearch Cluster, School ofMechatronic Engineering, UniversitiMalaysia Perlis (UniMAP), KampusUlu Pauh, Arau, Perlis 02600,Malaysia
Abstract
Background: Identifying the emotional state is helpful in applications involvingpatients with autism and other intellectual disabilities; computer-based training,human computer interaction etc. Electrocardiogram (ECG) signals, being an activityof the autonomous nervous system (ANS), reflect the underlying true emotional stateof a person. However, the performance of various methods developed so far lacksaccuracy, and more robust methods need to be developed to identify the emotionalpattern associated with ECG signals.
Methods: Emotional ECG data was obtained from sixty participants by inducing thesix basic emotional states (happiness, sadness, fear, disgust, surprise and neutral)using audio-visual stimuli. The non-linear feature ‘Hurst’ was computed usingRescaled Range Statistics (RRS) and Finite Variance Scaling (FVS) methods. New Hurstfeatures were proposed by combining the existing RRS and FVS methods withHigher Order Statistics (HOS). The features were then classified using four classifiers –Bayesian Classifier, Regression Tree, K- nearest neighbor and Fuzzy K-nearestneighbor. Seventy percent of the features were used for training and thirty percentfor testing the algorithm.
Results: Analysis of Variance (ANOVA) conveyed that Hurst and the proposedfeatures were statistically significant (p < 0.001). Hurst computed using RRS and FVSmethods showed similar classification accuracy. The features obtained by combiningFVS and HOS performed better with a maximum accuracy of 92.87% and 76.45% forclassifying the six emotional states using random and subject independent validationrespectively.
Conclusions: The results indicate that the combination of non-linear analysis andHOS tend to capture the finer emotional changes that can be seen in healthy ECGdata. This work can be further fine tuned to develop a real time system.
BackgroundThe expression and understanding of emotions play a major role in human communi-
cation facilitating mutual sympathy [1,2]. Extending this to machines and computers is
one of the important issues that researchers in human-computer interaction (HCI) are
trying to address [2]. Providing such sympathy would help humans to interact naturally
with computers or machines improving the quality of service offered [3]. Though ma-
chines may never need all the emotional skills of people, equipping them with some of
© 2013 Selvaraj et al.; licensee BioMed Central Ltd. This is an Open Access article distributed under the terms of the CreativeCommons Attribution License (http://creativecommons.org/licenses/by/2.0), which permits unrestricted use, distribution, andreproduction in any medium, provided the original work is properly cited.
Selvaraj et al. BioMedical Engineering OnLine 2013, 12:44 Page 2 of 18http://www.biomedical-engineering-online.com/content/12/1/44
the skills will make them appear intelligent when interacting with people [4]. Such a
system which can understand human emotions is also helpful in medical applications
for treating patients with intellectual disabilities and autism [5,6].
Emotions can be defined as a mental state that occurs spontaneously without any
conscious effort and is accompanied by physiological changes. It is systematically
produced by cognitive process, subjective feelings, physiological arousal, motivational
tendencies, and behavioral reactions [2]. They are believed to interact with the math-
ematical, verbal and perceptual intelligence associated with the human brain [4].
Researchers have widely focused on two models of emotions – discrete and dimen-
sional. The discrete model includes six basic emotions (happiness, sadness, fear, sur-
prise, disgust, anger) that are universally accepted. All other emotions are considered to
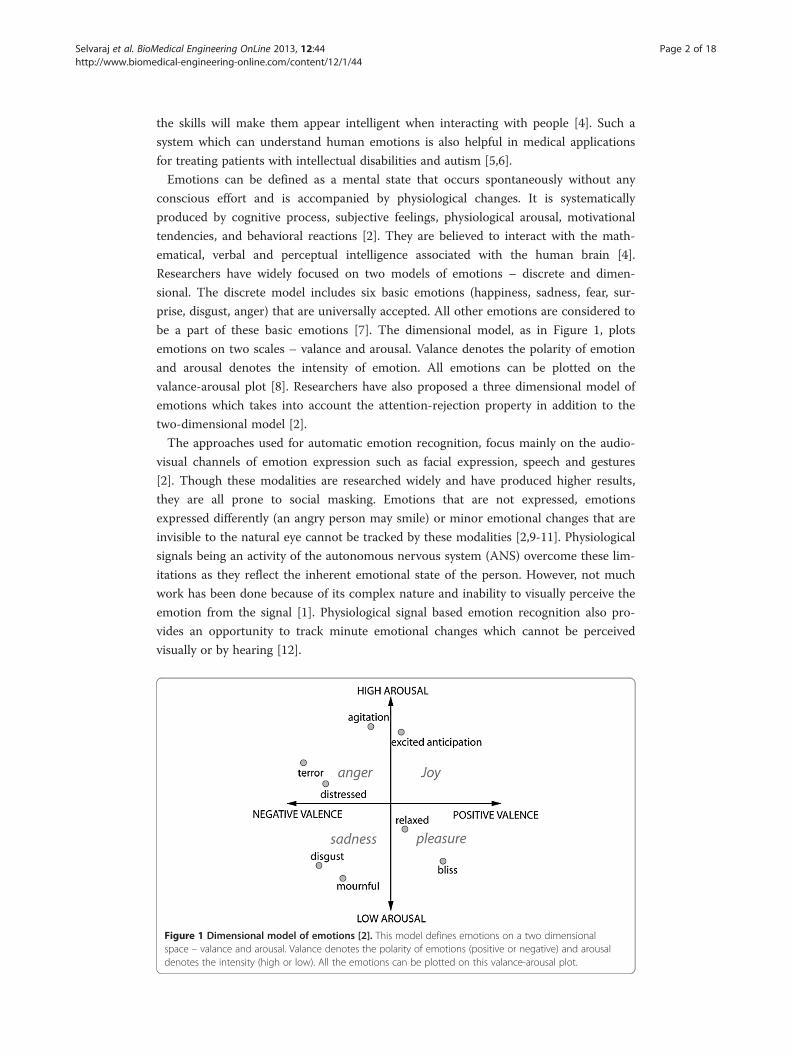
be a part of these basic emotions [7]. The dimensional model, as in Figure 1, plots
emotions on two scales – valance and arousal. Valance denotes the polarity of emotion
and arousal denotes the intensity of emotion. All emotions can be plotted on the
valance-arousal plot [8]. Researchers have also proposed a three dimensional model of
emotions which takes into account the attention-rejection property in addition to the
two-dimensional model [2].
The approaches used for automatic emotion recognition, focus mainly on the audio-
visual channels of emotion expression such as facial expression, speech and gestures
[2]. Though these modalities are researched widely and have produced higher results,
they are all prone to social masking. Emotions that are not expressed, emotions
expressed differently (an angry person may smile) or minor emotional changes that are
invisible to the natural eye cannot be tracked by these modalities [2,9-11]. Physiological
signals being an activity of the autonomous nervous system (ANS) overcome these lim-
itations as they reflect the inherent emotional state of the person. However, not much
work has been done because of its complex nature and inability to visually perceive the
emotion from the signal [1]. Physiological signal based emotion recognition also pro-
vides an opportunity to track minute emotional changes which cannot be perceived
visually or by hearing [12].
Figure 1 Dimensional model of emotions [2]. This model defines emotions on a two dimensionalspace – valance and arousal. Valance denotes the polarity of emotions (positive or negative) and arousaldenotes the intensity (high or low). All the emotions can be plotted on this valance-arousal plot.
Selvaraj et al. BioMedical Engineering OnLine 2013, 12:44 Page 3 of 18http://www.biomedical-engineering-online.com/content/12/1/44
Physiological measures such as Electroencephalogram (EEG), Electrocardiogram
(ECG), Electromyogram (EMG), Galvanic Skin Response (GSR), Blood Volume Pres-
sure (BVP), and Skin Temperature (ST) have been used to evaluate the emotional states
of a person. QRS complex, an activity of the ANS that is derived from ECG provides
information of the myocardial conduction system and can be used to understand the
emotions experienced by a person [13]. This research being in the infancy stages, the
performance of the different systems developed to recognize human emotions varies
from 37% to 100%, depending on factors such as the number of emotions, the number
of subjects, type of processing and types of emotion elicitation [2,3,14,15]. Some of the
works are done in a subject dependent way where the training and testing data belong
to the same subject [4,15].
Researchers have been using non-linear analysis in diverse areas of bio-signal pro-
cessing for evaluating heart rate, renal activity, renal blood flow, arterial pressure,
muscle activity and stress using signals such as Electrocardiogram (ECG), Heart Rate
Variability (HRV), Electroencephalogram (EEG), Electromyogram (EMG) and Respir-
ation Rate [16-18]. Non-linear analysis based on chaos theory helps in identifying the
apparently irregular behaviors that are present in the system [19]. Non-linear features
such as approximate entropy (APEN), largest Lyapunov exponent (LLE), correlation
dimension (CD), Hurst exponent (H) and non-linear prediction error has been learned
widely [16,20]. These features convey information related to properties such as similar-
ity, predictability, reliability and sensitivity of the signal.
Hurst exponent analyzes the smoothness of a time series and is based on self similar-
ity and correlation properties. It also evaluates the presence or absence of long-range
dependence and its degree on a time series [16,21]. Emotions being transient the mo-
mentary variations that occur in the physiological signals can be evaluated by under-
standing the degree of similarity and short term correlations that can be measured
using the Hurst parameter. Different methodologies based on rescaled range statistics,
finite variance scaling (FVS), wavelet transform (WT) and empirical mode decompos-
ition (EMD) are used to obtain the value of Hurst [20,22]. Previously, Hurst analysis
has been done on various Biosignals for applications involving premature heart beat
detection, coronary heart disease, sleep apnea and identification of mental state using
EEG, HRV and ECG signals. Tommaso Costa et al., has examined Hurst exponent for
cardiac signals in response to positive and negative stimuli [23]. However, not much
work has been done to find the emotional content in the Hurst parameter.
Higher Order Statistics (HOS) refers to functions of orders three or more in contrast
to the conventional statistics which are of orders one and two. The non-linear and
non-Gaussian characteristics of the signal can be obtained by using HOS features and
are widely used in the analysis of physiological signals [24,25]. Recently in [26],
researchers achieved an 82% accuracy in recognizing emotions from EEG signals using
HOS [26]. Their works indicate that HOS can also be used to seek emotional informa-
tion from other physiological signals.
HOS features namely skewness and kurtosis measure the presence of transients in
the signal and are robust to noise. Hurst measures the degree of self-similarity in the
time series. In [27], the authors merged HOS with wavelets in order to compress ECG
data and proved the merged method to efficiently exploit the inter beat correlations of
the ECG data in noisy environments. In a similar way merging HOS with Hurst would
Selvaraj et al. BioMedical Engineering OnLine 2013, 12:44 Page 4 of 18http://www.biomedical-engineering-online.com/content/12/1/44
enhance the variations in transient, thereby helping to effectively measure the short
term correlations or the sudden physiological changes that occur during emotions.
In this work, we try to (1) understand the emotional information in ECG signals for
the six basic and universal emotional states worked by Ekman et al., (happiness,
sadness, fear, surprise, disgust and neutral) and (2) identify new non-linear features
combining HOS and Hurst that can capture better emotional information from the
physiological data [7]. Hurst and the proposed features were extracted from the QRS
complex of emotional ECG signals using two widely used methods - Rescaled Range
Statistics (RRS) and Finite Variance Scaling (FVS). The methodology, including emotion
induction and data acquisition for the six emotional states (happiness, disgust, sadness,
fear, surprise and neutral) is discussed in detail. Two new Hurst features based Higher
Order Statistics (HOS) such as skewness based hurst and kurtosis based hurst are de-
rived. These features were found to contain better emotional information compared to
the Hurst derived in the traditional way. The performance, advantages and pitfalls are
also discussed.
MethodsEmotional data acquisition
Gathering good and meaningful data is necessary in any signal processing application.
In works related to emotion recognition using physiological signals, acquiring emo-
tional physiological data is challenging because of the subjective nature of emotions
and cognitive dependence of physiological signals. This necessitates the six emotional
states to be elicited internally in the subject unlike other modalities of facial action or
speech where the emotions can be enacted. The intensity of emotion induced varies
among subjects and depends on psychological factors such as attention, orientation, so-
cial interaction and appraisal [2,4].
Researchers have used different methods to elicit the target emotions. Visual based
elicitation using images, audio based elicitation using music and audio-visual elicitation
using short film video clips are commonly used [2,15,28,29]. Other modalities such as
recall paradigm where the subject is asked to repeatedly recall emotional instances
from their life and dyadic interaction where a facilitator helps in inducing the various
emotions are also used by researchers [30,31]. Audio-visual elicitation using short film
clips is found to elicit the target emotion better [32,33] compared to the other modal-
ities. Hence, in this work emotions were induced by using short video clips.
Pilot study
One of the major tasks in inducing emotions using short audio-visual clips is to identify
video clips that would elicit the target emotions better. For this, around 20 video clips
per emotional state were collected from various sources on the internet, and a pilot
study was conducted. Fifteen volunteers in the mean age of 25 years participated in the
pilot study to rate the emotions they experienced when watching the video clips. Sixty
audio visual clips (ten for each emotion) with the highest rating were chosen for data
collection. The emotional state ‘anger’ was excluded for further study because of poor
rating, which points back to the local culture.
Selvaraj et al. BioMedical Engineering OnLine 2013, 12:44 Page 5 of 18http://www.biomedical-engineering-online.com/content/12/1/44
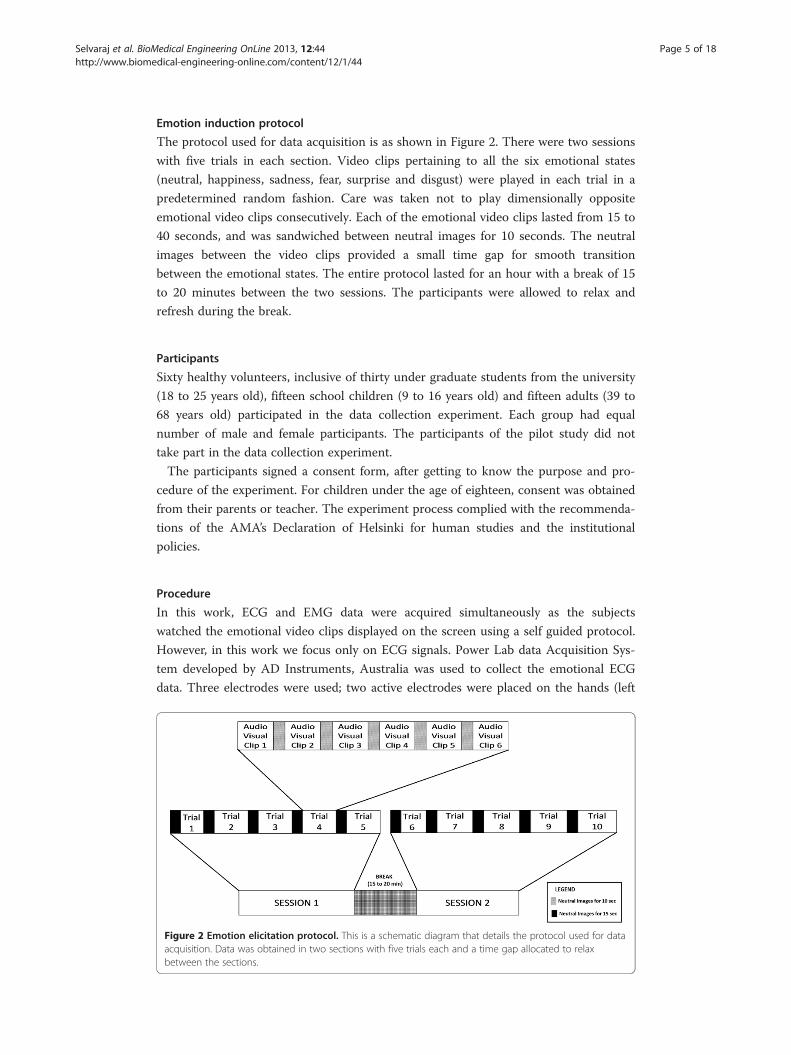
Emotion induction protocol
The protocol used for data acquisition is as shown in Figure 2. There were two sessions
with five trials in each section. Video clips pertaining to all the six emotional states
(neutral, happiness, sadness, fear, surprise and disgust) were played in each trial in a
predetermined random fashion. Care was taken not to play dimensionally opposite
emotional video clips consecutively. Each of the emotional video clips lasted from 15 to
40 seconds, and was sandwiched between neutral images for 10 seconds. The neutral
images between the video clips provided a small time gap for smooth transition
between the emotional states. The entire protocol lasted for an hour with a break of 15
to 20 minutes between the two sessions. The participants were allowed to relax and
refresh during the break.
Participants
Sixty healthy volunteers, inclusive of thirty under graduate students from the university
(18 to 25 years old), fifteen school children (9 to 16 years old) and fifteen adults (39 to
68 years old) participated in the data collection experiment. Each group had equal
number of male and female participants. The participants of the pilot study did not
take part in the data collection experiment.
The participants signed a consent form, after getting to know the purpose and pro-
cedure of the experiment. For children under the age of eighteen, consent was obtained
from their parents or teacher. The experiment process complied with the recommenda-
tions of the AMA’s Declaration of Helsinki for human studies and the institutional
policies.
Procedure
In this work, ECG and EMG data were acquired simultaneously as the subjects
watched the emotional video clips displayed on the screen using a self guided protocol.
However, in this work we focus only on ECG signals. Power Lab data Acquisition Sys-
tem developed by AD Instruments, Australia was used to collect the emotional ECG
data. Three electrodes were used; two active electrodes were placed on the hands (left
Figure 2 Emotion elicitation protocol. This is a schematic diagram that details the protocol used for dataacquisition. Data was obtained in two sections with five trials each and a time gap allocated to relaxbetween the sections.
Selvaraj et al. BioMedical Engineering OnLine 2013, 12:44 Page 6 of 18http://www.biomedical-engineering-online.com/content/12/1/44
and right) and one reference electrode on the left leg. The sampling frequency was set
to 1000 Hz.
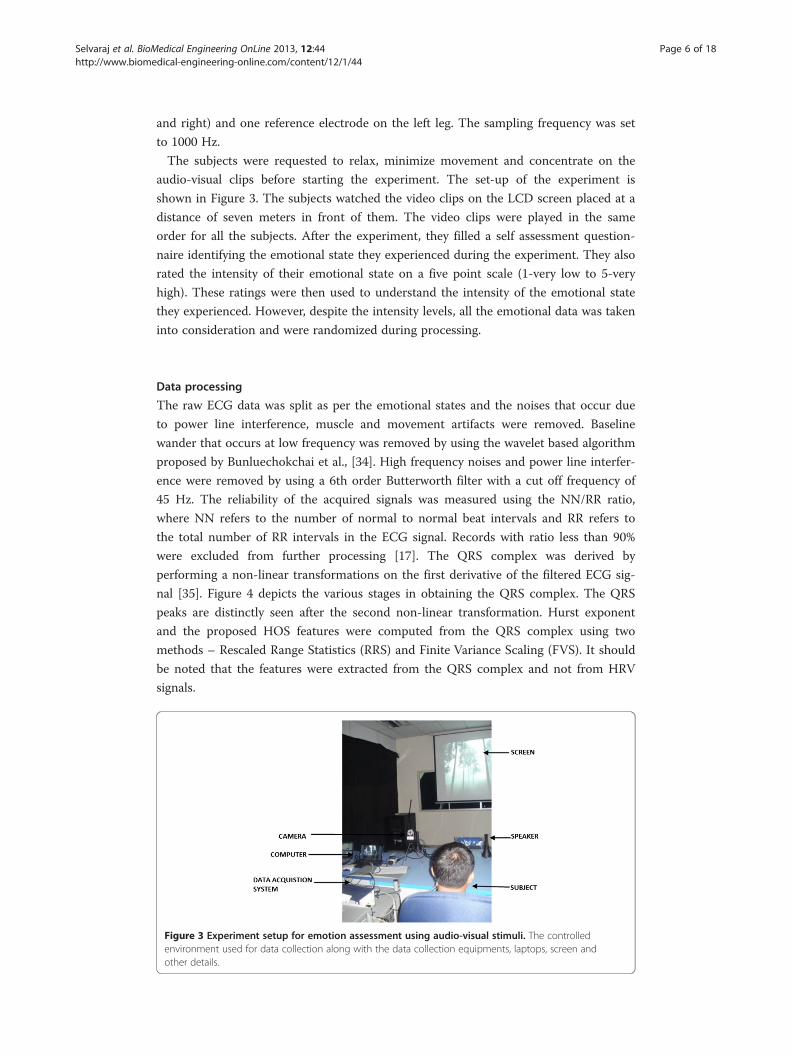
The subjects were requested to relax, minimize movement and concentrate on the
audio-visual clips before starting the experiment. The set-up of the experiment is
shown in Figure 3. The subjects watched the video clips on the LCD screen placed at a
distance of seven meters in front of them. The video clips were played in the same
order for all the subjects. After the experiment, they filled a self assessment question-
naire identifying the emotional state they experienced during the experiment. They also
rated the intensity of their emotional state on a five point scale (1-very low to 5-very
high). These ratings were then used to understand the intensity of the emotional state
they experienced. However, despite the intensity levels, all the emotional data was taken
into consideration and were randomized during processing.
Data processing
The raw ECG data was split as per the emotional states and the noises that occur due
to power line interference, muscle and movement artifacts were removed. Baseline
wander that occurs at low frequency was removed by using the wavelet based algorithm
proposed by Bunluechokchai et al., [34]. High frequency noises and power line interfer-
ence were removed by using a 6th order Butterworth filter with a cut off frequency of
45 Hz. The reliability of the acquired signals was measured using the NN/RR ratio,
where NN refers to the number of normal to normal beat intervals and RR refers to
the total number of RR intervals in the ECG signal. Records with ratio less than 90%
were excluded from further processing [17]. The QRS complex was derived by
performing a non-linear transformations on the first derivative of the filtered ECG sig-
nal [35]. Figure 4 depicts the various stages in obtaining the QRS complex. The QRS
peaks are distinctly seen after the second non-linear transformation. Hurst exponent
and the proposed HOS features were computed from the QRS complex using two
methods – Rescaled Range Statistics (RRS) and Finite Variance Scaling (FVS). It should
be noted that the features were extracted from the QRS complex and not from HRV
signals.
Figure 3 Experiment setup for emotion assessment using audio-visual stimuli. The controlledenvironment used for data collection along with the data collection equipments, laptops, screen andother details.
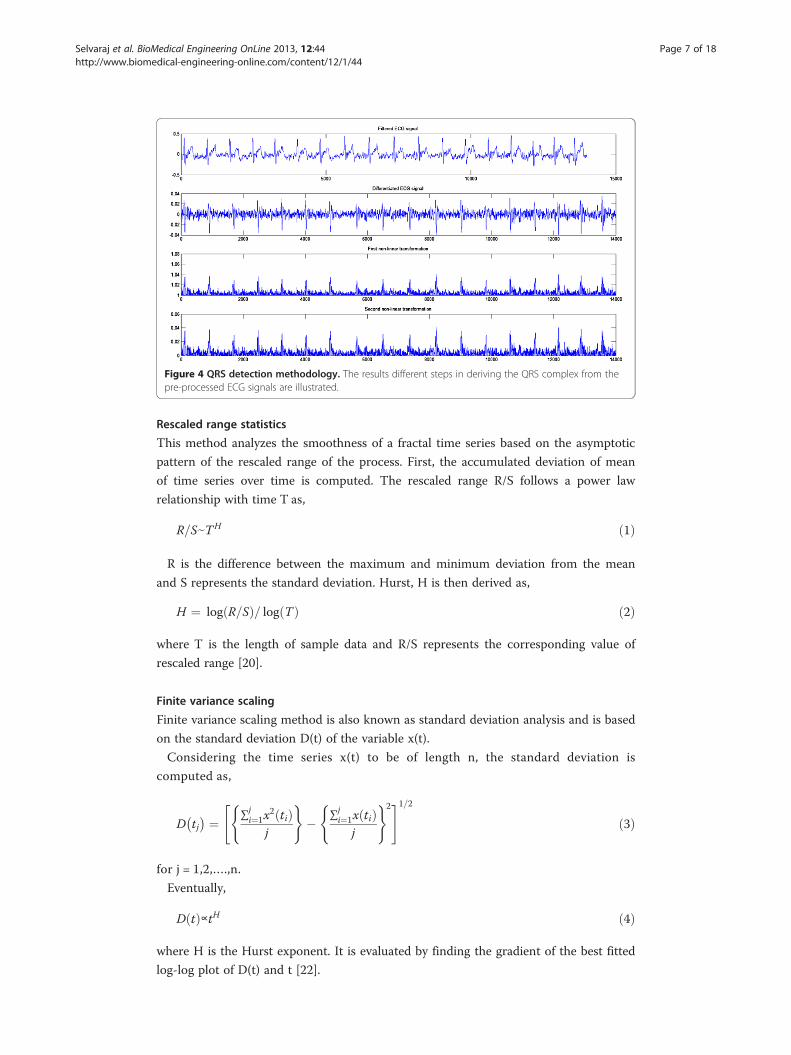
Figure 4 QRS detection methodology. The results different steps in deriving the QRS complex from thepre-processed ECG signals are illustrated.
Selvaraj et al. BioMedical Engineering OnLine 2013, 12:44 Page 7 of 18http://www.biomedical-engineering-online.com/content/12/1/44
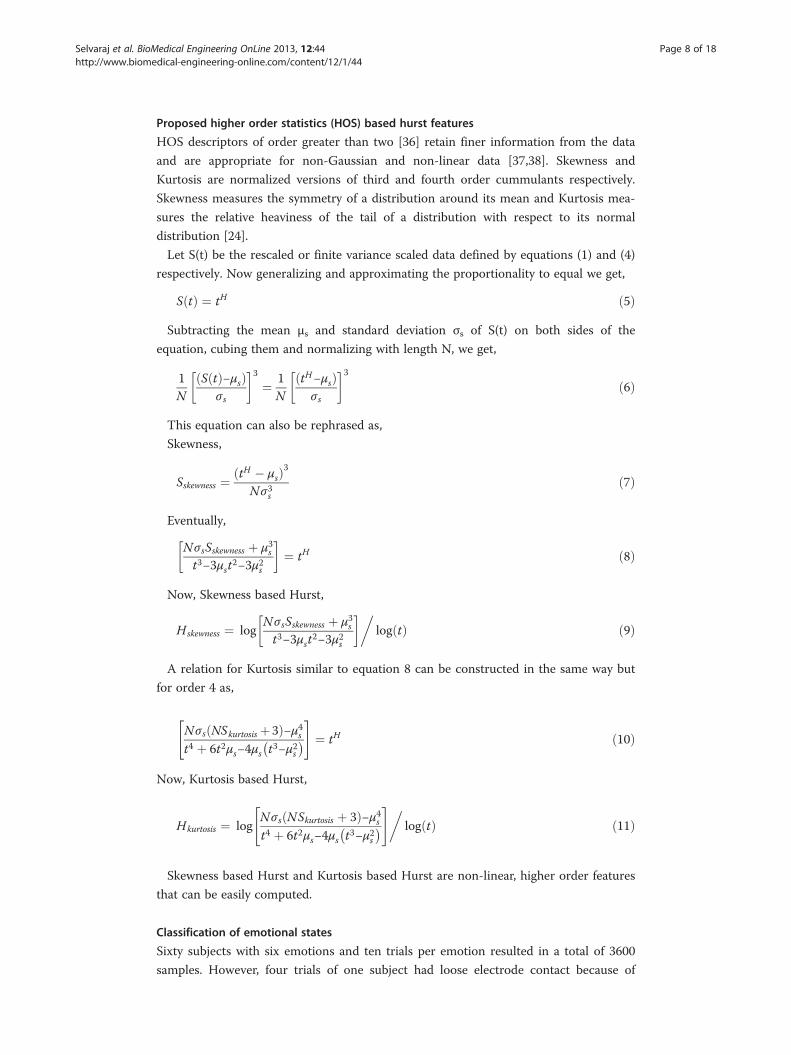
Rescaled range statistics
This method analyzes the smoothness of a fractal time series based on the asymptotic
pattern of the rescaled range of the process. First, the accumulated deviation of mean
of time series over time is computed. The rescaled range R/S follows a power law
relationship with time T as,
R=SeTH ð1Þ
R is the difference between the maximum and minimum deviation from the mean
and S represents the standard deviation. Hurst, H is then derived as,
H ¼ log R=Sð Þ= log Tð Þ ð2Þ
where T is the length of sample data and R/S represents the corresponding value of
rescaled range [20].
Finite variance scaling
Finite variance scaling method is also known as standard deviation analysis and is based
on the standard deviation D(t) of the variable x(t).
Considering the time series x(t) to be of length n, the standard deviation is
computed as,
D tj� � ¼ ∑j
i¼1x2 tið Þj
( )� ∑j
i¼1x tið Þj
( )2" #1=2
ð3Þ
for j = 1,2,….,n.
Eventually,
D tð Þ∝tH ð4Þ
where H is the Hurst exponent. It is evaluated by finding the gradient of the best fitted
log-log plot of D(t) and t [22].
Selvaraj et al. BioMedical Engineering OnLine 2013, 12:44 Page 8 of 18http://www.biomedical-engineering-online.com/content/12/1/44
Proposed higher order statistics (HOS) based hurst features
HOS descriptors of order greater than two [36] retain finer information from the data
and are appropriate for non-Gaussian and non-linear data [37,38]. Skewness and
Kurtosis are normalized versions of third and fourth order cummulants respectively.
Skewness measures the symmetry of a distribution around its mean and Kurtosis mea-
sures the relative heaviness of the tail of a distribution with respect to its normal
distribution [24].
Let S(t) be the rescaled or finite variance scaled data defined by equations (1) and (4)
respectively. Now generalizing and approximating the proportionality to equal we get,
S tð Þ ¼ tH ð5Þ
Subtracting the mean μs and standard deviation σs of S(t) on both sides of the
equation, cubing them and normalizing with length N, we get,
1N
S tð Þ−μsð Þσs
� �3¼ 1
NtH−μsð Þσs
� �3ð6Þ
This equation can also be rephrased as,
Skewness,
Sskewness ¼ tH � μsð Þ3Nσ3s
ð7Þ
Eventually,
NσsSskewness þ μ3st3−3μst2−3μ2s
� �¼ tH ð8Þ
Now, Skewness based Hurst,
Hskewness ¼ logNσsSskewness þ μ3st3−3μst2−3μ2s
� ��log tð Þ ð9Þ
A relation for Kurtosis similar to equation 8 can be constructed in the same way but
for order 4 as,
NσsðNSkurtosis þ3Þ−μ4st4 þ 6t2μs−4μs t3−μ2s
� �" #¼ tH ð10Þ
Now, Kurtosis based Hurst,
Hkurtosis ¼ logNσ s NSkurtosis þ 3ð Þ−μ4st4 þ 6t2μs−4μs t3−μ2s
� �" #�log tð Þ ð11Þ
Skewness based Hurst and Kurtosis based Hurst are non-linear, higher order features
that can be easily computed.
Classification of emotional states
Sixty subjects with six emotions and ten trials per emotion resulted in a total of 3600
samples. However, four trials of one subject had loose electrode contact because of
Selvaraj et al. BioMedical Engineering OnLine 2013, 12:44 Page 9 of 18http://www.biomedical-engineering-online.com/content/12/1/44
which the data was ignored. Data from four kids and three young adults were also ig-
nored because of unreliability captured using the NN/RR ratio. This resulted in a total
of 3300 samples, which were processed. All the six features were extracted from these
samples.
The performance of the different features as analyzed by four classifiers – Regression
tree, naïve Bayes, K- Nearest Neighbour (KNN) and fuzzy KNN (FKNN). Regression
tree classifier creates a decision tree for predicting the classes based on Gini’s diversity
index whereas bayesian classifier is a probabilistic classifier based on Bayes theorem
with strong independence assumptions. KNN and FKNN assigns a class based on the
predominant class among the k nearest neighbors. The value of k was chosen to vary
from six to fifteen as the number of classes used for classification here is six. Euclidean
distance was used as the metric in KNN and FKNN allocates fuzzy class membership
before making decisions.
In this work, random-cross validation was done to test the performance of the classi-
fiers. The features derived from all the subjects were permutated and then categorized
into 70% and 30% for all the six emotional states. Then the 70% features were used for
training the classifier and 30% features were used for testing. The testing and training fea-
tures belonged to random subjects and varied in each run of the program. However, they
were mutually exclusive. Subject independent validation (also called leaving-one-person-
out) was also performed for the RRS and FVS based combined analysis [39]. The features
derived from 38 subjects were used for training the system and the other 16 subjects were
used for testing adhering to the 70–30 rule. The classification accuracy is computed for
the different emotional states as,
%AccuracyEmotion ¼Numberof correctlyclassified samplesEmotion
Totalnumber of tested samplesEmotion� 100 ð12Þ
where Emotion refers to the six emotional states namely happiness, sadness, fear, surprise,
disgust and neutral. The average accuracy was computed by taking the mean of the accur-
acies of all the six emotional states.
ResultsStatistical data analysis
Hurst was computed using RRS and FVS methods for high (0.15 to 0.4 Hz), low (0.04-
0.15 Hz) and very low frequency ranges (<0.04 Hz). These frequency ranges were
chosen as they are widely used in emotion recognition algorithms using physiological
signals [40]. Furthermore, researchers have also identified the impact of the QRS com-
plex on low frequency oscillations which makes it important to analyze the low fre-
quency range [41,42]. ANOVA indicated statistically significant (p < 0.001) changes
among the six emotional states for Hurst computed in very low frequency range. The
mean value of Hurst, in a very low frequency range for all the emotional states is as
shown in Figure 5. We can observe that the value of Hurst ranges from 0.0002 to
0.0018 for all the features, which is similar to the work in [43] where the scaling expo-
nent α is close to 0 for healthy heart beat data on a very low frequency range. Also in
[44], the Hurst exponent of short term ECG series is close to 0 in the low frequency
range during normalcy (pre- anesthetic stage).
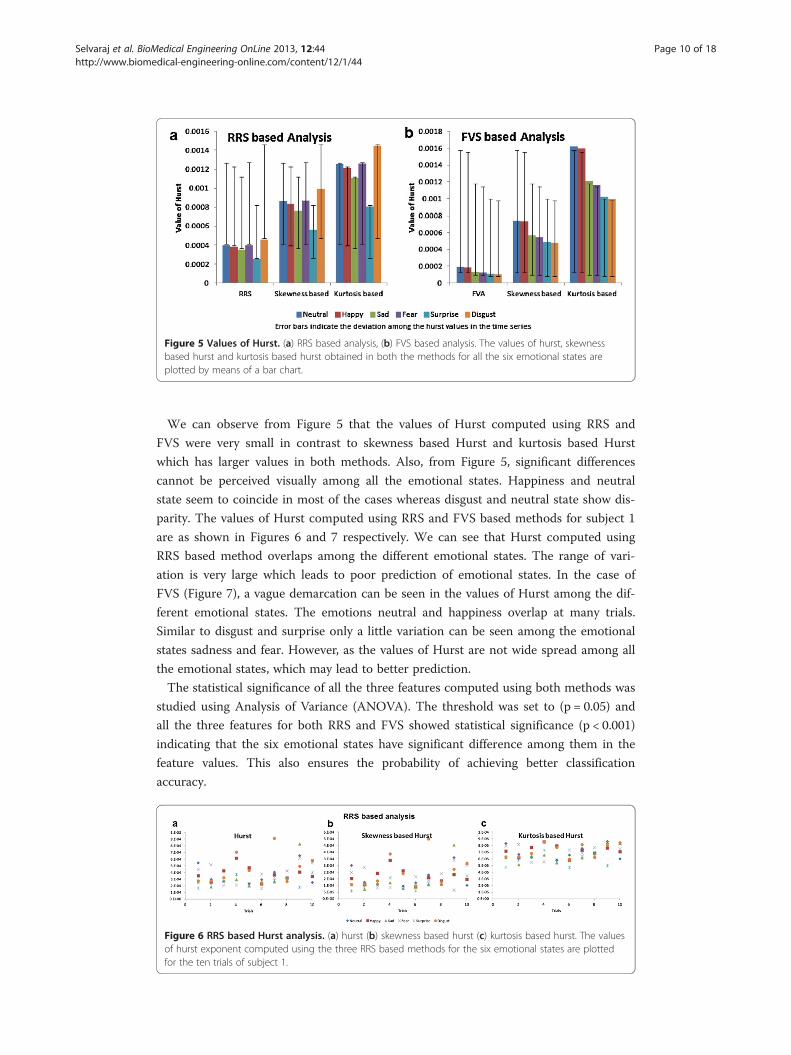
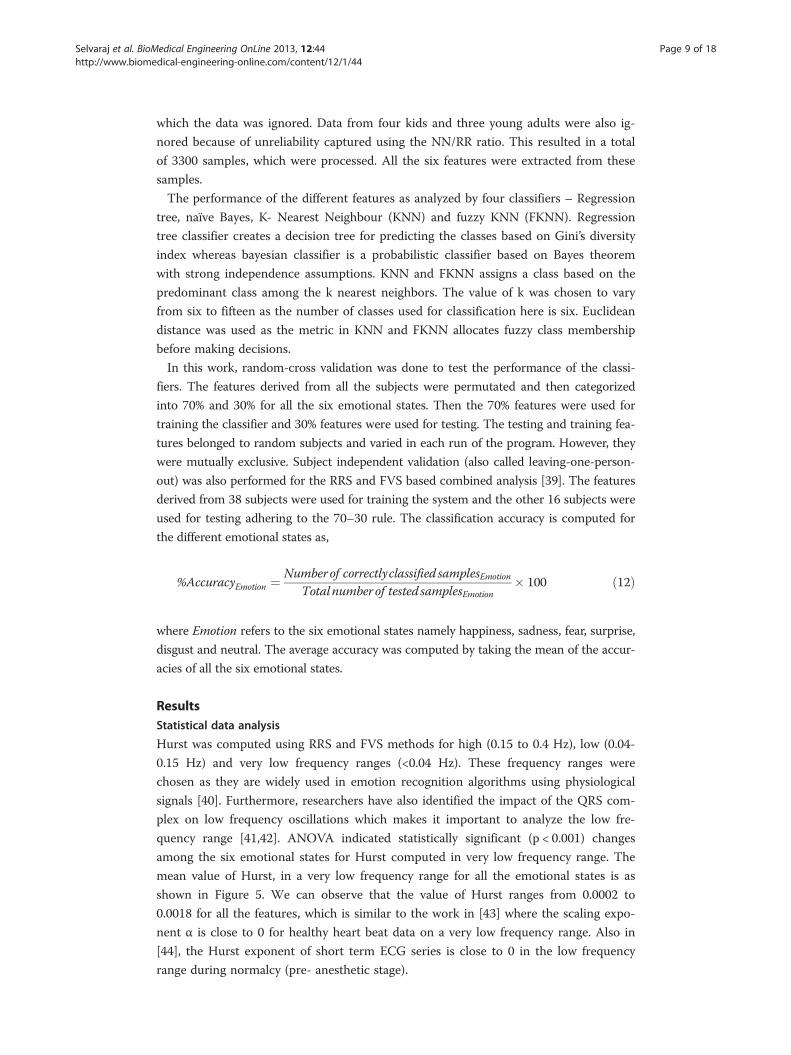
Figure 5 Values of Hurst. (a) RRS based analysis, (b) FVS based analysis. The values of hurst, skewnessbased hurst and kurtosis based hurst obtained in both the methods for all the six emotional states areplotted by means of a bar chart.
Selvaraj et al. BioMedical Engineering OnLine 2013, 12:44 Page 10 of 18http://www.biomedical-engineering-online.com/content/12/1/44
We can observe from Figure 5 that the values of Hurst computed using RRS and
FVS were very small in contrast to skewness based Hurst and kurtosis based Hurst
which has larger values in both methods. Also, from Figure 5, significant differences
cannot be perceived visually among all the emotional states. Happiness and neutral
state seem to coincide in most of the cases whereas disgust and neutral state show dis-
parity. The values of Hurst computed using RRS and FVS based methods for subject 1
are as shown in Figures 6 and 7 respectively. We can see that Hurst computed using
RRS based method overlaps among the different emotional states. The range of vari-
ation is very large which leads to poor prediction of emotional states. In the case of
FVS (Figure 7), a vague demarcation can be seen in the values of Hurst among the dif-
ferent emotional states. The emotions neutral and happiness overlap at many trials.
Similar to disgust and surprise only a little variation can be seen among the emotional
states sadness and fear. However, as the values of Hurst are not wide spread among all
the emotional states, which may lead to better prediction.
The statistical significance of all the three features computed using both methods was
studied using Analysis of Variance (ANOVA). The threshold was set to (p = 0.05) and
all the three features for both RRS and FVS showed statistical significance (p < 0.001)
indicating that the six emotional states have significant difference among them in the
feature values. This also ensures the probability of achieving better classification
accuracy.
Figure 6 RRS based Hurst analysis. (a) hurst (b) skewness based hurst (c) kurtosis based hurst. The valuesof hurst exponent computed using the three RRS based methods for the six emotional states are plottedfor the ten trials of subject 1.
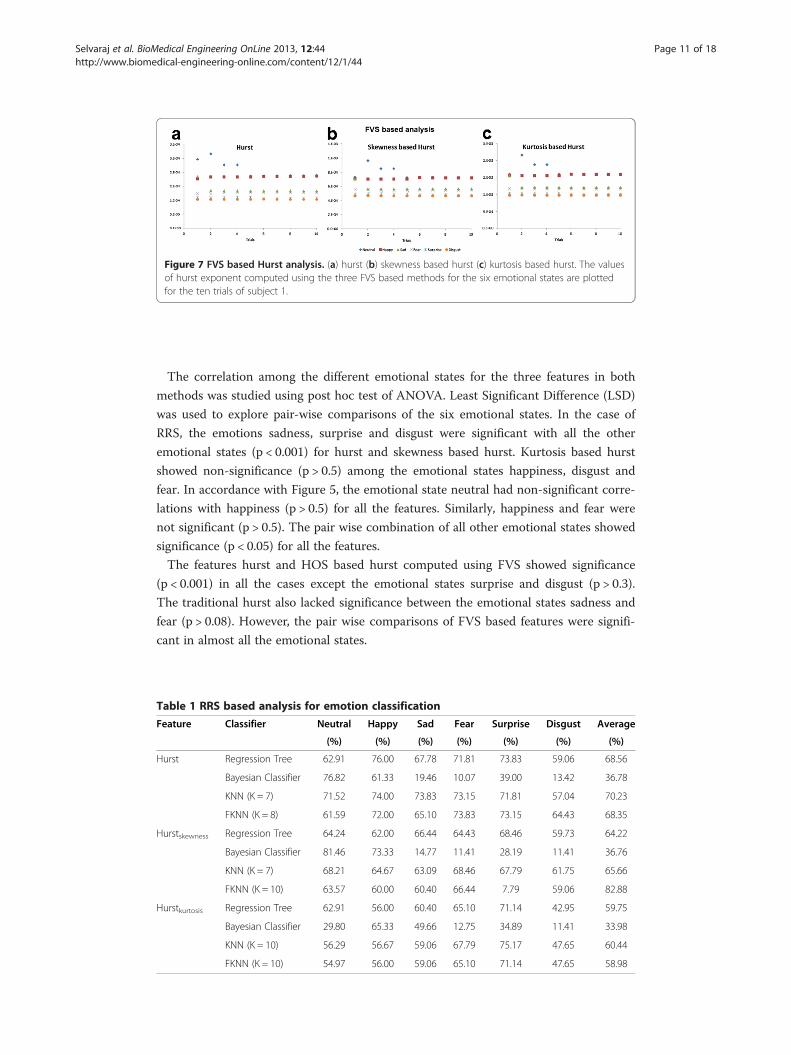
Figure 7 FVS based Hurst analysis. (a) hurst (b) skewness based hurst (c) kurtosis based hurst. The valuesof hurst exponent computed using the three FVS based methods for the six emotional states are plottedfor the ten trials of subject 1.
Selvaraj et al. BioMedical Engineering OnLine 2013, 12:44 Page 11 of 18http://www.biomedical-engineering-online.com/content/12/1/44
The correlation among the different emotional states for the three features in both
methods was studied using post hoc test of ANOVA. Least Significant Difference (LSD)
was used to explore pair-wise comparisons of the six emotional states. In the case of
RRS, the emotions sadness, surprise and disgust were significant with all the other
emotional states (p < 0.001) for hurst and skewness based hurst. Kurtosis based hurst
showed non-significance (p > 0.5) among the emotional states happiness, disgust and
fear. In accordance with Figure 5, the emotional state neutral had non-significant corre-
lations with happiness (p > 0.5) for all the features. Similarly, happiness and fear were
not significant (p > 0.5). The pair wise combination of all other emotional states showed
significance (p < 0.05) for all the features.
The features hurst and HOS based hurst computed using FVS showed significance
(p < 0.001) in all the cases except the emotional states surprise and disgust (p > 0.3).
The traditional hurst also lacked significance between the emotional states sadness and
fear (p > 0.08). However, the pair wise comparisons of FVS based features were signifi-
cant in almost all the emotional states.
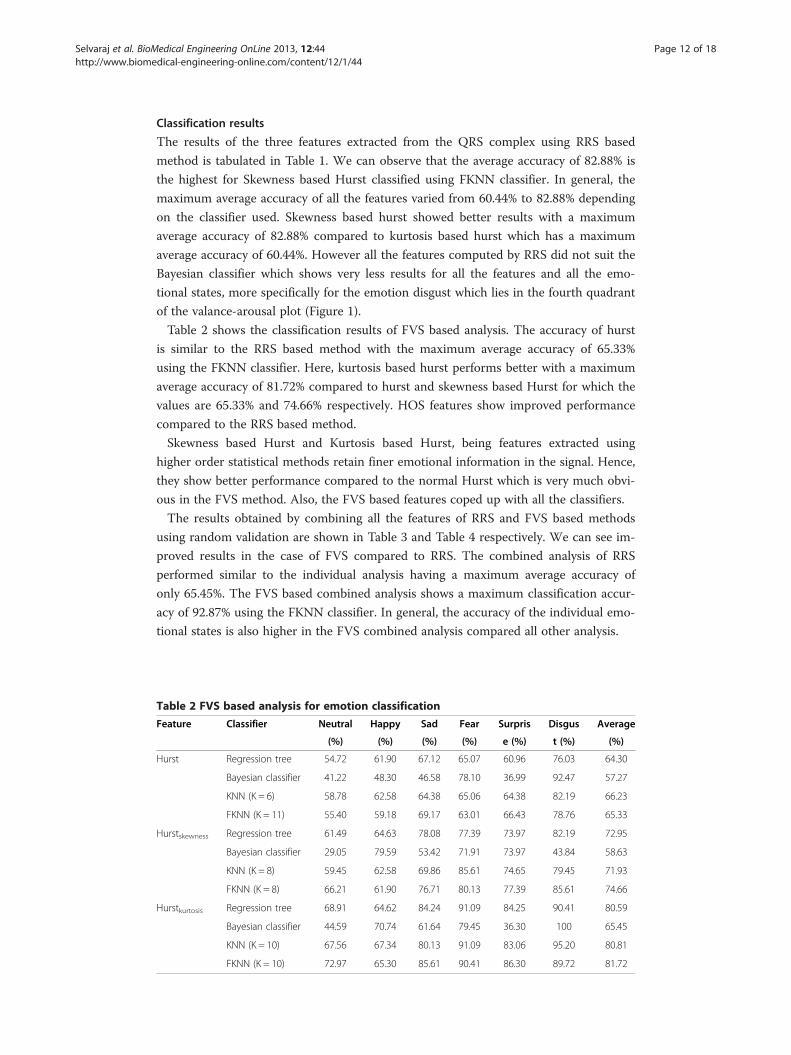
Table 1 RRS based analysis for emotion classification
Feature Classifier Neutral Happy Sad Fear Surprise Disgust Average
(%) (%) (%) (%) (%) (%) (%)
Hurst Regression Tree 62.91 76.00 67.78 71.81 73.83 59.06 68.56
Bayesian Classifier 76.82 61.33 19.46 10.07 39.00 13.42 36.78
KNN (K = 7) 71.52 74.00 73.83 73.15 71.81 57.04 70.23
FKNN (K = 8) 61.59 72.00 65.10 73.83 73.15 64.43 68.35
Hurstskewness Regression Tree 64.24 62.00 66.44 64.43 68.46 59.73 64.22
Bayesian Classifier 81.46 73.33 14.77 11.41 28.19 11.41 36.76
KNN (K = 7) 68.21 64.67 63.09 68.46 67.79 61.75 65.66
FKNN (K = 10) 63.57 60.00 60.40 66.44 7.79 59.06 82.88
Hurstkurtosis Regression Tree 62.91 56.00 60.40 65.10 71.14 42.95 59.75
Bayesian Classifier 29.80 65.33 49.66 12.75 34.89 11.41 33.98
KNN (K = 10) 56.29 56.67 59.06 67.79 75.17 47.65 60.44
FKNN (K = 10) 54.97 56.00 59.06 65.10 71.14 47.65 58.98
Selvaraj et al. BioMedical Engineering OnLine 2013, 12:44 Page 12 of 18http://www.biomedical-engineering-online.com/content/12/1/44
Classification results
The results of the three features extracted from the QRS complex using RRS based
method is tabulated in Table 1. We can observe that the average accuracy of 82.88% is
the highest for Skewness based Hurst classified using FKNN classifier. In general, the
maximum average accuracy of all the features varied from 60.44% to 82.88% depending
on the classifier used. Skewness based hurst showed better results with a maximum
average accuracy of 82.88% compared to kurtosis based hurst which has a maximum
average accuracy of 60.44%. However all the features computed by RRS did not suit the
Bayesian classifier which shows very less results for all the features and all the emo-
tional states, more specifically for the emotion disgust which lies in the fourth quadrant
of the valance-arousal plot (Figure 1).
Table 2 shows the classification results of FVS based analysis. The accuracy of hurst
is similar to the RRS based method with the maximum average accuracy of 65.33%
using the FKNN classifier. Here, kurtosis based hurst performs better with a maximum
average accuracy of 81.72% compared to hurst and skewness based Hurst for which the
values are 65.33% and 74.66% respectively. HOS features show improved performance
compared to the RRS based method.
Skewness based Hurst and Kurtosis based Hurst, being features extracted using
higher order statistical methods retain finer emotional information in the signal. Hence,
they show better performance compared to the normal Hurst which is very much obvi-
ous in the FVS method. Also, the FVS based features coped up with all the classifiers.
The results obtained by combining all the features of RRS and FVS based methods
using random validation are shown in Table 3 and Table 4 respectively. We can see im-
proved results in the case of FVS compared to RRS. The combined analysis of RRS
performed similar to the individual analysis having a maximum average accuracy of
only 65.45%. The FVS based combined analysis shows a maximum classification accur-
acy of 92.87% using the FKNN classifier. In general, the accuracy of the individual emo-
tional states is also higher in the FVS combined analysis compared all other analysis.
Table 2 FVS based analysis for emotion classification
Feature Classifier Neutral Happy Sad Fear Surpris Disgus Average
(%) (%) (%) (%) e (%) t (%) (%)
Hurst Regression tree 54.72 61.90 67.12 65.07 60.96 76.03 64.30
Bayesian classifier 41.22 48.30 46.58 78.10 36.99 92.47 57.27
KNN (K = 6) 58.78 62.58 64.38 65.06 64.38 82.19 66.23
FKNN (K = 11) 55.40 59.18 69.17 63.01 66.43 78.76 65.33
Hurstskewness Regression tree 61.49 64.63 78.08 77.39 73.97 82.19 72.95
Bayesian classifier 29.05 79.59 53.42 71.91 73.97 43.84 58.63
KNN (K = 8) 59.45 62.58 69.86 85.61 74.65 79.45 71.93
FKNN (K = 8) 66.21 61.90 76.71 80.13 77.39 85.61 74.66
Hurstkurtosis Regression tree 68.91 64.62 84.24 91.09 84.25 90.41 80.59
Bayesian classifier 44.59 70.74 61.64 79.45 36.30 100 65.45
KNN (K = 10) 67.56 67.34 80.13 91.09 83.06 95.20 80.81
FKNN (K = 10) 72.97 65.30 85.61 90.41 86.30 89.72 81.72
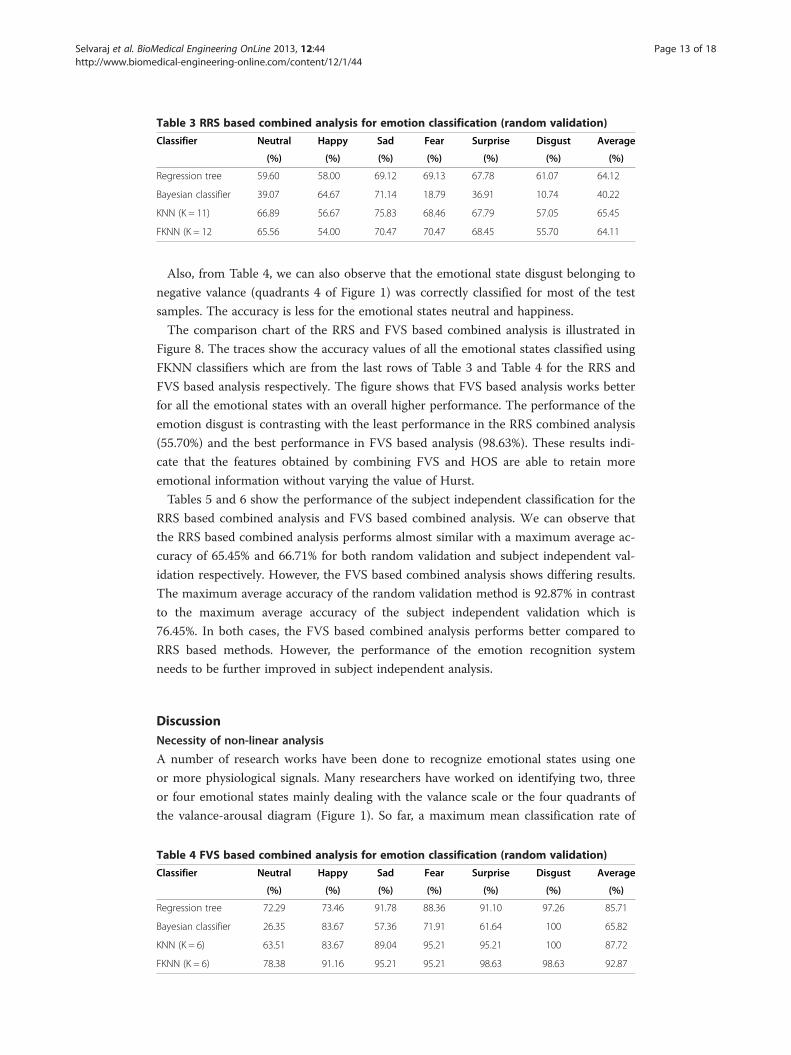
Table 3 RRS based combined analysis for emotion classification (random validation)
Classifier Neutral Happy Sad Fear Surprise Disgust Average
(%) (%) (%) (%) (%) (%) (%)
Regression tree 59.60 58.00 69.12 69.13 67.78 61.07 64.12
Bayesian classifier 39.07 64.67 71.14 18.79 36.91 10.74 40.22
KNN (K = 11) 66.89 56.67 75.83 68.46 67.79 57.05 65.45
FKNN (K = 12 65.56 54.00 70.47 70.47 68.45 55.70 64.11
Selvaraj et al. BioMedical Engineering OnLine 2013, 12:44 Page 13 of 18http://www.biomedical-engineering-online.com/content/12/1/44
Also, from Table 4, we can also observe that the emotional state disgust belonging to
negative valance (quadrants 4 of Figure 1) was correctly classified for most of the test
samples. The accuracy is less for the emotional states neutral and happiness.
The comparison chart of the RRS and FVS based combined analysis is illustrated in
Figure 8. The traces show the accuracy values of all the emotional states classified using
FKNN classifiers which are from the last rows of Table 3 and Table 4 for the RRS and
FVS based analysis respectively. The figure shows that FVS based analysis works better
for all the emotional states with an overall higher performance. The performance of the
emotion disgust is contrasting with the least performance in the RRS combined analysis
(55.70%) and the best performance in FVS based analysis (98.63%). These results indi-
cate that the features obtained by combining FVS and HOS are able to retain more
emotional information without varying the value of Hurst.
Tables 5 and 6 show the performance of the subject independent classification for the
RRS based combined analysis and FVS based combined analysis. We can observe that
the RRS based combined analysis performs almost similar with a maximum average ac-
curacy of 65.45% and 66.71% for both random validation and subject independent val-
idation respectively. However, the FVS based combined analysis shows differing results.
The maximum average accuracy of the random validation method is 92.87% in contrast
to the maximum average accuracy of the subject independent validation which is
76.45%. In both cases, the FVS based combined analysis performs better compared to
RRS based methods. However, the performance of the emotion recognition system
needs to be further improved in subject independent analysis.
DiscussionNecessity of non-linear analysis
A number of research works have been done to recognize emotional states using one
or more physiological signals. Many researchers have worked on identifying two, three
or four emotional states mainly dealing with the valance scale or the four quadrants of
the valance-arousal diagram (Figure 1). So far, a maximum mean classification rate of
Table 4 FVS based combined analysis for emotion classification (random validation)
Classifier Neutral Happy Sad Fear Surprise Disgust Average
(%) (%) (%) (%) (%) (%) (%)
Regression tree 72.29 73.46 91.78 88.36 91.10 97.26 85.71
Bayesian classifier 26.35 83.67 57.36 71.91 61.64 100 65.82
KNN (K = 6) 63.51 83.67 89.04 95.21 95.21 100 87.72
FKNN (K = 6) 78.38 91.16 95.21 95.21 98.63 98.63 92.87
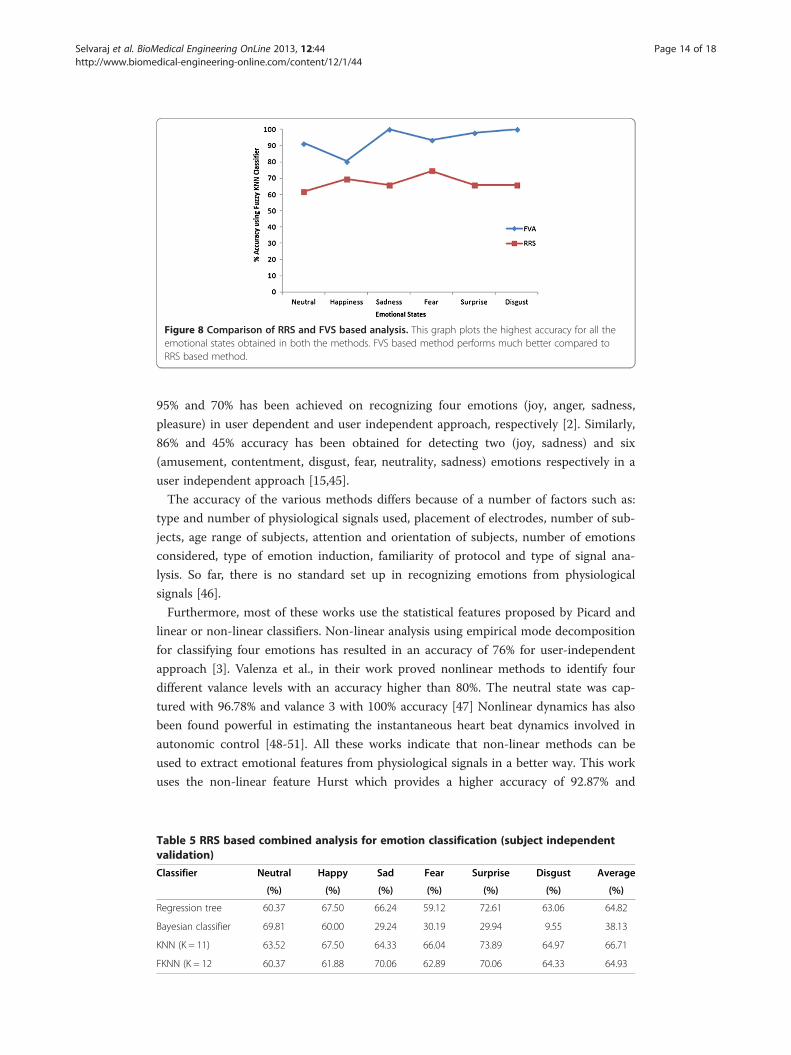
Figure 8 Comparison of RRS and FVS based analysis. This graph plots the highest accuracy for all theemotional states obtained in both the methods. FVS based method performs much better compared toRRS based method.
Selvaraj et al. BioMedical Engineering OnLine 2013, 12:44 Page 14 of 18http://www.biomedical-engineering-online.com/content/12/1/44
95% and 70% has been achieved on recognizing four emotions (joy, anger, sadness,
pleasure) in user dependent and user independent approach, respectively [2]. Similarly,
86% and 45% accuracy has been obtained for detecting two (joy, sadness) and six
(amusement, contentment, disgust, fear, neutrality, sadness) emotions respectively in a
user independent approach [15,45].
The accuracy of the various methods differs because of a number of factors such as:
type and number of physiological signals used, placement of electrodes, number of sub-
jects, age range of subjects, attention and orientation of subjects, number of emotions
considered, type of emotion induction, familiarity of protocol and type of signal ana-
lysis. So far, there is no standard set up in recognizing emotions from physiological
signals [46].
Furthermore, most of these works use the statistical features proposed by Picard and
linear or non-linear classifiers. Non-linear analysis using empirical mode decomposition
for classifying four emotions has resulted in an accuracy of 76% for user-independent
approach [3]. Valenza et al., in their work proved nonlinear methods to identify four
different valance levels with an accuracy higher than 80%. The neutral state was cap-
tured with 96.78% and valance 3 with 100% accuracy [47] Nonlinear dynamics has also
been found powerful in estimating the instantaneous heart beat dynamics involved in
autonomic control [48-51]. All these works indicate that non-linear methods can be
used to extract emotional features from physiological signals in a better way. This work
uses the non-linear feature Hurst which provides a higher accuracy of 92.87% and
Table 5 RRS based combined analysis for emotion classification (subject independentvalidation)
Classifier Neutral Happy Sad Fear Surprise Disgust Average
(%) (%) (%) (%) (%) (%) (%)
Regression tree 60.37 67.50 66.24 59.12 72.61 63.06 64.82
Bayesian classifier 69.81 60.00 29.24 30.19 29.94 9.55 38.13
KNN (K = 11) 63.52 67.50 64.33 66.04 73.89 64.97 66.71
FKNN (K = 12 60.37 61.88 70.06 62.89 70.06 64.33 64.93
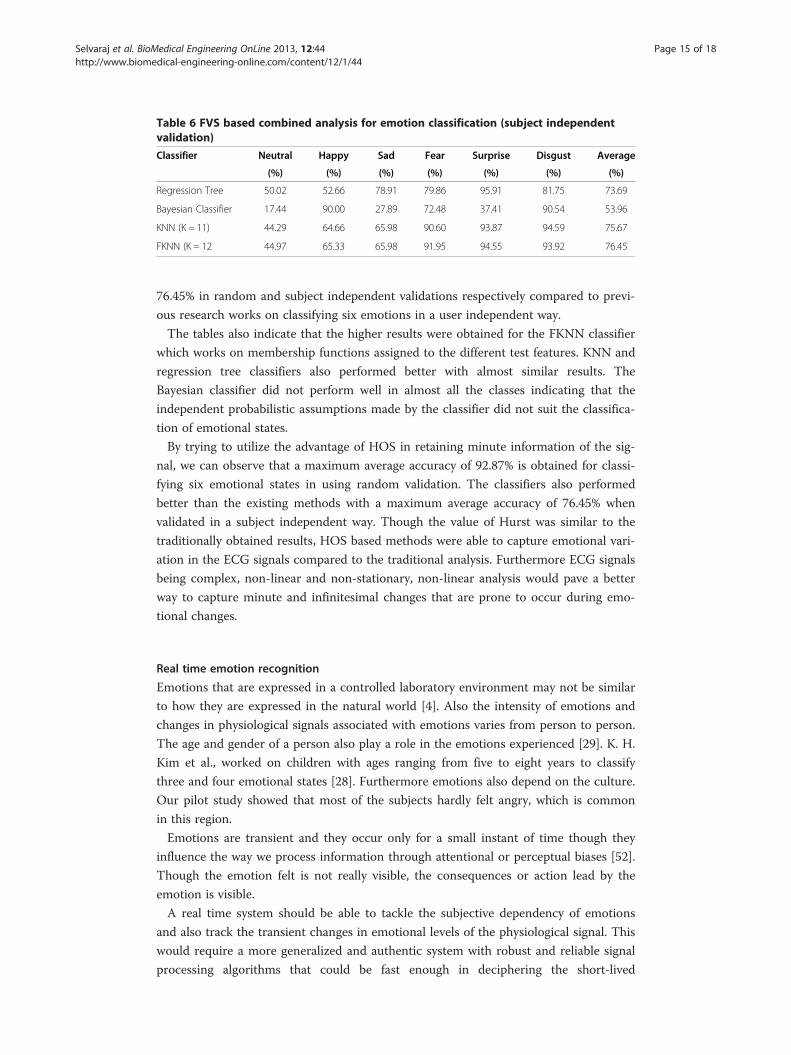
Table 6 FVS based combined analysis for emotion classification (subject independentvalidation)
Classifier Neutral Happy Sad Fear Surprise Disgust Average
(%) (%) (%) (%) (%) (%) (%)
Regression Tree 50.02 52.66 78.91 79.86 95.91 81.75 73.69
Bayesian Classifier 17.44 90.00 27.89 72.48 37.41 90.54 53.96
KNN (K = 11) 44.29 64.66 65.98 90.60 93.87 94.59 75.67
FKNN (K = 12 44.97 65.33 65.98 91.95 94.55 93.92 76.45
Selvaraj et al. BioMedical Engineering OnLine 2013, 12:44 Page 15 of 18http://www.biomedical-engineering-online.com/content/12/1/44
76.45% in random and subject independent validations respectively compared to previ-
ous research works on classifying six emotions in a user independent way.
The tables also indicate that the higher results were obtained for the FKNN classifier
which works on membership functions assigned to the different test features. KNN and
regression tree classifiers also performed better with almost similar results. The
Bayesian classifier did not perform well in almost all the classes indicating that the
independent probabilistic assumptions made by the classifier did not suit the classifica-
tion of emotional states.
By trying to utilize the advantage of HOS in retaining minute information of the sig-
nal, we can observe that a maximum average accuracy of 92.87% is obtained for classi-
fying six emotional states in using random validation. The classifiers also performed
better than the existing methods with a maximum average accuracy of 76.45% when
validated in a subject independent way. Though the value of Hurst was similar to the
traditionally obtained results, HOS based methods were able to capture emotional vari-
ation in the ECG signals compared to the traditional analysis. Furthermore ECG signals
being complex, non-linear and non-stationary, non-linear analysis would pave a better
way to capture minute and infinitesimal changes that are prone to occur during emo-
tional changes.
Real time emotion recognition
Emotions that are expressed in a controlled laboratory environment may not be similar
to how they are expressed in the natural world [4]. Also the intensity of emotions and
changes in physiological signals associated with emotions varies from person to person.
The age and gender of a person also play a role in the emotions experienced [29]. K. H.
Kim et al., worked on children with ages ranging from five to eight years to classify
three and four emotional states [28]. Furthermore emotions also depend on the culture.
Our pilot study showed that most of the subjects hardly felt angry, which is common
in this region.
Emotions are transient and they occur only for a small instant of time though they
influence the way we process information through attentional or perceptual biases [52].
Though the emotion felt is not really visible, the consequences or action lead by the
emotion is visible.
A real time system should be able to tackle the subjective dependency of emotions
and also track the transient changes in emotional levels of the physiological signal. This
would require a more generalized and authentic system with robust and reliable signal
processing algorithms that could be fast enough in deciphering the short-lived
Selvaraj et al. BioMedical Engineering OnLine 2013, 12:44 Page 16 of 18http://www.biomedical-engineering-online.com/content/12/1/44
emotional state of the subject. The robust algorithm should also be simple enough to
be computed in real time.
Furthermore, analysis needs to be done with data from different age groups, ethnici-
ties and backgrounds. Experiments need to be carried out by using the different modal-
ities of emotion recognition and the variations among the modalities need to be
studied. The intensity of emotion experienced by the subject should be considered
when analyzing the data. An extensive data collection considering all the issues and de-
veloping a robust algorithm would help in developing a reliable real-time system.
Limitations of the study
Emotions are also dependant on a number of variables such as room temperature, time
of day, circadian rhythm, position, activity level of the subject before recording, medica-
tion, hormone levels, verbalization and breathing condition. Though much care was
taken to eliminate these issues by allowing the subject to choose their own free time
for participating in the experiment and relax by means of some breathing exercise be-
fore the start of the experiment, more care should be taken to consider these differ-
ences as well when developing a real time emotion recognition system. The impact of
these differences on the emotional state of the person also needs to be studied.
ConclusionsThis study indicates that ECG signals are reliable in identifying the true emotional state
of a person. The design of data acquisition protocol for eliciting the six emotional states
(happiness, sadness, fear, surprise, disgust and neutral) and the data acquisition meth-
odology are explained in detail. Two new methods to compute the non-linear feature
Hurst by combining the normalized HOS parameters and the traditional Hurst compu-
tation methods are proposed. The performances of the different features were analyzed
using four classifiers namely regression tree, naive bayes, k-nearest neighbor (KNN)
and fuzzy k-nearest neighbor (FKNN). The Hurst computed using FVS and HOS yields
better results of 92.87% and 76.45% for random and subject independent validation re-
spectively using FKNN classifier. Computing Hurst by combining HOS with traditional
methods retains the advantage of both HOS and non linear method, enabling to iden-
tify the minute emotional changes that occur in any healthy ECG data. This algorithm
can be studied further by trying to combine HOS with other non linear features. Also,
an extensive data analysis is required towards the development of a real trime and
robust emotion recognition system.
AbbreviationsANS: Autonomous nervous system; ECG: Electrocardiogram; HRV: Heart rate variability; EEG: Electroencephalogram;EMG: Electromyogram; GSR: Galvanic skin response; BVP: Blood volume pressure; ST: Skin Temperature;ANOVA: Analysis of variance; FVS: Finite variance scaling; RRS: Rescaled range statistics; HOS: Higher order statistics;APEN: Approximate entropy; LLE: Largest lyapunov exponent; CD: Correlation dimension; H: Hurst exponent;WT: Wavelet transform; EMD: Empirical mode decomposition; KNN: K nearest neighbor; FKNN: Fuzzy K nearestneighbor; AMA: American medical association.
Competing interestsThe authors declare that they have no competing interests.
Authors’ contributionsJS carried out the data acquisition and analysis, participated in the sequence alignment and drafted the manuscript.MM conceived of the study, and participated in its design and coordination and helped to draft the manuscript . KWand SY participated in the design of the study and data analysis methods. All authors read and approved the finalmanuscript.

Selvaraj et al. BioMedical Engineering OnLine 2013, 12:44 Page 17 of 18http://www.biomedical-engineering-online.com/content/12/1/44
AcknowledgementsThis research is supported by the Fundamental Research Grant Scheme (FRGS), Ministry of Higher Education (MOHE),Malaysia. Grant number: 9003–00341 and Ministry of Science, Technology and Innovation (MOSTI), Malaysia. Grantnumber: 9005-00053.We are thankful to the members of ‘Intelligent Signal Processing’ and ‘Automav’ research cluster who participated inthe pilot study. We also thank the volunteers, friends, teachers and parents who participated and helped in gettingsubjects for data collection.
Received: 12 December 2012 Accepted: 13 May 2013Published: 16 May 2013
References
1. Fred A, Filipe J, Gamboa H, Kim J, André E: Four-Channel Biosignal Analysis and Feature Extraction forAutomatic Emotion Recognition. In Biomedical Engineering Systems and Technologies. Volume 25. Berlin: SpringerBerlin Heidelberg; 2009:265–277. Communications in Computer and Information Science.
2. Jonghwa K, Ande E: Emotion Recognition Based on Physiological Changes in Music Listening. Pattern Anal.Mach. Intell., IEEE Transact 2008 2008, 30:2067–2083.
3. Cong Z, Chetouani M: Hilbert-Huang transform based physiological signals analysis for emotion recognition.In IEEE International Symposium on Signal Processing and Information Technology (ISSPIT). Ajaman, UAE: IEEE;2009:14–17. Dec. 2009. 2009: 334–339.
4. Picard RW, Vyzas E, Healey J: Toward machine emotional intelligence: analysis of affective physiological state.IEEE Trans Pattern Anal Machine Intel 2001, 23:1175–1191.
5. Bal E, Harden E, Lamb D, Van Hecke A, Denver J, Porges S: Emotion Recognition in Children withAutism Spectrum Disorders: Relations to Eye Gaze and Autonomic State. J Autism Dev Disord 2010,40:358–370.
6. Demazeau Y, Dignum F, Corchado J, Bajo J, Corchuelo R, Corchado E, Fernández-Riverola F, Julián V, Pawlewski P,Campbell A, et al: Emotion Elicitation Oriented to the Development of a Human Emotion ManagementSystem for People with Intellectual Disabilities. In Trends in Practical Applications of Agents and MultiagentSystems. Volume 71. Springer, Berlin, Heidelberg: Springer Berlin/Heidelberg:689–696. Advances in Soft Computing.
7. Ekman P, Friesen WV: Universals and Cultural Differences in the Judgments of Facial Expressions of Emotion.J Pers Soc Psychol 1987, 53:712–714.
8. Lang PJ: The Emotion Probe: Studies of Motivation and Attention. Am Psychol 1995, 50:372–385.9. Bailenson JN, Pontikakis ED, Mauss IB, Gross JJ, Jabon ME, Hutcherson CAC, Nass C, John O: Real-time
classification of evoked emotions using facial feature tracking and physiological responses. Int J Human-Computer Studies 2008, 66:303–317.
10. Kessous L, Castellano G, Caridakis G: Multimodal emotion recognition in speech-based interaction using facialexpression, body gesture and acoustic analysis. J Multimodal User Interfaces 2009, 3:33–48.
11. Kim J: Bimodal Emotion Recognition using Speech and Physiological Changes. In Robust Speech Recognitionand Understanding. Edited by Kristian K. Rijeka, Croatia: ITech Education and Publishing; 2007.
12. Rani P, Sarkar N: A New Approach to Implicit Human-Robot Interaction Using Affective Cues. In Mobile Robots:towards New Applications. Edited by Aleksandar L. I-Tech Education and Publishing; 2006.
13. Risk MR, Bruno JS, Llamedo Soria M, Arini PD, Taborda RAM: Measurement of QT interval and duration of theQRS complex at different ECG sampling rates. In Computers in Cardiology..
14. Rattanyu K, Mizukawa M, Jacko J: Emotion Recognition Using Biological Signal in Intelligent Space. Human-ComInt 2011, 6763:586–592.
15. Maaoui C, Pruski A: Book Emotion Recognition through Physiological Signals for Human-MachineCommunication. In Book Emotion Recognition through Physiological Signals for Human-Machine Communication.2010. (Editor ed.^eds.). City.
16. Natarajan K, RA U, Alias F, Tiboleng T, Puthusserypady SK: Nonlinear analysis of EEG signals at different mentalstates. BioMed Eng Online 2004, 3(1):7.
17. Melillo P, Bracale M, Pecchia L: Nonlinear Heart Rate Variability features for real-life stress detection. Casestudy: students under stress due to university examination. BioMed Eng Online 2011, 10(1):2011.
18. Desok K, Seo Y, Jaegeol C, Chul-Ho C: Detection of subjects with higher self-reporting stress scores using heartrate variability patterns during the day. In 30th Annual International Conference of the IEEE Engineering inMedicine and Biology Society. Vancouver BC Canada: EMBS 2008; 2008:682–685. 20–25 Aug. 2008.
19. Gao J, Hu J, Tung W-w: Facilitating Joint Chaos and Fractal Analysis of Biosignals through Nonlinear AdaptiveFiltering. San Francisco, CA: Plos one; 2011:6.
20. Acharya UR, Chua EC-P, Faust O, Lim T-C, Lim LFB: Automated detection of sleep apnea fromelectrocardiogram signals using nonlinear parameters. Physiol Meas 2011, 32:287–303.
21. Balli T, Palaniappan R: Classification of biological signals using linear and nonlinear features. Physiol Meas 2010,31:903–920.
22. Das C, Khondekar MH: Statistical Investigation of ECG Signal of Sleep Apnea Patient. Cambridge: Global Journal ofResearches in Engineering Global Journals Inc. (USA); 2011.
23. Costa T, Galati D, Rognoni E: The Hurst exponent of cardiac response to positive and negative emotional filmstimuli using wavelet. Auton Neurosci 2009, 151:183–185.
24. Panoulas KI, Hadjileontiadis LJ, Panas SM: Enhancement of R-wave detection in ECG data analysis usinghigher-order statistics. In Engineering in Medicine and Biology Society, 2001 Proceedings of the 23rd AnnualInternational Conference of the IEEE; 2001; 2001:344–347. vol.341.
25. CK C, Acharya R, LC M: Higher Order Spectral (HOS) Analysis Of Epileptic EEG Signals. In 2007 Proceedings of the 29thAnnual International Conference of the IEEE. Lyon, France: Engineering in Medicine and Biology Society;2007:6495–6498.

Selvaraj et al. BioMedical Engineering OnLine 2013, 12:44 Page 18 of 18http://www.biomedical-engineering-online.com/content/12/1/44
26. Hosseini SA: Classification of Brain Activity in Emotional States Using HOS Analysis. Int J Image Graphics SignalProc 2012, 4:21–27.
27. Istepanian RSH, Hadjileontiadis LJ, Panas SM: ECG data compression using wavelets and higher order statisticsmethods. Info Technol Biomed IEEE Trans 2001, 5:108–115.
28. Kim K, Bang S, Kim S: Emotion recognition system using short-term monitoring of physiological signals.Med Biol Eng Comput 2004, 42:419–427.
29. Nater UM, Abbruzzese E, Krebs M, Ehlert U: Sex differences in emotional and psychophysiological responses tomusical stimuli. Int J Psychophysiol 2006, 62:300–308.
30. Chanel G, Kierkels JJM, Soleymani M, Pun T: Short-term emotion assessment in a recall paradigm. Int J Human-Computer Studies 2009, 67:607–627.
31. Roberts N, Coan JTJ, Roberts N, Coan JTJ: Emotion Elicitation Using Dyadic Interaction Tasks. In The Handbookof Emotion Elicitation and Assessment. Edited by Coan JA, Allen JJB. New York, NY: Oxford University Press; 2005.Affective Science.
32. Gross JJ, Levenson RW: Emotion Elicitation using Films. Cogn Emot 1995, 9:87–108.33. Chen LS, Huang TS, Miyasato T, Nakatsu R: Multimodal human emotion/expression recognition. In Automatic
Face and Gesture Recognition, 1998 Proceedings Third IEEE International Conference on; 14–16 Apr 1998;1998:366–371.
34. Bunluechokchai C, Leeudomwong T: Discrete Wavelet Transform -based Baseline Wandering Removal for HighResolution Electrocardiogram. Int J Applied Biomed Eng 2010, 3:26–31.
35. Wan-Hui W, Yu-Hui Q, Guang-Yuan L: Electrocardiography Recording, Feature Extraction and Classification forEmotion Recognition. Los Angeles, CA: In Proceedings of 2009 WRI World Congress on Computer Science andInformation Engineering; 2009:168–172.
36. Tsolis G, Xenos TD: Signal Denoising Using Empirical Mode Decomposition and Higher Order Statistics. Int JSignal Proc Image Proc Pattern Recog 2011, 4:91–106.
37. Ferreira DD, Cerqueira AS, Duque CA, Ribeiro MV: HOS-based method for classification of power qualitydisturbances. Electron Lett 2009, 45:183–185.
38. Naik GR, Kumar DK: Evaluation of higher order statistics parameters for multi channel sEMG using differentforce levels. In Engineering in Medicine and Biology Society,EMBC, 2011 Annual International Conference of the IEEE;2011:3869–3872.
39. Gu WF, Venkatesh YV, Xiang C: A novel application of self-organizing network for facial expression recognitionfrom radial encoded contours. Soft Comput 2010, 14:113–122.
40. Jonghwa K, Ande E: Emotion Recognition Based on Physiological Changes in Music Listening. IEEE TransPattern Anal Machine Int 2008, 30:2067–2083.
41. Romero D, Ringborn M, Laguna P, Pahlm O, Pueyo E: Depolarization Changes During Acute MyocardialIschemia by Evaluation of QRS Slopes: Standard Lead and Vectorial Approach. IEEE Trans Biomed Eng 2011,58:110–120.
42. Lin C-H: Frequency-domain features for ECG beat discrimination using grey relational analysis-basedclassifier. Comput Math Appl 2008, 55:680–690.
43. Peng CK, Mietus J, Hausdorff JM, Havlin S, Stanley HE, Goldberger AL: Long-Range Anticorrelations and Non-Gaussian Behavior of the Heartbeat. Phys. Rev Lett 1993, 70:1343–1346.
44. Yum M-K, Kim J-T, Kim H-S: Increased non-stationarity of heart rate during general anaesthesia withsevoflurane or desflurane in children. Br J Anaesth 2008, 100:772–779.
45. Wen W-H, Qiu Y-H, Liu G-Y: Electrocardiography Recording, Feature Extraction and Classification for EmotionRecognition. In WRI World Congress on Computer Science and Information Engineering, 2009 March 31; 2009:168–172. 2009-April 2 2009.
46. Arroyo-Palacious J, Romano DM: Towards a Standardization in the Use of Physiological Signals for AffectiveRecognition Systems. Maastricht,The Netherlands: Measuring Behaviour; 2008:121–114.
47. Valenza G, Lanata A, Scilingo EP: The Role of Nonlinear Dynamics in Affective Valence and ArousalRecognition. Affect Computing IEEE Trans 2012, 3:237–249.
48. Zhe C, Brown EN, Barbieri R: Assessment of Autonomic Control and Respiratory Sinus Arrhythmia Using PointProcess Models of Human Heart Beat Dynamics. Biomed Eng IEEE Trans 2009, 56:1791–1802.
49. Zhe C, Brown EN, Barbieri R: Characterizing Nonlinear Heartbeat Dynamics Within a Point Process Framework.Biomed Eng IEEE Trans 2010, 57:1335–1347.
50. Barbieri R, Matten EC, Alabi AA, Brown EN: A point-process model of human heartbeat intervals: newdefinitions of heart rate and heart rate variability. Am J Physiol Heart Cir Physiol 2005, 288:H424.
51. Barbieri R, Brown EN: Analysis of heartbeat dynamics by point process adaptive filtering. Biomed Eng IEEE Trans2006, 53:4–12.
52. Eryilmaz H, Van De Ville D, Schwartz S, Vuilleumier P: Impact of transient emotions on functional connectivityduring subsequent resting state: A wavelet correlation approach. Neuroimage 2011, 54:2481–2491.
doi:10.1186/1475-925X-12-44Cite this article as: Selvaraj et al.: Classification of emotional states from electrocardiogram signals: a non-linearapproach based on hurst. BioMedical Engineering OnLine 2013 12:44.