biologi kertas 3 peraturan pemarkahan (pp) untuk...
TRANSCRIPT

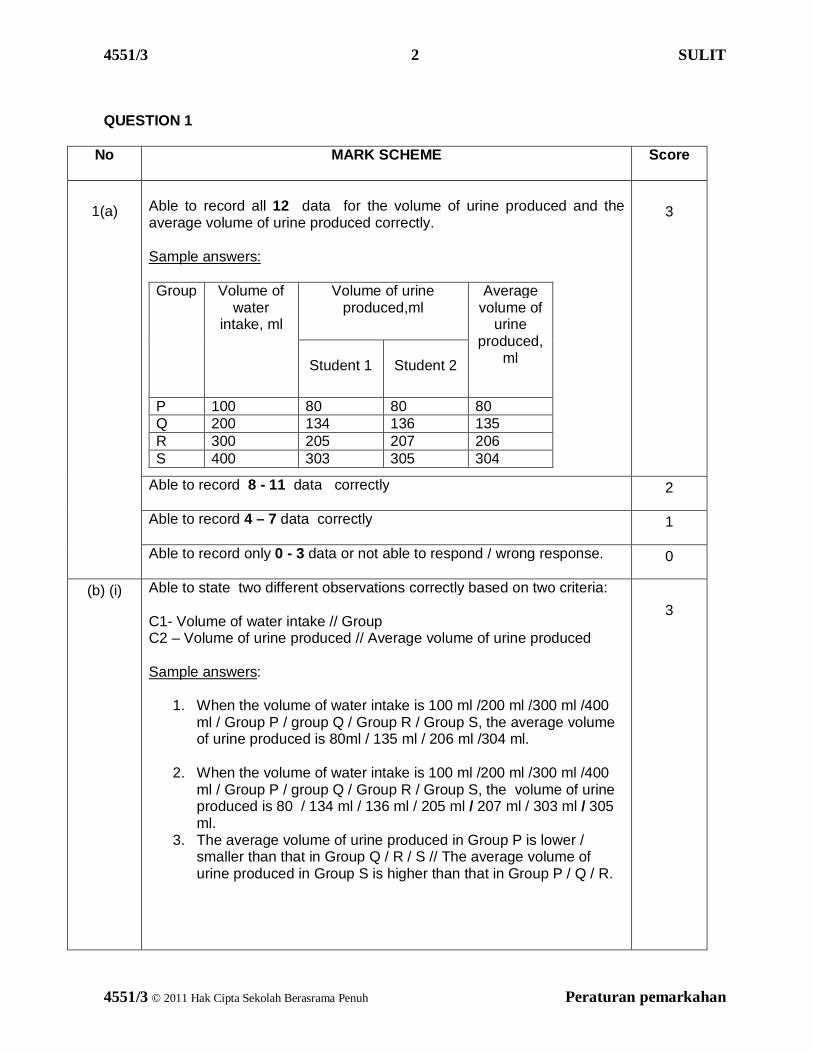
4551/3 1 SULIT
4551/3 © 2011 Hak Cipta Sekolah Berasrama Penuh Peraturan pemarkahan
SULIT 4551/3 BIOLOGI Kertas 3 Peraturan Pemarkahan Ogos 2011 1½ jam
BAHAGAN PENGURUSAN
SEKOLAH BERASRAMA PENUH DAN SEKOLAH KECEMERLANGAN KEMENTERIAN PELAJARAN MALAYSIA
PEPERIKSAAN PERCUBAAN SPM SETARA 2011
BIOLOGI Kertas 3
PERATURAN PEMARKAHAN (PP)
Untuk kegunaan pemeriksa sahaja
__________________________________________________________________________ Peraturan pemarkahan ini mengandungi 15 halaman bercetak.
4551/3 2 SULIT
4551/3 © 2011 Hak Cipta Sekolah Berasrama Penuh Peraturan pemarkahan
QUESTION 1
No MARK SCHEME
Score
1(a)
Able to record all 12 data for the volume of urine produced and the average volume of urine produced correctly. Sample answers: Group
Volume of water
intake, ml
Volume of urine produced,ml
Average volume of
urine produced,
ml
Student 1
Student 2
P 100 80 80 80 Q 200 134 136 135 R 300 205 207 206 S 400 303 305 304
3
Able to record 8 - 11 data correctly
2
Able to record 4 – 7 data correctly
1
Able to record only 0 - 3 data or not able to respond / wrong response.
0
(b) (i)
Able to state two different observations correctly based on two criteria: C1- Volume of water intake // Group C2 – Volume of urine produced // Average volume of urine produced Sample answers:
1. When the volume of water intake is 100 ml /200 ml /300 ml /400 ml / Group P / group Q / Group R / Group S, the average volume of urine produced is 80ml / 135 ml / 206 ml /304 ml.
2. When the volume of water intake is 100 ml /200 ml /300 ml /400 ml / Group P / group Q / Group R / Group S, the volume of urine produced is 80 / 134 ml / 136 ml / 205 ml / 207 ml / 303 ml / 305 ml.
3. The average volume of urine produced in Group P is lower / smaller than that in Group Q / R / S // The average volume of urine produced in Group S is higher than that in Group P / Q / R.
3
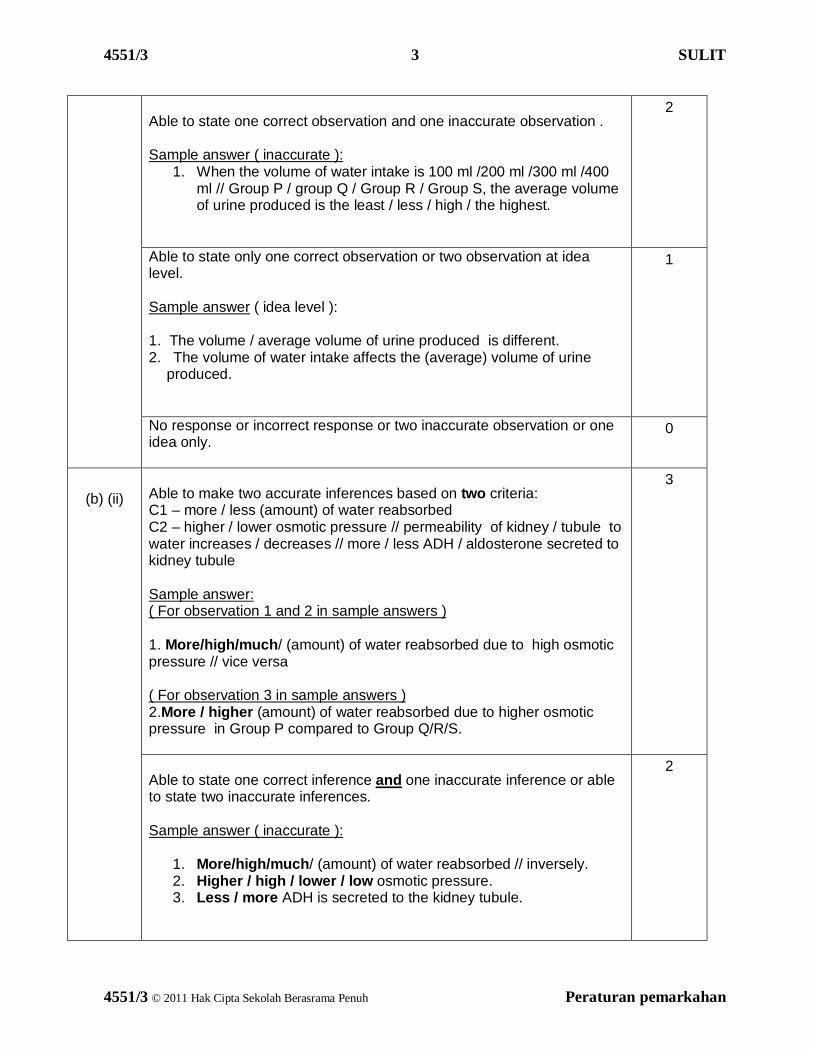
4551/3 3 SULIT
4551/3 © 2011 Hak Cipta Sekolah Berasrama Penuh Peraturan pemarkahan
Able to state one correct observation and one inaccurate observation . Sample answer ( inaccurate ):
1. When the volume of water intake is 100 ml /200 ml /300 ml /400 ml // Group P / group Q / Group R / Group S, the average volume of urine produced is the least / less / high / the highest.
2
Able to state only one correct observation or two observation at idea level. Sample answer ( idea level ): 1. The volume / average volume of urine produced is different. 2. The volume of water intake affects the (average) volume of urine
produced.
1
No response or incorrect response or two inaccurate observation or one idea only.
0
(b) (ii)
Able to make two accurate inferences based on two criteria: C1 – more / less (amount) of water reabsorbed C2 – higher / lower osmotic pressure // permeability of kidney / tubule to water increases / decreases // more / less ADH / aldosterone secreted to kidney tubule Sample answer: ( For observation 1 and 2 in sample answers ) 1. More/high/much/ (amount) of water reabsorbed due to high osmotic pressure // vice versa ( For observation 3 in sample answers ) 2.More / higher (amount) of water reabsorbed due to higher osmotic pressure in Group P compared to Group Q/R/S.
3
Able to state one correct inference and one inaccurate inference or able to state two inaccurate inferences. Sample answer ( inaccurate ):
1. More/high/much/ (amount) of water reabsorbed // inversely. 2. Higher / high / lower / low osmotic pressure. 3. Less / more ADH is secreted to the kidney tubule.
2
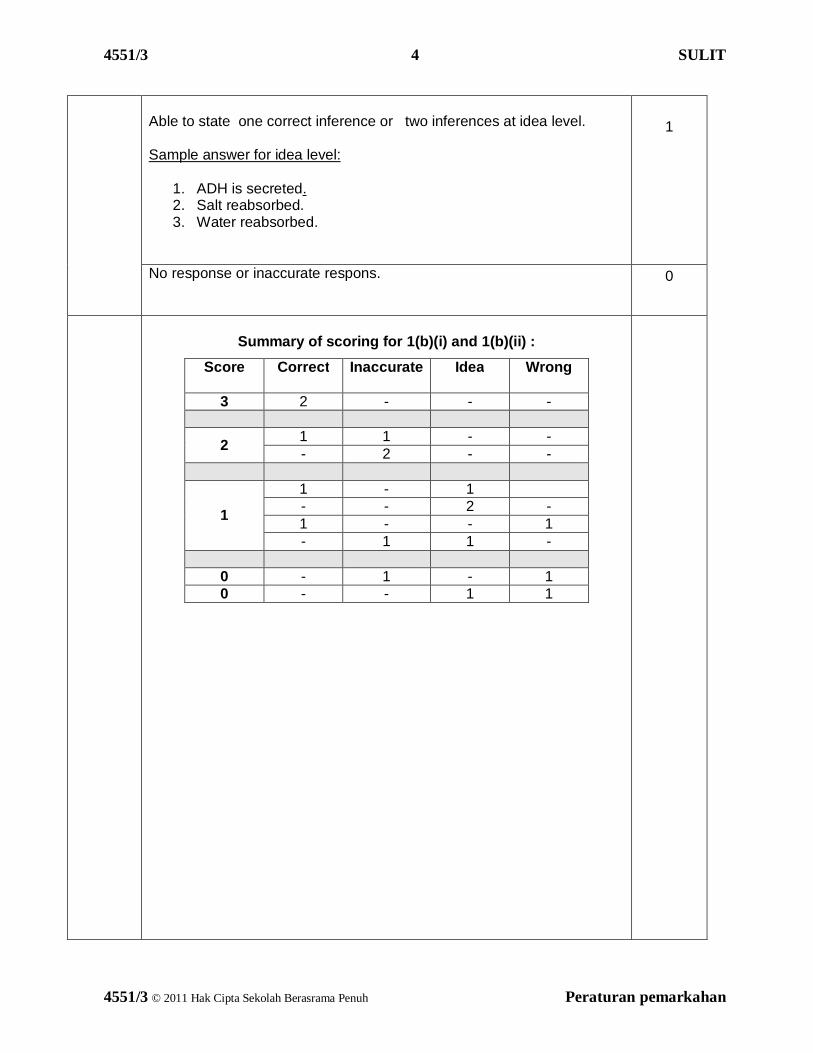
4551/3 4 SULIT
4551/3 © 2011 Hak Cipta Sekolah Berasrama Penuh Peraturan pemarkahan
Able to state one correct inference or two inferences at idea level. Sample answer for idea level:
1. ADH is secreted. 2. Salt reabsorbed. 3. Water reabsorbed.
1
No response or inaccurate respons.
0
Summary of scoring for 1(b)(i) and 1(b)(ii) :
Score Correct Inaccurate Idea Wrong
3 2 - - -
2 1 1 - - - 2 - -
1
1 - 1 - - 2 - 1 - - 1 - 1 1 -
0 - 1 - 1 0 - - 1 1
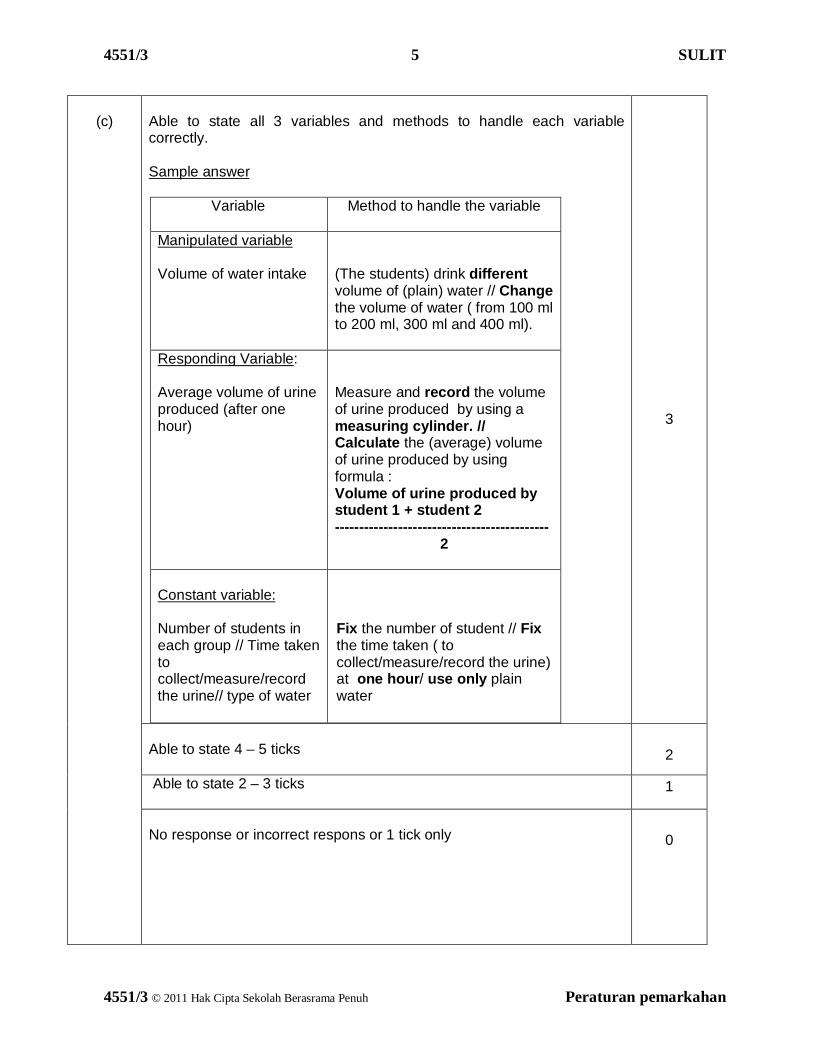
4551/3 5 SULIT
4551/3 © 2011 Hak Cipta Sekolah Berasrama Penuh Peraturan pemarkahan
(c)
Able to state all 3 variables and methods to handle each variable correctly. Sample answer
Variable Method to handle the variable
Manipulated variable Volume of water intake
(The students) drink different volume of (plain) water // Change the volume of water ( from 100 ml to 200 ml, 300 ml and 400 ml).
Responding Variable: Average volume of urine produced (after one hour)
Measure and record the volume of urine produced by using a measuring cylinder. // Calculate the (average) volume of urine produced by using formula : Volume of urine produced by student 1 + student 2 --------------------------------------------
2
Constant variable: Number of students in each group // Time taken to collect/measure/record the urine// type of water
Fix the number of student // Fix the time taken ( to collect/measure/record the urine) at one hour/ use only plain water
3
Able to state 4 – 5 ticks
2
Able to state 2 – 3 ticks
1
No response or incorrect respons or 1 tick only
0

4551/3 6 SULIT
4551/3 © 2011 Hak Cipta Sekolah Berasrama Penuh Peraturan pemarkahan
(d)
Able to state the hypothesis relating the manipulated variable and the responding variable correctly based on three criteria: P1 : manipulated variable ( Volume of water intake ) P2 : responding variable ( Volume of urine produced) H : relationship Sample answer P1 + P2 + H
1. As the volume of water intake increases, the volume of urine produced increase // vice versa.
3
Able to state a hypothesis based on any two criteria. Sample answer : P1 + P2 // P1/P2 + H
1. The volume of urine produced depends on the volume of water intake.
2. Different group of students has different volume of urine produced.
2
Able to state a hypothesis based on any one criterion or at idea level. Sample answer
1. Volume of urine produced is different.
1
No response or incorrect respons
0
Any two correct aspect 2
Any one aspect correct 1
No response or incorrect respons
0
4551/3 7 SULIT
4551/3 © 2011 Hak Cipta Sekolah Berasrama Penuh Peraturan pemarkahan
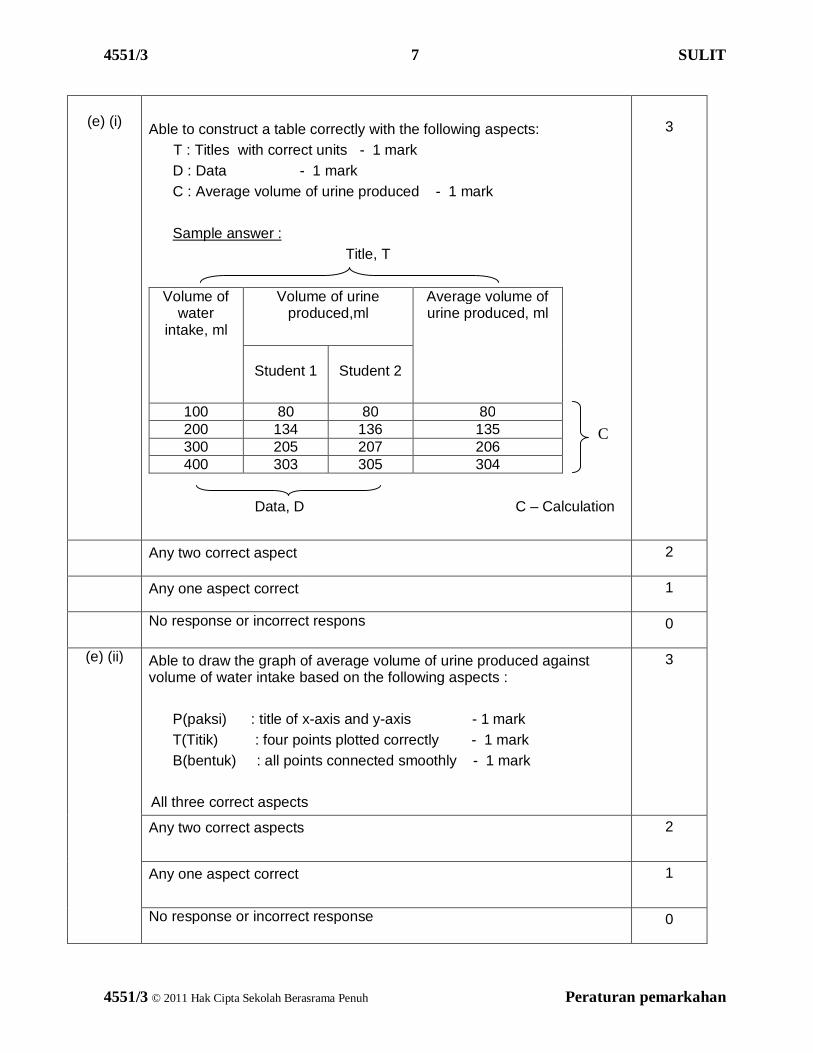
(e) (i)
Able to construct a table correctly with the following aspects: T : Titles with correct units - 1 mark
D : Data - 1 mark C : Average volume of urine produced - 1 mark Sample answer :
Title, T
Volume of water
intake, ml
Volume of urine produced,ml
Average volume of urine produced, ml
Student 1
Student 2
100 80 80 80 200 134 136 135 300 205 207 206 400 303 305 304
Data, D C – Calculation
3
Any two correct aspect 2
Any one aspect correct 1
No response or incorrect respons
0
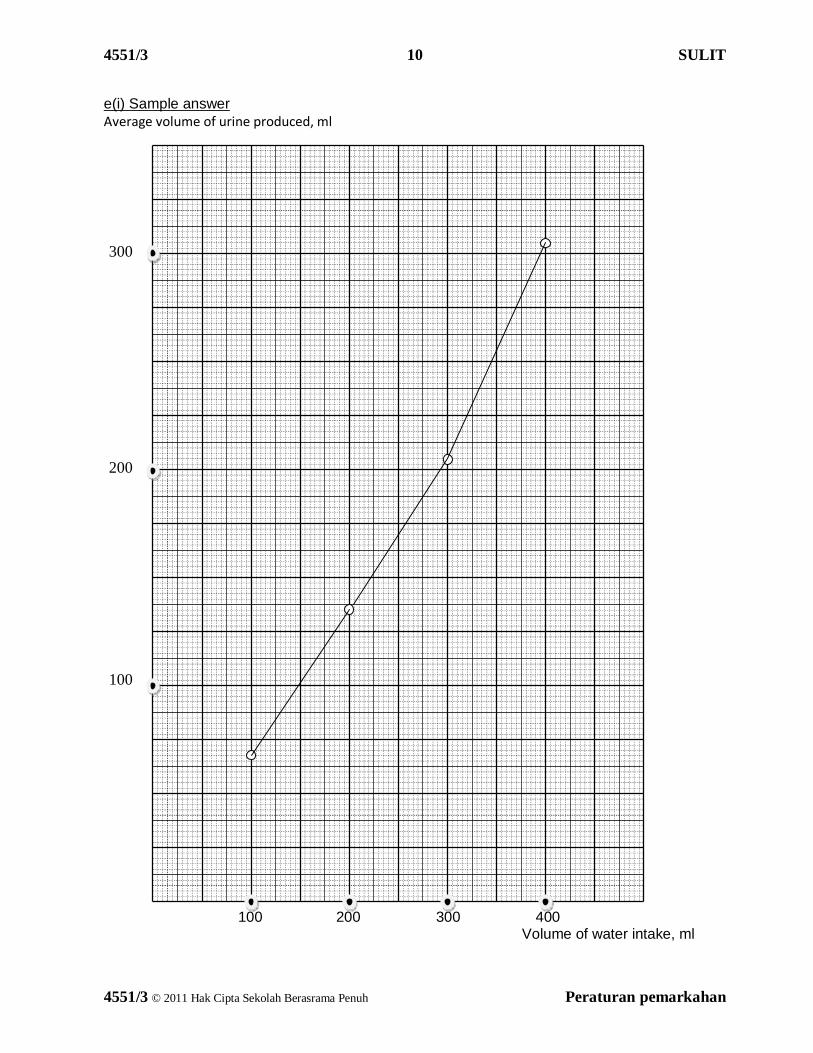
(e) (ii)
Able to draw the graph of average volume of urine produced against volume of water intake based on the following aspects :
P(paksi) : title of x-axis and y-axis - 1 mark T(Titik) : four points plotted correctly - 1 mark B(bentuk) : all points connected smoothly - 1 mark
All three correct aspects
3
Any two correct aspects
2
Any one aspect correct
1
No response or incorrect response
0
C
4551/3 8 SULIT
4551/3 © 2011 Hak Cipta Sekolah Berasrama Penuh Peraturan pemarkahan
(f)
Able to explain the relationship between the volume of water intake to the volume of urine produced based on the following criteria. R1 : Relationship – The higher the volume of water intake, the higher the ( average ) volume of urine produced R2 : Osmotic pressure decreases R3 : Less water reabsorbed (from the kidney) // less ADH is produced // Kidney tubules become less permeable to water Sample answer : The higher the volume of water intake, the higher the ( average ) volume of urine produced because the osmotic pressure decreases. Thus, less water reabsorbed from the kidney.
3
Able to explain the relationship using any two aspects.
2
Able to explain the relationship using one aspect only.
1
No response or incorrect respons
0
(g)
Able to predict and explain the volume of urine produced based on the following criteria: P1 : Prediction – volume of urine less than 80 ml // any value less than
80 ml P2 : Explanation - Osmotic pressure of increases P3 : More water reabsorbed (from the kidney) Sample answer Volume of urine in less than 80 ml // 75 ml Because the osmotic pressure increases, so more water reabsorbed (from the kidney)
3
Able to predict and explain the volume of urine produced based on any two criteria:
2
Able to predict and explain the volume of urine produced based on any one criterion:
1
No response or incorrect response
0
4551/3 9 SULIT
4551/3 © 2011 Hak Cipta Sekolah Berasrama Penuh Peraturan pemarkahan
(h)
Able to define osmoregulation operationally based on the following criteria. D1 : A process that causes D2 : (Average) volume of urine produced by the students / group A,B,C and D after one hour D3 : after taking different volume of water // depends on the volume of water intake // the higher the volume of water intake, the higher the volume of urine produced. Sample answer : Osmoregulation is the process that causes the (average) volume of urine produced by the students / group P,Q,R and S after one hour. The average volume of urine produced depends on the volume of water intake.
3
Any two criteria stated 2
Any one criteria stated 1
No response or incorrect response 0
(i)
Able to classify apparatus and materials into their respective variables. Sample answer : Manipulated
Variable
Responding Variables
Fixed Variable
Apparatus / Materials
cup Beaker // Measuring cylinder
Measuring cylinder // beaker
stopwatch students mineral water
. All 6 corrects
3
1 – 2 wrongs 2
3 – 4 wrongs 1
5 – 6 wrongs or no response 0
4551/3 10 SULIT
4551/3 © 2011 Hak Cipta Sekolah Berasrama Penuh Peraturan pemarkahan
e(i) Sample answer Average volume of urine produced, ml
100 200 300 400
Volume of water intake, ml
300
200
100
4551/3 11 SULIT
4551/3 © 2011 Hak Cipta Sekolah Berasrama Penuh Peraturan pemarkahan
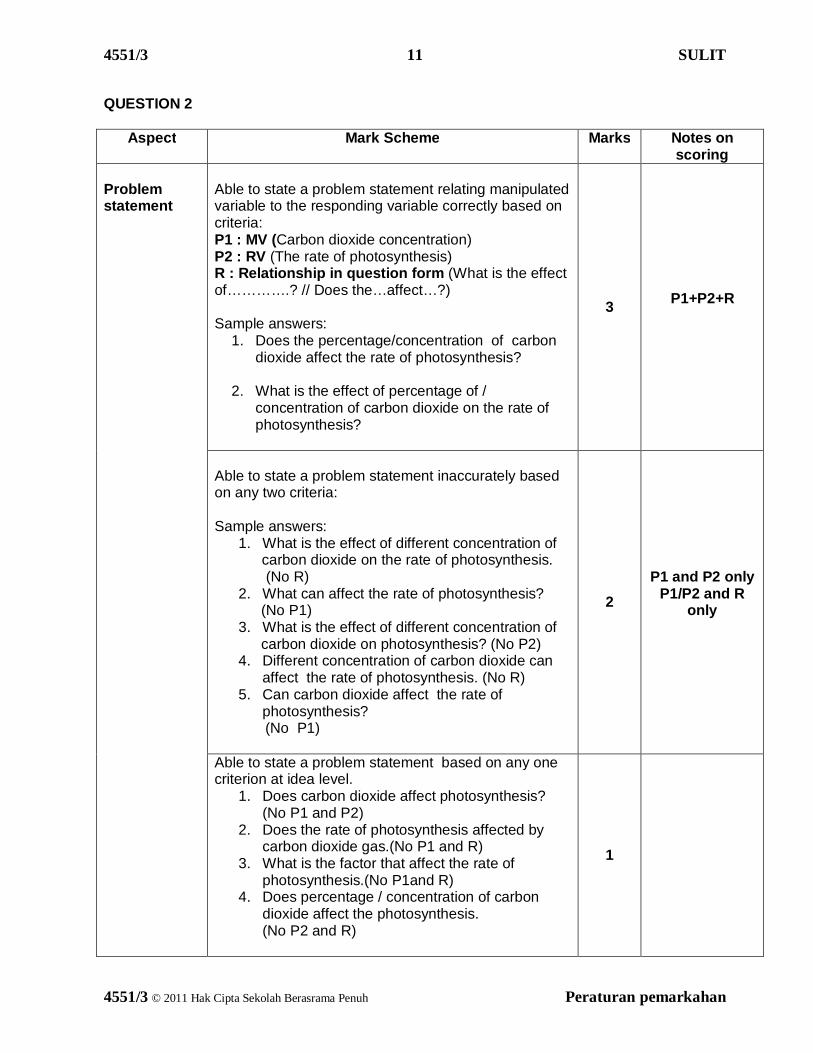
QUESTION 2
Aspect
Mark Scheme Marks Notes on scoring
Problem statement
Able to state a problem statement relating manipulated variable to the responding variable correctly based on criteria: P1 : MV (Carbon dioxide concentration) P2 : RV (The rate of photosynthesis) R : Relationship in question form (What is the effect of………….? // Does the…affect…?) Sample answers:
1. Does the percentage/concentration of carbon dioxide affect the rate of photosynthesis?
2. What is the effect of percentage of /
concentration of carbon dioxide on the rate of photosynthesis?
3 P1+P2+R
Able to state a problem statement inaccurately based on any two criteria: Sample answers:
1. What is the effect of different concentration of carbon dioxide on the rate of photosynthesis. (No R) 2. What can affect the rate of photosynthesis?
(No P1) 3. What is the effect of different concentration of
carbon dioxide on photosynthesis? (No P2) 4. Different concentration of carbon dioxide can
affect the rate of photosynthesis. (No R) 5. Can carbon dioxide affect the rate of
photosynthesis? (No P1)
2
P1 and P2 only P1/P2 and R
only
Able to state a problem statement based on any one criterion at idea level.
1. Does carbon dioxide affect photosynthesis? (No P1 and P2)
2. Does the rate of photosynthesis affected by carbon dioxide gas.(No P1 and R)
3. What is the factor that affect the rate of photosynthesis.(No P1and R)
4. Does percentage / concentration of carbon dioxide affect the photosynthesis. (No P2 and R)
1
4551/3 12 SULIT
4551/3 © 2011 Hak Cipta Sekolah Berasrama Penuh Peraturan pemarkahan
No response/wrong response
0 mark
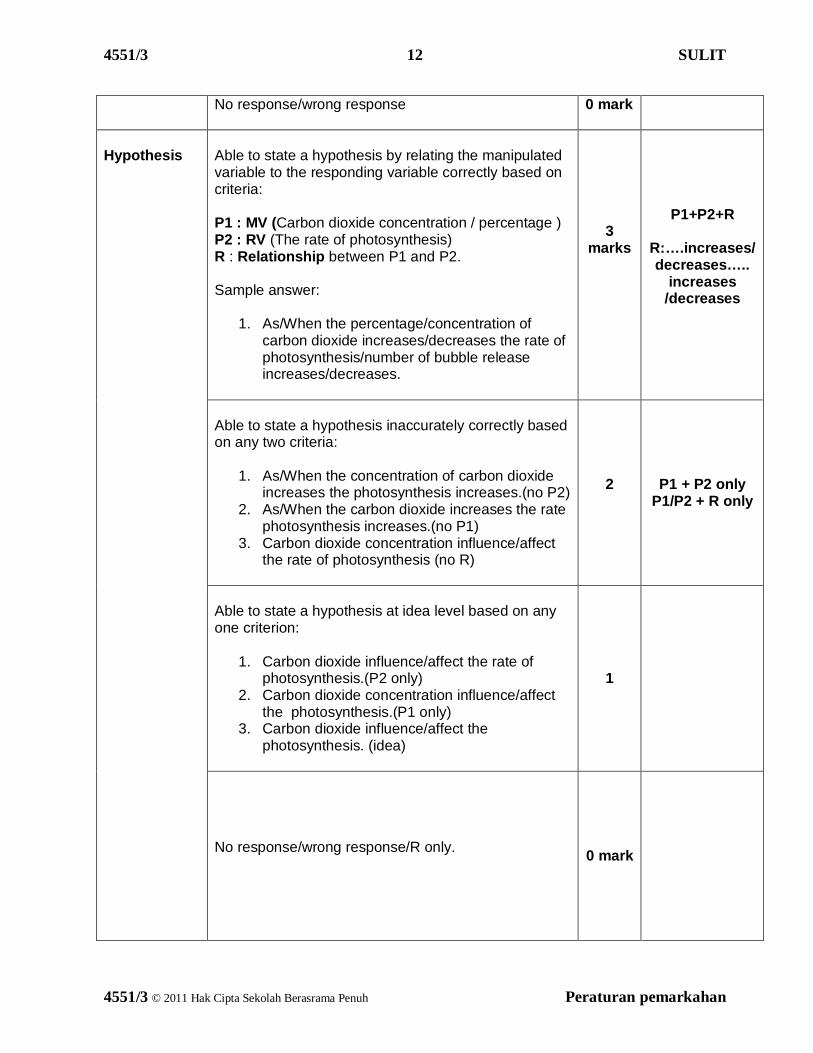
Hypothesis
Able to state a hypothesis by relating the manipulated variable to the responding variable correctly based on criteria: P1 : MV (Carbon dioxide concentration / percentage ) P2 : RV (The rate of photosynthesis) R : Relationship between P1 and P2. Sample answer:
1. As/When the percentage/concentration of carbon dioxide increases/decreases the rate of photosynthesis/number of bubble release increases/decreases.
3
marks
P1+P2+R
R:….increases/ decreases…..
increases /decreases
Able to state a hypothesis inaccurately correctly based on any two criteria:
1. As/When the concentration of carbon dioxide increases the photosynthesis increases.(no P2)
2. As/When the carbon dioxide increases the rate photosynthesis increases.(no P1)
3. Carbon dioxide concentration influence/affect the rate of photosynthesis (no R)
2
P1 + P2 only
P1/P2 + R only
Able to state a hypothesis at idea level based on any one criterion:
1. Carbon dioxide influence/affect the rate of photosynthesis.(P2 only)
2. Carbon dioxide concentration influence/affect the photosynthesis.(P1 only)
3. Carbon dioxide influence/affect the photosynthesis. (idea)
1
No response/wrong response/R only.
0 mark
4551/3 13 SULIT
4551/3 © 2011 Hak Cipta Sekolah Berasrama Penuh Peraturan pemarkahan
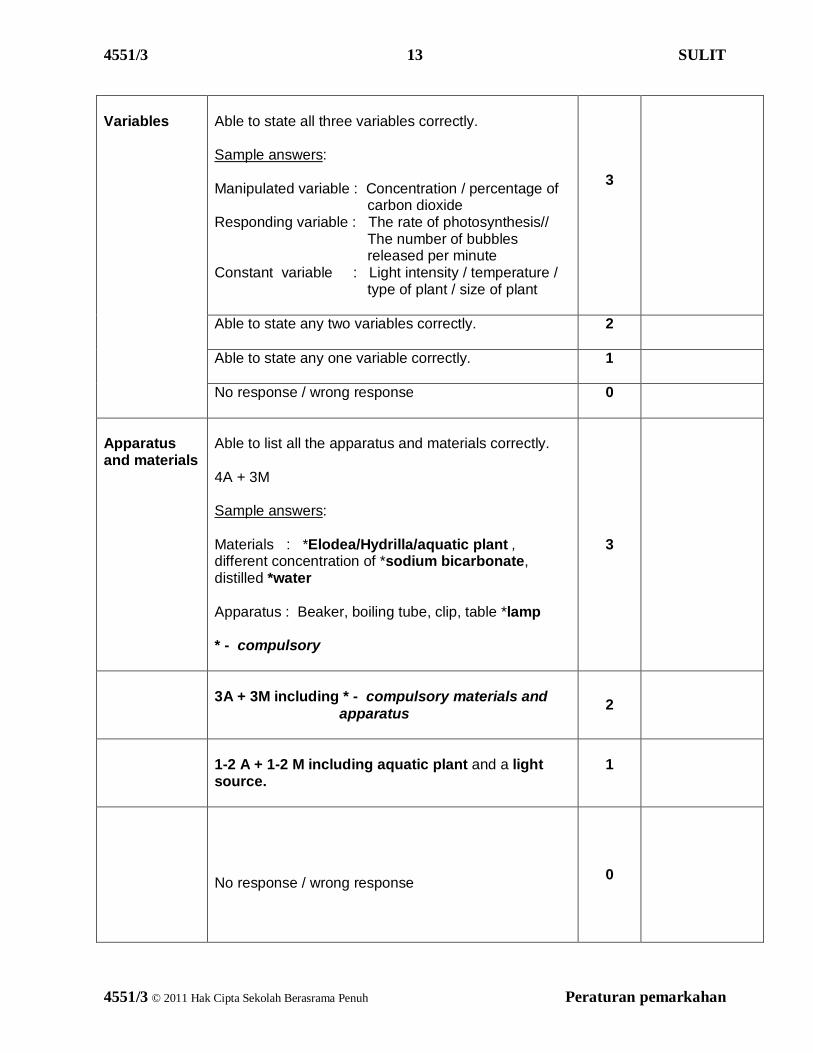
Variables
Able to state all three variables correctly. Sample answers: Manipulated variable : Concentration / percentage of
carbon dioxide Responding variable : The rate of photosynthesis//
The number of bubbles released per minute
Constant variable : Light intensity / temperature / type of plant / size of plant
3
Able to state any two variables correctly.
2
Able to state any one variable correctly.
1
No response / wrong response
0
Apparatus and materials
Able to list all the apparatus and materials correctly. 4A + 3M Sample answers: Materials : *Elodea/Hydrilla/aquatic plant , different concentration of *sodium bicarbonate, distilled *water Apparatus : Beaker, boiling tube, clip, table *lamp * - compulsory
3
3A + 3M including * - compulsory materials and
apparatus
2
1-2 A + 1-2 M including aquatic plant and a light source.
1
No response / wrong response
0

4551/3 14 SULIT
4551/3 © 2011 Hak Cipta Sekolah Berasrama Penuh Peraturan pemarkahan
Procedure
Able to describe the steps of the experiment procedure or method correctly based on the following criteria: K1 : How to set up the apparatus ( at least 3 steps) K2 : How to operate the the control variable ( Any one) K3 : How to operate the responding variable ( Any one ) K4: How to operate the manipulated variable ( Any one ) K5 : Precaution // steps to increase accuracy ( Any one ) K1- How to set up the apparatus
Diagram of apparatus and material set up with 5 correct labels.
Choose / Cut 7 cm length of fresh Elodea/Hydrilla
Clip the tip with a paper clip and put it in the boiling tube (with the clip down)
K2- How to operate the constant variable Pour 40 ml of 1% sodium bicarbonate solution
into the boiling tube. Place the apparatus at 20 cm(other suitable
example) distant from a light source K3 – How to operate the responding variable
Count and record the number of bubbles released in 5 minutes by using stopwatch.
Calculate the rate of photosynthesis using formula : number of bubbles released / time
K4 – How to operate the manipulated variable
Change the concentration of sodium bicarbonate solution to 2% sodium bicarbonate solution, 3% sodium bicarbonate solution, 4% sodium bicarbonate solution and 5% sodium bicarbonate solution. ( at least 4 different concentration )
K5 - Precaution
Place the boiling tube in a beaker of water /water bath at room temperature throughout the experiment
Give a time duration of five minutes for the plant to adjust to the new carbon dioxide concentration before taking the reading.
3
4551/3 15 SULIT
4551/3 © 2011 Hak Cipta Sekolah Berasrama Penuh Peraturan pemarkahan
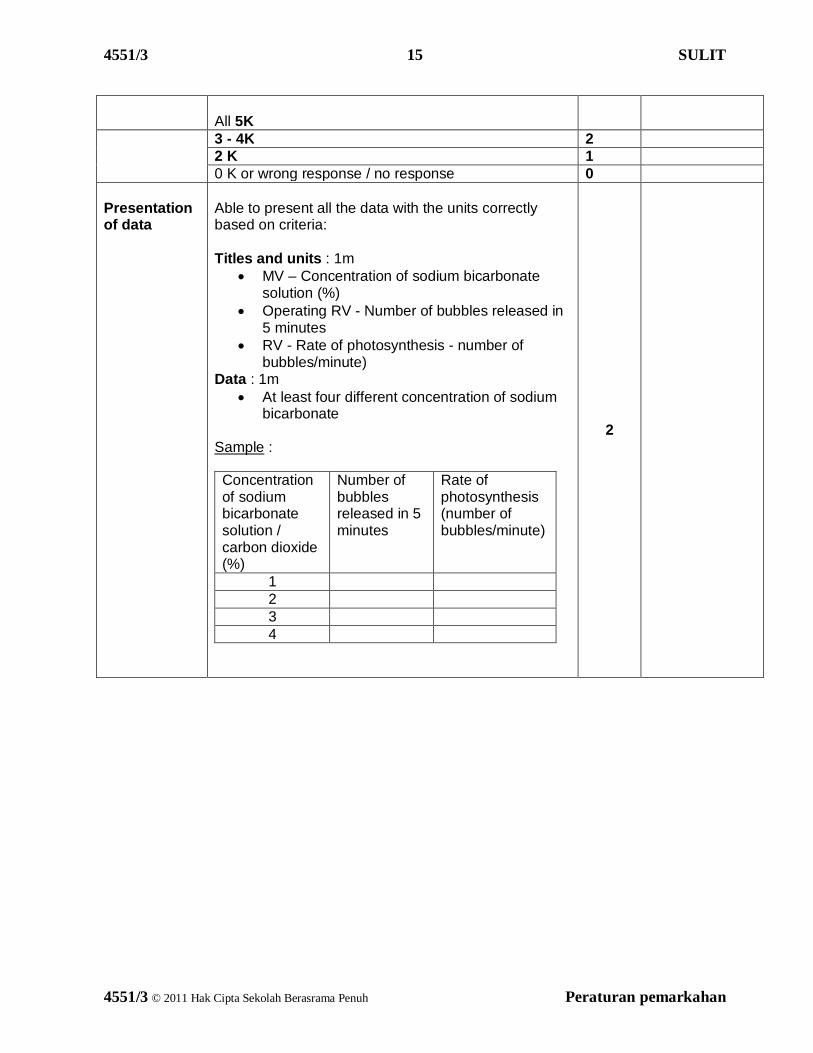
All 5K
3 - 4K 2 2 K 1 0 K or wrong response / no response 0
Presentation of data
Able to present all the data with the units correctly based on criteria: Titles and units : 1m
MV – Concentration of sodium bicarbonate solution (%)
Operating RV - Number of bubbles released in 5 minutes
RV - Rate of photosynthesis - number of bubbles/minute)
Data : 1m At least four different concentration of sodium
bicarbonate Sample : Concentration of sodium bicarbonate solution / carbon dioxide (%)
Number of bubbles released in 5 minutes
Rate of photosynthesis (number of bubbles/minute)
1 2 3 4
2
4551/3 16 SULIT
4551/3 © 2011 Hak Cipta Sekolah Berasrama Penuh Peraturan pemarkahan
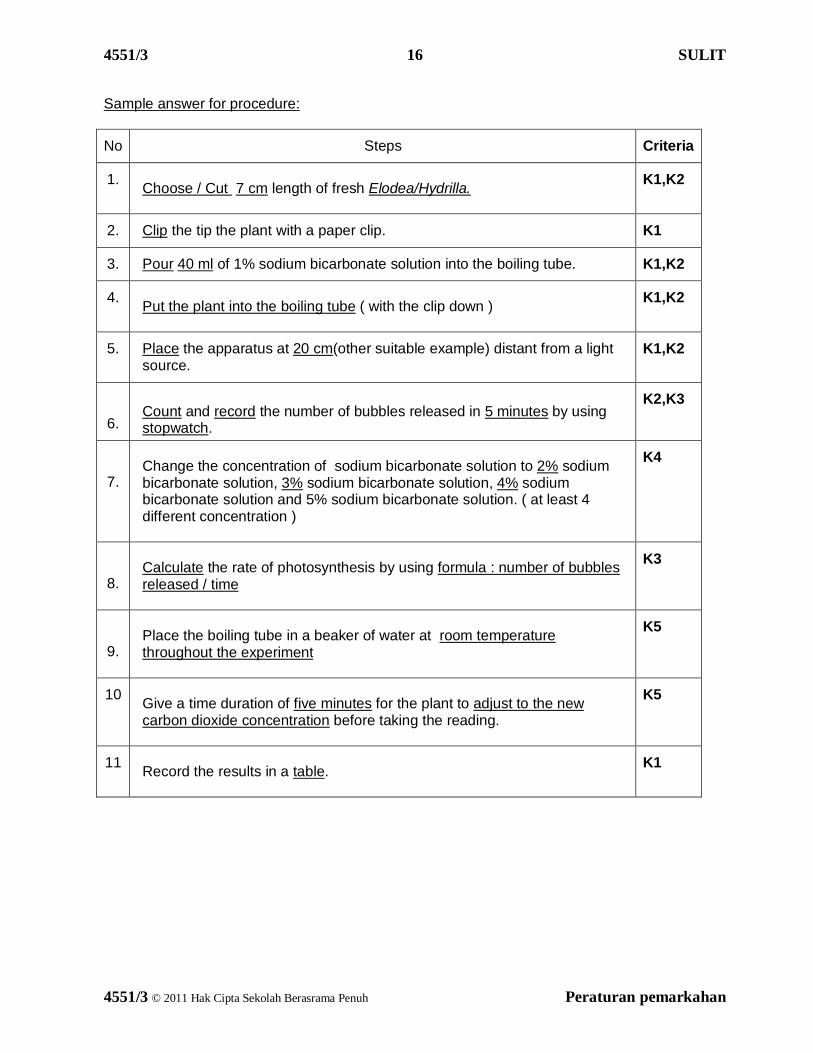
Sample answer for procedure:
No Steps Criteria
1. Choose / Cut 7 cm length of fresh Elodea/Hydrilla.
K1,K2
2. Clip the tip the plant with a paper clip. K1
3. Pour 40 ml of 1% sodium bicarbonate solution into the boiling tube. K1,K2
4. Put the plant into the boiling tube ( with the clip down )
K1,K2
5. Place the apparatus at 20 cm(other suitable example) distant from a light source.
K1,K2
6.
Count and record the number of bubbles released in 5 minutes by using stopwatch.
K2,K3
7.
Change the concentration of sodium bicarbonate solution to 2% sodium bicarbonate solution, 3% sodium bicarbonate solution, 4% sodium bicarbonate solution and 5% sodium bicarbonate solution. ( at least 4 different concentration )
K4
8.
Calculate the rate of photosynthesis by using formula : number of bubbles released / time
K3
9.
Place the boiling tube in a beaker of water at room temperature throughout the experiment
K5
10 Give a time duration of five minutes for the plant to adjust to the new carbon dioxide concentration before taking the reading.
K5
11 Record the results in a table.
K1