a method to construct gene regulatory networks to estimate and
TRANSCRIPT
62:1 (2013) 25–31 | www.jurnalteknologi.utm.my | eISSN 2180–3722 | ISSN 0127–9696
Full paper Jurnal
Teknologi
A Method to Construct Gene Regulatory Networks to Estimate and Calculate Time Delays Chai Suk Phin
a, Mohd Saberi Mohamad
a*
aUniversiti Teknologi Malaysia, 81310 UTM Johor Bahru, Johor, Malaysia
*Corresponding author: [email protected]
Article history
Received :16 November 2011
Received in revised form :
1 January 2013
Accepted :15 April 2013
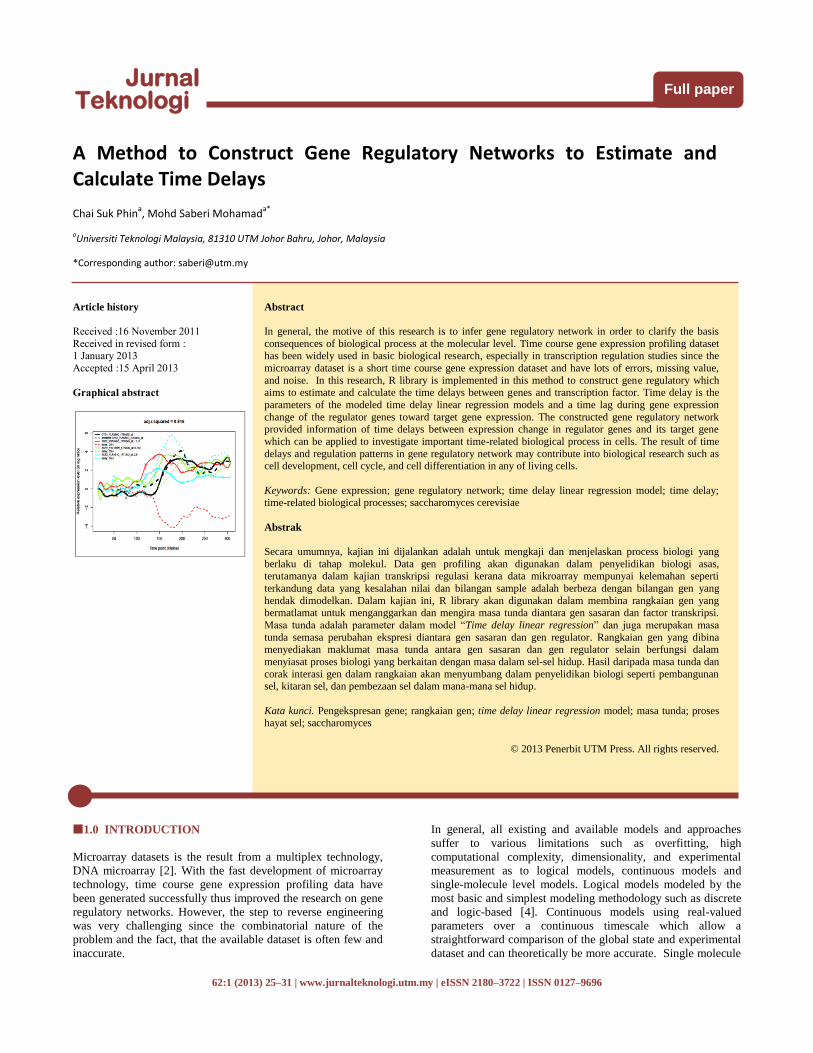
Graphical abstract
Abstract
In general, the motive of this research is to infer gene regulatory network in order to clarify the basis
consequences of biological process at the molecular level. Time course gene expression profiling dataset
has been widely used in basic biological research, especially in transcription regulation studies since the
microarray dataset is a short time course gene expression dataset and have lots of errors, missing value,
and noise. In this research, R library is implemented in this method to construct gene regulatory which aims to estimate and calculate the time delays between genes and transcription factor. Time delay is the
parameters of the modeled time delay linear regression models and a time lag during gene expression
change of the regulator genes toward target gene expression. The constructed gene regulatory network provided information of time delays between expression change in regulator genes and its target gene
which can be applied to investigate important time-related biological process in cells. The result of time
delays and regulation patterns in gene regulatory network may contribute into biological research such as cell development, cell cycle, and cell differentiation in any of living cells.
Keywords: Gene expression; gene regulatory network; time delay linear regression model; time delay; time-related biological processes; saccharomyces cerevisiae
Abstrak
Secara umumnya, kajian ini dijalankan adalah untuk mengkaji dan menjelaskan process biologi yang
berlaku di tahap molekul. Data gen profiling akan digunakan dalam penyelidikan biologi asas, terutamanya dalam kajian transkripsi regulasi kerana data mikroarray mempunyai kelemahan seperti
terkandung data yang kesalahan nilai dan bilangan sample adalah berbeza dengan bilangan gen yang
hendak dimodelkan. Dalam kajian ini, R library akan digunakan dalam membina rangkaian gen yang bermatlamat untuk menganggarkan dan mengira masa tunda diantara gen sasaran dan factor transkripsi.
Masa tunda adalah parameter dalam model “Time delay linear regression” dan juga merupakan masa
tunda semasa perubahan ekspresi diantara gen sasaran dan gen regulator. Rangkaian gen yang dibina menyediakan maklumat masa tunda antara gen sasaran dan gen regulator selain berfungsi dalam
menyiasat proses biologi yang berkaitan dengan masa dalam sel-sel hidup. Hasil daripada masa tunda dan
corak interasi gen dalam rangkaian akan menyumbang dalam penyelidikan biologi seperti pembangunan sel, kitaran sel, dan pembezaan sel dalam mana-mana sel hidup.
Kata kunci. Pengekspresan gene; rangkaian gen; time delay linear regression model; masa tunda; proses hayat sel; saccharomyces
© 2013 Penerbit UTM Press. All rights reserved.
1.0 INTRODUCTION
Microarray datasets is the result from a multiplex technology,
DNA microarray [2]. With the fast development of microarray
technology, time course gene expression profiling data have
been generated successfully thus improved the research on gene
regulatory networks. However, the step to reverse engineering
was very challenging since the combinatorial nature of the
problem and the fact, that the available dataset is often few and
inaccurate.
In general, all existing and available models and approaches
suffer to various limitations such as overfitting, high
computational complexity, dimensionality, and experimental
measurement as to logical models, continuous models and
single-molecule level models. Logical models modeled by the
most basic and simplest modeling methodology such as discrete
and logic-based [4]. Continuous models using real-valued
parameters over a continuous timescale which allow a
straightforward comparison of the global state and experimental
dataset and can theoretically be more accurate. Single molecule
26 Chai Suk Phin & Mohd Saberi Mohamad / Jurnal Teknologi (Sciences & Engineering) 62:1 (2013), 25–31
level models explain the relationship between stochasticity and
gene regulation.
Moreover, some software also available and been used for
gene network inference such as ARACNE and Banjo.
ARACNE (Algorithm for the Reconstruction of Accurate
Cellular Networks), well known software of information-
theoretic approaches that used to scale up complexity of gene
regulatory network by microarray network in mammalian cells,
besides address limitation of network deconvolution [5]. Banjo,
another software that developed by group of Hartemink that
used to infer gene regulatory network [9]. In general, gene
regulatory network is the network that shows molecular species
and their interactions, which together control gene product
abundance [3]. Furthermore, gene regulatory network can be
defined as nonlinear differential equations when time delays
estimated during gene expression change [8].
This journal shows gene regulatory network is constructed
based on interaction between time course gene expression
profiling dataset of S. Cerevisiae (Saccharomyces Cerevisiae)
and transcription factors or known as regulator genes. This
network is constructed based on two parameters which are time
delay and regulation coefficient. The function of gene regulatory
network is to provide information about time delays which can
be applied to investigate important time-related biological
process such as cell development and cell cycle.
2.0 MATERIALS AND METHODS
In this research, used the dataset from yeast dataset named as
Saccharomyces. Cerevisiae (S. Cerevisiae) cell cycle data which
included both gene expression profiles of wild type cells and
cyclin mutant cells which also known as target gene in this
research. Besides, a candidate pool of potential regulator genes
or known as of target genes also applied in this research in order
to analysis the interaction between regulators and target gene.
Table 2.1 The details of dataset
S. Cerevisiae cell cycle
dataset
Number of genes
Wild type cells 3725
Cyclin mutant cells 2029
Regulator genes 34
In general, time course gene expression profiling dataset or
known as target gene is interpolated by a B spline interpolation
followed by modeled time delay linear regression models and
lastly construct gene regulatory network. There are 2 different
methods to construct gene regulatory as discussed in more
details in Section 2.4.1, and 2.4.2.
2.1 B Spline Interpolation
In this research, time points which obtain from experimentation
of biological process too complicated and dummy. Thus, B
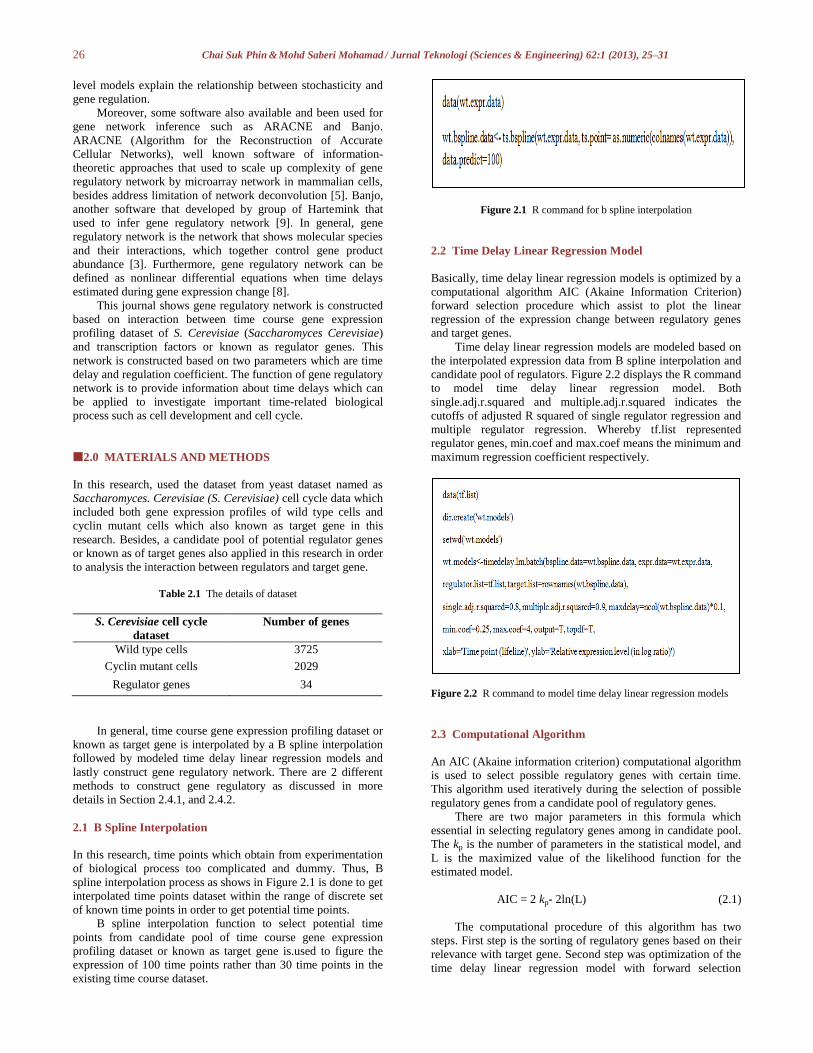
spline interpolation process as shows in Figure 2.1 is done to get
interpolated time points dataset within the range of discrete set
of known time points in order to get potential time points.
B spline interpolation function to select potential time
points from candidate pool of time course gene expression
profiling dataset or known as target gene is.used to figure the
expression of 100 time points rather than 30 time points in the
existing time course dataset.
Figure 2.1 R command for b spline interpolation
2.2 Time Delay Linear Regression Model
Basically, time delay linear regression models is optimized by a
computational algorithm AIC (Akaine Information Criterion)
forward selection procedure which assist to plot the linear
regression of the expression change between regulatory genes
and target genes.
Time delay linear regression models are modeled based on
the interpolated expression data from B spline interpolation and
candidate pool of regulators. Figure 2.2 displays the R command
to model time delay linear regression model. Both
single.adj.r.squared and multiple.adj.r.squared indicates the
cutoffs of adjusted R squared of single regulator regression and
multiple regulator regression. Whereby tf.list represented
regulator genes, min.coef and max.coef means the minimum and
maximum regression coefficient respectively.
Figure 2.2 R command to model time delay linear regression models
2.3 Computational Algorithm
An AIC (Akaine information criterion) computational algorithm
is used to select possible regulatory genes with certain time.
This algorithm used iteratively during the selection of possible
regulatory genes from a candidate pool of regulatory genes.
There are two major parameters in this formula which
essential in selecting regulatory genes among in candidate pool.
The kp is the number of parameters in the statistical model, and
L is the maximized value of the likelihood function for the
estimated model.
AIC = 2 kp- 2ln(L) (2.1)
The computational procedure of this algorithm has two
steps. First step is the sorting of regulatory genes based on their
relevance with target gene. Second step was optimization of the
time delay linear regression model with forward selection
27 Chai Suk Phin & Mohd Saberi Mohamad / Jurnal Teknologi (Sciences & Engineering) 62:1 (2013), 25–31
procedure for regulatory genes and time delays. Potential
regulatory genes toward certain target gene with time delays
either in activation or regression expression are constructed in
this step. From the equation, tf’’i define the transcription factor
and M define as the smallest AIC of regulator genes. The
possible regulator genes can be expression by the following
equation:
S = { tf”1, tf”2, …, tf”i} ( 1 ≤ i ≤ M ) (2.2)
If 1 < 2, tf1 has smaller AIC than tf2 and thus tf1 can be
considered better than tf2.
2.4 Construction of Gene Regulatory Network
The gene regulatory network is constructed based on the time
delay linear regression models as discuss in Section 2.2. In this
research, two distinct methods are implemented to construct
gene regulatory network as discussed in Section 2.4.1, and 2.4.2.
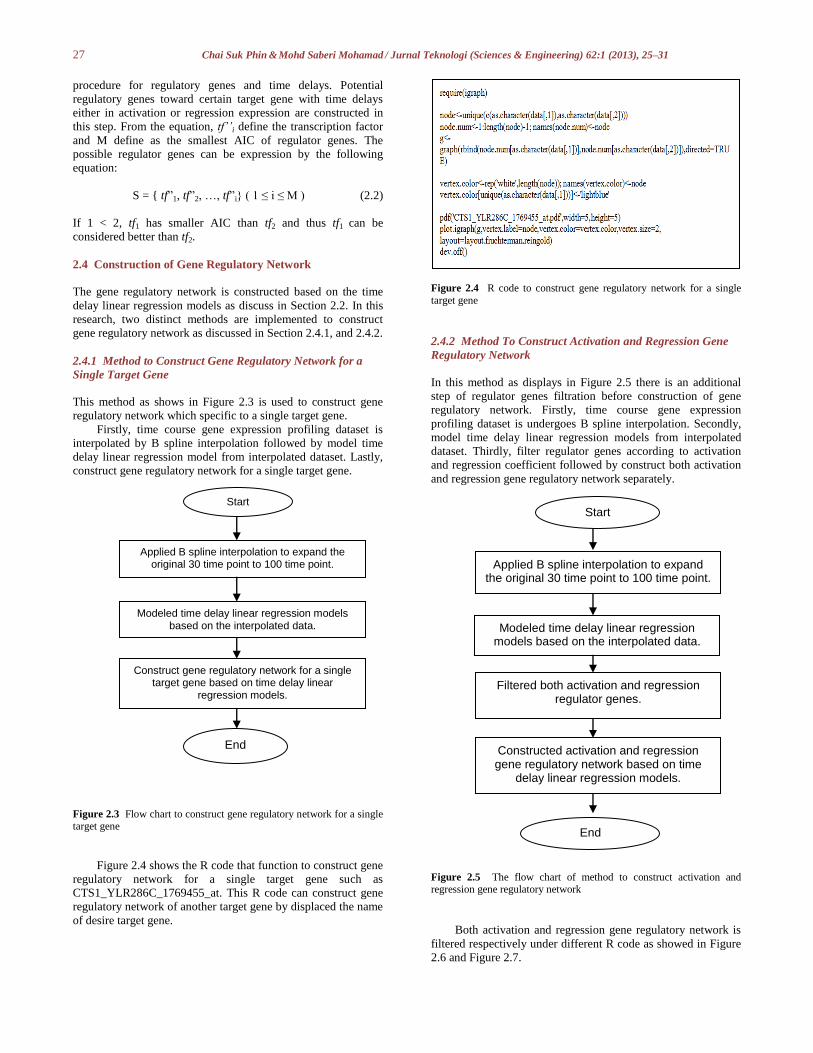
2.4.1 Method to Construct Gene Regulatory Network for a
Single Target Gene
This method as shows in Figure 2.3 is used to construct gene
regulatory network which specific to a single target gene.
Firstly, time course gene expression profiling dataset is
interpolated by B spline interpolation followed by model time
delay linear regression model from interpolated dataset. Lastly,
construct gene regulatory network for a single target gene.
Figure 2.3 Flow chart to construct gene regulatory network for a single
target gene
Figure 2.4 shows the R code that function to construct gene
regulatory network for a single target gene such as
CTS1_YLR286C_1769455_at. This R code can construct gene
regulatory network of another target gene by displaced the name
of desire target gene.
Figure 2.4 R code to construct gene regulatory network for a single
target gene
2.4.2 Method To Construct Activation and Regression Gene
Regulatory Network
In this method as displays in Figure 2.5 there is an additional
step of regulator genes filtration before construction of gene
regulatory network. Firstly, time course gene expression
profiling dataset is undergoes B spline interpolation. Secondly,
model time delay linear regression models from interpolated
dataset. Thirdly, filter regulator genes according to activation
and regression coefficient followed by construct both activation
and regression gene regulatory network separately.
Figure 2.5 The flow chart of method to construct activation and regression gene regulatory network
Both activation and regression gene regulatory network is
filtered respectively under different R code as showed in Figure
2.6 and Figure 2.7.
Applied B spline interpolation to expand the original 30 time point to 100 time point.
Modeled time delay linear regression models based on the interpolated data.
Construct gene regulatory network for a single target gene based on time delay linear
regression models.
Applied B spline interpolation to expand the original 30 time point to 100 time point.
Modeled time delay linear regression models based on the interpolated data.
Filtered both activation and regression regulator genes.
Constructed activation and regression gene regulatory network based on time
delay linear regression models.
Start
End
Start
End
28 Chai Suk Phin & Mohd Saberi Mohamad / Jurnal Teknologi (Sciences & Engineering) 62:1 (2013), 25–31
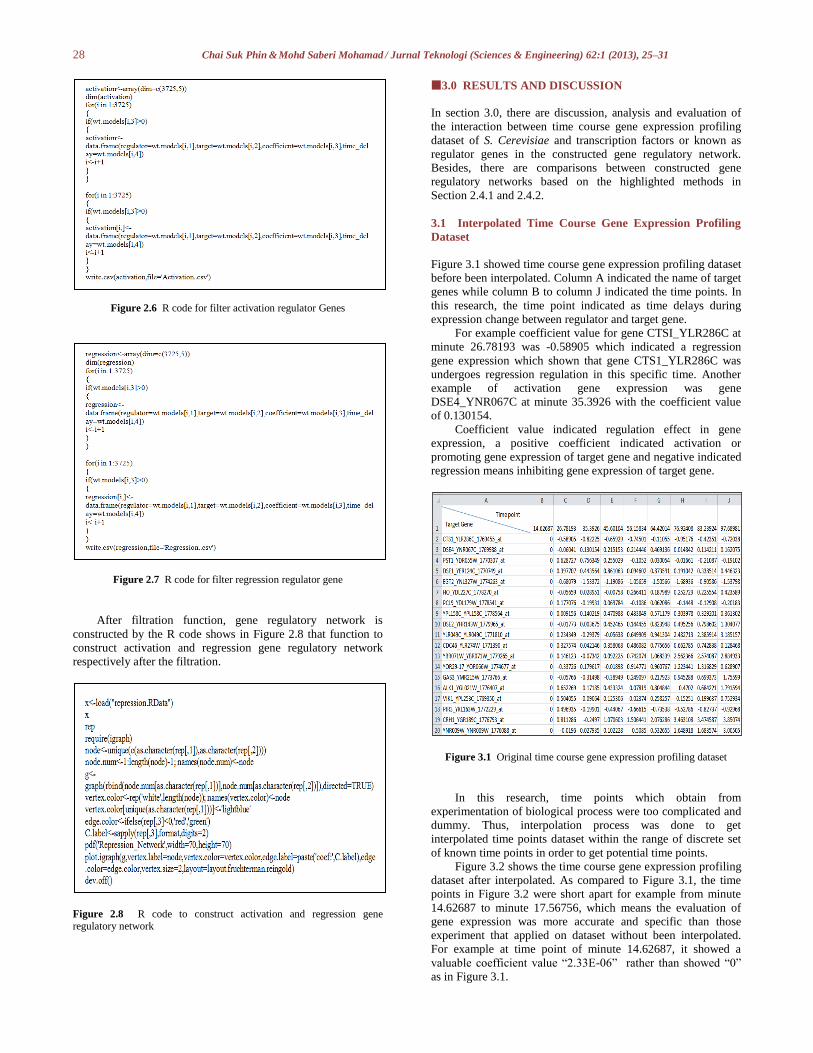
Figure 2.6 R code for filter activation regulator Genes
Figure 2.7 R code for filter regression regulator gene
After filtration function, gene regulatory network is
constructed by the R code shows in Figure 2.8 that function to
construct activation and regression gene regulatory network
respectively after the filtration.
Figure 2.8 R code to construct activation and regression gene regulatory network
3.0 RESULTS AND DISCUSSION
In section 3.0, there are discussion, analysis and evaluation of
the interaction between time course gene expression profiling
dataset of S. Cerevisiae and transcription factors or known as
regulator genes in the constructed gene regulatory network.
Besides, there are comparisons between constructed gene
regulatory networks based on the highlighted methods in
Section 2.4.1 and 2.4.2.
3.1 Interpolated Time Course Gene Expression Profiling
Dataset
Figure 3.1 showed time course gene expression profiling dataset
before been interpolated. Column A indicated the name of target
genes while column B to column J indicated the time points. In
this research, the time point indicated as time delays during
expression change between regulator and target gene.
For example coefficient value for gene CTSI_YLR286C at
minute 26.78193 was -0.58905 which indicated a regression
gene expression which shown that gene CTS1_YLR286C was
undergoes regression regulation in this specific time. Another
example of activation gene expression was gene
DSE4_YNR067C at minute 35.3926 with the coefficient value
of 0.130154.
Coefficient value indicated regulation effect in gene
expression, a positive coefficient indicated activation or
promoting gene expression of target gene and negative indicated
regression means inhibiting gene expression of target gene.
Figure 3.1 Original time course gene expression profiling dataset
In this research, time points which obtain from
experimentation of biological process were too complicated and
dummy. Thus, interpolation process was done to get
interpolated time points dataset within the range of discrete set
of known time points in order to get potential time points.
Figure 3.2 shows the time course gene expression profiling
dataset after interpolated. As compared to Figure 3.1, the time
points in Figure 3.2 were short apart for example from minute
14.62687 to minute 17.56756, which means the evaluation of
gene expression was more accurate and specific than those
experiment that applied on dataset without been interpolated.
For example at time point of minute 14.62687, it showed a
valuable coefficient value “2.33E-06” rather than showed “0”
as in Figure 3.1.
29 Chai Suk Phin & Mohd Saberi Mohamad / Jurnal Teknologi (Sciences & Engineering) 62:1 (2013), 25–31
Figure 3.2 Interpolated time course gene expression profiling dataset
3.2 Gene Regulatory Network for One Target Gene
A gene regulatory network for a single target gene is shows in
Figure 3.3. In Figure 3.3, the target gene is regulated by three
regulators ACE2_YLR131C_1771312_at,
ASH1_YKL185W_1772030_at, and
SWI5_YDR146C_1770349_at.
Figure 3.3 Gene Regulatory Network for CTS1_YLR286C_1769455_at
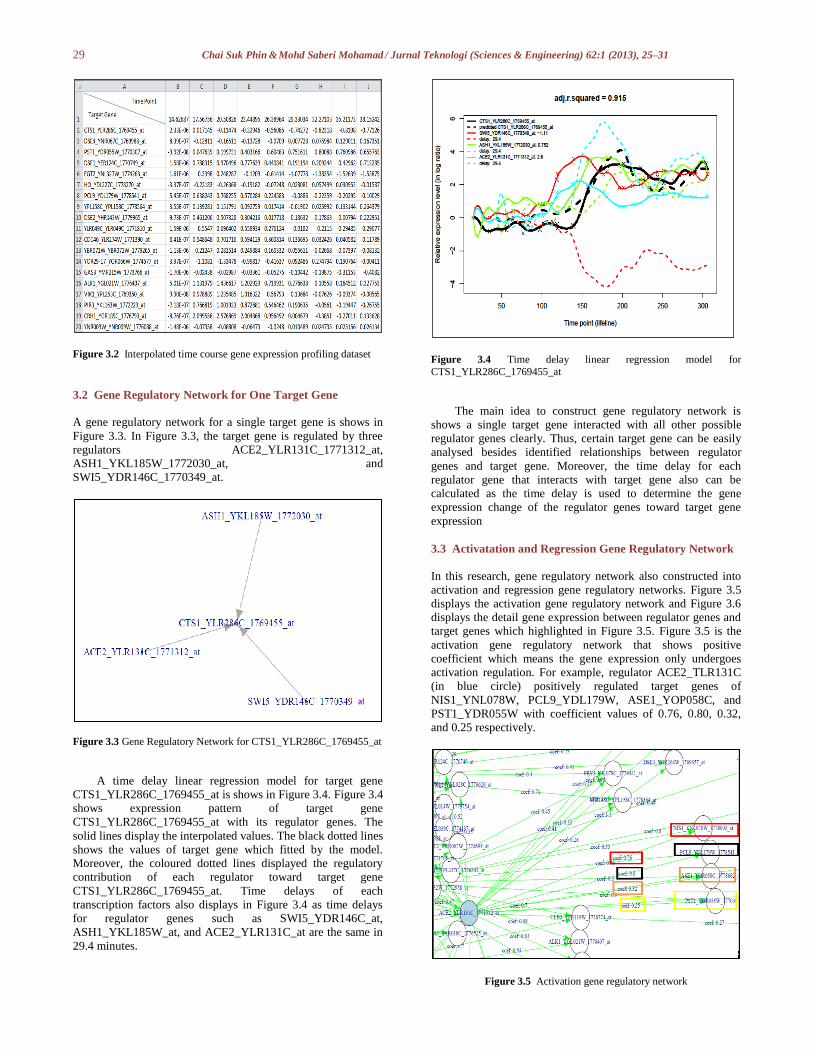
A time delay linear regression model for target gene
CTS1_YLR286C_1769455_at is shows in Figure 3.4. Figure 3.4
shows expression pattern of target gene
CTS1_YLR286C_1769455_at with its regulator genes. The
solid lines display the interpolated values. The black dotted lines
shows the values of target gene which fitted by the model.
Moreover, the coloured dotted lines displayed the regulatory
contribution of each regulator toward target gene
CTS1_YLR286C_1769455_at. Time delays of each
transcription factors also displays in Figure 3.4 as time delays
for regulator genes such as SWI5_YDR146C_at,
ASH1_YKL185W_at, and ACE2_YLR131C_at are the same in
29.4 minutes.
Figure 3.4 Time delay linear regression model for
CTS1_YLR286C_1769455_at
The main idea to construct gene regulatory network is
shows a single target gene interacted with all other possible
regulator genes clearly. Thus, certain target gene can be easily
analysed besides identified relationships between regulator
genes and target gene. Moreover, the time delay for each
regulator gene that interacts with target gene also can be
calculated as the time delay is used to determine the gene
expression change of the regulator genes toward target gene
expression
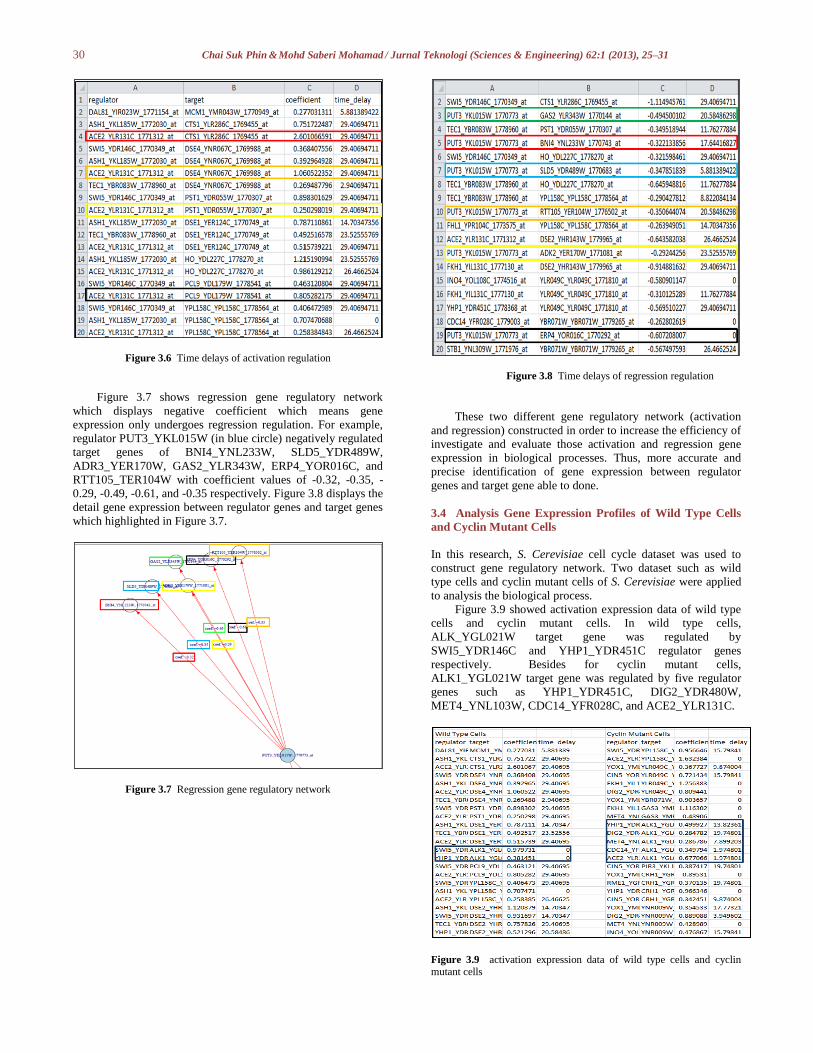
3.3 Activatation and Regression Gene Regulatory Network
In this research, gene regulatory network also constructed into
activation and regression gene regulatory networks. Figure 3.5
displays the activation gene regulatory network and Figure 3.6
displays the detail gene expression between regulator genes and
target genes which highlighted in Figure 3.5. Figure 3.5 is the
activation gene regulatory network that shows positive
coefficient which means the gene expression only undergoes
activation regulation. For example, regulator ACE2_TLR131C
(in blue circle) positively regulated target genes of
NIS1_YNL078W, PCL9_YDL179W, ASE1_YOP058C, and
PST1_YDR055W with coefficient values of 0.76, 0.80, 0.32,
and 0.25 respectively.
Figure 3.5 Activation gene regulatory network
30 Chai Suk Phin & Mohd Saberi Mohamad / Jurnal Teknologi (Sciences & Engineering) 62:1 (2013), 25–31
Figure 3.6 Time delays of activation regulation
Figure 3.7 shows regression gene regulatory network
which displays negative coefficient which means gene
expression only undergoes regression regulation. For example,
regulator PUT3_YKL015W (in blue circle) negatively regulated
target genes of BNI4_YNL233W, SLD5_YDR489W,
ADR3_YER170W, GAS2_YLR343W, ERP4_YOR016C, and
RTT105_TER104W with coefficient values of -0.32, -0.35, -
0.29, -0.49, -0.61, and -0.35 respectively. Figure 3.8 displays the
detail gene expression between regulator genes and target genes
which highlighted in Figure 3.7.
Figure 3.7 Regression gene regulatory network
Figure 3.8 Time delays of regression regulation
These two different gene regulatory network (activation
and regression) constructed in order to increase the efficiency of
investigate and evaluate those activation and regression gene
expression in biological processes. Thus, more accurate and
precise identification of gene expression between regulator
genes and target gene able to done.
3.4 Analysis Gene Expression Profiles of Wild Type Cells
and Cyclin Mutant Cells
In this research, S. Cerevisiae cell cycle dataset was used to
construct gene regulatory network. Two dataset such as wild
type cells and cyclin mutant cells of S. Cerevisiae were applied
to analysis the biological process.
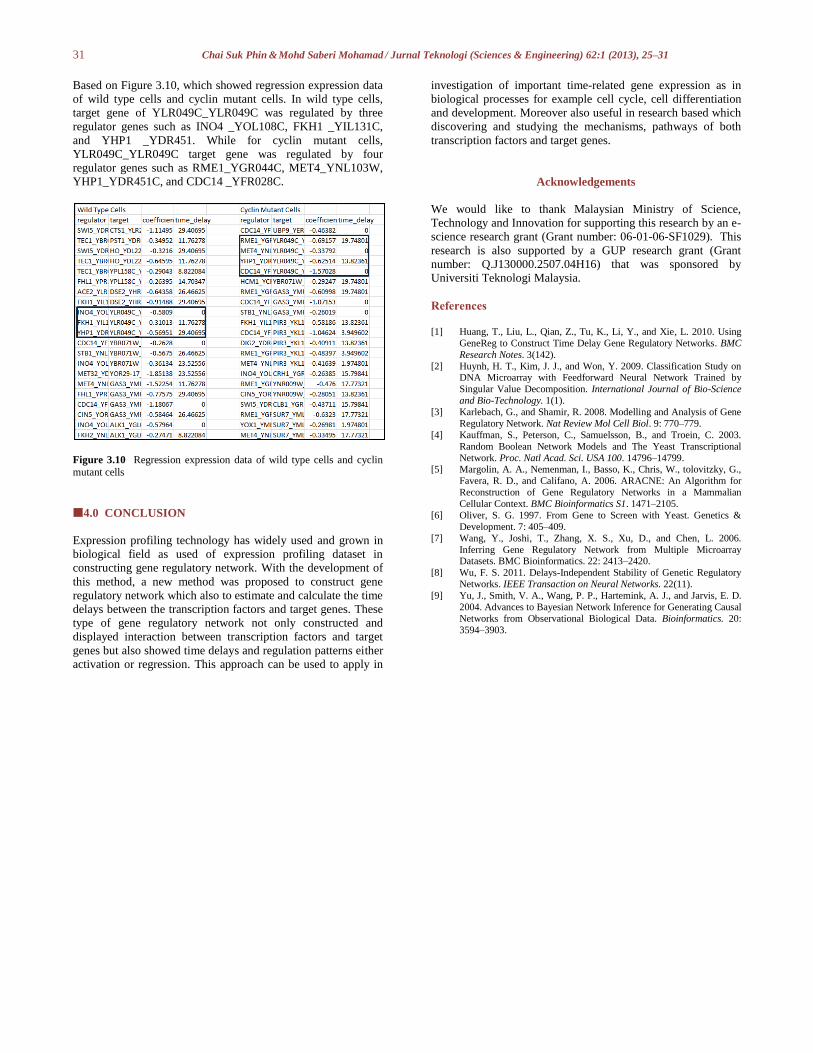
Figure 3.9 showed activation expression data of wild type
cells and cyclin mutant cells. In wild type cells,
ALK_YGL021W target gene was regulated by
SWI5_YDR146C and YHP1_YDR451C regulator genes
respectively. Besides for cyclin mutant cells,
ALK1_YGL021W target gene was regulated by five regulator
genes such as YHP1_YDR451C, DIG2_YDR480W,
MET4_YNL103W, CDC14_YFR028C, and ACE2_YLR131C.
Figure 3.9 activation expression data of wild type cells and cyclin mutant cells
31 Chai Suk Phin & Mohd Saberi Mohamad / Jurnal Teknologi (Sciences & Engineering) 62:1 (2013), 25–31
Based on Figure 3.10, which showed regression expression data
of wild type cells and cyclin mutant cells. In wild type cells,
target gene of YLR049C_YLR049C was regulated by three
regulator genes such as INO4 _YOL108C, FKH1 _YIL131C,
and YHP1 _YDR451. While for cyclin mutant cells,
YLR049C_YLR049C target gene was regulated by four
regulator genes such as RME1_YGR044C, MET4_YNL103W,
YHP1_YDR451C, and CDC14 _YFR028C.
Figure 3.10 Regression expression data of wild type cells and cyclin
mutant cells
4.0 CONCLUSION
Expression profiling technology has widely used and grown in
biological field as used of expression profiling dataset in
constructing gene regulatory network. With the development of
this method, a new method was proposed to construct gene
regulatory network which also to estimate and calculate the time
delays between the transcription factors and target genes. These
type of gene regulatory network not only constructed and
displayed interaction between transcription factors and target
genes but also showed time delays and regulation patterns either
activation or regression. This approach can be used to apply in
investigation of important time-related gene expression as in
biological processes for example cell cycle, cell differentiation
and development. Moreover also useful in research based which
discovering and studying the mechanisms, pathways of both
transcription factors and target genes.
Acknowledgements
We would like to thank Malaysian Ministry of Science,
Technology and Innovation for supporting this research by an e-
science research grant (Grant number: 06-01-06-SF1029). This
research is also supported by a GUP research grant (Grant
number: Q.J130000.2507.04H16) that was sponsored by
Universiti Teknologi Malaysia.
References
[1] Huang, T., Liu, L., Qian, Z., Tu, K., Li, Y., and Xie, L. 2010. Using
GeneReg to Construct Time Delay Gene Regulatory Networks. BMC
Research Notes. 3(142).
[2] Huynh, H. T., Kim, J. J., and Won, Y. 2009. Classification Study on DNA Microarray with Feedforward Neural Network Trained by
Singular Value Decomposition. International Journal of Bio-Science
and Bio-Technology. 1(1).
[3] Karlebach, G., and Shamir, R. 2008. Modelling and Analysis of Gene
Regulatory Network. Nat Review Mol Cell Biol. 9: 770–779.
[4] Kauffman, S., Peterson, C., Samuelsson, B., and Troein, C. 2003.
Random Boolean Network Models and The Yeast Transcriptional
Network. Proc. Natl Acad. Sci. USA 100. 14796–14799. [5] Margolin, A. A., Nemenman, I., Basso, K., Chris, W., tolovitzky, G.,
Favera, R. D., and Califano, A. 2006. ARACNE: An Algorithm for
Reconstruction of Gene Regulatory Networks in a Mammalian
Cellular Context. BMC Bioinformatics S1. 1471–2105.
[6] Oliver, S. G. 1997. From Gene to Screen with Yeast. Genetics &
Development. 7: 405–409.
[7] Wang, Y., Joshi, T., Zhang, X. S., Xu, D., and Chen, L. 2006.
Inferring Gene Regulatory Network from Multiple Microarray Datasets. BMC Bioinformatics. 22: 2413–2420.
[8] Wu, F. S. 2011. Delays-Independent Stability of Genetic Regulatory
Networks. IEEE Transaction on Neural Networks. 22(11).
[9] Yu, J., Smith, V. A., Wang, P. P., Hartemink, A. J., and Jarvis, E. D.
2004. Advances to Bayesian Network Inference for Generating Causal
Networks from Observational Biological Data. Bioinformatics. 20:
3594–3903.