universiti putra malaysia modeling of …psasir.upm.edu.my/11613/1/fsas_2003_10_a.pdf · kriteria...
TRANSCRIPT
UNIVERSITI PUTRA MALAYSIA
MODELING OF METEOROLOGICAL PARAMETERS FOR LIBYA
MOHAMMED ALI SH-ELDIN
FSAS 2003 10
MODELING OF METEOROLOGICAL PARAMETERS
FOR LWVA
MOHAMMED ALI SH-ELDIN
MASTER OF SCIENCE UNIVERSITI PUTRA MALAYSIA
2003
MODELING OF METEOROLOGICAL PARAMETERS FOR LIBYA
By
MOHAMMED ALI SH-ELDIN
Thesis Submitted to the School of Gnduate Studies, Univeniti Putn Malaysia, in Fulfillment of Requirements for the Degree of M.,Rr of Science
April 2003

DEDICATION
To the Truly Incorruptible among Men, whose
Nobility Restores our Gratitude and Reverence
For Human Life
ii
iii
Abstract of thesis presented to the Senate ofUniversiti Putra Malaysia in fulfillment of the requirements for the degree of Master of Science
MODELING OF METEOROLOGICAL PARAMETERS FOR LmVA
By
MOHAMMED ALI SH-ELDIN
April 1003
Chairman: Prof. Hj. Mohd Vusof Sulaiman, Ph.D.
Faculty: Science and Environmental Studies
Libya is a developing country with large natural resources. The surface of
Libya amounts to 1 ,775,500 km2 and is the fourth biggest African country. The
population of Libya amounts to approximately 5 million and is concentrated on the
coastal strips though it is divided among cities, villages, and rural areas, while the
desert has some green, sunny, and windy oasis where many tribes live there. Due to
the random distribution of the villages and oasis among the vast Libyan area it will
be vel}' expensive to provide these remote areas with electric energy from the
country's grid of electricity. This reason encourages us to consider renewable energy
options such as solar, wind, as alternatives. For successful energy research and
applications, weather parameters of Libya (wind speed, sunshine duration, humidity,
temperature, rainfall, and global solar radiation) have to be modeled.
For solar energy applications, information on global solar radiation for
specific sites that have no records of weather data is required. A model based on
Angstrom formula using weather data such as sunshine, temperature and humidity of
five stations in Libya is described. The criteria of choosing the best formula among
all formulae were based on R2 value (coefficient of determination), and the value of
modeling efficiency (EFF). We can accept any of equations 2.12,2.19, and 2.20 to
predict global solar radiation especially the nonlinear equation 2.20.
IV
The wind is a free, clean, and inexhaustible energy source. It has served
humankind well for many centuries by propelling ships and driving wind turbines to
grind grain and pump water. The calculation of the output of a wind machine
requires knowledge of the distribution of the wind speed. Weibull distribution has
been applied to fit the probability distribution nature of wind speed. The analysis of
the wind characteristics and the machine potentiality on the sites showed that over
the year, Shahat has the highest mean wind speed followed by Sabha, and Tripoli.
A]so Shahat has the highest mean power density followed by Sabha, and Tripoli,
where the second two sites (Sirt, and AI Kufra), have marginal mean wind speeds.
The two most potentia], and recommended sites for wind power density are Shahat,
and Sabha with annual power densities of 336.85 W/m2, 189.54 W/m2 respectively,
while the annual wind power density for Tripoli airport is 127.65 W/m2 which is also
acceptable and the annual mean wind speed for all sites are 6.18 mls for Sabha,
5.28 mls for Tripoli, and 7.33 mls for Shahat. For the other sites such as Sirt, and
AI Kufra the water pumping may be the only one use of the wind energy.
Time series analysis of the weather parameters have been carried out. To
apply autoregressive process, transformation technique has been applied to generate
stationmy time series. Seasonal and non-seasonal auto regressive models describe
our data for all stations. Time plot of the residuals, histogram of the residuals, auto
correlation and partial auto correlation of the residuals indicate excellent results. The
statistical tests of the residuals of the time series indicate excellent results for all
locations of our study.
Abstrak tesis yang dikemukakan kepada Senat Universiti Putra Malaysia sebagai memenuhi keperluan untuk ijazah Master Sains
MODEL PARAMETER METEOROWGI NEGARA LffiYA
Oleh
MOHAMMED All SH-ELDIN
April 2003
Pengerusi : Prof. Hj. Mohd Yusof Sulaiman, Ph.D.
Fakulti : Pengajian Sains dan Alam Sekitar
Libya adalah negara membangun yang kaya dengan sumber-sumber
semulajadi. Keluasannya adalah 1,775,500 kIn persegi mernpakan negara keempat
terbesar di Afrika. lumlah penduduknya hampir 5 juta yang tertumpu di pesisir
pantai. Taburan penduduknya terbahagi kepada kawasan bandar, kampung dan luar
bandar manakala di kawasan gurun yang terdapat oasis, beberapa suku penduduk
mendiaminya.
Memandangkan taburan rawak kampung dan oasis yang cantik di negara
Libya yang luas itu, adalah amat malIal untuk menyediakan kuasa elektrik melalui
grid tenaga negara. Keadaan ini menggalakan negara mempertimbangkan pitihan
tenaga barn seperti tenaga solar dan angin sebagai pitihan. Untuk menjamin kejayaan
kajian dan penggunaannya, parameter cuaca di Libya (kelajuan angin, tempoh
sinaran, kelembapan, suhu, hujan, dan sinaran solar global) perlu dimodelkan.
Untuk penggunaan tenaga solar, maklumat sinaran solar global di tapak
tertentu diperIukan bagi tapak yang tidak mempunyai tapak rekod kajicuaca. Model
yang berasas Formula Angstrom yang menggunakan data sinaran matahari, suhu dan
kelembapan di lima stesen telah digunakan. Kriteria pemilihan formula yang terbaik
daripada fonnula-fonnula tersedia adaIah berdasarkan nilai R2 (koefisien penentuan),
dan nilai kecekapan model (EFF). Kita boleh menerima sebarang persamaan 2.12,
2.19, and 2.20 untuk meramalkan sinaran solar global terutamanya pada persamaan
2.20).
Sumber tenaga angin adalah percuma, bersih dan tidak mengeluarkan bahan
sisaan. Ia telah menyumbangkan tenaga kepada manusia dengan baik di beberapa
negara menggerakkan kipas kapal dan turbin angin untuk menghancurkan bijiran dan
mengepam air. Pengiraan hasil keluaran mesin angin memerlukan pengtahuan
taburan laju angin. Taburan Weibull telah digunakan untuk padanan dengan taburan
kebarangkalian semulajadi laju angin. Analisis cirl-ciri angin dan keupayaan
(potensi) mesin di lapangan bagi setahun menunjukkan Shahat mempunyai purata
tertinggi kelajuan angin diikuti oleh Sabha dan Tripoli. Shahat juga menunjukkan
ketumpatan purata kuasa tertinggi diikuti oleh sabha dan Tripoli. Dua tapak lagi (Sirt
dan AI Kufra) mempunyai purata halaju angin yang kecil. Kami mencadangkan dua
tapak yang paling berpotensi untuk ketumpatan kuasa angin iaitu Shahat dan Sabha
dengan ketumpatan kuasa tahunan masing-masing 336.85 W 1m2, 189.54 W I m2
dimana ketumpatan kuasa tahunan di Lapangan terbang Tripoli adalah 127.65 WI m2
juga boleh diterima dan kelajuan angin purata tahunan untuk semua Bandar adalah
6.18 m I s di Sabha, 5.28 m I s di Tripoli dan 7.33 m I s di Shahat. Pada bandar
bandar lain seperti Sirt dan AI Kufra, hanya pengempaman air mungkin boleh
menggunakan tenaga angin.
Analisis siri masa parameter cuaca telah dilakukan. Untuk menggunakan
proses regresif auto, teknik transformasi (pembezaan) tetah digunakan untuk
menghasitkan sirl masa pegun. Model regresif auto bermusim dan tak bermusim
menerangkan data daripada semua stesen Plot masa, histogram, korelasi auto dan
korelasi partial auto baki (residual) menunjukkan keputusan yang baik. Ujian statistik
baki siri masa juga menUlijukkan keputusan-keputusan yang baik bagi semua lokasi
lokasi yang dikaji.

vii
ACKNOWLEDGEMENTS
Praise be to Allah (SWT) Whose Mercy has granted me supervision from the
highest ranks of His favored servants. Such men also attract others of exalted status,
who have honored me with their knowledge and their wisdom. Tltis paper is offered
in sincere gratitude and respect to the following:
My heartfelt thank to Professor Dr. Mohd. Yusof Sulaiman, chainnan of my
supervisory committee, for his invaluable suggestions, assistance, beneficial advice,
and repeated encouragement throughout this work. I have the highest regard for his
professional courtesy and the profound humility of his character.
Similar thanks must go to members of my supervisory committee, Dr. Mahdi
Abd Wahab, Dr. Jamil Bin Suradi, and Dr. Azmi Zakaria for their interest,
suggestions, and guidance throughout the project.
I would like to thank staff of the physics Department of U.P.M, who have
always offered assistance, advice.
I also take this opportunity to express my thanks to those who have helped
me during my stay in Malaysia: Dr. Ramadan M Aldaif, Mr. Mohammad A1ghoul,
Masaud Assallami. And very special thanks are to the Meteorological Department
staff in Libya for their special help in collecting Meteorological data for several Sites
in Libya.
Finally, may Allah reward my supervisor and other lecturers for their
dedication and service to humankind.

VIII
I certify that an Examination Committee met on 3'" April 2003 to conduct the final
examination of Mohammed Ali Sh-Etdin on his Master of Science thesis entitled "Modeling of Meteorological Parameters for Libya" in accordance with Universiti Pertanian Malaysia (Higher Degree) Act 1980 and Universiti Pertanian Malaysia (Higher Degree) Regulations 1981, The Committee recommends that the candidate be a\\'arded the relevant degree, The Committee Members [or the candidate are as follows:
ZAIDAN ABDUL WAHAB, Ph.D.
Faculty of Science and Environmental Studies Universiti Putra Malaysia (Chairman)
MOHD YUSOF SULAIMAN, Ph.D.
Professor Faculty of Science and Environmental Studies Universiti Putra Malaysia (Member)
MAHDI ABDUL WAHAB, Ph.D.
Faculty of Science and Environmental Studies Universiti Putra Malaysia (Member)
JAMIL SURADI, Ph.D.
Faculty of Science and Environmental Studies Universiti Putra Malaysia (Member)
AZMI ZAKARIA, Ph.D.
Faculty of Science and Environmental Studies Universiti Putra Malaysia (Member)
Date: G r.,M,{ 2003

ix
This thesis submitted to the Senate ofUniversiti Putra Malaysia has been accepted as fulfillment of the requirements for the degree of Master of Science. The members of the Supervisory Committee are as follows:
MORD YUSOF SULAIMAN, Ph.D. Professor Faculty of Science and Environmental Studies Universiti Putra Malaysia (Chainnan)
MARDI ABDUL WAHAB, Ph.D. Faculty of Science and Environmental Studies Universiti Putra Malaysia (Member)
JAMIL SURADI, Ph.D. Faculty of Science and Environmental Studies Universiti Putra Malaysia (Member)
AZMI ZAKARIA, Ph.D. Faculty of Science and Environmental Studies Universiti Putra Malaysia (Member)
AINI IDERIS, Ph.D. ProfessorlDean, School of Graduate Studies, Universiti Putra Malaysia
Date: 1 0 JUL 2003

x
DECLARATION
I hereby declare that the thesis is based on my original work except for quotations and citations, which have been duly acknowledged. I also declare that it has not been previously or concurrently submitted for any other degree at UPM or other institutions.
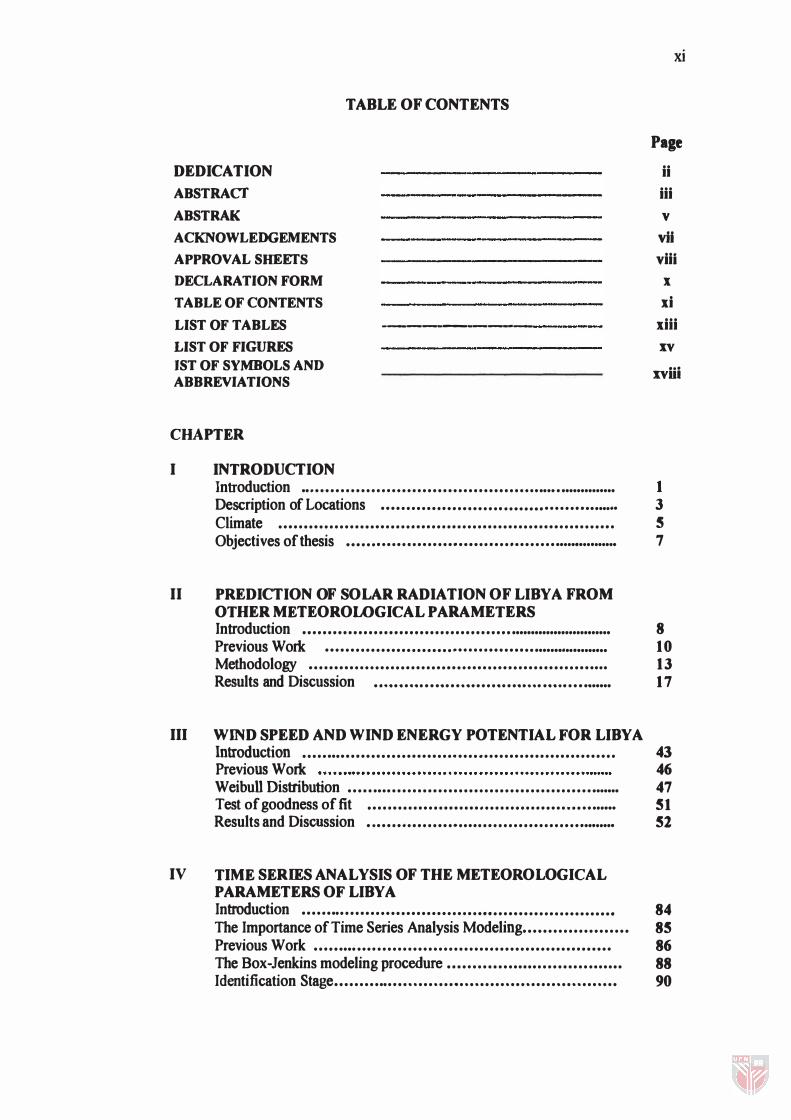
TABLE OF CONTENTS
DEDICATION
ABSTRACT
ABSTRAI<
ACKNOWLEDGEMENTS
APPROVAL SHEETS
DECLARATION FORM
TABLE OF CONTENTS
LIST OF TABLES -----------
LIST OF FIGURES 1ST OF SYMBOLS AND ABBREVIATIONS
CHAPTER
I INTRODUCTION
II
III
IV
Introduction •• ., ••••••••••••••.•••••••••••••••••.••••••••••••••••••••••••••.•••
Description of Locations ................................................
Climate •....••.•••.•...•••...•..•............•.....•...••.......•..•••...
Objectives of thesis ............ . ......... .......... . ........................
PREDICTION OF SOLAR RADIATION OF LIBYA FROM OTHER METEOROLOGICAL PARAMETERS
................................................................... Introduction Previous Work Methodology
......................... . ..................................
.............•.•.••.....•.•..•.....••...•..........•.......
Results and Discussion ................................................
WIND SPEED AND WIND ENERGY POTENTIAL FOR LIBYA •••.•..•......•.•.•.•......•......•........................... Introduction
Previous Work WeibuU Distribution •••••••••••••••••••••••••••••••••••••••••••••••••••••••
Test of goodness of fit Results and Discussion
•......•..............•.•....•.....•....••........
...................................................
TIME SERIES ANALYSIS OF THE METEOROLOGICAL PARAMETERS OF LIBYA Introduction ....................•.................•.......................
The Importance of Time Series Analysis Modeling •••••••••••••••••••••
Previous Work ••.•••••••••.••••••••••••••••••••••••••••••••••••••..•••••.
The Box-Jenkins modeling procedure ••••.••••••••••••••••••••••••••••••
Identification Stage ••••••••••••.•••••••••••••••••••••••••••••••••••••••••••
xi
Page
ii
iii
v
vii viii
x
xi
xiii
xv ... xvw
1 3 5 7
8 10 13 17
43 46 47 51 52
84 85 86 88 90
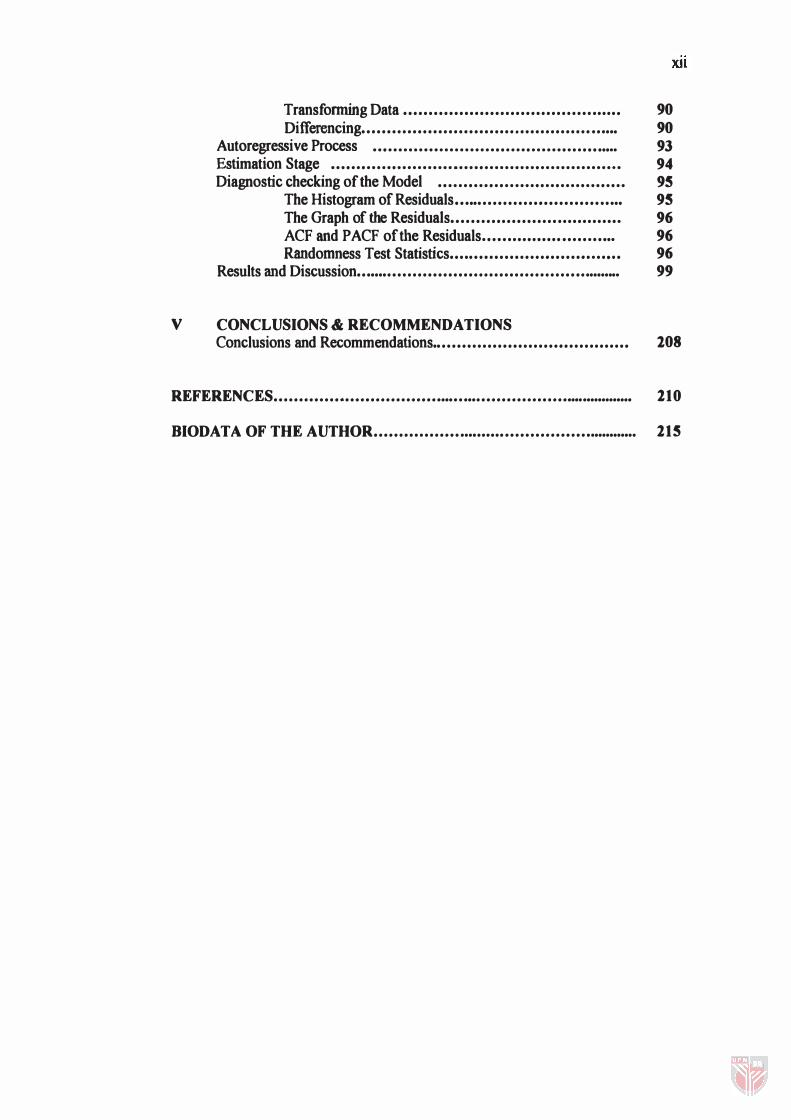
Transfomt.ing Data .......................................... .
Differencing .................................................. .
Autoregressive Process Estimation Stage
..•.....................••....•......•.•.••••••..
...•..•.....•................•..........•.............. ,.
Diagnostic checking of the Model .•....•...•.•......••..•....•...•.•..
The Histogram of Residuals ••••••••••••••••••••••••••••••••••
The Graph of the Residuals ................................. .
ACF and PACF of the Residuals .••••••••••••••• •••••.••••.
Randomness Test Statistics ••••••••••••••••••••••••••••.•••••
Results an.d Discussion ..................................................... ..
V CONCLUSIONS & RECOMMENDATIONS Conclusions and Recommendations. ••••••••••••••••••••••••••••••••••••••
REFERENCES ........................................................................... .
BIODATA OF THE AUTHOR ....................................................... .
Xli
90 90 93 94 95 95 96 96 96 99
108
210
215
xiii
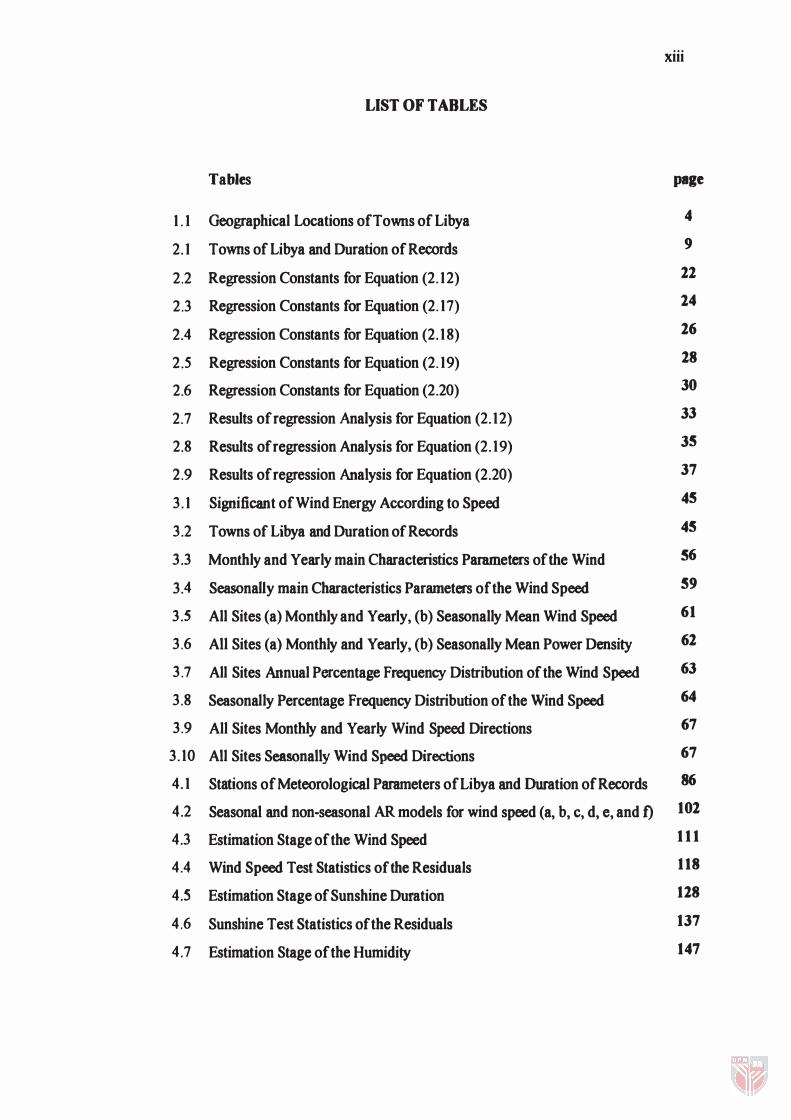
LIST OF TABLES
Tables page
1.1 Geographical Locations of Towns of Libya 4 2.1 Towns of Libya and Duration of Records 9 2.2 Regression Constants for Equation (2.12) 22 2.3 Regression Constants for Equation (2.17) 14 2.4 Regression Constants for Equation (2.18) 26 2.5 Regression Constants for Equation (2.19) 28 2.6 Regression Constants for Equation (2.20) 30 2.7 Results of regression Analysis for Equation (2.12) 33 2.8 Results of regression Analysis for Equation (2.19) 3!§ 2.9 Results of regression Analysis for Equation (2.20) 37 3.1 Significant of Wind Energy According to Speed 4!§ 3.2 Towns of Libya and Duration of Records 4!§ 3.3 Monthly and Yearly main Characteristics Parameters of the Wind !§6 3.4 Seasonally main Characteristics Parameters of the Wind Speed 59 3.5 All Sites (a) Monthly and Yearly, (b) Seasonally Mean Wind Speed 61 3.6 All Sites (a) Monthly and Yearly, (b) Seasonally Mean Power Density 62 3.7 All Sites Annual Percentage Frequency Distribution of the Wind Speed 63 3.8 Seasonally Percentage Frequency Distribution of the Wind Speed 64 3.9 All Sites Monthly and Yearly Wind Speed Directions 67 3.10 All Sites Seasonally Wind Speed Directions 67 4.1 Stations of Meteorological Parameters of Libya and Duration of Records 86 4.2 Seasonal and non-seasonal AR models for wind speed (a, b, c, d, e, and f) 102 4.3 Estimation Stage of the Wind Speed 111 4.4 Wind Speed Test Statistics of the Residuals 118 4.5 Estimation Stage of Sunshine Duration 128 4.6 Sunshine Test Statistics of the Residuals 137 4.7 Estimation Stage of the Humidity 147

xiv
4.8 Humidity Test Statistics of the Residuals 156
4.9 Estimation Stage of the Tempemture 166
4.10 Temperature Test Statistics of the Residuals 175
4.11 Estimation Stage of the Rainfall 181 4.12 Rainfall Test Statistics of the Residuals 188 4.13 Estimation Stage of the Solar Radiation 198 4.14 Solar Radiation Test Statistics of the Residuals 107
xv
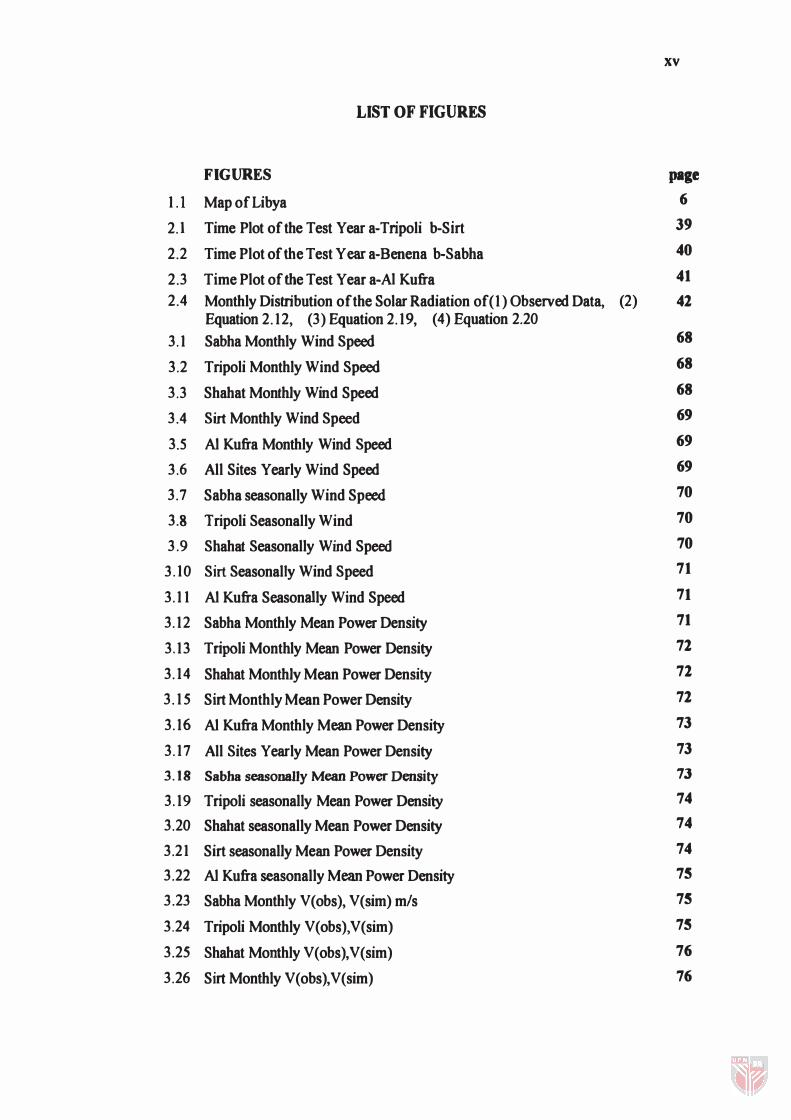
LIST OF FIGURES
FIGURES page 1.l Map of Libya 6 2.1 Time Plot of the Test Year a-Tripoli b-Sirt 39 2.2 Time Plot of the Test Year a-Benena b-Sabha 40 2.3 Time Plot of the Test Year a-AI Kufra 41 2.4 Monthly Distribution of the Solar Radiation of(1) Observed Data, (2) 42
Equation 2.12, (3) Equation 2.19, (4) Equation 2.20
3.1 Sabha Monthly Wind Speed 68 3.2 Tripoli Monthly Wind Speed 68 3.3 Shahat Monthly Wind Speed 68 3.4 Sirt Monthly Wind Speed 69 3.5 AI Kufra Monthly Wind Speed 69 3.6 All Sites Yearly Wind Speed 69 3.7 Sabha seasonally Wind Speed 70 3.8 Tripoli Seasonally Wind 70 3.9 Shahat Seasonally Wind Speed 70 3.10 Sirt Seasonally Wind Speed 71 3.11 AI Kufra Seasonally Wind Speed 71 3.12 Sabha Monthly Mean Power Density 71 3.13 Tripoli Monthly Mean Power Density 72 3.14 Shahat Monthly Mean Power Density 72 3.15 Sirt Monthly Mean Power Density 72 3.16 AI Kufra Monthly Mean Power Density 73 3.17 All Sites Yearly Mean Power Density 73 3.18 Sabba seasonally Mean Power Density 73 3.19 Tripoli seasonally Mean Power Density 74 3.20 Shahat seasonally Mean Power Density 74 3.21 Sirt seasonally Mean Power Density 74 3.22 AI Kufra seasonally Mean Power Density 75 3.23 Sabha Monthly V(obs), V(sim) mls 75 3.24 Tripoli Monthly V(obs),V(sim) 75 3.25 Shahat Monthly V(obs),V(sim) 76 3.26 Sirt Monthly V(obs),V(sim) 76
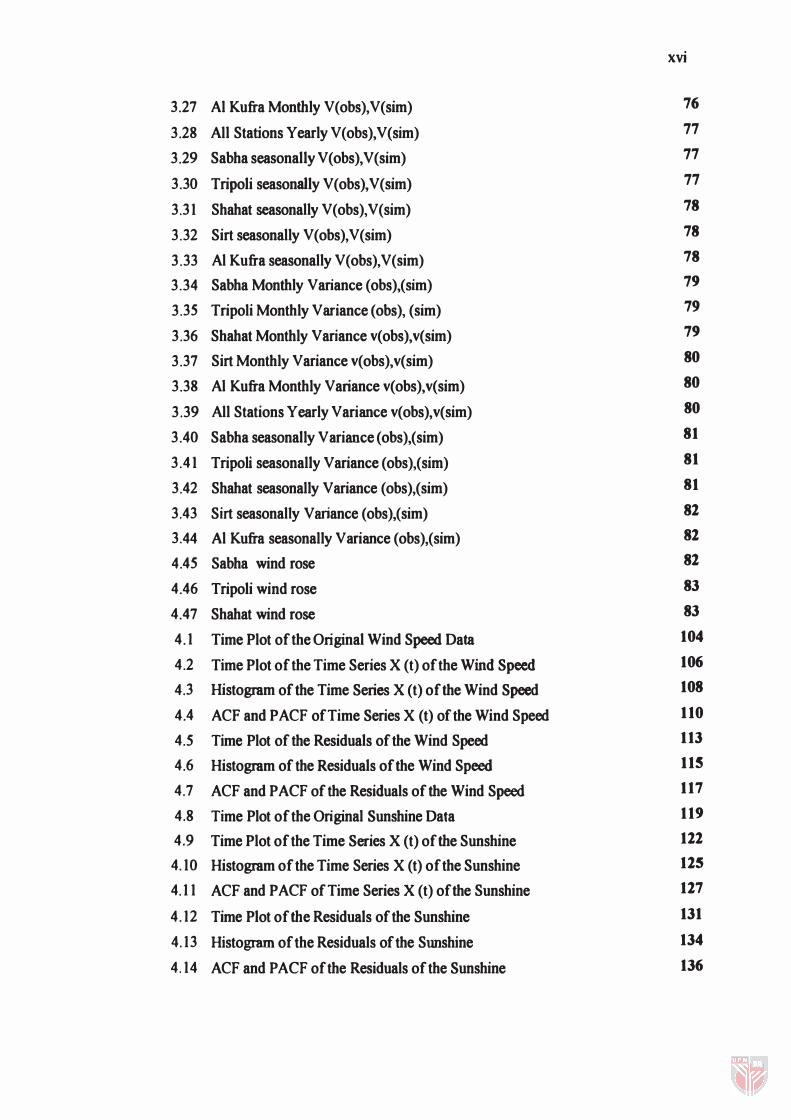
xvi
3.27 Al Kufra Monthly V(obs),V(sim) 76 3.28 All Stations Yearly V(obs),V(sim) 77 3.29 Sabha seasonally V(obs),V(sim) 77 3.30 Tripoli seasonally V(obs),V(sim) 77 3.31 Shahat seasonally V(obs),V(sim) 78 3.32 Sirt seasonally V(obs),V(sim) 78 3.33 Al Kufra seasonally V(obs),V(sim) 78 3.34 Sabha Monthly Variance (obs),(sim) 79 3.35 Tripoli Monthly Variance (obs), (sim) 79 3.36 Shahat Monthly Variance v(obs),v(sim) 79 3.37 Sirt Monthly Variance v(obs),v(sim) 80 3.38 Al Kufra Monthly Variance v(obs),v(sim) 80 3.39 All Stations Yearly Variance v(obs),v(sim) 80 3.40 Sabha seasonally Variance (obs),(sim) 81 3.41 Tripoli seasonally Variance (obs),(sim) 81 3.42 Shahat seasonally Variance (obs),(sim) 81 3.43 Sirt seasonally Variance (obs),(sim) 82 3.44 Al Kufra seasonally Variance (obs),(sim) 82 4.45 Sabha wind rose 82 4.46 Tripoli wind rose 83 4.47 Shahat wind rose 83 4.1 Time Plot of the Original Wind Speed Data 104 4.2 Time Plot of the Time Series X (t) of the Wind Speed 106 4.3 Histogram of the Time Series X (t) of the Wind Speed 108 4.4 ACF and PACF of Time Series X (t) of the Wind Speed 110 4.5 Time Plot of the Residuals of the Wind Speed 113 4.6 Histogram of the Residuals of the Wind Speed 115 4.7 ACF and PACF of the Residuals of the Wind Speed 117 4.8 Time Plot of the Original Sunshine Data 119 4.9 Time Plot of the Time Series X (t) of the Sunshine 122 4.10 Histogram of the Time Series X (t) of the Sunshine 125 4.11 ACF and PACF of Time Series X (t) of the Sunshine 127 4.12 Time Plot of the Residuals of the Sunshine 131 4.13 Histogram of the Residuals of the Sunshine 134 4.14 ACF and P ACF of the Residuals of the Sunshine 136
XVll
4.15 Time Plot of the Original Humidity Data 138 4.16 Time Plot of the Time Series X (t) of the Humidity 141 4.17 Histogram of the Time Series X (t) of the Humidity 144 4.18 ACF and PACF of Time Series X (t) of the Humidity 146 4.19 Time Plot of the Residuals of the Humidity 150 4.20 Histogram of the Residuals of the Humidity 153 4.21 ACF and P ACF of the Residuals of the Humidity 155 4.22 Time Plot of the Original Temperature Data 157 4.23 Time Plot of the Time Series X (t) of the Temperature 160 4.24 Histogram of the Time Series X (t) of the Temperature 163 4.25 ACF and PACF of Time Series X (t) of the Temperature 165 4.26 Time Plot of the Residuals of the Temperature 169 4.27 Histogram of the Residuals of the Temperature 172 4.28 ACF and PACF of the Residuals of the Temperature 174 4.29 Time Plot of the Original Rainfall Data 176 4.30 Time Plot of the Time Series X (t) of the Rainfall 178 4.31 Histogram of the Time Series X (t) of the Rainfall 180 4.32 ACF and PACF of Time Series X (t) of the Rainfall 181 4.33 Time Plot of the Residuals of the Rainfall 184 4.34 Histogram of the Residuals of the Rainfall 186 4.35 ACF and P ACF of the Residuals of the Rainfall 187 4.36 Time Plot of the Original Solar Radiation Data 189 4.37 Time Plot of the Time Series X (t) of the Solar Radiation 192 4.38 Histogram of the Time Series X (t) of the Solar Radiation 195 4.39 ACF and PACF of Time Series X (t) of the Solar Radiation 197 4.40 Time Plot of the Residuals of the Solar Radiation 201 4.41 Histogram of the Residuals of the Solar Radiation 204 4.42 ACF and PACF of the Residuals of the Solar Radiation 206
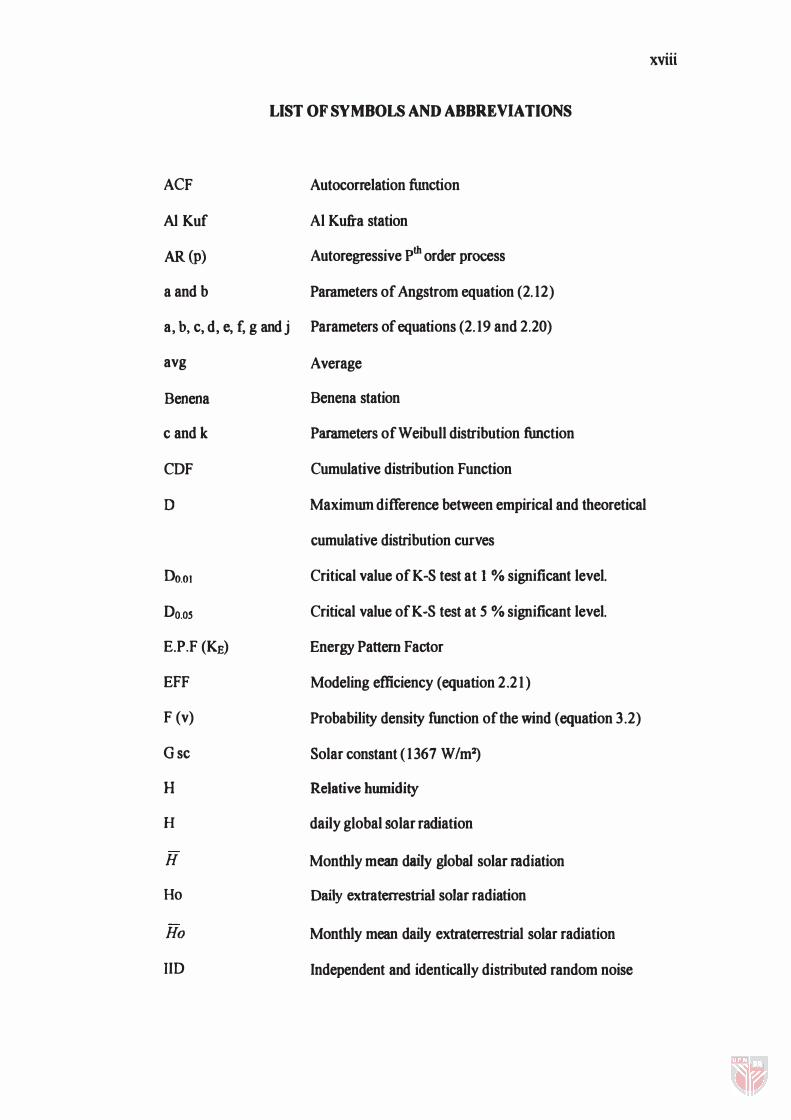
LIST OF SYMBOLS AND ABBREVIATIONS
ACF Autocorrelation ftmction
AI Kuf Al Kufra station
AR (P) Autoregressive pth order process
a and b Parameters of Angstrom equation (2. 12)
a, b, c, d, e, f, g and j Parameters of equations (2. 19 and 2.20)
avg Average
Benena Benena station
c and k Parameters of Wei bull distribution ftmction
CDF Cumulative distribution Function
o Maximum difference between empirical and theoretical
cumulative distribution curves
00.01
Do.os
E.P.F (KE)
EFF
F (v)
Gsc
H
H
H
Ho
Ho
lID
Critical value of K-S test at I % significant level.
Critical value ofK-S test at 5 % significant level.
Energy Pattern Factor
Modeling efficiency (equation 2.2 1 )
Probability density function of the wind (equation 3.2)
Solar constant ( 1367 W/m2)
Relative humidity
daily global solar radiation
Monthly mean daily global solar radiation
Daily extraterrestrial solar radiation
Monthly mean daily extraterrestrial solar radiation
Independent and identically distributed random noise
xviii
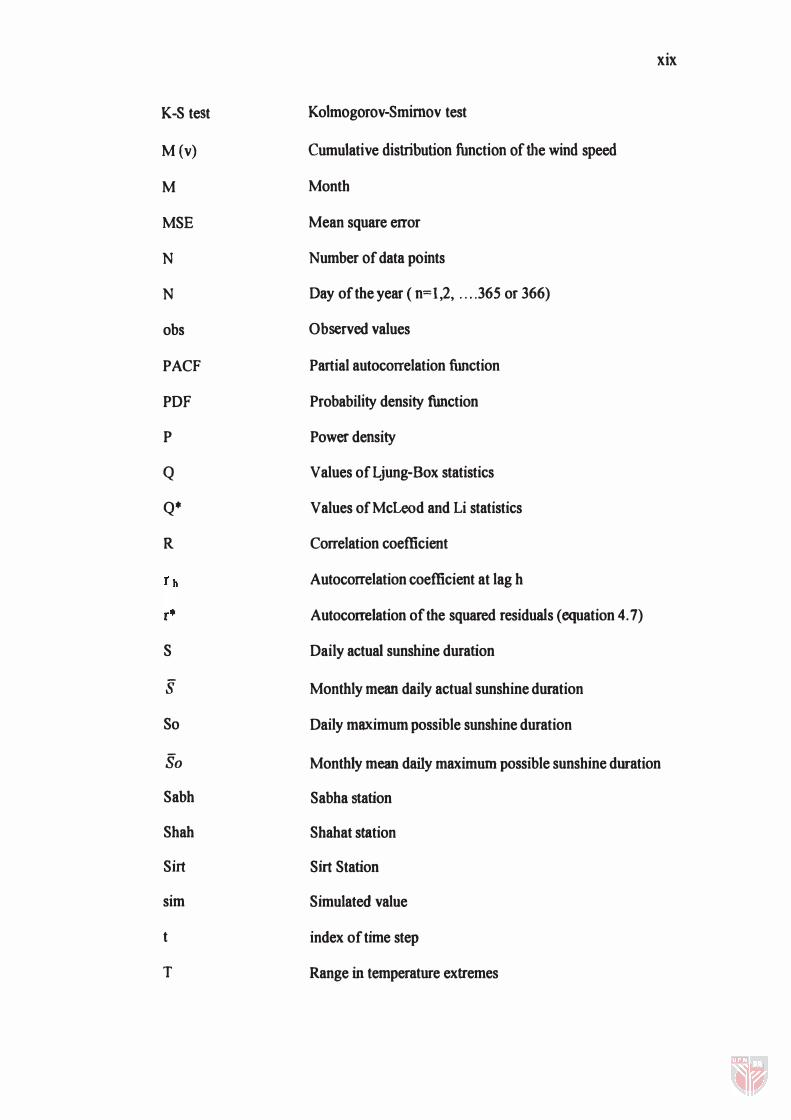
K-S test
M(v)
M
MSE
N
N
obs
PACF
P
Q
Q* R
S
S So
So Sabh
Shah
Sirt
sim
t
T
Kolmogorov-Smimov test
Cumulative distribution function of the wind speed
Month
Mean square error
Number of data points
Day of the year ( n=I,2, . . . . 365 or 366)
Observed values
Partial autocorrelation ftmction
Probability density function
Power density
Values of Ljung-Box statistics
Values of Mcleod and Li statistics
Correlation coefficient
Autocorrelation coefficient at lag h
Autocorrelation of the squared residuals ( equation 4.7)
Daily actual sunshine duration
Monthly mean daily actual sunshine duration
Daily maximum possible sunshine duration
xix
Monthly mean daily maximum possible sunshine duration
Sabha station
Shahat station
Sirt Station
Simulated value
index of time step
Range in temperature extremes
xx
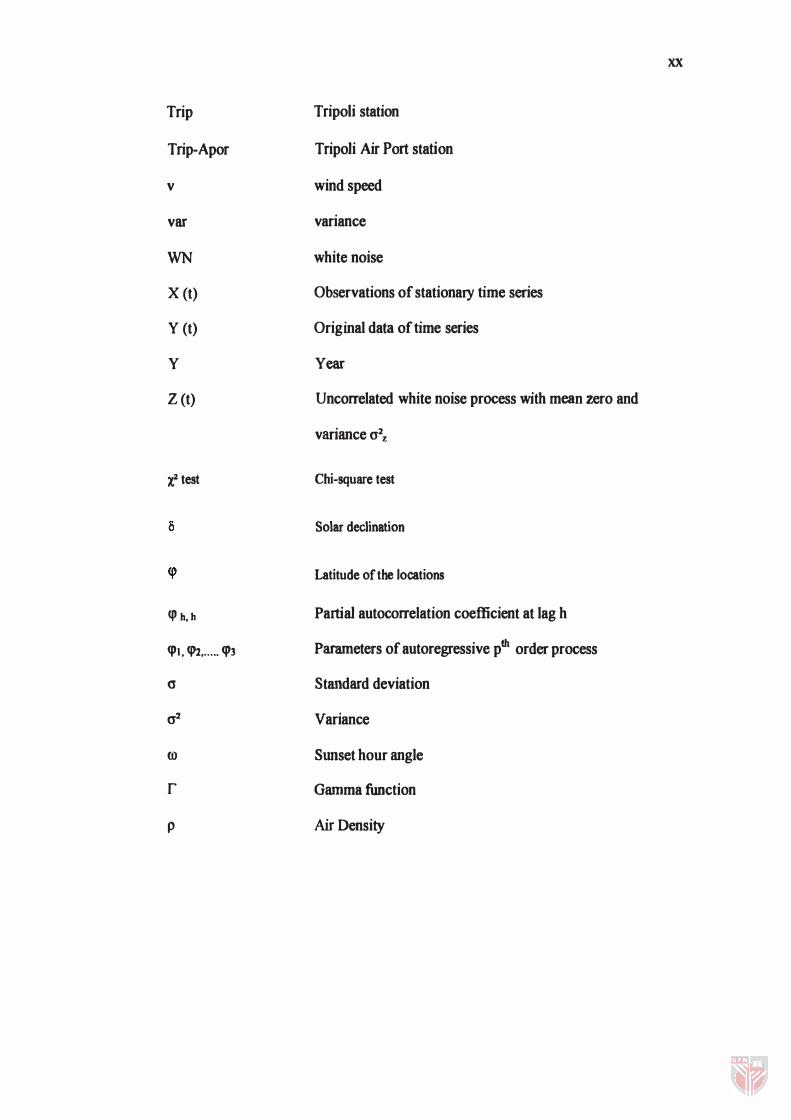
Trip Tripoli station
Trip-Apor Tripoli Air Port station
v wind speed
var variance
WN white noise
X (t) Observations of stationary time series
Y (t) Original data of time series
Y Year
Z(t) Uncorrelated white noise process with mean zero and
variance {)'2 z
'1.2 test Chi-square test
Solar declination
Latitude of the locations
(!) h, h Partial autocorrelation coefficient at lag h
(!) I, (!)2, •.... CP3 Parameters of autoregressive pth order process
()' Standard deviation
{)'2 Variance
ro Sunset hour angle
r Gamma function
p Air Density
1
CHAPTER I
INTRODUCTION
During the past few decades the advanced technological nations of the world
have been engaged in an energy and resources race that has brought many countries
to the position of energy crises. Many developing countries have also been engaged
in this race during the last two decades or so. It is now widely recognized that the
fossil fuels and other conventional resources, presently used in generation of
electrical energy, may not be either sufficient or suitable to keep pace with the ever
increasing world demand for electrical energy. The prospects for meeting this
demand and avoiding a crisis in supply would be improved if new and alternative
energy sources could be developed. Fortunately many such sources exist.
Undoubtedly many of these would be exploited more and more in future.
Solar energy is the most abundant and constant stream of energy. It is
available directly (solar insulation) and indirectly (wind energy, ocean thermal
energy, geothermal energy, tidal energy, wave energy etc. etc.).
Magneto hydrodynamic systems, solar electric power plants, photovoItaic
cells, fuel cells, wind energy, geothermal energy, tidal-energy, ocean thermal energy
are important non-conventional energy sources. In addition to these the utilization of
algae, organic wastes, bio-gas, rice straw etc. as energy sources has also been
suggested and even used to some extent. Lot of research work pertaining to
generation of energy from controlled nuclear fusion is in progress at many places in
2
the world. Many scientists call it the ultimate energy source of the future. However
many others doubt the possibility of this energy source being available commercially
even after 3 or 4 decades. Development of the new energy sources and methods so
that they become commercially viable will require a substantial commitment of the
advanced teclmologically rich nations in future, Gupta (2001).
Research, development and demonstration efforts in renewable energy entail
frequent collections, analysis and transmission of information. Where information
takes the form of numerical data, it is necessary to employ appropriate data analysis
and representation teclmiques so as to ensure efficient information utilization. The
main goal of meteorological research on utilization of solar energy is to be able to
inform the projector, producer, and user of solar technical installations, how much of
solar energy is to be expected on the receiving surface of a certain orientation during
a certain period of time. Furthermore to use solar energy, information on air
temperature, wind, sunshine duration, relative humidity, etc, is also required. Global
solar radiation is essential in the design and study of solar energy conversion devices.
There are also other uses for such infonnation including agricultural studies and
meteorological forecasting.
Most of wind data models may be categorized into two types: descriptive
statistics and probabilistic distribution models. The first category are graphs or power
tables such as (speed histograms, speed or power duration curves and speed time
plots), whereas the second takes the form of concise analytic expressions such as
Weibull distribution. Majority of wind surveys contains both representations. Such
representations, while in themselves useful summaries of data values, consist of
transformed infonnation and do not contain the real time element; they are unable to
3
express wind speed dynamics explicitly in the time domain, a factor essential to
operational analysis of wind power systems. Furthermore, these representations,
apart from lending themselves to visual assessments, may not be adequate if indices
or parameters are called for in comparative studies of data sets form, for example two
sites or two periods of time. In fact, the need for a more appropriate model form
arises in common cases where a potential site is so located that wind data are
unavailable or insufficient: in such situations, techniques of data interpolation and
extrapolation in space, in addition to forecasting in time, are necessary.
Some applications of statistical techniques to the meteorological parameters
of Libya and Jordan are described in this thesis and it is hoped that these teclmiques
can be more widely adopted to complement existing procedures.
Description of Location and Climate of Libya
Libya, the fourth largest state in Africa, is located in North Africa and lies
between latitudes 33°N and approximately 200N and longitudes 9°E and 25°E. It
possesses a Mediterranean coastline of approximately 1820 Km in length. It is
bordered by Egypt to the east, Sudan to the south-east, Chad and Niger to the south
with Algeria and Tunisia to the west and north-west respectively. Libya has an area
of approximately 1 ,775,500 sq. km, 3 times the surface area of France, and a
population of about 4,500,000 (1 995), the capital city being Tarabulus (Tripoli).