universiti putra malaysia microstructures and … · menunjukan bahawa loncatan elektron adalah...
TRANSCRIPT
UNIVERSITI PUTRA MALAYSIA
MICROSTRUCTURES AND DIELECTRIC PROPERTIES OFPb (Al,Vl-,)Ohs SYSTEMS
WALTER CHARLES PRIMUS
FPSK(M) 2005 23

MICROSTRUCTURES AND DIELECTRIC PROPERTIES OF Pb(Al,Vl-,)Ohs SYSTEMS
BY
WALTER CHARLES PRIMUS
Thesis Submitted to the School of Graduate Studies, Universiti Putra Malaysia, in Fulfilment of the Requirements for the Degree of Master of Science
April 2005

DEDICATION
I dedicate this thesis to my family especially my beloved father and mother and also to all my friends.
Abstract of thesis presented to Senate of Universiti Putra Malaysia in fulfilment of the requirements for the degree of Master of Science
MICROSTRUCTURES AND DIELECTRIC PROPERTIES OF Pb(AIxV~-x)0~6 SYSTEMS
WALTER CHARLES PRIMUS
April 2005
Chairman: Professor Abdul Halim Bin Shaari, PhD
Faculty: Science
The microstructures and electrical properties of Pb(AlxV1-x)03*s ceramic have been
investigated. The samples were prepared using solid-state technique and were
sintered at 800 OC, 850 OC and 900 OC. Surface morphology studies show that small
grains with submicron size - 0.25 pm coexist with the bigger grains in micron size.
As the sintering temperature increased, the grains size increase and thus become
more compact. From )(RD analysis, the sample structure obtained is an orthorhombic
system with space group PMMA and unit cell volume is 469.595 A3.
The dielectric constant, e' for sample PAV 71800, PAV 71850 and PAV 71900
increased as the sintering temperature increased where the values of E' for sample
sintered at 900 O C is - 6000 at 10'~ Hz and - 90 at 1 kHz. However, the loss factor,
E" for sample sintered at 900 O C is higher than that of other samples. The loss
tangent, E"/E' for sample PAV 71800, PAV 71850 and PAV 71900 at 1 kHz are 0.1,
0.12 and 0.16 respectively. The PAV 0.9 shows the highest E' -4000 at Hz but
the E" for this sample is also high. This is followed by sample PAV 0.7 and PAV 0.3.
Between frequencies higher than 1 kHz, the magnitudes of the E' data dispersion (-
80) are similar for samples PAV 0.3, PAV 0.7 and PAV 0.9. At 1 0-2 Hz to 1 kHz, the
dispersion of E' is strongly dependent on frequency. However, the E' dispersion is
independent with frequency at 1 kHz to lo5 Hz. The mechanisms that are observed
from all samples are quasi dc, dipolar and barrier layer. A peak observed at lo2 Hz is
due to the ionic relaxation processes. The activation energy that is obtained from
sample PAV 71800 is 0.416. It indicates that the electrons hopping are weak. An
equivalent circuit model has been proposed to represent the mechanism observed.
The conductivity, o, is increased from 3.0x10-~ to 8.0x10-~ rnholm for sample PAV
71800 and PAV 71900 respectively. For other samples with different Al composition,
o, increased from 1.0x10-~ to 1.0x10-~ mholm for sample PAV 0.3 and PAV 0.9
respectively. The o, curve exhibits two distinct regions where the low frequency
region is weakly dependent on frequency due to free charge carriers while the high
frequency region is strongly dependent with frequency due to bound charge carriers
in this sample. The IS, is increased from to lo4 mholm for 50 O C and 290 "C
respectively. The activation energy of sample PAV 71800 and PAV 0.1 is -0.65 eV
and may be due to the ac conduction in terms of hopping transport of charge carrier
in a narrow band of localization states as the Fermi level.
In complex impedance plots, only one semicircle is observed at low frequency and
does not started fiom the origin due to the high frequency resistance effect. For
sample PAV 71800, the resistance obtained from the plot is 8 . 9 9 ~ 1 0 ~ ohm/m and the
value of the capacitance is 1.5x10-'~ F. The capacitance value obtained is in the range
of bulk ferroelectric mechanism. In direct current measurement, the curve obtained
obeyed the Ohm's law and the activation energy increased from 0.85 eV to 1.15 eV

WWS'MKAAN SULTAN AEDUL w -'TI PUTRA w y s u
as the sintering temperature increases from 800 O C to 900 O C and 0.71 eV to 1.62 eV
when A1 compositions increase from PAV 0.1 to PAV 0.9.
Abstrak tesis yang dikemukakan kepada Senat Universiti Putra Malaysia sebagai memenuhi keperluan untuk ijazah Master Sains
MICROSTRUKTUR DAN SWAT DIELEKTRIK BAG1 SISTEM Pb(4Vl-x)Oas
Oleh
WALTER CHARLES PRDlZTS
April 2005
Pengurusi: Professor Abdul Halim Bin Sbaari, PhD
Fakulti: Sains
Mikrostruktur dan sifat elektrik bagi cerarnik Pb(AIxV1-,)03G telah dikaji. Sampel
tersebut disediakan menggunakan teknik keadaan pepejal dm disinter pada 800 OC,
850 OC dan 900 "C. Kajian morfologi perrnukaan menunjukkan butiran kecil bersaiz
submikron -0.25 pm wujud bersama dengan butiran besar bersaiz mikron.
Peningkatan suhu sinteran menyebabkan saiz butiran bertarnbah besar dan seterusnya
menjadi lebih padat. Daripada analisis XRD, struktur sampel ialah sistem
orthorhombik dengan kumpulan ruang PMMA dan isipadu sel unit 469.595 A3.
Pemalar dielektrik, E' bagi sampel PAV 71800, PAV 71850 dan PAV 71900
meningkat dengan peningkatan suhu sinteran di mana nilai E' bagi sampel yang
disinter pada 900 OC adalah - 6000 pada Hz dan - 90 pada 1 kHz. Walau
bagaimanapun, faktor kehilangan, E" bagi sarnpel disinter pada 900 OC adalah tinggi
berbanding sampel yang lain. Nilai bagi kehilangan tangen, &"I E' bagi sampel PAV
71800, PAV 71850 dan PAV 7/900 masing-masing adalah 0.1, 0.12 dan 0.16 pada
1kHz. Sampel PAV 0.9 menunjukan nilai tertinggi E' -4000 pada Hz tetapi E"
bagi sampel ini juga tinggi. Ini diikuti oleh sampel PAV 0.7 dan PAV 0.3. Pada
friquensi tinggi daripada 1 kHz, magnitud bagi taburan data E' (- 80) adalah sama
untuk sampel PAV 0.3, PAV 0.7 dan PAV 0.9. Diantara 1 0 ' ~ Hz hingga I kHz,
taburan E' sangat bergantung pada frequensi. Walau bagaimanapun, taburan E' tidak
bergantung pada frequensi pada 1 kHz hingga lo5 Hz. Mekanisme yang diperolehi
daripada semua sampel ialah quasi dc, dwikutub dan lapisan halangan. Puncak yang
didapati pada lo2 Hz adalah disebabkan oleh proses relaksasi ionik. Tenaga
pengaktifan yang diperolehi daripada sampel PAV 71800 ialah 0.416 eV. Ini
menunjukan bahawa loncatan elektron adalah lemah. Model litar setara telah
dicadangkan untuk mewakilkan mekanisme yang diperolehi.
Peningkatan konduktiviti, o, daripada 3.0x10-* kepada 8.0x10-~ rnholm bagi sampel
masing-masing PAV 71800 dan PAV 71900. Bagi sampel yang lain dengan
komposisi Al berbeza, peningkatan o, dari 1.0x10-~ kepada 1.0x10-~ mholm bagi
sampel masing-masing PAV 0.3 dan PAV 0.9. Lengkok ox juga menunjukan dua
bahagian di mana bahagian frequensi rendah bergantung secara lemah pada frekuensi
disebabkan oleh pembawa cas bebas manakala bahagian frekuensi tinggi sangat
bergantung pada frekuensi disebabkan oleh pembawa cas terikat dalarn sampel ini.
ox meningkat daripada kepada lo6 rnholm masing-masing dan bagi 50 O C dan
200 O C . Tenaga pengaktifan bagi sampel PAV 71800 dan PAV 0.1 ialah pada -0.65
eV dan h i mungkin disebabkan oleh kekonduksian ac bagi pengangkutan loncatan
oleh pembawa cas dalam jalur tenaga yang sempit bagi keadaan setempat seperti
paras Fenni.
Dalam plot impedant komplex, terdapat satu semi-bulatan diperolehi pada frequenci
rendah d m tidak bermula daripada asalan disebabkan oleh kesan rintangan fiequensi
VII
tinggi. Bagi sampel PAV 71800, rintangan yang diperolehi daripada plot tersebut
ialah 8 . 9 9 ~ 1 0 ~ o h d m dan nilai kapasitan ialah 1 . 5 ~ 1 0 - ' ~ F. Nilai kapasitan yang
dicerap ialah di dalarn julat mekanisme ferroelektrik. Dalam pengukuran arus terus,
data yang diperolehi mematuhi hukum Ohm dm tenaga pengaktifannya meningkat
daripada 0.85 eV kepada 1.15 eV apabila suhu sinteran meningkat dari 800 O C
kepada 900 O C dan 0.71 eV kepada 1.62 eV apabila komposisi Al bertambah dari
PAV 0.1 kepada PAV 0.9.

ACKNOWLEDGEMENTS
First and foremost I would like to express my utmost gratitude to Prof. Dr. Abdul
Halim Shaari, Assoc. Prof. Dr. Wan Mohd. Daud Wan Yusoff and Assoc. Prof. Dr.
Zainal Abidin Talib for their constant monitoring, supporting, encouragement and
sponsoring during the period of research. Working with them has provided me with a
vast understanding on the materials science and theoretical experiences from which I
will continue to draw benefit in the future.
I would like to thank to Dr. Jumiah Hassan, Dr. Iftetan, Dr. Lim Kean Pah, Dr.
Abdulah Cik, Dr. Kabashi, Mrs. Ari, Mrs. Jannah, Mrs. Masriani, Mr. Somsamthat,
INFOPORT staff, XRD lab officer and all my lab-mates for their tremendous
assistance and support throughout this study.
My appreciation also goes to my closest friend Clifford, Jerome, Constantine,
Cornelius, Syamsuar, and Tini, and also to my housemate and state-mate for their
support and encouragement.
Finally, the most appreciation I would like to express to my family especially to my
father, Charles Prirnus and my mother, Margaret Pang Sue Yin, my aunt, my uncle
and my cousins for their support, encouragement and prayer.

I certify that an Examination Committee met on 1 4 ~ ~ April 2005 to conduct the final examination of Walter Charles Primus on his Master of Science thesis entitled "Microstructures and Dielectric Properties of Pb(AI,V1-,)03*s Systems" in accordance with Universiti Pertanian Malaysia (Higher Degree) Act 1980 and Universiti Pertanian Malaysia (Higher Degree) Regulations 198 1. The Committee recommends that the candidate be awarded the relevant degree. Members of the Examination Committee are as follows:
SIDEK ABDUL AZIZ, PhD Associate Professor Faculty of Science Universiti Putra Malaysia (Chairman)
JUMIAH HASSAN, PhD Faculty of Science Universiti Putra Malaysia (Internal Examiner)
NOORHANA YAHYA, PhD Faculty of Science Universiti Putra Malaysia (Internal Examiner)
IBRAHIM ABU TALIB, PhD Professor Faculty of Science and Technology Universiti Kebangsaan Malaysia (External Examiner)
HMAT ALI, PhD
School of ~ radua te Studies Universiti Putra Malaysia
I9 MAY 2005
This thesis submitted to the Senate of Universiti Putra Malaysia and has been accepted as fulfillment of the requirement for the degree of Master of Science. The members of the Supervisor Committee are as follows:
ABDUL HALIM SHAARI, PhD Professor Faculty of Science Universiti Putra Malaysia (Chairman)
WAN MOFID. DAUD WAN YUSOFF, PhD Associate Professor Faculty of Science Universiti Putra Malaysia (Member)
ZAINAL ABIDIN TALIB, PhD Associate Professor Faculty of Science Universiti Putra Malaysia (Member)
AINI IDERIS, PhD Professor/Dean School of Graduate Studies Universiti Putra Malaysia
Date: 0 9 JUN ZOOS

DECLARATION
I hereby declare that the thesis is based on my original work except for quotations and citations which have been duly acknowledged. I also declare that it has not been previously or concurrently submitted for any other degree at UPM or other institutions.
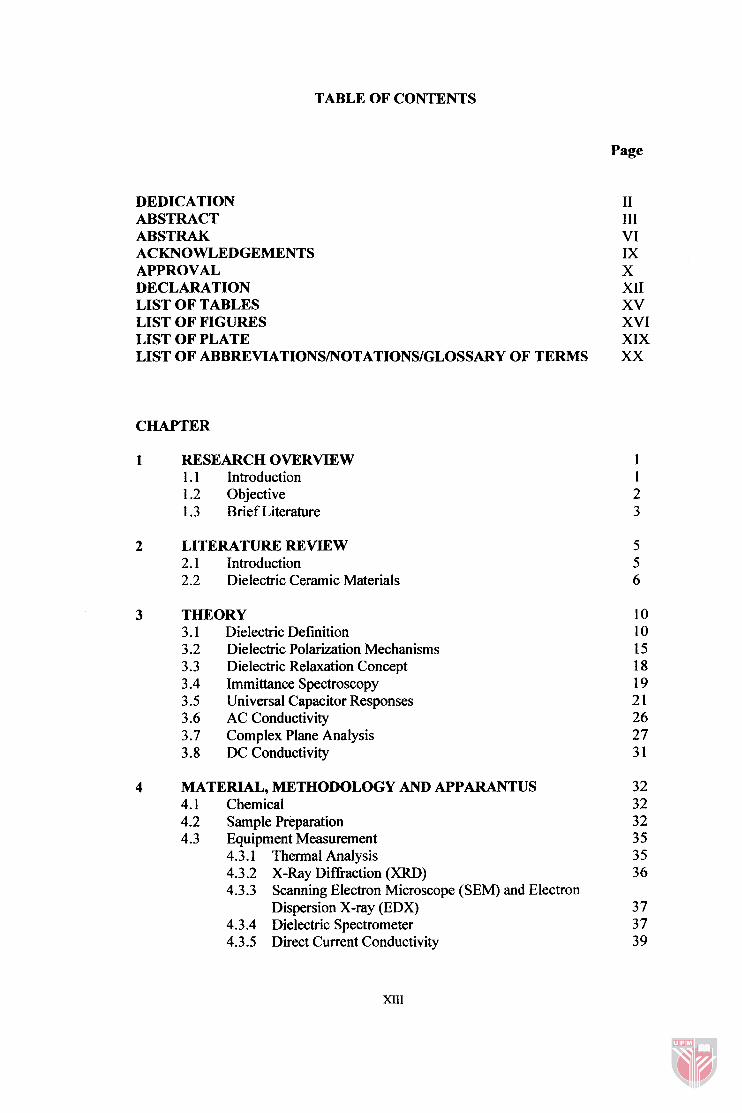
TABLE OF CONTENTS
Page
DEDICATION ABSTRACT ABSTRAK ACKNOWLEDGEMENTS APPROVAL DECLARATION LIST OF TABLES LIST OF FIGURES LIST OF PLATE LIST OF ABBREVIATIONSNOTATIONS/GLOSSARY OF TERMS
CHAPTER
RESEARCH OVERVIEW 1 . 1 Introduction 1.2 Objective 1.3 Brief Literature
LITERATURE REVIEW 2.1 Introduction 2.2 Dielectric Ceramic Materials
THEORY 3.1 Dielectric Definition 3.2 Dielectric Polarization Mechanisms 3.3 Dielectric Relaxation Concept 3.4 Immittance Spectroscopy 3.5 Universal Capacitor Responses 3.6 AC Conductivity 3.7 Complex Plane Analysis 3.8 DC Conductivity
MATERIAL, METHODOLOGY AND APPARANTUS 4.1 Chemical 4.2 Sample Preparation 4.3 Equipment Measurement
4.3.1 Thermal Analysis 4.3.2 X-Ray Difiaction (XRD) 4.3.3 Scanning Electron Microscope (SEM) and Electron
Dispersion X-ray (EDX) 4.3.4 Dielectric Spectrometer 4.3.5 Direct Current Conductivity
I1 111 VI IX X XI1 xv XVI XIX XX
Experiment Error
RESULTS AND DISCUSSION I Termal Analysis and Microstructural Properties 5.1 Introduction 5.2 Thermal Analysis For Pb(A11,2V1/2)03 Ceramic 5.3 Structural Analysis 5.4 Surface Morphology
5.4.1 Surface morphology of different sintering temperatures 5.4.2 Surface morphology after annealing in air and oxygen 5.4.3 Surface morphology of different composition Element Analysis 5.5.1 Element analysis in different sintering temperature 5.5.2 Element analysis in different composition
RESULTS AND DISCUSSION I1 Dielectric Properties 6.1 Introduction 6.2 Frequency Dependence of Dielectric Permittivity 6.3 Frequency Permittivity of Annealed Samples 6.4 Dielectric Response With Equivalent Circuit Modeling 6.5 AC Conductivity in Frequency Domain 6.6 Complex Plane Analysis 6.7 DC Conductivity Measurement
7 CONCLUSION AND SUGGESTION
REFERENCES APPENDICES BIODATA OF THE AUTHOR
LIST OF TABLES
Table Page
3.1 The summary of various spectral functions and their power low exponents.
3.2 Capacitance values and their possible interpretation.
4.1 Chemicals list.
4.2 The first series of PAV sample's preparation.
4.3 The second series of PAV samples preparation.
5.1 The axial lengths and angles for orthorhombic system.
5.2 Atomic % for each element at four spectrums for sample PAV 71800 (a), PAV 71850 (b) and PAV 71900 (c).
5.3 The atomic % for each element for sample (a) PAV 0.1, (b) PAV 0.3, (c) PAV 0.7 and (d) PAV 0.9.
3.9 The fitting values for sample PAV 71800, PAV 71850 and PAV 71900.
6.2 Parameter value for fitting experimental data for sample PAV 0.1, PAV 0.3, PAV 0.7 and PAV 0.9.
6.3 Parameter value for fitting experimental data for sample PAV 71800.
6.4 Parameter value for fitting experimental data for sample PAV 0.1.
6.5 Parameter value for fitting the experimental data in Figure 6.17.
6.6 Fitting parameter for ac conductivity of sample PAV 0.1 at four different temperatures.
6.7 Fitted values for the complex impedance plots for samples PAV 71800, PAV 71850, and PAV 71900 at different sintering temperatures.
6.8 Fitted values for the complex impedance plots for sample PAV 71850 at various temperatures.
LIST OF FIGURES
Figure
2.1 Structure of ordered perovskite Pb(SclnTaln)O3.
3.1 Condenser in vacuum (a) and filled with dielectric materials (b) connected to a source of steady voltage.
3.2 The various types of interaction between the electromagnetic field and matter and the relevant relative permittivity.
3.3 The polarization process with no electric field and with applied electric field.
3.4 Dielectric relaxation spectra showed the single relaxation time.
3.5 The quasi dc dispersion and its circuit element.
3.6 The dipolar dispersion and its circuit element.
3.7 The barrier layer dispersion and its circuit element.
3.8 The general classification of all types of dielectric responses found in solids.
3.9 (a) Schematic representation of a typical impedance diagram. The semi-circle arc inclined at an angle nd2. (b) Circuit element representing the impedance diagram in (a).
4.1 Schematic representation of the dielectric spectrometer.
5.1 Thermal analysis for sample PAV.
5.2 (a) is the XRD patterns and (b) is the peak lines for sample Pb(Alll~Vl~)O3 at different sintering temperatures.
5.3 XRD pattern with indexing for sample Pb(AllnV112)03 sintered at 850 O C .
6.1 Log permittivity versus log frequency for three sintering temperatures for sample PAV.
6.2 Log permittivity versus log frequency for different composition of sample PAV.
6.3 Graph of double log permittivity versus frequency for sample PAV 71800 at different temperatures.
Page
9
6.4 Graph of double log permittivity versus frequency for sample PAV 0.1 at different temperatures.
6.5 Complex dielectric permittivity versus frequency for sample PAV 71800 annealed at 750 OC in oxygen and air.
6.6 Complex dielectric permittivity versus frequency for sample PAV 71850 annealed at 750 OC and 800 "C in oxygen and air.
6.7 Complex dielectric permittivity versus frequency for sample PAV 71900 annealed at 750 OC, 800 OC and 850 OC in oxygen and air.
6.8 Fitted graph of double log C1(w) and C"(w) versus frequency for sample PAV 71800, PAV 71850 and PAV 71900 .
6.9 The circuit model represents the response mechanism polarization for samples different sintering temperature at room temperature.
6.10 Fitted graph of double log C1(w) and C"(w) versus frequency for sample PAV 0.1, PAV 0.3, PAV 0.7 and PAV 0.9 measured at room temperatures.
6.1 1 Fitted graph of double log C1(o) and C"(o) versus frequency for sample PAV 71800 at different temperatures.
6.12 The circuit model represents the response mechanism polarization in samples PAV 71800 at 200 OC.
6.13 Arrhenius plot for In f, versus temperature for sample PAV 71800.
6.14 Fitted graph of double log C1(w) and CU(o) versus frequency for sample PAV 0.1 at different temperatures.
6.15 The circuit model represents the curve in Figure 6.14.
6.16 Arrhenius plot for In f c versus temperature for sample PAV 0.1.
6.17 Fitted graph of double log C1(o) and C"(o) versus frequency for uncoated sample PAV 71800 at 50 OC.
6.18 The circuit model represents the curve in Figure 6.17.
6.19 Graph of log ac conductivity versus log frequency for sample PAV 71800, PAV 71850, and PAV 71900.
XVII
6.20 Graph of log ac conductivity versus log frequency for sample PAV 0.3, PAV 0.7 and PAV 0.9.
6.2 1 (a) Graph of log ac conductivity versus log frequency in the hnction of temperatures for sample PAV 71800. (b) Arrhenius plots of the ac conductivity at three different frequencies.
6.22 (a) Graph of log ac conductivity versus log frequency in the function of temperatures for sample PAV 0.1. (b) Arrhenius plots of the ac conductivity at 1.0 Hz.
6.23 Circuit element represented equation by (6.1), which is used to fit the ac conductivity curve in Figure 6.22(a).
6.24 Activation energy for sample PAV 0.1 obtained from w, in Table 6.6.
6.25 Complex impedance plots for sample (a) PAV 71800, (b) PAV 71850, and (c) PAV 71900 at room temperature.
6.26 Combined Z" and M" plots as a function of frequency for sample (a) PAV 71800, (b) PAV 71850, and (c) PAV 71900 at room temperature.
6.27 Circuit model representing the semi-circle in Figure 6.25(a to c).
6.28 Complex impedance plots for sample PAV 71850 at various temperatures.
6.29 Combined Z" and M" plots as a h c t i o n of frequency for sample PAV 71850 at various temperature.
6.30 Resistance versus temperatures for sample at different sintering (a) and compositions (b). 114
6.3 1 Graph of Arrhenius plot for In od, versus temperatures at 5 volt for samples at different sintering temperatures (a) and A1 compositions (b). 116
A. 1 Conversion of X-ray signals into a voltage 'ramp' by the EDS detector.
A.2 Diagram of measured reflection for sample PAV 71850.
A.3 Spectrum for sample PAV 71800.
A.4 Spectrum for sample PAV 71850.
AS Spectrum for sample PAV 71900.
LIST OF PLATES
Plate
5.1 The surface morphology of sample PAV 71800, PAV 71850 and PAV 71900.
5.2 The surface morphology of sample PAV 71800 was annealed at 750 O C in (a) oxygen and (b) in air.
5.3 The surface morphology of sample PAV 71850 was annealed at 750 O C (a) in oxygen and (b) in air and 800 "C (c) in oxygen and (d) in air.
5.4 The surface morphology of sample PAV 71900 was annealed at 750 OC (a) in oxygen and (b) in air, 800 O C (c) in oxygen and (d) in air and 900 "C (e) in oxygen and (f) in air.
5.5 Surface morphology for sample Pb(AI,V1-,)03 +s in different x composition; x = 0.1, 0.3, 0.7 and 0.9 is shown in (a), (b), (c) and (d) respectively.
5.6 The surface morphology of sample PAV 71800 with four different spots.
5.7 The surface morphology of sample PAV 0.1 with four spots were made in layered area and the grains area.
Page
XIX
LIST OF SYMBOLS AND ABBREVIATIONS
E Dielectric permittivity
Einf Dielectric permittivity at very high frequency
Relative dielectric permittivity
E(W) Dielectric permittivity as a function of angular frequency
Micron
o Conductivity (mholm)
o(w) Conductivity as a function of angular frequency
z Relaxation time (sec)
Real part of dielectric susceptibility
Imaginary part of dielectric susceptibility
Angular frequency
Critical angular frequency
Peak angular frequency
Ohm
Angstrom unit
Electron volt
Exponential
Frequency
=d- 1
Boltzmann constant
Kilohertz
Natural logarithm

log Logarithm
mHz Milihertz
Proportional to
Goes to
Smaller than
Bigger than
- Approximately
Ac Alternating current
B Susceptance (mho)
C* Complex Capacitance
C' Real part of capacitance
C" Imaginary part of capacitance
DC Direct current
E Activation energy
EDX Electron Dispersion X-ray
Conductance
Hertz
Current
Imaginary part
Kelvin
Modulus
M* Complex modulus
M' Real part of modulus
M" Imaginary part of modulus
MHz Megahertz
XXI

R
Re
SEM
T
TGA
UPM
v
XRD
Y *
Resistance
Real part
Scanning electron microscope
Absolute temperature (Kelvin)
Thermo Gravimetric Analysis
Universiti Putra Malaysia
Voltage
X-ray diffraction
Complex admittance
Real part of admittance
Imaginary part o f admittance
Complex impedance
Real part of impedance
Imaginary part o f impedance
CHAPTER 1
RESEARCH OVERVIEW
1.1 Introduction
Dielectric is a field of knowledge that belongs to physics, chemistry, biology and
engineering. Dielectrics are not confined to the narrow area of insulators, but to any
non-metal that interacts with electric or electromagnetic fields. Polarization and the
dynamics of electric charges are at the heart of dielectrics. These are often described
in terms of macroscopic properties such as permittivity, dielectric loss and also
dielectric constant. Electrical engineers have characterized dielectrics
macroscopically using field vectors, equivalent circuits and reliability statistics. In
contrast, the physicist and chemist have pushed forward the understanding of
dielectric response in terms of molecular and structural response and relaxation.
Many of the fimdamental problems have now been addressed and it is now possible
to move from dielectric analysis to dielectric synthesis. This is of considerable
interest to most areas of science and demonstrates the cross-disciplinary nature of
dielectrics.
Not only the electrical property has been investigated but also its correlation on
chemical and microstructure. Scanning Electron Microscope (SEM), Energy
Dispersive Microanalysis (EDS) and X-ray difhction (XRD) are used in hundreds
of applications where knowledge of chemical information on the micro- or nano-
scale is important. Major users include industry, university research institutes and
government facilities. Typical applications are in materials research, quality control,
failure analysis, and forensic science. Industries that commonly use this technique
include: semi-conductor and electronics, metals, ceramics, minerals, manufacturing,
engineering, nuclear, paper, petroleum, bio-science, and the motor industry.
The development in electronic and related industries on dielectric materials has
pushed researchers to synthesize new materials with good dielectric properties. From
AB03 perovskite structure (ca. BaTi03) to the modification on the A and B sites, a
new material with good electrical and mechanical properties has been found. Recent
work has shown that the substitution on A site with Pb and some modification on B
site produce a good result on its dielectric and mechanical properties. Many works
have been reported on the effect of substitution and modification on B site. However
substitution and modification with aluminium (AI~+) and vanadium (v5+) on B site
have not been reported yet. In this work, the Pb(AIxV,,)03G ceramic systems has
been studied and its electrical properties have been characterized.
1.2 Objective
The main objectives of this study is to characterize the Pb(A1xVt-x)O~s ceramic
systems by TGA, XRD, SEM, EDX, dielectric spectrometer and dc conductivity
measurement. A detail objective of this study was conducted in order to investigate: