telekom malaysia berhad - tm.listedcompany.comjan 19, 2017 · unifi continues to drive growth,...
TRANSCRIPT

TELEKOM MALAYSIA BERHADRHB INVESTMENT BANK REGIONAL CORPORATE DAY
KUALA LUMPUR19 JANUARY 2017
TM Today
Latest Updates
About TM
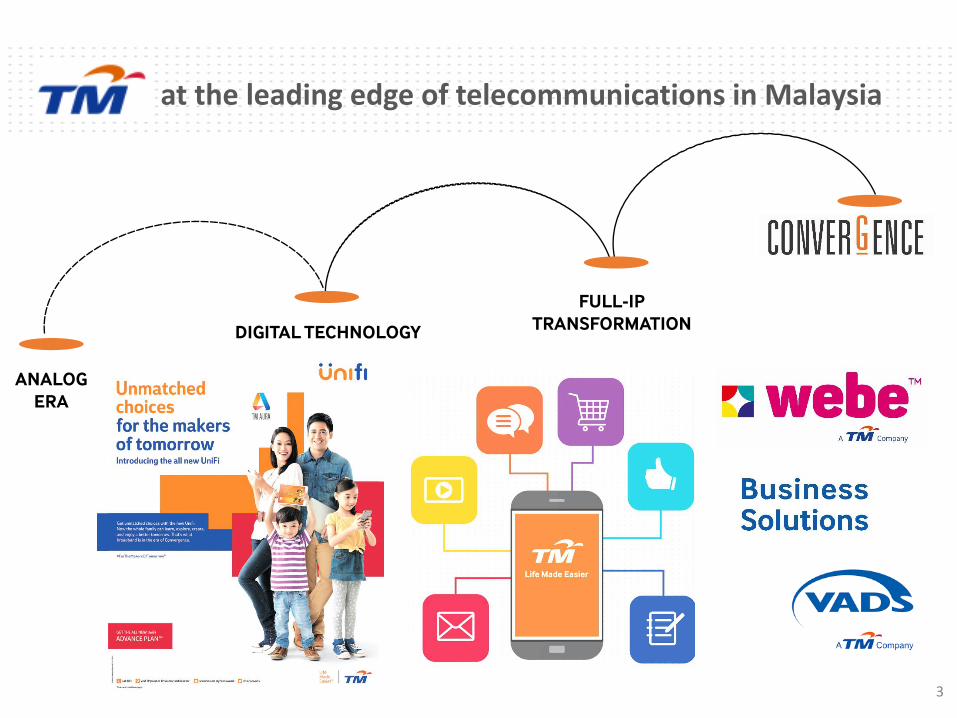
ANALOG
ERA
DIGITAL TECHNOLOGY
FULL-IP
TRANSFORMATION
at the leading edge of telecommunications in Malaysia
3
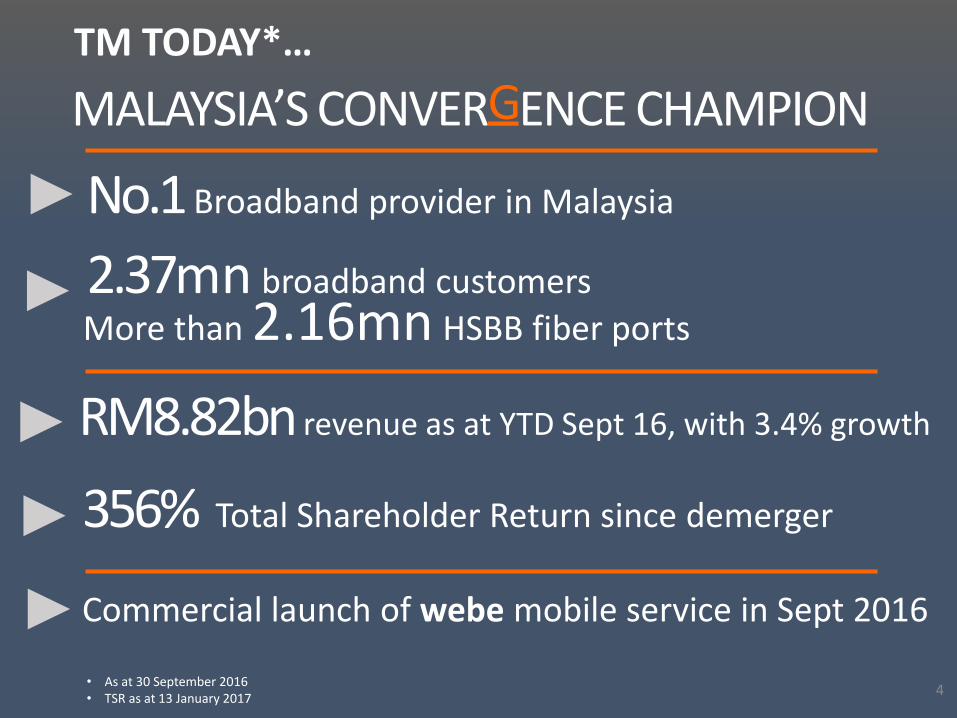
TM TODAY*…
MALAYSIA’S CONVERGENCE CHAMPION
No.1 Broadband provider in Malaysia
2.37mn broadband customers
RM8.82bn revenue as at YTD Sept 16, with 3.4% growth
More than 2.16mn HSBB fiber ports
356% Total Shareholder Return since demerger
• As at 30 September 2016• TSR as at 13 January 2017
4
Commercial launch of webe mobile service in Sept 2016
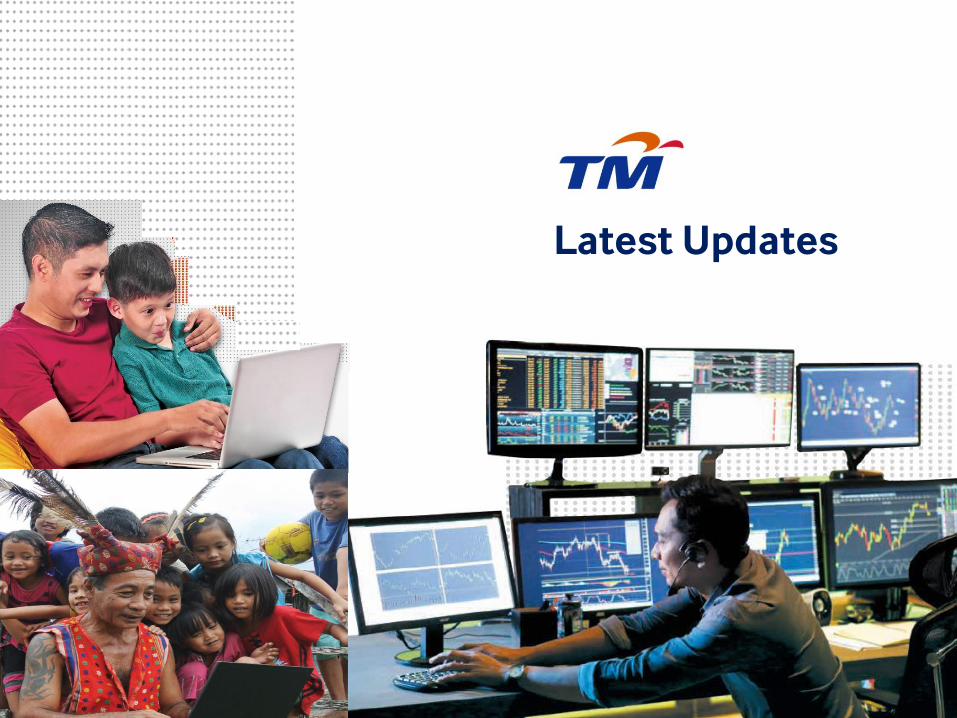
Latest Updates
TM 30th AGM 30 April 2015
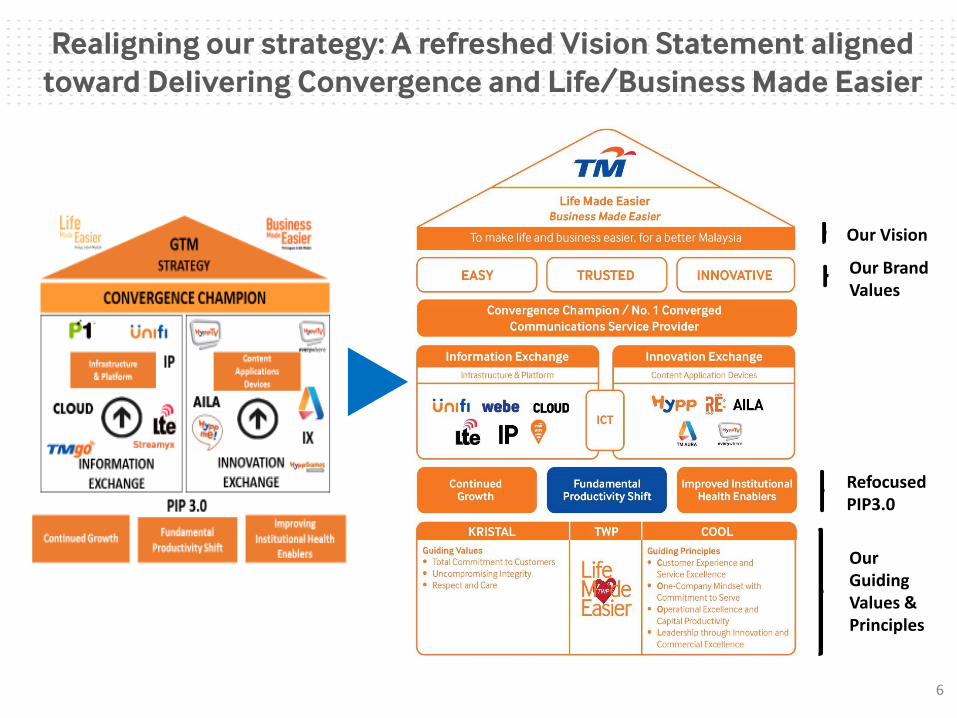
Our Vision
Our Brand Values
Refocused PIP3.0
Our Guiding Values & Principles
Realigning our strategy: A refreshed Vision Statement aligned
toward Delivering Convergence and Life/Business Made Easier
6
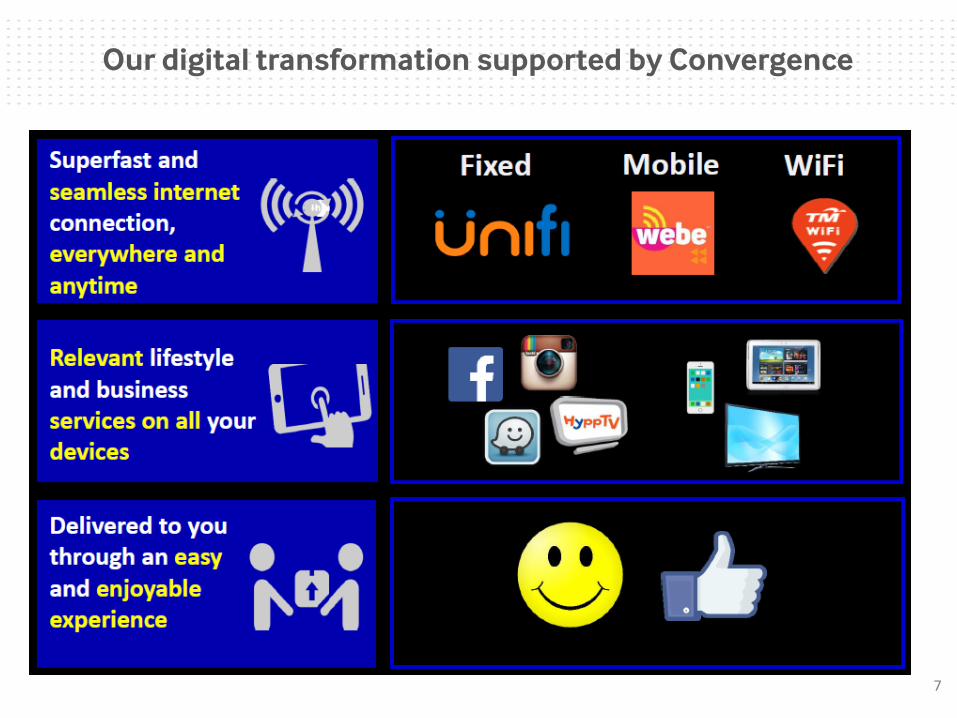
Our digital transformation supported by Convergence
7
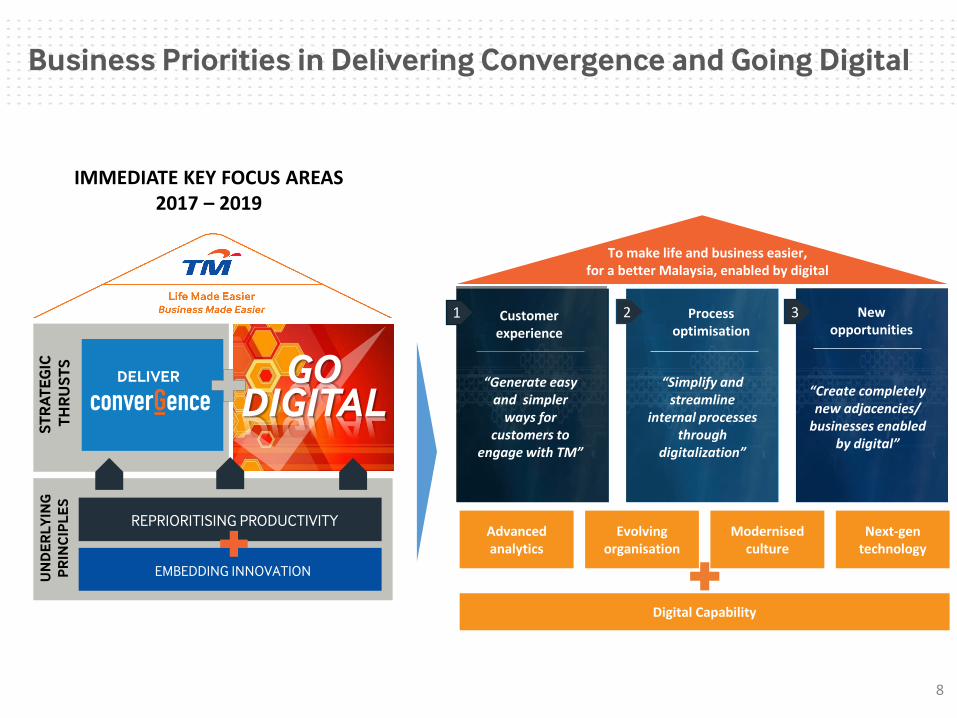
Business Priorities in Delivering Convergence and Going Digital
8
IMMEDIATE KEY FOCUS AREAS 2017 – 2019
ST
RA
TE
GIC
TH
RU
ST
S
REPRIORITISING PRODUCTIVITY
EMBEDDING INNOVATION
UN
DE
RL
YIN
G
PR
INC
IPL
ES
GO DIGITAL
DELIVER
Customer experience
“Generate easy and simpler
ways for customers to
engage with TM”
Process optimisation
“Simplify and streamline
internal processes through
digitalization”
New opportunities
“Create completely new adjacencies/
businesses enabled by digital”
To make life and business easier, for a better Malaysia, enabled by digital
Advanced analytics
Next-gen technology
Evolving organisation
Modernisedculture
1 2 3
Digital Capability
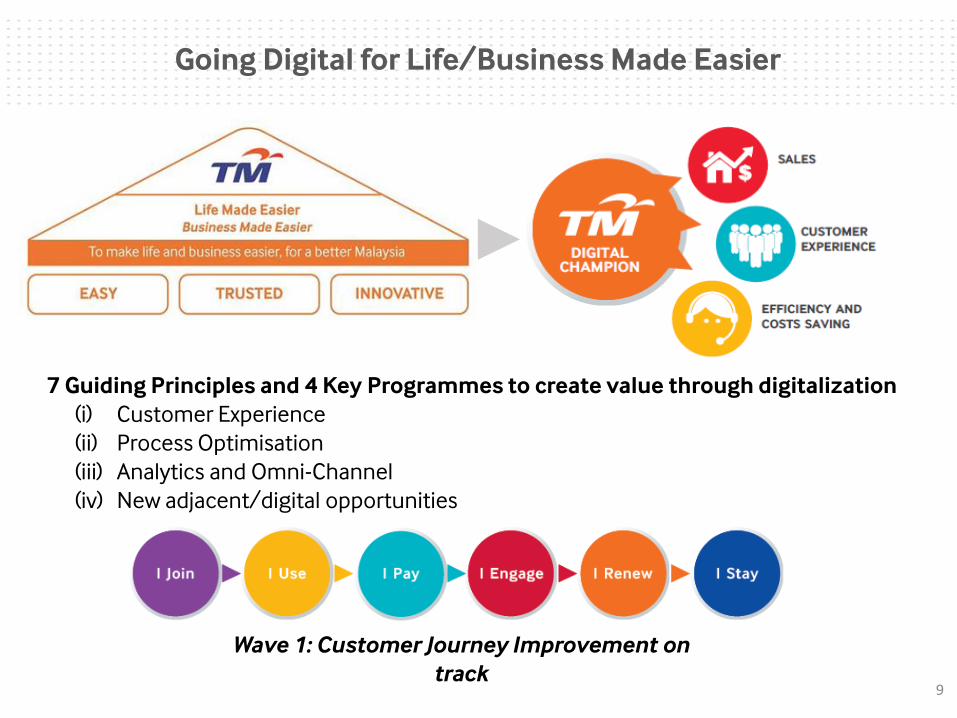
Going Digital for Life/Business Made Easier
7 Guiding Principles and 4 Key Programmes to create value through digitalization
(i) Customer Experience
(ii) Process Optimisation
(iii) Analytics and Omni-Channel
(iv) New adjacent/digital opportunities
Wave 1: Customer Journey Improvement on
track9
10
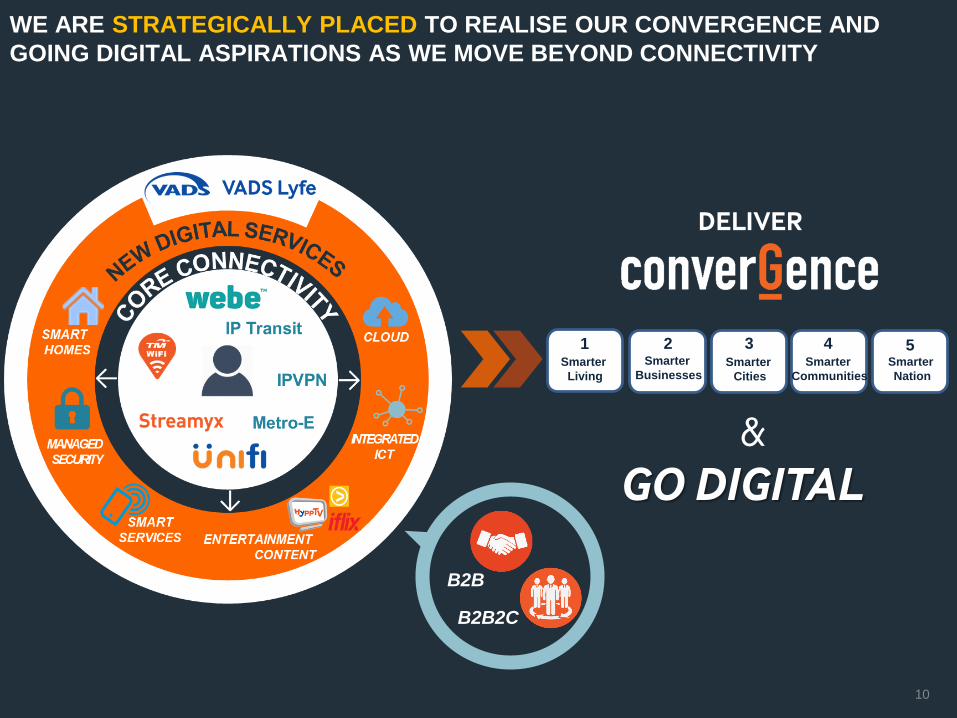
WE ARE STRATEGICALLY PLACED TO REALISE OUR CONVERGENCE AND
GOING DIGITAL ASPIRATIONS AS WE MOVE BEYOND CONNECTIVITY
B2B2C
B2B
DELIVER
GO DIGITAL
Smarter
BusinessesSmarter
Living
Smarter
Cities
Smarter
Communities
Smarter
Nation
1 2 3 4 5
&
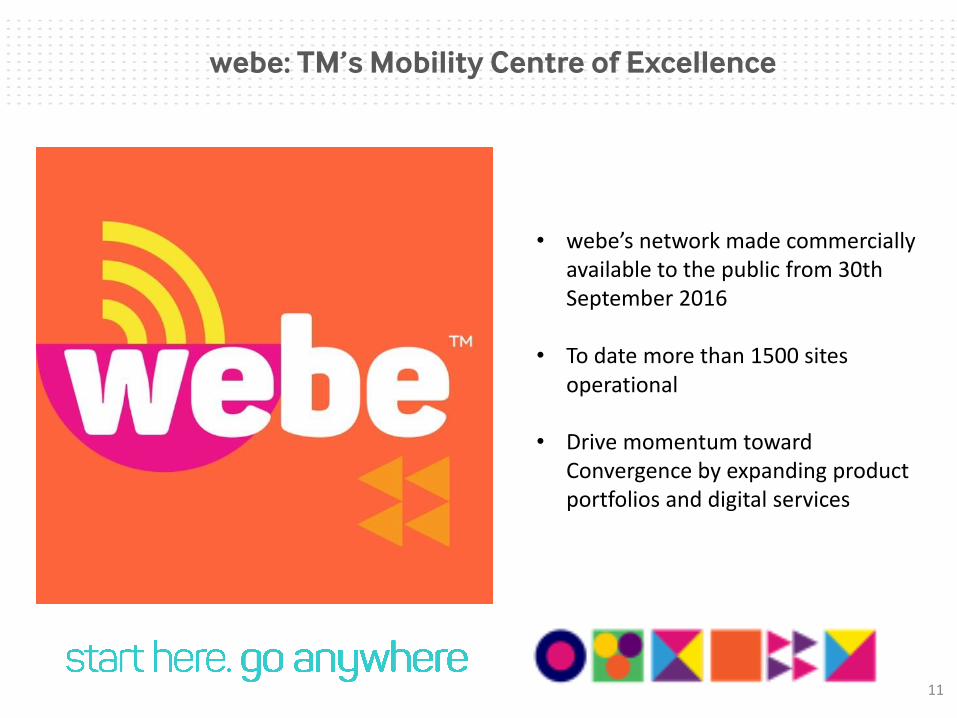
• webe’s network made commercially available to the public from 30th September 2016
• To date more than 1500 sites operational
• Drive momentum toward Convergence by expanding product portfolios and digital services
webe: TM’s Mobility Centre of Excellence
11
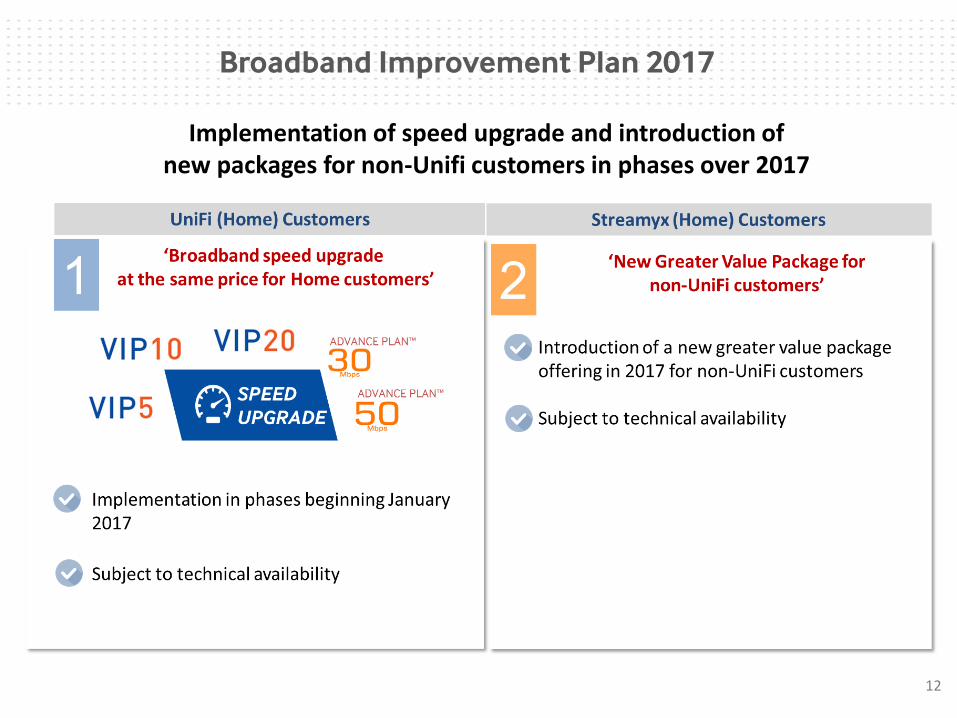
Implementation of speed upgrade and introduction of new packages for non-Unifi customers in phases over 2017
12
Broadband Improvement Plan 2017
Areas are indicative and not to scale
KUALA TERENGGANU
©
©
©
©
©
©
©
KANGAR
ALOR STAR
IPOH
SHAH ALAM
MELAKA
KUANTAN
KUALA LUMPUR
Klang
Valley
◘
◘
◘
◘
◘
◘◘
◘
◘
◘◘
◘
◘
◘
◘
©
◘◘◘◘
◘
◘
◘
◘
◘
◘◘
◘
◘
◘
◘
◘
©
©KOTA KINABALU
KUCHING
◘
◘
◘
◘
©◘
◘◘
◘◘
Less populated areas
Zone 2 – SUBB
Zone 1 – HSBB & HSBB2
LEGEND
High economic impact areas
Urban/Semi-urban and rural
Industrial parks/FTZs
SEREMBAN
JOHOR BAHRU
Northern
Corridor
Economic
Region
Iskandar
Malaysia
Zone 3
Zone 3
Zone 3 – USP
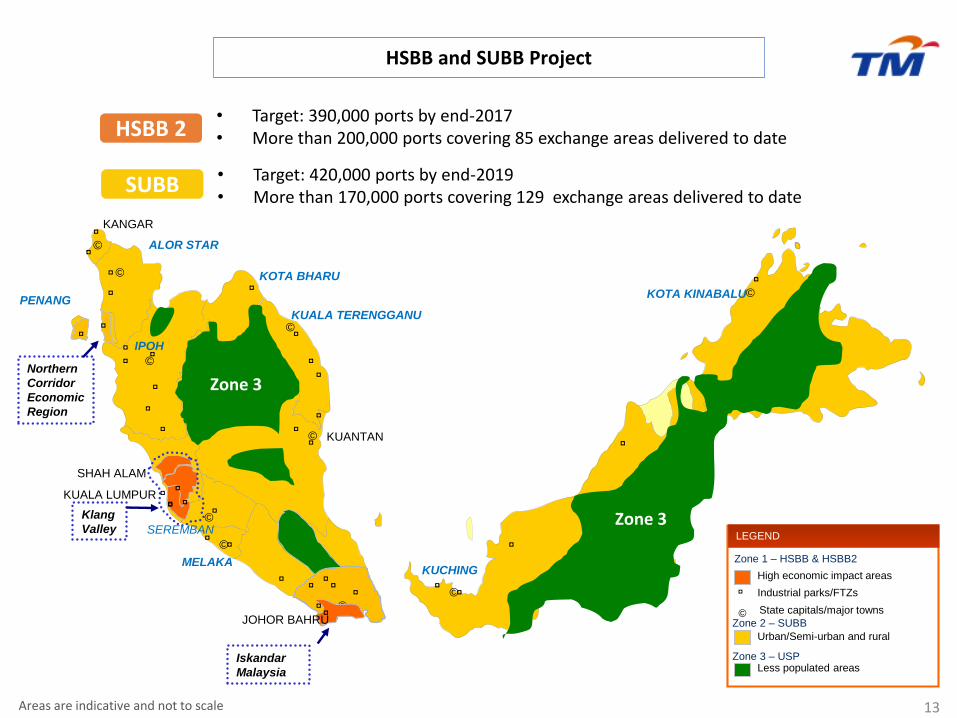
HSBB and SUBB Project
13
KOTA BHARU
PENANG
State capitals/major towns©
• Target: 390,000 ports by end-2017 • More than 200,000 ports covering 85 exchange areas delivered to date
• Target: 420,000 ports by end-2019• More than 170,000 ports covering 129 exchange areas delivered to date
HSBB 2
SUBB

TM 31st AGM 28 April 2016
About TM
and
Performance Highlights
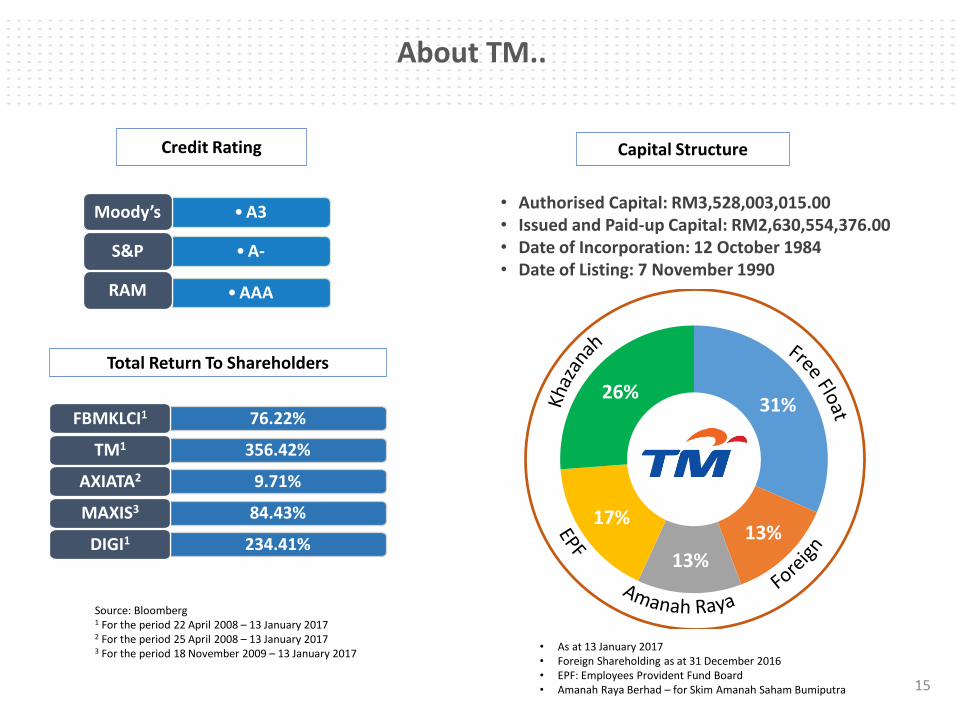
Capital StructureCredit Rating
Total Return To Shareholders
• Authorised Capital: RM3,528,003,015.00• Issued and Paid-up Capital: RM2,630,554,376.00• Date of Incorporation: 12 October 1984• Date of Listing: 7 November 1990
76.22%FBMKLCI1
356.42%TM1
9.71%AXIATA2
84.43%MAXIS3
234.41%DIGI1
• A3Moody’s
• A-S&P
• AAARAM
Source: Bloomberg1 For the period 22 April 2008 – 13 January 20172 For the period 25 April 2008 – 13 January 20173 For the period 18 November 2009 – 13 January 2017
• As at 13 January 2017• Foreign Shareholding as at 31 December 2016• EPF: Employees Provident Fund Board• Amanah Raya Berhad – for Skim Amanah Saham Bumiputra
About TM..
15
31%
13%
13%
17%
26%
449 281 307
998 868
339 263 310
890 885
3 Q 1 5 2 Q 1 6 3 Q 1 6 Y T D 1 5 Y T D 1 6
Reported EBIT
Normalised EBIT
167 140 160
508622
231 168 208
642 578
3 Q 1 5 2 Q 1 6 3 Q 1 6 Y T D 1 5 Y T D 1 6
Reported PATAMI
Normalised PATAMI
2,923 3,045 2,923
8,537 8,824
3 Q 1 5 2 Q 1 6 3 Q 1 6 Y T D 1 5 Y T D 1 6
Revenue
0.0%
-31.6% (Normalised -8.6%)
RM mn
-4.0%
+9.2% (Normalised +17.9%)
Key YTD Sept 2016 Highlights
Revenue
EBIT
PATAMI
Note : Unless stated otherwise all figures shall be inclusive of Webe16
-4.2% (Normalised -10.0%)
+14.6% (Normalised +23.9%)
+3.4%
-13.0% (Normalised -0.6%)RM mn
RM mn
+22.4% (Normalised -10.0%)
*Includes accelerated depreciation and write-off of WiMAX assets amounting to RM141mn
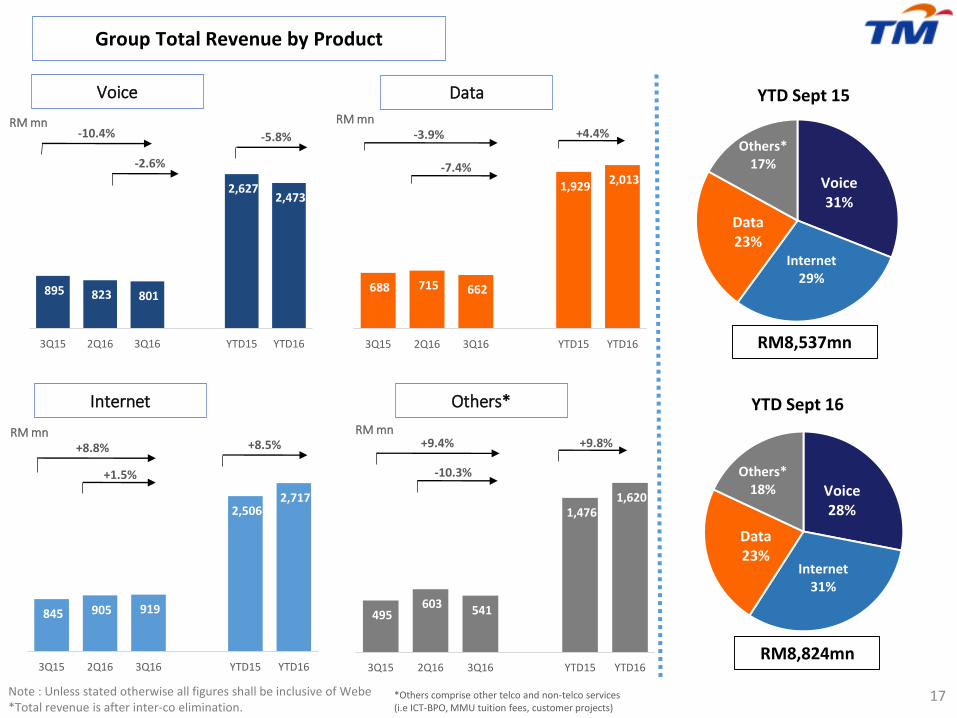
495 603 541
1,476 1,620
3Q15 2Q16 3Q16 YTD15 YTD16
688 715 662
1,929 2,013
3Q15 2Q16 3Q16 YTD15 YTD16
845 905 919
2,506 2,717
3Q15 2Q16 3Q16 YTD15 YTD16
17
Group Total Revenue by Product
Voice
Internet
Note : Unless stated otherwise all figures shall be inclusive of Webe*Total revenue is after inter-co elimination.
RM mn
RM mn
Data
Others*
*Others comprise other telco and non-telco services (i.e ICT-BPO, MMU tuition fees, customer projects)
RM mn
RM mn
Voice28%
Internet 31%
Data23%
Others*18%
YTD Sept 16
Voice31%
Internet 29%
Data23%
Others*17%
YTD Sept 15
+4.4%-3.9%
-7.4%
+8.5%+8.8%
+1.5%
+9.8%+9.4%
-10.3%
895 823 801
2,627 2,473
3Q15 2Q16 3Q16 YTD15 YTD16
-10.4%
-2.6%
-5.8%
RM8,537mn
RM8,824mn
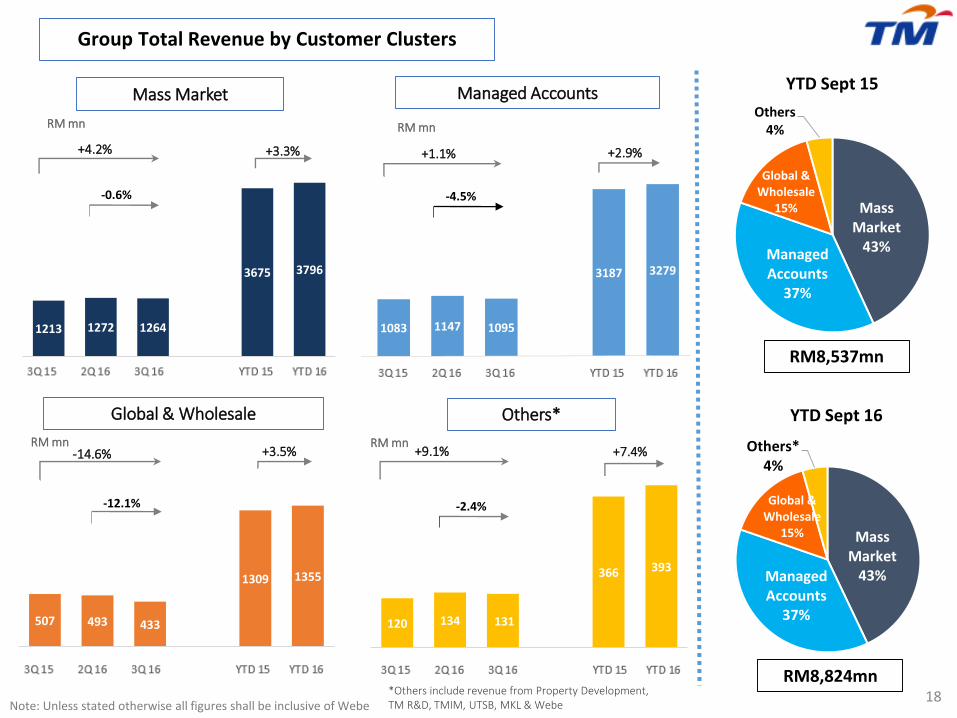
120 134 131
366 393
3Q 15 2Q 16 3Q 16 YTD Sep15
YTD Sep16
507 493 433
1309 1355
3Q 15 2Q 16 3Q 16 YTD Sep15
YTD Sep16
1213 1272 1264
3675 3796
3Q 15 2Q 16 3Q 16 YTD 15 YTD 16
Group Total Revenue by Customer Clusters
18
+4.2% +3.3%
Mass Market Managed Accounts
+1.1% +2.9%
Note: Unless stated otherwise all figures shall be inclusive of Webe
RM mn RM mn
-14.6%
Global & Wholesale
+3.5%
Others*
*Others include revenue from Property Development, TM R&D, TMIM, UTSB, MKL & Webe
+9.1% +7.4%
Mass Market
43%Managed Accounts
37%
Global & Wholesale
15%
Others*4%
YTD Sept 16
1083 1147 1095
3187 3279
Mass Market
43%Managed Accounts
37%
Global & Wholesale
15%
Others4%
YTD Sept 15
-0.6% -4.5%
-12.1% -2.4%
RM mnRM mn
RM8,537mn
RM8,824mn
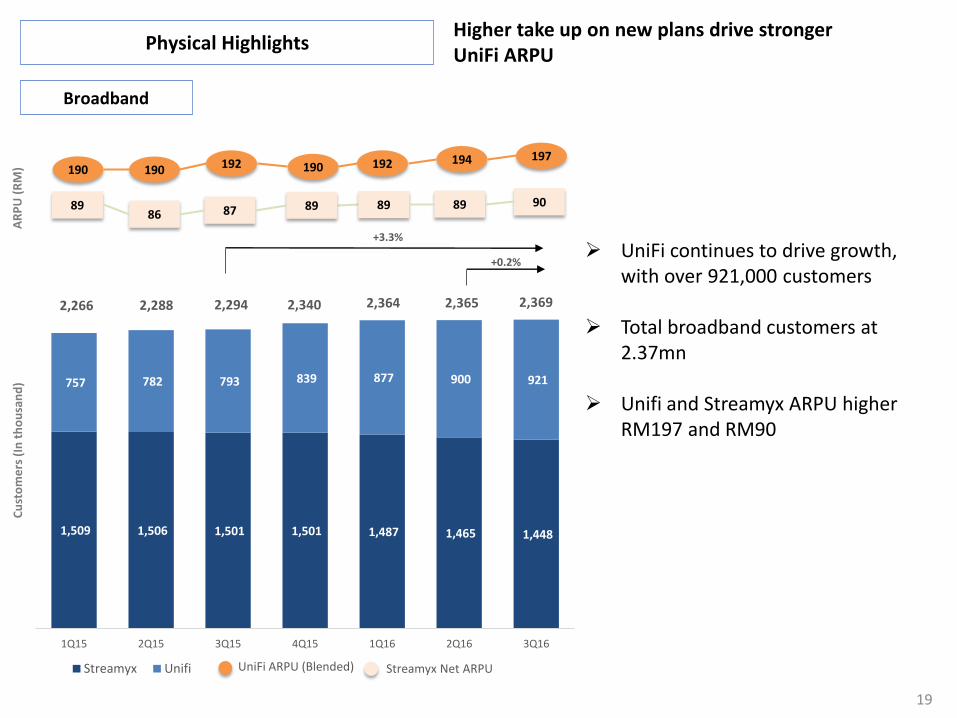
UniFi continues to drive growth, with over 921,000 customers
Total broadband customers at 2.37mn
Unifi and Streamyx ARPU higher RM197 and RM90
Higher take up on new plans drive stronger UniFi ARPU
19
Physical Highlights
Broadband
1,509 1,506 1,501 1,501 1,487 1,465 1,448
757 782 793 839 877 900 921
1Q15 2Q15 3Q15 4Q15 1Q16 2Q16 3Q16
Streamyx Unifi
+3.3%
190
+0.2%
86
Cu
sto
me
rs (
In t
ho
usa
nd
)A
RP
U (
RM
)
UniFi ARPU (Blended)
87
192
89
190
2,288 2,294 2,340 2,364
89
192
2,365
89
194
2,266
190
89 90
197
2,369
Streamyx Net ARPU
Note : Unless stated otherwise all figures shall be inclusive of Webe
Cost % of Revenue1
RM mn
Group Capital Expenditure
YTD Sept 2016: CAPEX & OPEX
Capex / Revenue (%)
20
22.2 21.9 21.5 21.1 21.8
18.8 19.3 18.8 17.9 19.0
21.4 20.4 22.2 21.9 21.3
11.7 11.7 11.7 9.4
11.7
5.9 6.2 5.8 6.5
6.0
6.0 6.7 6.6 6.7
6.5 3.3 4.1 3.7
3.0 3.7
1.0 0.6
(0.7)
1.9 0.3
1Q16 2Q16 3Q16 YTD15 YTD16
Dep & Amortisation Direct Costs Manpower
Other Operating Costs Maintenance Cost Supplies & Materials
Marketing Expenses Bad & Doubtful Debts
Total Cost / Revenue (%)
1 Revenue = Operating Revenue + Other Operating Income
88.4%
RM7,630.3 RM8,056.9
90.3%
RM2,795.9RM2,616.9
90.9%90.3%
RM2,644.1
89.6%
159 137
350
630 646
59
363
237
309
659
100
120128
214
348
1Q16 2Q16 3Q16 YTD15 YTD16
Core Network Access Support System
620318
20.4%11.1%
715
24.5%
1,153
13.5%
1,653
18.7%
21
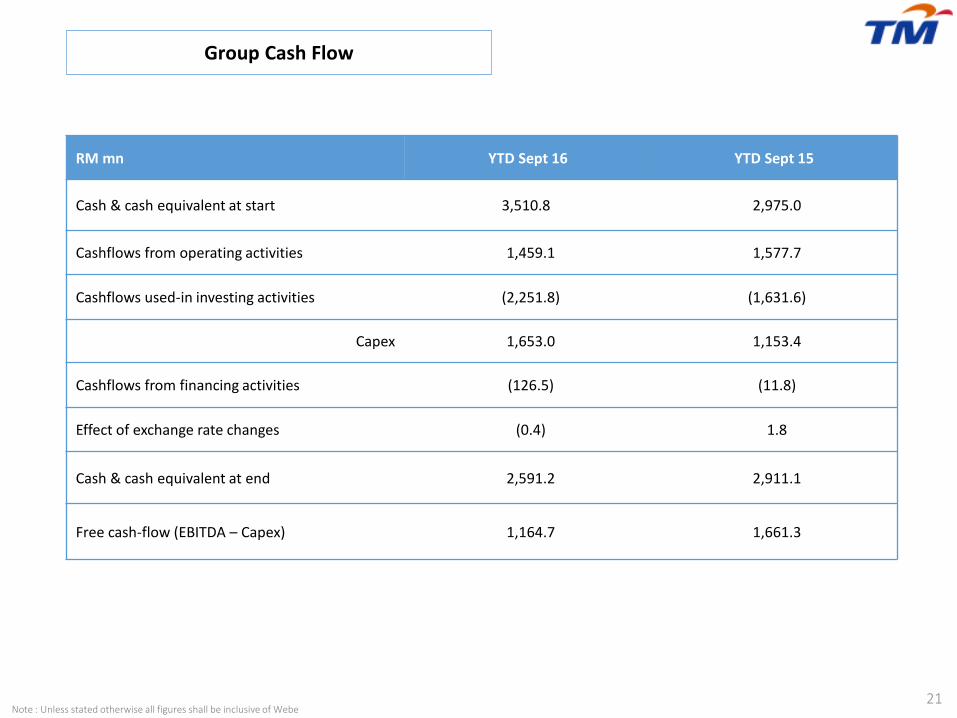
Group Cash Flow
Note : Unless stated otherwise all figures shall be inclusive of Webe
RM mn YTD Sept 16 YTD Sept 15
Cash & cash equivalent at start 3,510.8 2,975.0
Cashflows from operating activities 1,459.1 1,577.7
Cashflows used-in investing activities (2,251.8) (1,631.6)
Capex 1,653.0 1,153.4
Cashflows from financing activities (126.5) (11.8)
Effect of exchange rate changes (0.4) 1.8
Cash & cash equivalent at end 2,591.2 2,911.1
Free cash-flow (EBITDA – Capex) 1,164.7 1,661.3
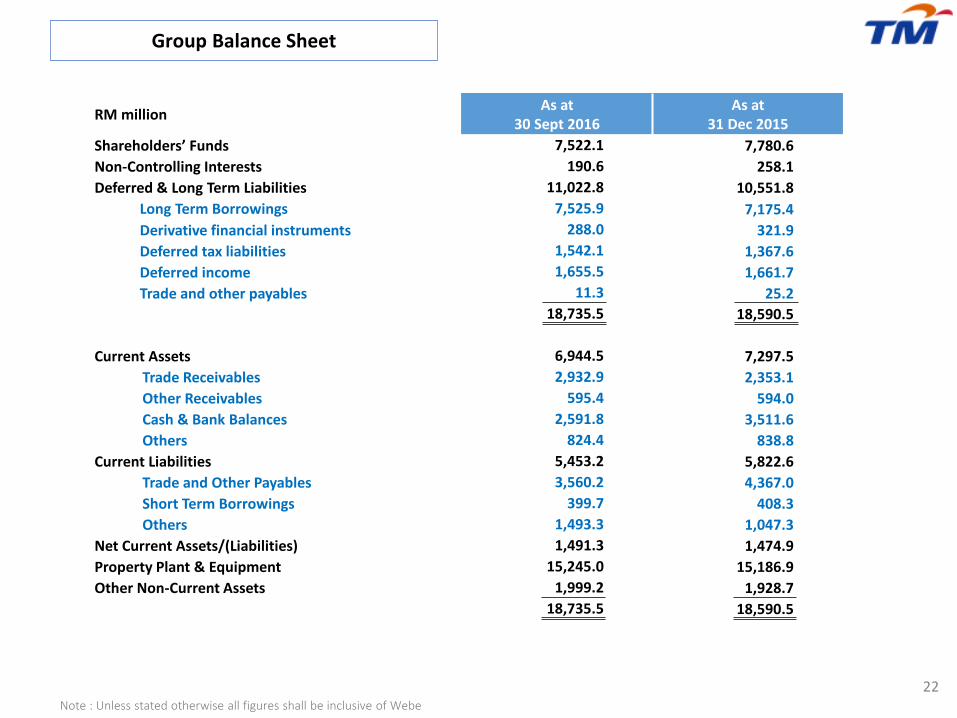
RM millionAs at
30 Sept 2016As at
31 Dec 2015
Shareholders’ Funds 7,522.1 7,780.6
Non-Controlling Interests 190.6 258.1
Deferred & Long Term Liabilities 11,022.8 10,551.8
Long Term Borrowings 7,525.9 7,175.4
Derivative financial instruments 288.0 321.9
Deferred tax liabilities 1,542.1 1,367.6
Deferred income 1,655.5 1,661.7
Trade and other payables 11.3 25.2
18,735.5 18,590.5
Current Assets 6,944.5 7,297.5
Trade Receivables 2,932.9 2,353.1
Other Receivables 595.4 594.0
Cash & Bank Balances 2,591.8 3,511.6
Others 824.4 838.8
Current Liabilities 5,453.2 5,822.6
Trade and Other Payables 3,560.2 4,367.0
Short Term Borrowings 399.7 408.3
Others 1,493.3 1,047.3
Net Current Assets/(Liabilities) 1,491.3 1,474.9
Property Plant & Equipment 15,245.0 15,186.9
Other Non-Current Assets 1,999.2 1,928.7
18,735.5 18,590.5
Group Balance Sheet
Note : Unless stated otherwise all figures shall be inclusive of Webe
22
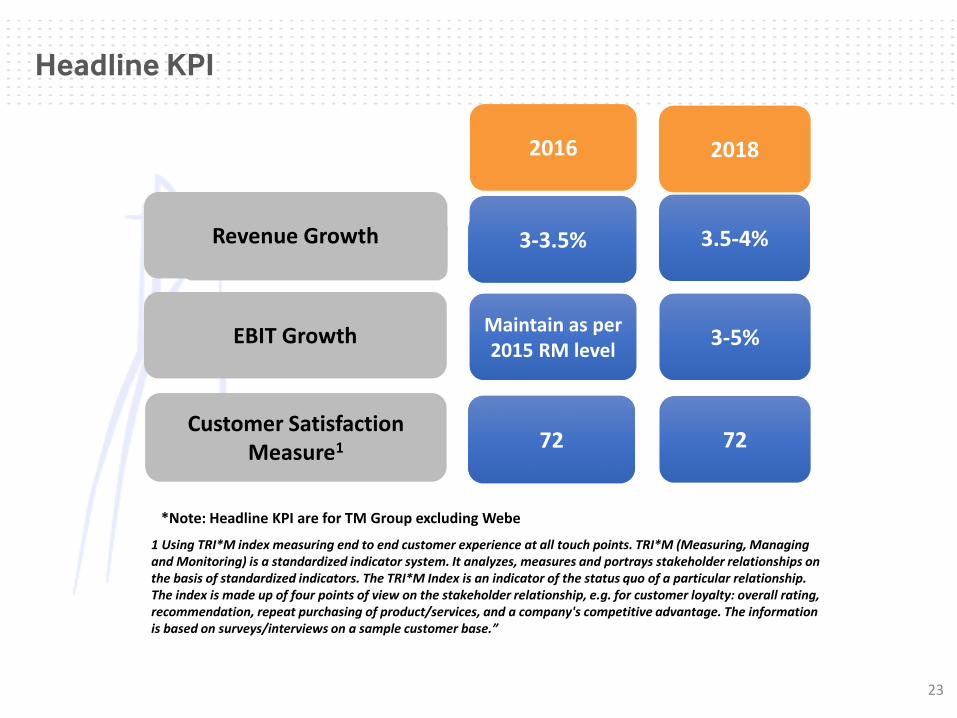
Revenue Growth 3-3.5% 3.5-4%
3-5%
72 72
1 Using TRI*M index measuring end to end customer experience at all touch points. TRI*M (Measuring, Managing and Monitoring) is a standardized indicator system. It analyzes, measures and portrays stakeholder relationships on the basis of standardized indicators. The TRI*M Index is an indicator of the status quo of a particular relationship. The index is made up of four points of view on the stakeholder relationship, e.g. for customer loyalty: overall rating, recommendation, repeat purchasing of product/services, and a company's competitive advantage. The information is based on surveys/interviews on a sample customer base.”
*Note: Headline KPI are for TM Group excluding Webe
Headline KPI
2016
Revenue Growth
EBIT Growth
Customer Satisfaction Measure1
3-3.5%
Maintain as per 2015 RM level
2018
23

Appendix
24
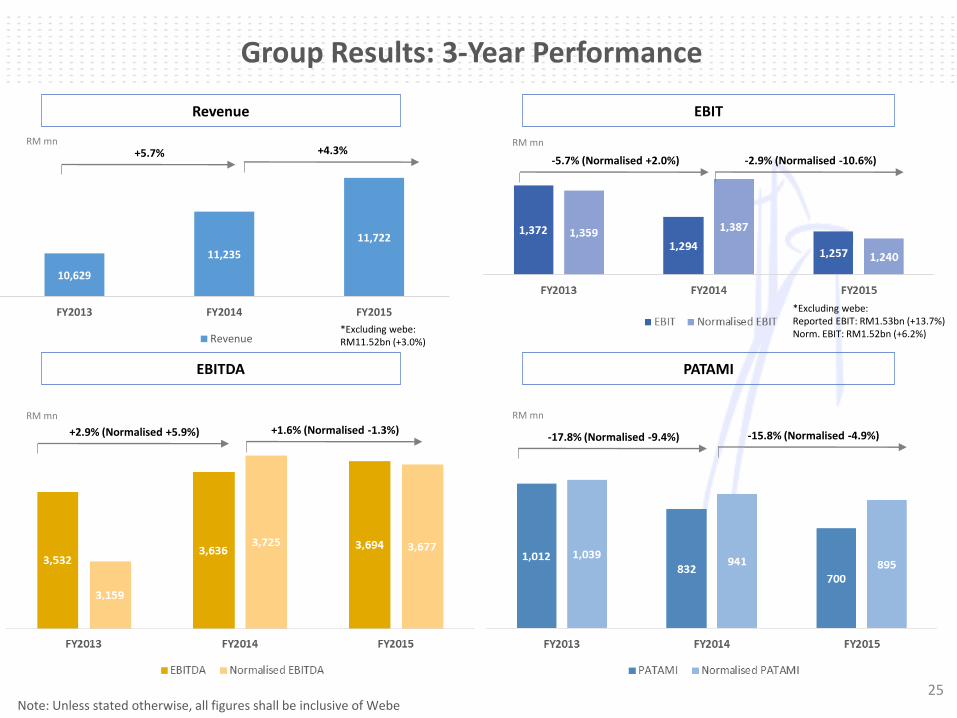
10,629
11,235
11,722
FY2013 FY2014 FY2015
Revenue
Revenue EBIT
EBITDA PATAMI
RM mn RM mn
RM mn RM mn
+5.7% +4.3%-5.7% (Normalised +2.0%) -2.9% (Normalised -10.6%)
+2.9% (Normalised +5.9%) +1.6% (Normalised -1.3%)-17.8% (Normalised -9.4%) -15.8% (Normalised -4.9%)
Note: Unless stated otherwise, all figures shall be inclusive of Webe
*Excluding webe: Reported EBIT: RM1.53bn (+13.7%)Norm. EBIT: RM1.52bn (+6.2%)*Excluding webe:
RM11.52bn (+3.0%)
Group Results: 3-Year Performance
25
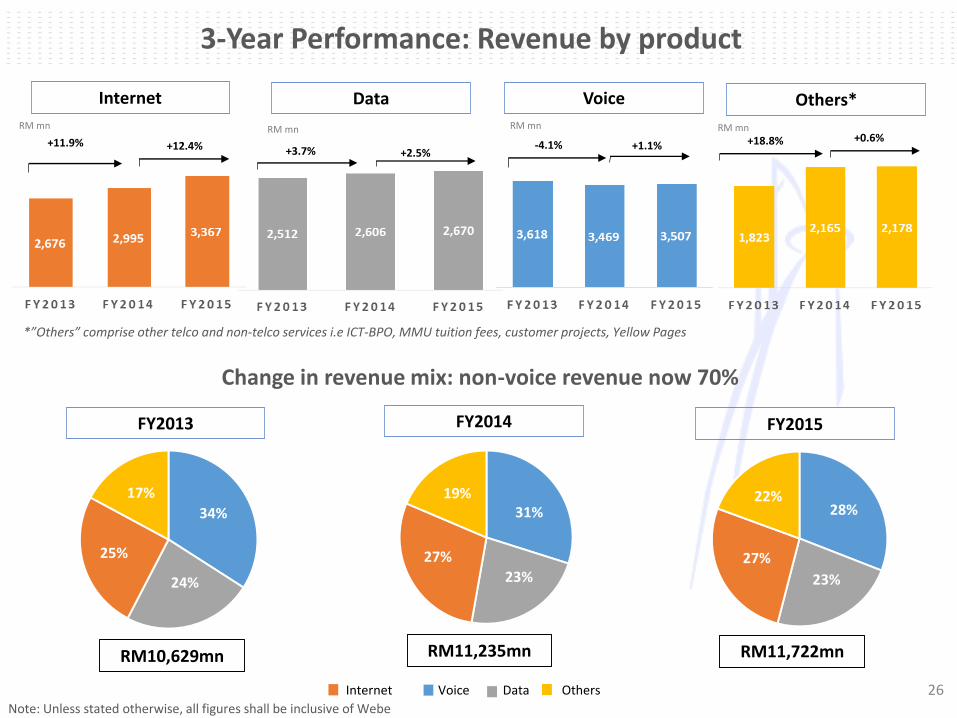
FY2013 FY2014 FY2015
*”Others” comprise other telco and non-telco services i.e ICT-BPO, MMU tuition fees, customer projects, Yellow Pages
Note: Unless stated otherwise, all figures shall be inclusive of Webe
31%
23%
27%
19%
34%
24%
25%
17%28%
23%
27%
22%
+3.7% +2.5%+11.9% -4.1% +1.1%
+0.6%+18.8%
RM mn RM mn RM mn RM mn
Internet Others*VoiceData
+12.4%
Change in revenue mix: non-voice revenue now 70%
Internet Data
3-Year Performance: Revenue by product
26Voice Others
RM10,629mn RM11,235mn RM11,722mn
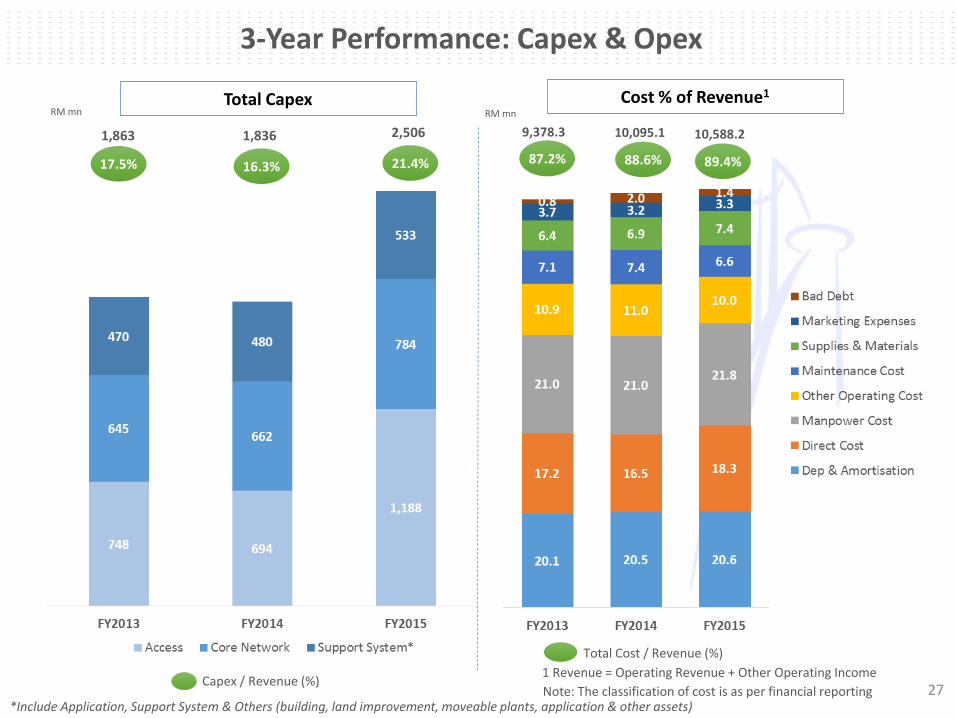
Capex & Opex: 3-Year Performance
Total Capex
2,506
Capex / Revenue (%)
*Include Application, Support System & Others (building, land improvement, moveable plants, application & other assets)
Cost % of Revenue1
10,588.2
89.4%
RM mn
Total Cost / Revenue (%)
1 Revenue = Operating Revenue + Other Operating Income
Note: The classification of cost is as per financial reporting
21.4%
RM mn
9,378.3
87.2%
10,095.1
88.6%
1,863
17.5%
1,836
16.3%
3-Year Performance: Capex & Opex
27
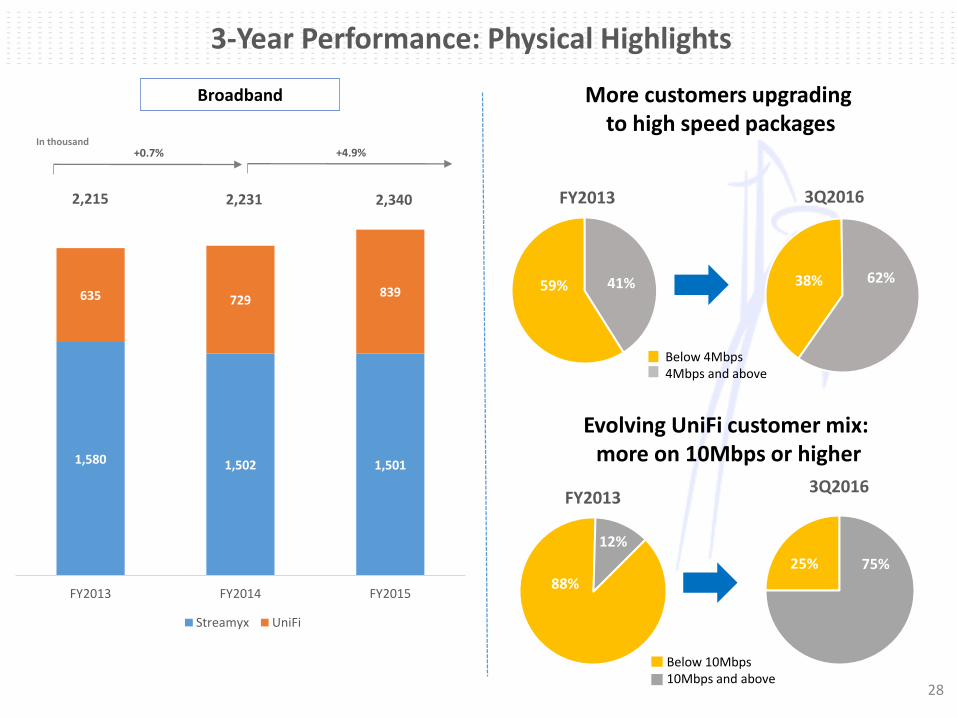
41%59%
FY2013
1,580 1,502 1,501
635 729839
FY2013 FY2014 FY2015
Streamyx UniFi
In thousand+0.7%
2,3402,215 2,231
+4.9%
Broadband More customers upgrading to high speed packages
Evolving UniFi customer mix: more on 10Mbps or higher
Below 4Mbps4Mbps and above
Below 10Mbps10Mbps and above
3-Year Performance: Physical Highlights
28
38% 62%
3Q2016
88%
12%
FY2013
25% 75%
3Q2016
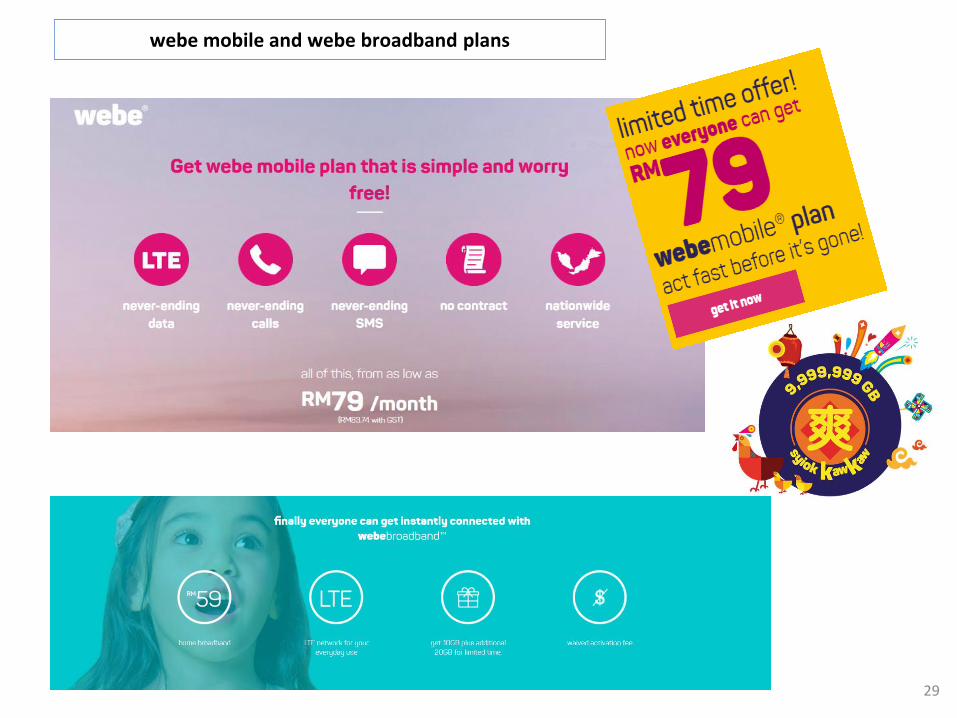
webe mobile and webe broadband plans
29
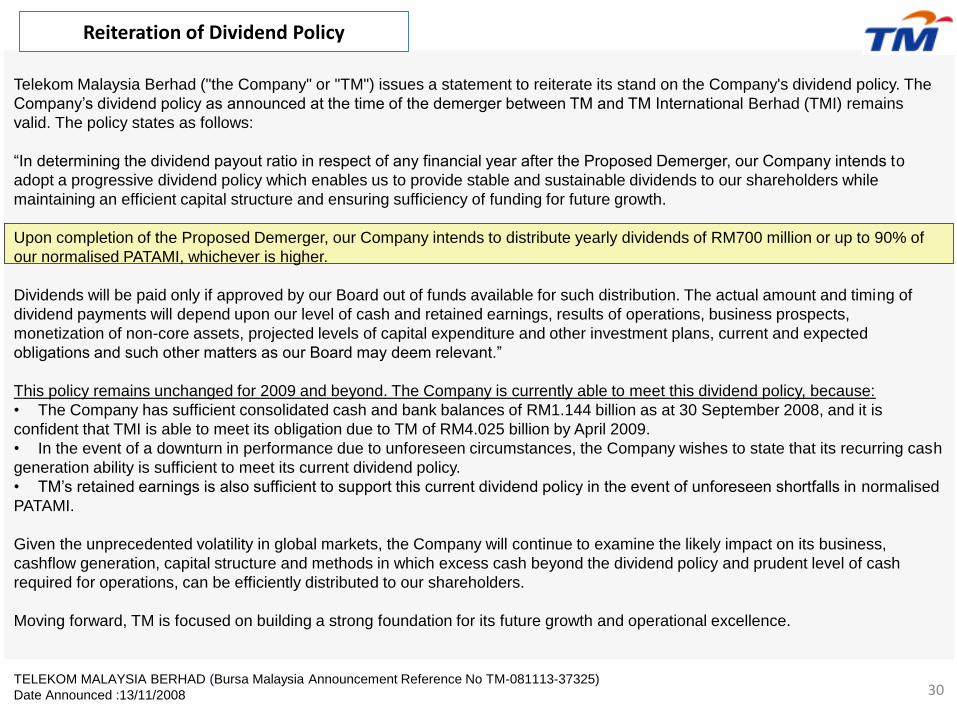
Telekom Malaysia Berhad ("the Company" or "TM") issues a statement to reiterate its stand on the Company's dividend policy. The
Company’s dividend policy as announced at the time of the demerger between TM and TM International Berhad (TMI) remains
valid. The policy states as follows:
“In determining the dividend payout ratio in respect of any financial year after the Proposed Demerger, our Company intends to
adopt a progressive dividend policy which enables us to provide stable and sustainable dividends to our shareholders while
maintaining an efficient capital structure and ensuring sufficiency of funding for future growth.
Upon completion of the Proposed Demerger, our Company intends to distribute yearly dividends of RM700 million or up to 90% of
our normalised PATAMI, whichever is higher.
Dividends will be paid only if approved by our Board out of funds available for such distribution. The actual amount and timing of
dividend payments will depend upon our level of cash and retained earnings, results of operations, business prospects,
monetization of non-core assets, projected levels of capital expenditure and other investment plans, current and expected
obligations and such other matters as our Board may deem relevant.”
This policy remains unchanged for 2009 and beyond. The Company is currently able to meet this dividend policy, because:
• The Company has sufficient consolidated cash and bank balances of RM1.144 billion as at 30 September 2008, and it is
confident that TMI is able to meet its obligation due to TM of RM4.025 billion by April 2009.
• In the event of a downturn in performance due to unforeseen circumstances, the Company wishes to state that its recurring cash
generation ability is sufficient to meet its current dividend policy.
• TM’s retained earnings is also sufficient to support this current dividend policy in the event of unforeseen shortfalls in normalised
PATAMI.
Given the unprecedented volatility in global markets, the Company will continue to examine the likely impact on its business,
cashflow generation, capital structure and methods in which excess cash beyond the dividend policy and prudent level of cash
required for operations, can be efficiently distributed to our shareholders.
Moving forward, TM is focused on building a strong foundation for its future growth and operational excellence.
TELEKOM MALAYSIA BERHAD (Bursa Malaysia Announcement Reference No TM-081113-37325)
Date Announced :13/11/2008
Reiteration of Dividend Policy
30
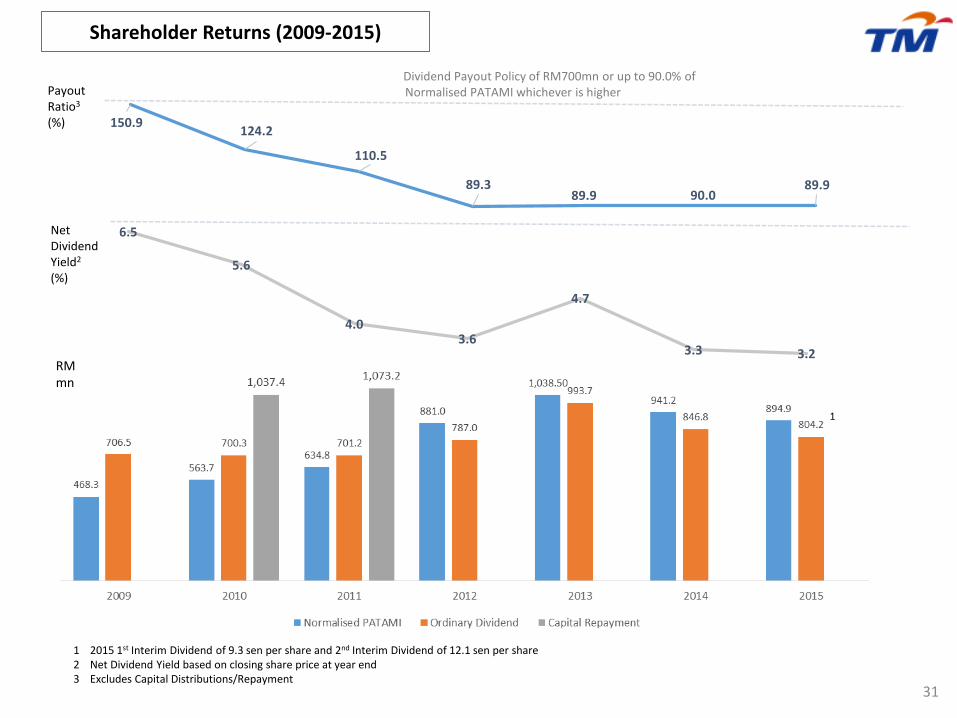
150.9124.2
110.5
89.389.9 90.0
89.9
6.5
5.6
4.03.6
4.7
3.3 3.2
Shareholder Returns (2009-2015)
Dividend Payout Policy of RM700mn or up to 90.0% of Normalised PATAMI whichever is higher
RM mn
Payout Ratio3
(%)
Net Dividend Yield2
(%)
1 2015 1st Interim Dividend of 9.3 sen per share and 2nd Interim Dividend of 12.1 sen per share2 Net Dividend Yield based on closing share price at year end3 Excludes Capital Distributions/Repayment
31
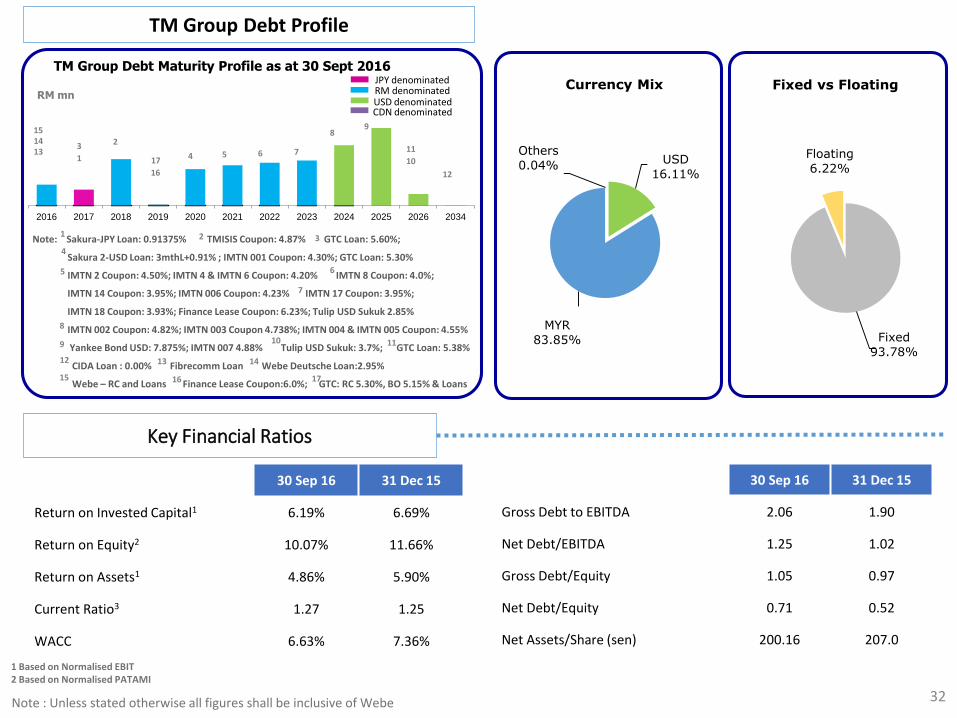
TM Group Debt Profile
32
Key Financial Ratios
1 Based on Normalised EBIT2 Based on Normalised PATAMI
Note : Unless stated otherwise all figures shall be inclusive of Webe
2016 2017 2018 2019 2020 2021 2022 2023 2024 2025 2026 2034
TM Group Debt Maturity Profile as at 30 Sept 2016
RM mn
Note: Sakura-JPY Loan: 0.91375% TMISIS Coupon: 4.87% GTC Loan: 5.60%;
Sakura 2-USD Loan: 3mthL+0.91% ; IMTN 001 Coupon: 4.30%; GTC Loan: 5.30%
IMTN 2 Coupon: 4.50%; IMTN 4 & IMTN 6 Coupon: 4.20% IMTN 8 Coupon: 4.0%;
IMTN 14 Coupon: 3.95%; IMTN 006 Coupon: 4.23% IMTN 17 Coupon: 3.95%;
IMTN 18 Coupon: 3.93%; Finance Lease Coupon: 6.23%; Tulip USD Sukuk 2.85%
IMTN 002 Coupon: 4.82%; IMTN 003 Coupon 4.738%; IMTN 004 & IMTN 005 Coupon: 4.55%
Yankee Bond USD: 7.875%; IMTN 007 4.88% Tulip USD Sukuk: 3.7%; GTC Loan: 5.38%
CIDA Loan : 0.00% Fibrecomm Loan Webe Deutsche Loan:2.95%
Webe – RC and Loans Finance Lease Coupon:6.0%; GTC: RC 5.30%, BO 5.15% & Loans
1 2 3
5 6
5
8
9 10
12
JPY denominatedRM denominatedUSD denominatedCDN denominated
1
2
4 76
98
11
10
12
13
7
3
4
14
14
15
15
13
11
17 16
17
16
USD
16.11%
MYR
83.85%
Others
0.04%
Currency Mix
Fixed
93.78%
Floating
6.22%
Fixed vs Floating
30 Sep 16 31 Dec 15
Return on Invested Capital1 6.19% 6.69%
Return on Equity2 10.07% 11.66%
Return on Assets1 4.86% 5.90%
Current Ratio3 1.27 1.25
WACC 6.63% 7.36%
30 Sep 16 31 Dec 15
Gross Debt to EBITDA 2.06 1.90
Net Debt/EBITDA 1.25 1.02
Gross Debt/Equity 1.05 0.97
Net Debt/Equity 0.71 0.52
Net Assets/Share (sen) 200.16 207.0
THANK YOUInvestor Relations
Level 11 (South Wing), Menara TMJalan Pantai Baharu50672 Kuala Lumpur
MalaysiaTel: (603) 2240 4848/ 7366 / 7388