shear strength characteristics of sand-waste …eprints.usm.my/27574/1/1-iem2009.pdf · shear...
TRANSCRIPT
Shear Strength CharaCteriStiCS of Sand-WaSte Material Mixture
Chow Shiao huey1, norshida ismail2, and abdul naser abdul ghani3
1Faculty of Civil Engineering, Universiti Teknologi MARA, Jalan Permatang Pauh, 13500 Permatang Pauh, Penang
2Indah Water Konsortium Sdn Bhd, Level 2, Blok J, Pusat Bandar Damansara, 50490 Kuala Lumpur
3Infrastructure Technology Research Unit, School of Housing, Building and Planning, Universiti Sains Malaysia, 14300 USM, Penang
E-mail: [email protected]
abstractThis study investigates the shear strength characteristics of sand-waste material mixtures using direct shear test. Two different waste materials namely tire shred and rubber shred were investigated in this study. Three direct shear test series were conducted to investigate repeatability of test specimen, effect of sand matrix relative density and effect of waste material content. It is observed that the friction angle increases with increasing sand matrix relative density for the mixtures. Shear strength of mixtures was also found to increase with increasing waste materials content of up to 30%.
Keywords: Direct Shear Test, Sand-Waste Material Mixture, Shear Strength
1.0 introduCtionThe disposal of waste materials such as used tires have
created major problem all over the world including Malaysia. The problem worsens with undesired wastes that are being produced at increasing rates every year due to the rapid increase in population in Malaysia. One way to recycle the waste materials is to apply them in civil engineering. These waste materials can either be applied alone, in soil mixture or being bound by binder. Some reported applications are as lightweight fills for embankment and retaining structures [1-2], drainage media in landfill [3], aggregate replacement in concrete and asphalt mixture [4-5]. A successful application of these waste materials would require well defined engineering properties especially shear strength characteristics.
2.0 literature reVieWFoose et al. [6] investigated shear strength properties of
sand reinforced with shredded waste tires using large-scale direct shear test. Three factors were found to significantly affect the shear strength of sand-tire mixture, namely normal stress, sand matrix unit weight and shred content. In all cases, adding shredded tires increased the shear strength of sand, with an apparent friction angle, φ’ as large as 67° being obtained.
Tatlisoz et al. [7] conducted direct shear test on sand-tire-chip and sandy silt-tire chip mixtures. The shear strength of the sand-tire chip mixtures was found to increase with increasing tire chip content up to 30% by volume. However, the friction angle of the sandy silt-tire chip mixtures is nearly independent of tire chip content.
Lee et al. [8] investigated shear strength of steel-free tire chips of mostly larger than 30 mm using triaxial apparatus. The results of the test indicated that the variation of deviator stress versus strain is linear. No peak deviator stress was obtained under different confining pressures.
Youwai and Bergado [9] conducted drained triaxial compression tests on shredded rubber tire-sand mixtures mixed at different ratios. An increasing proportion of sand in the mix was found to increase the mixture’s shear strength and unit weight, but cause a decrease in the isotropic compression deformation.
Zornberg et al. [10] investigated the effect of tire shred content, aspect ratio and sand matrix relative density on the shear strength of tire shred-sand mixtures using large-scale triaxial apparatus. The mixture’s shear strength was found to increase with increasing tire shred content of up to 35% and increasing tire shred aspect ratio especially when the aspect ratio was increased from 4 to 8. It was also noted that the influence of sand matrix relative density is more significant for pure sand as compared to tire shred-sand mixture.
Mahmoud Ghazavi [11] conducted direct shear tests on various sand-rubber mixtures having 0%, 10%, 15%, 20%, 25%, 70%, and 100% waste hose particles by weight. Three influencing parameters on shear strength characteristics of sand-rubber mixtures were identified, namely normal stress, mixture unit weight, and rubber content. No significant increment in friction angle was observed but an apparent cohesion appears in the mixtures.
Mahmoud Ghazavi and Amel Sakhi [12] studied the influence of optimised tire shreds on shear strength parameters of sand. Large direct shear tests were carried out at three shred
Journal - The Institution of Engineers, Malaysia (Vol. 70, No.1, March 2009)36
(Date received: 19.2.2008)
Shear Strength CharaCteriStiCS of Sand-WaSte Material Mixture
Journal - The Institution of Engineers, Malaysia (Vol. 70, No.1, March 2009) 37
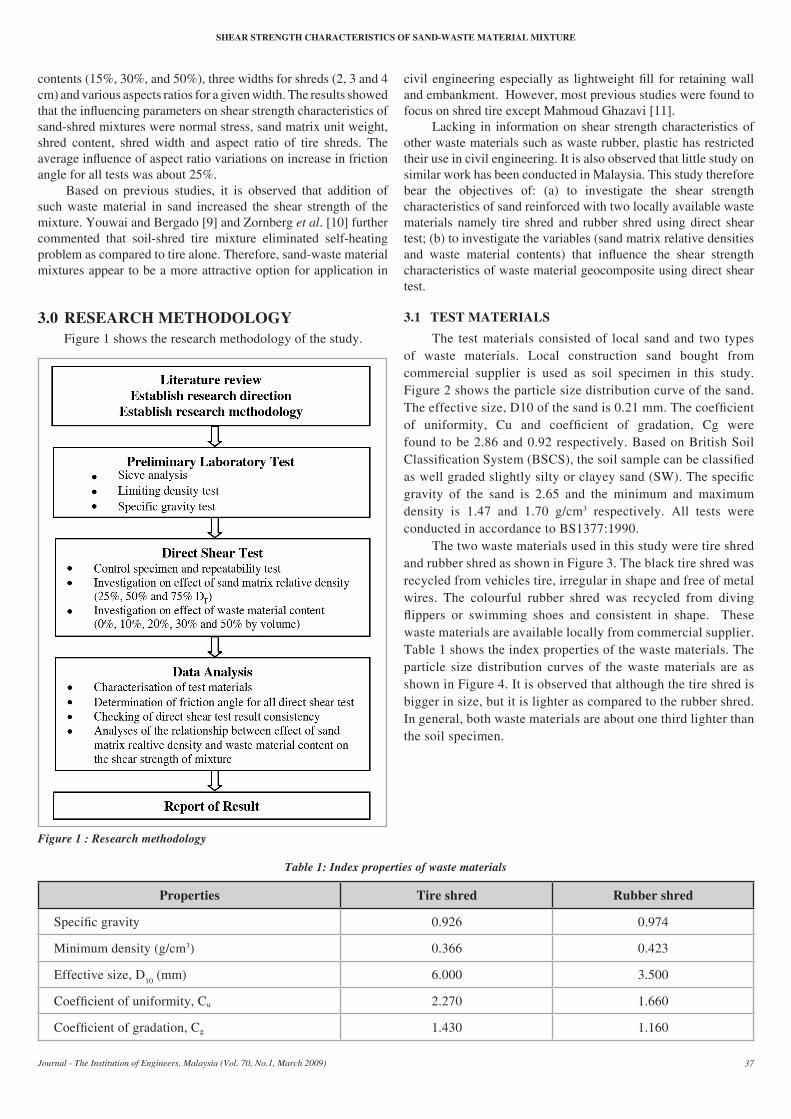
3.0 reSearCh MethodologY Figure 1 shows the research methodology of the study.
3.1 teSt MaterialS
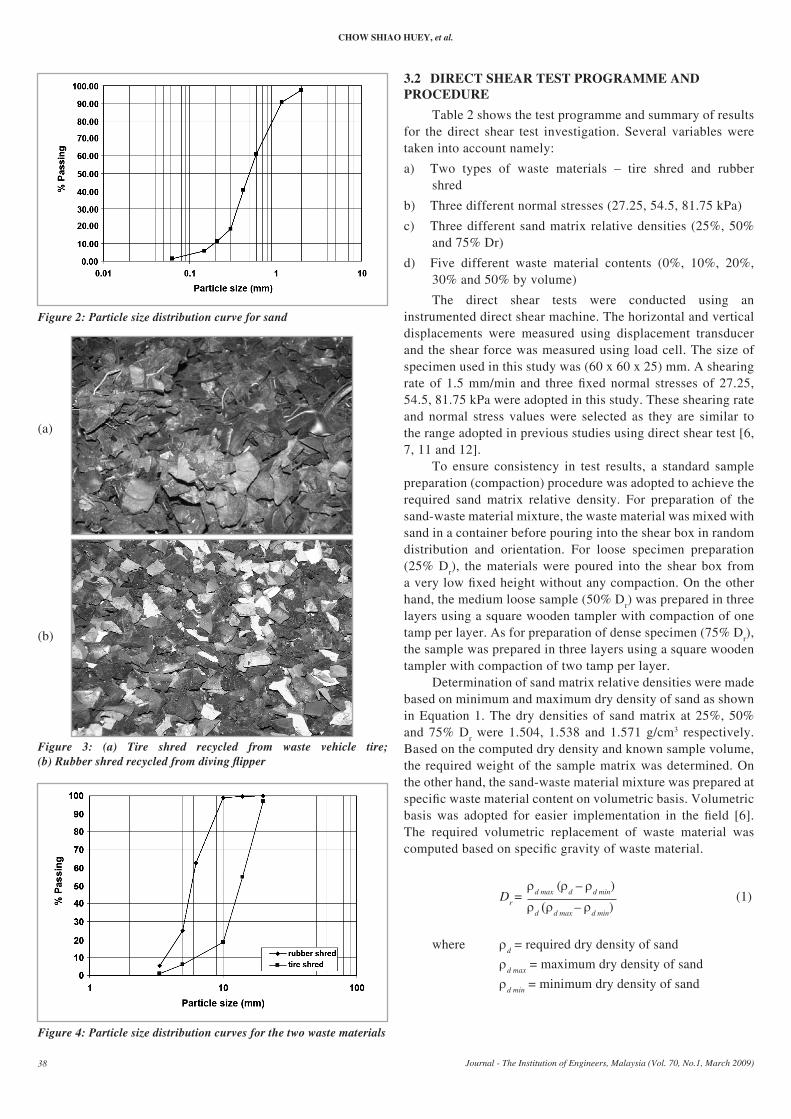
The test materials consisted of local sand and two types of waste materials. Local construction sand bought from commercial supplier is used as soil specimen in this study. Figure 2 shows the particle size distribution curve of the sand. The effective size, D10 of the sand is 0.21 mm. The coefficient of uniformity, Cu and coefficient of gradation, Cg were found to be 2.86 and 0.92 respectively. Based on British Soil Classification System (BSCS), the soil sample can be classified as well graded slightly silty or clayey sand (SW). The specific gravity of the sand is 2.65 and the minimum and maximum density is 1.47 and 1.70 g/cm3 respectively. All tests were conducted in accordance to BS1377:1990.
The two waste materials used in this study were tire shred and rubber shred as shown in Figure 3. The black tire shred was recycled from vehicles tire, irregular in shape and free of metal wires. The colourful rubber shred was recycled from diving flippers or swimming shoes and consistent in shape. These waste materials are available locally from commercial supplier. Table 1 shows the index properties of the waste materials. The particle size distribution curves of the waste materials are as shown in Figure 4. It is observed that although the tire shred is bigger in size, but it is lighter as compared to the rubber shred. In general, both waste materials are about one third lighter than the soil specimen.
contents (15%, 30%, and 50%), three widths for shreds (2, 3 and 4 cm) and various aspects ratios for a given width. The results showed that the influencing parameters on shear strength characteristics of sand-shred mixtures were normal stress, sand matrix unit weight, shred content, shred width and aspect ratio of tire shreds. The average influence of aspect ratio variations on increase in friction angle for all tests was about 25%.
Based on previous studies, it is observed that addition of such waste material in sand increased the shear strength of the mixture. Youwai and Bergado [9] and Zornberg et al. [10] further commented that soil-shred tire mixture eliminated self-heating problem as compared to tire alone. Therefore, sand-waste material mixtures appear to be a more attractive option for application in
civil engineering especially as lightweight fill for retaining wall and embankment. However, most previous studies were found to focus on shred tire except Mahmoud Ghazavi [11].
Lacking in information on shear strength characteristics of other waste materials such as waste rubber, plastic has restricted their use in civil engineering. It is also observed that little study on similar work has been conducted in Malaysia. This study therefore bear the objectives of: (a) to investigate the shear strength characteristics of sand reinforced with two locally available waste materials namely tire shred and rubber shred using direct shear test; (b) to investigate the variables (sand matrix relative densities and waste material contents) that influence the shear strength characteristics of waste material geocomposite using direct shear test.
Figure 1 : research methodology
Properties tire shred rubber shred
Specific gravity 0.926 0.974
Minimum density (g/cm3) 0.366 0.423
Effective size, D10 (mm) 6.000 3.500
Coefficient of uniformity, Cu 2.270 1.660
Coefficient of gradation, Cg 1.430 1.160
table 1: Index properties of waste materials
ChoW Shiao hueY, et al.
Journal - The Institution of Engineers, Malaysia (Vol. 70, No.1, March 2009)38
Figure 2: Particle size distribution curve for sand
(a)
(b)
Figure 3: (a) tire shred recycled from waste vehicle tire; (b) Rubber shred recycled from diving flipper
Figure 4: Particle size distribution curves for the two waste materials
3.2 direCt Shear teSt PrograMMe and ProCedure
Table 2 shows the test programme and summary of results for the direct shear test investigation. Several variables were taken into account namely:
a) Two types of waste materials – tire shred and rubber shred
b) Three different normal stresses (27.25, 54.5, 81.75 kPa)
c) Three different sand matrix relative densities (25%, 50% and 75% Dr)
d) Five different waste material contents (0%, 10%, 20%, 30% and 50% by volume)
The direct shear tests were conducted using an instrumented direct shear machine. The horizontal and vertical displacements were measured using displacement transducer and the shear force was measured using load cell. The size of specimen used in this study was (60 x 60 x 25) mm. A shearing rate of 1.5 mm/min and three fixed normal stresses of 27.25, 54.5, 81.75 kPa were adopted in this study. These shearing rate and normal stress values were selected as they are similar to the range adopted in previous studies using direct shear test [6, 7, 11 and 12].
To ensure consistency in test results, a standard sample preparation (compaction) procedure was adopted to achieve the required sand matrix relative density. For preparation of the sand-waste material mixture, the waste material was mixed with sand in a container before pouring into the shear box in random distribution and orientation. For loose specimen preparation (25% Dr), the materials were poured into the shear box from a very low fixed height without any compaction. On the other hand, the medium loose sample (50% Dr) was prepared in three layers using a square wooden tampler with compaction of one tamp per layer. As for preparation of dense specimen (75% Dr), the sample was prepared in three layers using a square wooden tampler with compaction of two tamp per layer.
Determination of sand matrix relative densities were made based on minimum and maximum dry density of sand as shown in Equation 1. The dry densities of sand matrix at 25%, 50% and 75% Dr were 1.504, 1.538 and 1.571 g/cm3 respectively. Based on the computed dry density and known sample volume, the required weight of the sample matrix was determined. On the other hand, the sand-waste material mixture was prepared at specific waste material content on volumetric basis. Volumetric basis was adopted for easier implementation in the field [6]. The required volumetric replacement of waste material was computed based on specific gravity of waste material.
Dr = (1)
where ρd = required dry density of sand
ρd max
= maximum dry density of sand
ρd min
= minimum dry density of sand
ρd max
(ρd – ρ
d min)
ρd (ρ
d max – ρd min
)

Shear Strength CharaCteriStiCS of Sand-WaSte Material Mixture
Journal - The Institution of Engineers, Malaysia (Vol. 70, No.1, March 2009) 39
table 2: test program and result for direct shear test
test series MixtureSand matrix
relative density, dr (%)
Waste material content (by
volume) (%)
friction angle, φ′ (°)
apparent cohesion, c′
(kPa)
Control specimen and repeatability test
Sand 25 0 27.58 4.35
Sand 25 0 27.70 4.17
Sand 50 0 27.93 5.37
Sand 50 0 27.93 5.65
Sand 75 0 28.83 5.93
Sand 75 0 28.16 6.20
Sand-Tire shred 50 20 32.91 7.13
Sand-Tire shred 50 20 32.29 5.83
Sand-Rubber shred 50 20 32.91 8.24
Sand-Rubber shred 50 20 32.29 8.43
Investigation on effect of sand matrix relative density
Sand-Tire shred 25 20 31.52 5.25
Sand-Tire shred 50 20 32.61 6.48
Sand-Tire shred 75 20 34.13 6.99
Sand-Rubber shred 25 20 32.08 5.84
Sand-Rubber shred 50 20 32.61 8.33
Sand-Rubber shred 75 20 32.91 9.07
Investigation on effect of waste material content
Sand-Tire shred 50 10 32.09 8.42
Sand-Tire shred 50 20 32.61 6.48
Sand-Tire shred 50 30 33.54 8.88
Sand-Tire shred 50 50 32.29 4.17
Sand-Rubber shred 50 10 32.30 8.70
Sand-Rubber shred 50 20 32.61 8.33
Sand-Rubber shred 50 30 32.92 12.68
Sand-Rubber shred 50 50 29.50 11.39
4.0 reSearCh findingS4.1 Control SPeCiMen and rePeatabilitY teSt
Repeated testing on five different control specimen combinations were conducted in Test Series 1 as shown in Table 2. The first three test pairs investigated the consistency of pure sand at three different relative densities, namely loose (25% Dr), medium loose (50% Dr) and dense conditions (75% Dr). The last two pairs involved 20% tire-sand and 20% rubber-sand mixtures at medium loose condition (50% Dr). Average result was computed as control data for subsequent test series. Figure 5 shows the average shear

ChoW Shiao hueY, et al.
Journal - The Institution of Engineers, Malaysia (Vol. 70, No.1, March 2009)40
stress versus normal stress plot of the five test pairs. The average friction angles and cohesions of sand at 25%, 50% and 75% Dr were 27.58, 27.93, 28.16o and 4.35, 5.51, 6.07 kPa respectively. On the other hand, the 20% tire-sand mixtures produced average friction angle and cohesion of 32.61° and 6.48 kPa respectively. The 20% rubber-sand mixtures coincidently produced the same friction angle as the 20% tire-sand mixtures (32.61°) but with a higher apparent cohesion of 8.33 kPa. In general, high consistency of less than 2% difference in friction angle was achieved for all five test pairs. This indicates that the control measures taken were effective in ensuring the consistency and repeatability of the test results.
Figure 6 shows the variation of shear stress versus horizontal displacement for the sand-tire shred and sand-rubber shred mixtures at the three normal stresses. A higher shear stress was produced with higher normal stress. It is also observed that peak shear stress can be detected. Average peak shear stresses of 25.278, 38.611 and 60.139 kPa were observed for 20% tire-sand mixtures at normal stresses of 27.25, 54.50 and 81.75 kPa respectively. On the other hand, average peak shear stresses of 25.556, 43.611 and 60.417 kPa were observed for 20% rubber-sand mixtures at normal stresses of 27.25, 54.50 and 81.75 kPa respectively. Mahmoud Ghazavi [11] reported similar finding whereas Foose et al. [6] and Tatlisoz et al. [7] reported a continuous increase in shear stress with no peak shear stress observed. The variation in trend is most likely caused by the variation in waste material size. The waste material studied by Mahmoud Ghazavi [11] was similar in size with this study whereas larger materials were used in studies by Foose et al. [6] and Tatlisoz et al. [7].
It is observed that the sand-waste material mixtures produce apparent cohesion, c’. Similar findings were also reported by previous studies using either direct shear or triaxial testing [6-12]. Mahmoud Ghazavi [11] explained that the apparent cohesion may be attributed to penetration of sands into the waste material grains due to elastic deformation at no or low normal stress. When shear stress is applied, this bridging resistance is appeared in the form of cohesion.
Figure 5: average shear strength envelopes for control specimens
(a)
(b)
Figure 6: Variation of shear stress with horizontal displacement for (a) 20% tire shred-sand mixture at 50% Dr; (b) 20% rubber shred-sand mixture at 50% Dr
4.2 inVeStigation on effeCt of Sand Matrix relatiVe denSitY
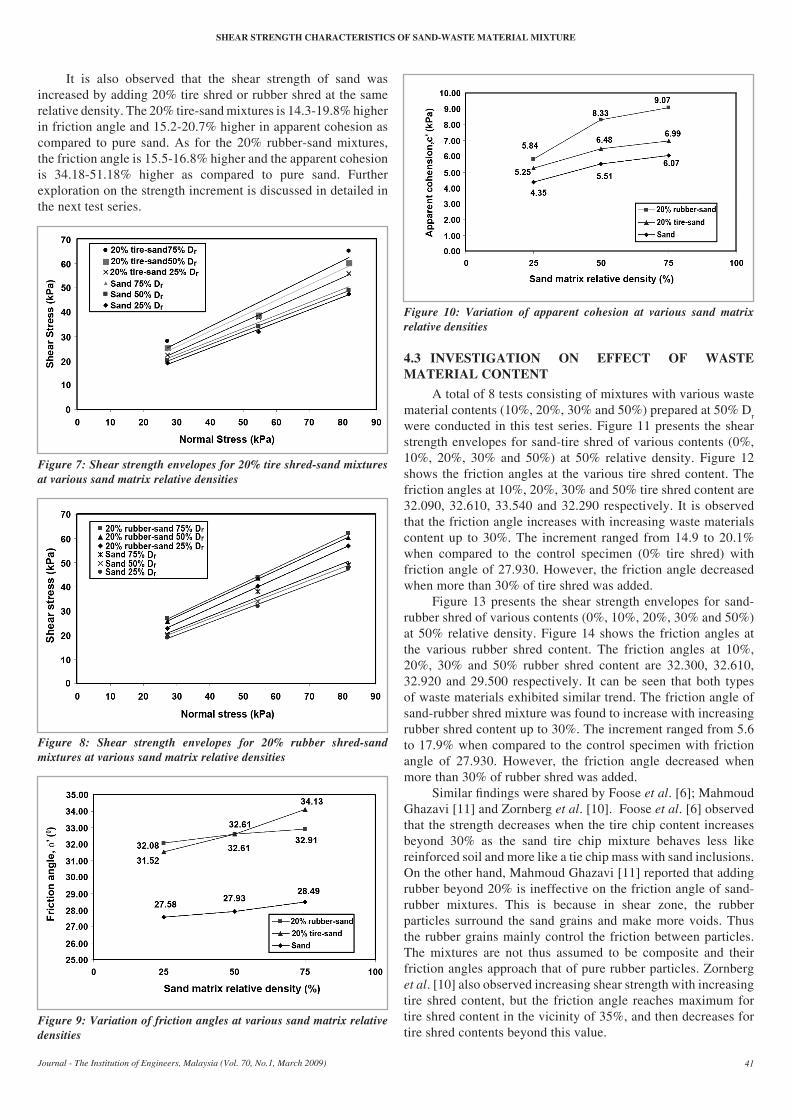
In Test Series 2, 20% tire-sand and 20% rubber-sand mixtures prepared at three different relative densities (25%, 50% and 75% Dr) were tested. Figures 7 and 8 show the shear strength envelopes for control specimen (pure sand) and both 20% waste material-sand mixtures at the three relative densities (25%, 50% and 75% Dr). Figure 9 shows the comparison of the friction angle between the control specimen and both 20% tire-waste material mixtures. Figure 10 shows the variation of apparent cohesion for the mixtures and pure sand at the three sand matrix relative densities.
It is observed that the friction angles for both pure sand and sand-waste material mixtures increase with increasing relative density. The friction angle increased from 31.52o to 34.13° when the relative density increased from 25% to 75% for sand-tire shred mixtures. However, the increment in friction angle is less significant for sand-rubber shred mixtures where an increment of only 32.08° to 32.91° was observed at the same relative density range. Similar findings were also reported by Foose et al. [6] and Mahmoud Ghazavi [11]. Foose et al. [6] reported that sand-tire shred mixtures with higher sand matrix unit weight (16.8 kN/m3) produced initial friction angle that is 15o higher in average as compared to mixtures with lower sand matrix unit weight (14.7 kN/m3). On the other hand, Mahmoud Ghazavi [11] reported that the friction angle was between 31.2-35.30 for loose sand-waste hose mixtures and between 37-37.60 for dense mixtures.
Shear Strength CharaCteriStiCS of Sand-WaSte Material Mixture
Journal - The Institution of Engineers, Malaysia (Vol. 70, No.1, March 2009) 41
It is also observed that the shear strength of sand was increased by adding 20% tire shred or rubber shred at the same relative density. The 20% tire-sand mixtures is 14.3-19.8% higher in friction angle and 15.2-20.7% higher in apparent cohesion as compared to pure sand. As for the 20% rubber-sand mixtures, the friction angle is 15.5-16.8% higher and the apparent cohesion is 34.18-51.18% higher as compared to pure sand. Further exploration on the strength increment is discussed in detailed in the next test series.
Figure 7: shear strength envelopes for 20% tire shred-sand mixtures at various sand matrix relative densities
Figure 8: shear strength envelopes for 20% rubber shred-sand mixtures at various sand matrix relative densities
Figure 9: Variation of friction angles at various sand matrix relative densities
Figure 10: Variation of apparent cohesion at various sand matrix relative densities
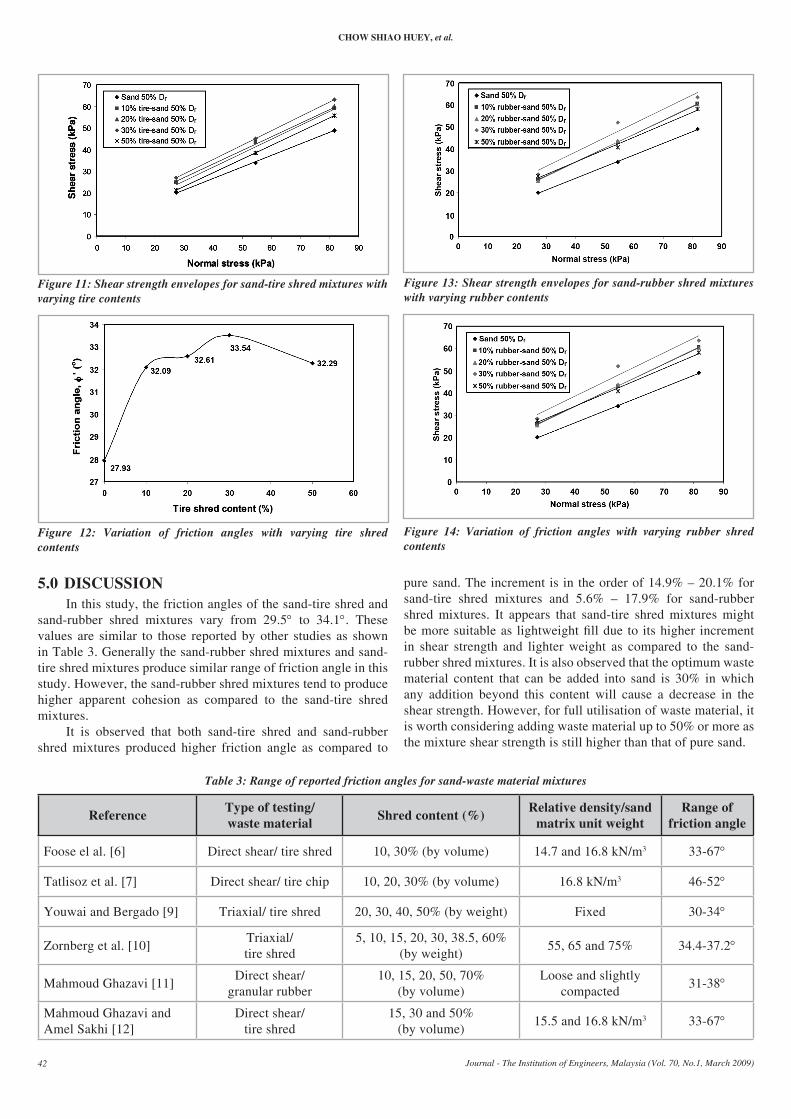
4.3 inVeStigation on effeCt of WaSte Material Content
A total of 8 tests consisting of mixtures with various waste material contents (10%, 20%, 30% and 50%) prepared at 50% Dr were conducted in this test series. Figure 11 presents the shear strength envelopes for sand-tire shred of various contents (0%, 10%, 20%, 30% and 50%) at 50% relative density. Figure 12 shows the friction angles at the various tire shred content. The friction angles at 10%, 20%, 30% and 50% tire shred content are 32.090, 32.610, 33.540 and 32.290 respectively. It is observed that the friction angle increases with increasing waste materials content up to 30%. The increment ranged from 14.9 to 20.1% when compared to the control specimen (0% tire shred) with friction angle of 27.930. However, the friction angle decreased when more than 30% of tire shred was added.
Figure 13 presents the shear strength envelopes for sand-rubber shred of various contents (0%, 10%, 20%, 30% and 50%) at 50% relative density. Figure 14 shows the friction angles at the various rubber shred content. The friction angles at 10%, 20%, 30% and 50% rubber shred content are 32.300, 32.610, 32.920 and 29.500 respectively. It can be seen that both types of waste materials exhibited similar trend. The friction angle of sand-rubber shred mixture was found to increase with increasing rubber shred content up to 30%. The increment ranged from 5.6 to 17.9% when compared to the control specimen with friction angle of 27.930. However, the friction angle decreased when more than 30% of rubber shred was added.
Similar findings were shared by Foose et al. [6]; Mahmoud Ghazavi [11] and Zornberg et al. [10]. Foose et al. [6] observed that the strength decreases when the tire chip content increases beyond 30% as the sand tire chip mixture behaves less like reinforced soil and more like a tie chip mass with sand inclusions. On the other hand, Mahmoud Ghazavi [11] reported that adding rubber beyond 20% is ineffective on the friction angle of sand-rubber mixtures. This is because in shear zone, the rubber particles surround the sand grains and make more voids. Thus the rubber grains mainly control the friction between particles. The mixtures are not thus assumed to be composite and their friction angles approach that of pure rubber particles. Zornberg et al. [10] also observed increasing shear strength with increasing tire shred content, but the friction angle reaches maximum for tire shred content in the vicinity of 35%, and then decreases for tire shred contents beyond this value.
ChoW Shiao hueY, et al.
Journal - The Institution of Engineers, Malaysia (Vol. 70, No.1, March 2009)42
5.0 diSCuSSionIn this study, the friction angles of the sand-tire shred and
sand-rubber shred mixtures vary from 29.5° to 34.1°. These values are similar to those reported by other studies as shown in Table 3. Generally the sand-rubber shred mixtures and sand-tire shred mixtures produce similar range of friction angle in this study. However, the sand-rubber shred mixtures tend to produce higher apparent cohesion as compared to the sand-tire shred mixtures.
It is observed that both sand-tire shred and sand-rubber shred mixtures produced higher friction angle as compared to
pure sand. The increment is in the order of 14.9% – 20.1% for sand-tire shred mixtures and 5.6% – 17.9% for sand-rubber shred mixtures. It appears that sand-tire shred mixtures might be more suitable as lightweight fill due to its higher increment in shear strength and lighter weight as compared to the sand-rubber shred mixtures. It is also observed that the optimum waste material content that can be added into sand is 30% in which any addition beyond this content will cause a decrease in the shear strength. However, for full utilisation of waste material, it is worth considering adding waste material up to 50% or more as the mixture shear strength is still higher than that of pure sand.
Figure 11: shear strength envelopes for sand-tire shred mixtures with varying tire contents
Figure 12: Variation of friction angles with varying tire shred contents
Figure 13: shear strength envelopes for sand-rubber shred mixtures with varying rubber contents
Figure 14: Variation of friction angles with varying rubber shred contents
table 3: range of reported friction angles for sand-waste material mixtures
reference type of testing/ waste material Shred content (%) relative density/sand
matrix unit weightrange of
friction angle
Foose el al. [6] Direct shear/ tire shred 10, 30% (by volume) 14.7 and 16.8 kN/m3 33-67°
Tatlisoz et al. [7] Direct shear/ tire chip 10, 20, 30% (by volume) 16.8 kN/m3 46-52°
Youwai and Bergado [9] Triaxial/ tire shred 20, 30, 40, 50% (by weight) Fixed 30-34°
Zornberg et al. [10] Triaxial/ tire shred
5, 10, 15, 20, 30, 38.5, 60%(by weight)
55, 65 and 75% 34.4-37.2°
Mahmoud Ghazavi [11]Direct shear/
granular rubber10, 15, 20, 50, 70%
(by volume)Loose and slightly
compacted31-38°
Mahmoud Ghazavi and Amel Sakhi [12]
Direct shear/ tire shred
15, 30 and 50% (by volume)
15.5 and 16.8 kN/m3 33-67°

Shear Strength CharaCteriStiCS of Sand-WaSte Material Mixture
Journal - The Institution of Engineers, Malaysia (Vol. 70, No.1, March 2009) 43
referenCeS[1] S. Yoon, M. Prezzi, N. Z. Siddiki and B. Kim, “Construction
of a Test Embankment Using a Sand-Tire Shred Mixture as Fill Material”, Waste Management, Vol. 26, No. 9, pp. 1033- 1044, 2006.
[2] V. Tandon, D. A. Velazco, S. Nazarian and M. Picornell, “Performance Monitoring of Embankments Containing Tire Chips: Case Study”, Journal of Performance of Constructed Facilities, Vol. 21, No. 3, pp. 207-214, 2007.
[3] K. R. Reddy and A. Marella, “Properties of Different Size Tire shred Shreds: Implications on Using as Drainage Material in Landfill Cover Systems”, Proceedings of the 17th International Conference on Solid Waste Technology and Management, PA, USA, pp. 1-19, 2001.
[4] M. C. Bignozzi and F. Sandrolini, “Tyre Rubber Waste Recycling In Self-Compacting Concrete”, Cement and Concrete Research, Vol. 36, No. 4, pp. 735-739, 2006.
[5] W. D. Cao, “Study on Properties of Recycled Tire Rubber Modified Asphalt Mixtures Using Dry Process”, Construction and Building Materials, Vol. 21, No. 5, pp. 1011-1015, 2007.
[6] G. J. Foose, C. H. Benson and P. J. Boscher, “Sand Reinforced with Shredded Waste Tires”, Journal of Geotechnical Engineering, Vol. 122, No. 9, pp. 760-767, 1996.
[7] N. Tatlisoz, T. B. Edil and C. H. Benson, “Interaction Between Reinforcing Geosynthetics and Soil-Tire Chip Mixtures”, Journal of Geotechnical and Geoenvironmental Engineering, Vol. 124, No. 11, pp. 1109-1119, 1998.
[8] J. H. Lee, R. Salgado, A. Bernal and C. W. Lovell, “Shredded Tires and Rubber-Sand as Lightweight Backfill”, Journal of Geotechnical and Geoenvironmental Engineering, Vol. 125, No. 2, pp. 132-140, 1999.
[9] S. Youwai and D. T. Bergado, “Strength and Deformation Characteristics of Shredded Rubber Tire - Sand Mixtures”, Canadian Geotechnical Journal, Vol. 40, No. 2, pp. 254-264, 2003.
[10] J. G. Zornberg, A, R. Cabral, and C. Viratjandr, “Behaviour of Tire Shred - Sand Mixtures”, Canadian Geotechnical Journal, Vol. 41, No. 2, pp. 227-241, 2004.
[11] Mahmoud Ghazavi, “Shear Strength Characteristics of Sand-Mixed with Granular Rubber”, Journal of Geotechnical and Geological Engineering, Vol. 22, No. 3, pp. 401-416, 2004.
[12] Mahmoud Ghazavi and Masoud Amel Sakhi, “Influence of Optimized Tire Shreds on Shear Strength Parameters of Sand”, International Journal of Geomechanics, Vol. 5, No. 1, pp. 58- 65, 2005.
[13] British Standard Institution (1990). BS 1377 : Methods of Test for Civil Engineering Purposes, BSI, London.
6.0 ConCluSionThis study investigates the shear strength characteristics
of sand-waste material mixture using direct shear test. Two different waste materials namely tire shred and rubber shred were investigated in this project. The soil specimen used is local sand. Three direct shear test series were conducted, namely control specimen and repeatability test (Test Series 1), investigation on effect of sand matrix relative density (Test Series 2) and effect of waste material content (Test Series 3). In Test Series 1, high repeatability was observed with less than 2.0% difference in friction angle. Apparent cohesion was found to exist for both types of sand-waste material mixtures. In Test Series 2, the friction angle increases with increasing sand matrix relative density for both types of sand-waste material mixtures. In Test Series 3, it is observed that the friction angle increases with increasing waste materials content up to 30% for both types
of sand-waste material mixtures. The overall increment ranged from 5.6% to 20.1% when compared to pure sand. However, a decrease in friction angle was observed when more than 30% of waste material was added to the sand. In summary, it is found that sand matrix relative density and waste material content are the two main factors affecting the shear strength characteristics of the waste material-sand mixture. For future study, one possible investigation is to study on effect of orientation of waste material on the shear strength of the sand-waste material mixture. Investigation on effect of waste material size and aspect ratio could also be conducted.
7.0 aCKnoWledgeMentThe authors would like to thank Rubplast Sdn. Bhd.,
Malaysia for providing some of the waste materials.
ProfileS
ChoW Shiao hueYChow Shiao Huey received her B.Eng. degree (Hons) in civil engineering from Universiti Teknologi Malaysia and her M.Eng. degree in geotechnical engineering from Nanyang Technological University, Singapore. She is a lecturer in the Faculty of Civil Engineering at Universiti Teknologi MARA Pulau Pinang.
norShida iSMailNorshida Ismail received her B.Eng. degree (Hons) in civil engineering from Universiti Teknologi MARA. She is currently a project engineer at Indah Water Konsortium Sdn Bhd.
dr a naSer abdul ghaniDr A Naser Abdul Ghani obtained his BSc Eng from Ohio University (USA) 1986, his MSc Eng. (Hydraulic and Hydrology) from Universiti Teknologi Malaysia, and his Ph.D. (Geotechnical Engineering) from Universiti Sains Malaysia. His main area of expertise is civil engineering infrastructures for housing and land development. He has professional and consulting experiences in the planning, design and construction of civil infrastructure works including soil improvement and earth retention/stabilisation systems, drainage and flood control facilities, sewerage systems, water supply systems and roads. His current research works are related to civil infrastructure technology and sustainability.