processes and achievements of malaysia’s economic
TRANSCRIPT
- 1 -
MALAYSIA’S ECONOMIC GLOBALIZATION IN THE MILIEU OF THE
DECEPTIVE GAME OF CAPITALIST GLOBALIZATION
Rafiqul Islam Molla
Department of Economics
Faculty of Business and Law
Multimedia University
Melaka, Malaysia
E-mail: [email protected]
Md. Wahid Murad
Business School, Faculty of the Professions
The University of Adelaide, Adelaide
South Australia, Australia
E-mail: [email protected]
Md. Mahmudul Alam
Institute for Environment and Development (LESTARI)
National University of Malaysia (UKM)
Selangor Darul Ehsan, Malaysia
Email: [email protected]
Corresponding author
Acknowledgement: Authors are thankful to Prof. Dr. Khondaker Mizanur Rahman of Nanzan University, Japan
for his most valuable contribution at the initial stage of preparation of this paper.
- 2 -
MALAYSIA’S ECONOMIC GLOBALIZATION IN THE MILIEU OF THE
DECEPTIVE GAME OF CAPITALIST GLOBALIZATION
Abstract
Capitalist globalization is the economic policy of integration of national economies with global economy on the
basis of free market competition. It is a neoliberal prescription for industrialization and growth of the emerging
economies of the South and a project of capital accumulation for the capitalist North through a process of
securing disproportionate share of benefits at the expense of the developing South. Operating in this milieu of
deceptive game of capitalist globalization Malaysia‟s cautious and Malaysia-centric globalization approach has
been found very successful at the national front, but at the international front it seriously failed to reduce
Malaysia‟s income gaps with its rich trade and growth partners. This therefore reconfirms the strength of
deceptive nature of the capitalist globalization. The content analysis and Malaysia‟s globalization experience
poise to support the hypothesis that globalization has high potential to contribute to industrialization and growth
of the emerging economies, but at the same time, being pursued under free market competition it has turned out
to be a deceptive game of the North and cannot be trusted wholeheartedly for emancipation of the developing
economies. The paper suggests for a policy of target oriented „inclusive globalization‟, with the underlying
theme of internationalization of the economies instead of globalization of trade and the perspective of „fair
market‟ instead of „free market‟, to ensure equitable sharing of benefits of specialization and globalization
among the participating nations.
Key words: Economic globalization; Capitalist globalization; Neoliberalism; Fair market; Free market;
Economic nationalism; Malaysia-centric economic globalization, Income convergence; Industrial
competitiveness.
JEL Classification: C32, F13, F43, O11, O19, O47, O57, P16, P17
Introduction
Economic globalization is the integration of national economy with the global economy. Indeed, it is the natural
outcome and the end result of economic development processes in any nation. The internal dynamics of the
process of development pushes the economy going global. It is done primarily through - liberalizing trade and
liberalizing capital investment. In its fullest form it is a borderless economy where, as opposed to a regime of
restriction and protection, there is a regime of free trade of all inputs and outputs. Essentially it is the increased
interconnectedness of national markets reflected in the growth and rise in international trade, foreign
investment, and especially in international financial flows. It is, thus, a strategy of outward looking
industrialization to enjoy the benefits of production for wide world market, specialization, and economies of
scale. Traditionally the development process starts with import-substitution based industrialization, to replace
imports by domestic production, followed by export oriented industrialization, for foreign market exploration,
and finally followed by a technology-intensive high-value adding industrialization. The internal dynamics of
specialization, economies of scale, managerial efficiency, product quality, research and development, etc. at the
national and firm levels create country-specific and firm-specific advantages that strongly argue for going
global. Therefore, for both the developing and developed economies globalization is a fact of life.
Economic globalization is largely thought to be an effective means for making the developed and developing
worlds truly become part of one World -- forged together by a common economic destiny and guided by the
humane principles of peace, friendship, and mutual respect. The strongest economic argument for promoting
economic globalization, is the „gain from trade‟ arising out of specialization and economies of scale. This „gain
from trade‟ is an added income for the trading countries to share and increase their welfare. The internal
dynamics of specialization, economies of scale, managerial efficiency, product quality, research and
development, and quality of products, etc. at the national and firm levels make globalization a more reliable
strategy for sustained economic growth and development. In that sense it is a natural outcome and the end result
of economic development processes of any nation. It is argued that through this process of globalization the
technology transfers from the North would let less developed nations converge to the developed nations‟ level
of economic performances (Crotty and Dymski, 2001:4). Therefore it is prescribed and pushed as a policy
strategy for outward looking industrialization and economic growth of the developing countries of the South.
Unfortunately, however, there is a dark and ugly face of capitalist globalization. This ugly face makes it a
deceptive strategy and a threat to the cause of developing economies. Development theories that advocate for

- 3 -
globalization as a way forward for global economic growth with equitable sharing of the gains from growth
among participating nations are unfortunately founded on the assumption of perfect market which is an
unrealistic and wrong assumption for the global economy consisting of national economies widely unequal in
terms of political and economic powers and levels of industrialization and competency. Under the circumstances
capitalist globalization only leads industrialized powerful countries and developing weak countries enter into a
centre-periphery relationship in production power structure in which the developing periphery countries become
dependent on the industrialized developed centre countries for their production and trade (Gilpin, 1975). As a
result, by pursuing a strategy of globalization, under the present global economic order, the newly
industrializing countries are subjecting themselves to sharing either only the least or none of the amount of gains
from globalization leaving the industrialized developed partners to enjoy the most or all of it, under the rule
„strongest takes it all‟. Thus, Mahathir, the former Prime Minister of Malaysia, alleges that unregulated capitalist
globalization has been the cause of greater global inequality and underdevelopment of many developing
countries (Billington 2002). As an operational agenda of neoliberalism, globalization is alleged as primarily a
project of capital accumulation for the capitalist North through a process of systematic exploitation of the
developing South (Harvey, 2005:2 and 2009) through manipulation of international prices of goods and services
- highest price for their exports and lowest price for their imports. It is therefore perceived and accused as a
deceptive game of the capitalist North. Under the circumstances it is seen as a double-edged sword for the
industrializing economies. On one hand, it is an indispensible source of their industrialization and economic
growth; and on the other, it is a means of their systematic exploitation by the capitalist countries.
The real world is divided into widely unequal north and south, strong and weak, rich and poor, developed
and developing, industrialized and industrializing countries. Taking full advantage of this uneven global
economic structure the capitalist countries (North) have driven the globalization agenda ensuring that it garners
for them a disproportionate share of benefits, at the expense of the developing countries of the South (Stiglitz,
2002:7). To the industrialized nations economic globalization is to facilitate acquiring their imports, mostly the
primary products, at the lowest prices from developing countries and selling their industrial and financial
products to those countries at the highest prices to generate maximum capital accumulation. By virtue of their
economic strength and bargaining power they always insist to set the prices of their exports and imports closest
to the autarky prices of the developing countries for maximizing capital accumulation. As a result the
industrialized capitalist countries always get most or all of the gains from trade. Therefore, it is pathologically
incapable to benefit developing economies. It is a deceptive game used by the capitalist nations as an
exploitative mechanism for enriching themselves at the expenses of the developing countries; it is a project of
„strongest takes it all‟. By pursuing a strategy of globalization of economy under the present capitalist
framework, industrialized powerful countries and industrializing weak countries enter into a centre-periphery
relationship in production power structure in which the developing industrializing periphery countries become
dependent on the industrialized developed centre countries for their production and trade. To this extent the era
of globalization closely resembles the age of imperialism in the past (Heilbroner and Milberg, 2009:208).
Capitalist globalization, thus, earned the international condemnation for its natural blind eye to the interests of
the developing economies. As a result, the developing economies must pursue globalization only cautiously and
selectively.
Moreover, globalization may be the fact of life and natural outcome and the end result of economic
development processes of any nation, but the truth of the matter is that the capitalist globalization is not the
mainspring of this development process. In fact, economic nationalism founded on mercantilist perspective is its
mainspring. Asian Development Bank, for example, argues for a „market driven but state steered‟ globalization
model („Asian Model‟) as a development strategy for these countries. The unfettered capitalist globalization
cannot be trusted and taken for granted as a workable and profitable development policy for the developing
countries. The Prebisch-Singer hypothesis that developing economies cannot effectively industrialize under
global free-market system lends support to that. We must remember that it was Prime Minister Nehru‟s first
economic policy declaration, „produce or go without it‟ - a sound of economic nationalism and stand for
effectiveness as against efficiency – and not any call for capitalist globalization, that played the trick to
stimulate Indian lion economy to roar. Similarly, with the same magic wand of effectiveness China activated its
dragon economy to spread its wings. The East Asian Tiger economies were energized to grow taller by the touch
of the wisdom of the flexible and adapted state-led growth policy. That is why we observe that in most cases
generally a dual strategy of protection and globalization, which we may like to call a guided globalization, is
used to simultaneously ensure fair sharing of the gains from specialization and trade and guarantee growth and
security of industrial capacity of the national economy. Malaysia‟s globalization largely fits into this category.
Because of its ugly face the unregulated capitalist globalization, pushed and patronized by the developed
industrialized countries, earned international condemnation and is a suspect of deceptions. It cannot be trusted
- 4 -
and must be approached „rationally, moderately, and selectively, rather than whole-heartedly‟ by the developing
economies (Shakur 2002). The demand now is for „inclusive globalization‟, which is globalization under a new
international economic order, guided and regulated to ensure equitable sharing of the benefits of trade and
growth among the participating nations. Its underlying theme is internationalization of the economies rather than
globalization of trade, production for need fulfillment rather than for profit maximization, and replacement of
greed and competition based on the philosophy of „survival of the fittest‟ by the humanity of cooperation based
on the philosophy of „live and let live‟. It is in this context this paper studies the nature, extent, and approach of
Malaysia‟s economic globalization and examines how it has been able to neutralize the negative effects of the
dark-side and enjoy the positive effects of the bright-side of globalization. Using both quantitative and
qualitative methods of analysis, this paper examines how and why Malaysia pursued economic globalization and
with what results, during 1970-2006.
The nature and structure of Malaysia’s globalization
From a background of a colonial agrarian open economy Malaysia formally started its industrialization journey
in 1957 and proceeded phase by phase through the road map of development to realize its vision of becoming a
„fully developed‟ nation by 2020. Its development process follows the usual pattern that starts with the import-
substitution based industrialization followed by export oriented industrialization and finally ends with
technology-intensive high-value adding industrialization. However, globalization of its economy effectively
started from 1970 with the program of export oriented industrialization added with industrial and social
restructurings. Its industrialization and globalization program is characterized by unique features. „Look east’
and ‘Malaysia-centric’ autonomous identity themes are its mastermind and hardcore, and the export processing
zone (EPZ) and economic development corridor (EDC) schemes are its cornerstones. With these unique features
it has become known as a „Malaysia model of economic development and globalization‟. Its structure and time-
path can be summarized from Cheng (2008) as follows:
(1) 1957-1969: Import substitution based industrialization - to encourage growth of domestic industries
for producing simple consumer goods. Targets were production of goods mainly for home
consumption and increase in employment. Tax relief and other incentives and protection from
foreign competition were given to encourage local and foreign companies to set up factories.
(2) 1970-1990: Outward looking industrialization and industrial and social restructuring - to encourage
increased foreign investment and transfer of technology in the country and to link the export oriented
industries with the rest of the domestic sector of the economy. Targets were production for global
market, increase economic growth, eradicate poverty, and reduce disparity in income levels,
education and skill, economic functions, and employment opportunities among different ethnic
groups. It followed the following phases:
(i) 1970-1980: Growth of export-oriented light industries - creation of free trade zones (FTZs) and
provision for various fiscal incentives to attract local and international investments and production
for export.
(ii) 1980-1985: Growth of heavy industries - through establishment of some government pushed and
supported heavy industries like automobile, still, cement, and petrochemicals, under heavy protection
from outside competition. Outputs are meant primarily for local market. This is thus considered as
the second round of import-substitution industrialization in the country.
(iii) 1985-1990: Trade and investment liberalization - to bring structural adjustments in the industrial
sector. Privatization was mooted to transform many government owned companies into government
linked companies (GLC). Tariffs were increasingly reduced. Restriction on foreign equity was
relaxed allowing foreign investors to be able to hold up to 100% of the equity. This policy-shift
toward more market oriented and outward-looking attracted many multinational companies to move
their operations to Malaysia.
(iv) 1991-2020: This is the phase of taking the economy to its full maturity, through rigorous tests of
international competitiveness, and stepping into the state of affluence to mark the full realization of
the vision of becoming a fully developed and industrialized knowledge-based country underscoring
national unity and socio-economic justice. Various plans and policies have been introduced since
1991 towards achieving this goal. Industrialization and globalization base has been broadened to
include agriculture and service sectors linking them with the global market.
Management of economic development and globalization
Malaysia‟s industrialization and globalization approach is a strategy of growth with equity. It can be best
described as a strong market embedded into a strong government and is driven by Malaysia‟s vision of
- 5 -
becoming a fully developed and industrialized knowledge-based nation by the year 2020. It is a highly target
oriented phase by phase approach strictly monitored and modified as necessary by compromising efficiency for
effectiveness. Fostering national unity and growth with socio-economic justice through broader quantitative and
qualitative participation of all groups of people at all levels of activities are the hardcore and touchstones of the
approach and its tools and strategies. It is guided by long-term plans such as New Economic Policy, Outline
Perspective Plans, National Development Policy, various Industrial and Knowledge-based Master Plans, etc.
and is pursued through medium-term operational plans such as five-year Malaysia plans. In 1991 Malaysia
formally articulated its vision as a blueprint of national development over a period of thirty years under the
name Vision 2020, to transform it finally from a developing to a fully developed nation. Table 2 in Appendix
summarizes the approaches and actions at different phases of economic development and globalization in
Malaysia.
During the import substitution phase (1957-1969) tax exemption as an incentive was given under the Pioneer
Industries Ordinance 1958 to encourage local and foreign firms to establish industries in the country. Under
Investment Incentive Act 1968 the tax relief period was extended beyond 5 years. Certain „infant industries‟
were given protection through import tariff and quota by Tariff Advisory Board and Federal Industrial
Development Authority (FIDA).
During the most challenging long period of globalization through export oriented industrialization (1970-
1990) all the plans and policy actions and institutions were geared to achieve the national objectives of
economic growth with distributive justice, bring about social restructuring through reduction in economic
disparity among the Malay, Chinese, and Indian ethnic groups, eradicate poverty, and promote national unity.
As a result, in many ways and in many cases intensive government interventions were necessary to ensure
increased participation of the Malay ethnic community at all levels of economic activities to enable them
increase their wealth sharing and to reduce foreigners‟ equity ownership. Malays are the Bumiputera i.e., legal
land-owners of the country; but they were far behind the non-Bumiputera (Chinese and Indian communities) and
foreign investors in respect of ownership of national wealth. In 1970 their equity ownership was only a meager
2.4%. Special state-owned companies under the State Economic Development Corporation (SEDCs) were set up
to promote and serve Bumiputera entrepreneurs. In addition, government encouraged and pushed non-
Bumiputera and foreign investors to form joint-venture companies with Bumiputera. This was a period of
serious challenges and achievements.
During the maturity and affluence period (1991-2020 Multimedia Super Corridor and various other
economic development corridors/zones have been set up to broaden the coverage of industrialization and
globalization to include agriculture and service sectors, and widen the quantitative and qualitative participation
of all groups of people in an economy driven by knowledge and innovations. It is to effect transformation of the
economy from production-led to knowledge and innovation driven, so that the vision of becoming a fully
developed and industrialized affluent nation with a robust and resilient economy, distributive justice, and strong
bond of national unity is fully realized by the year 2020.
Achievements in national and international fronts
Economic globalization in Malaysia increased steadily under its economic development and industrialization
strategy during 1970-2007. Index of globalization level increased from 62.94 to 78.03 (3rd
continued part of
Table 1 in Appendix). Achievements of its development and globalization strategy can be evaluated from the
context of national macroeconomic goals and global competitiveness and income convergence (benefits sharing)
objectives.
National macroeconomic goals
From the context of national macroeconomic indicators Malaysia has had made significant and commendable
achievements during the study period. During 1970 – 2007 per capita real gross national income (GNI)
increased from $1,110 to $5140 with an average annual growth rate of 5% (1st part of Table 1 in Appendix),
unemployment rate dropped from 8% in 1970 to 3.1% in 2008 (Table 1), inflation rate dropped from 4.49% in
1975to 2% in 2007 (Cheng, 2008), foreigners‟ share of equity capital decreased from 63.4 % in 1970 to 28.8%
in 2004 (Table 2), poverty rate decreased from 52.4 % in 1970 to 3.6% in 2007 (Table 3).
- 6 -
Table 1. Malaysia‟s unemployment rates
Year 1970 1995 1996 1997 1998 1999 2000 2001 2002 2003 2004 2005 2006 2007 2008
Rate
(%) 8.0*** 2.8** 2.5** 2.5** 3.2** 3.1** 3.1** 3.9** 3.5** 3.8* 3.6* 3.0* 3.6* 3.5* 3.1*
Sources: *Index Mundi (2009), ** International Labor Organization (2003), and ***Cheng (2008)
Table 2. Ownership of share capital (at per value) of limited companies, 1969-2004 (%)
Type of Owners 1969 1970 1975 1980 1985 1990 1995 1999 2004
Bumiputera Individuals
and Trust Agencies 1.5 2.4 9.2 12.5 19.1 19.2 20.6 19.1 18.7
Chinese 22.8 27.2 - - 33.4 45.5 40.9 37.9 40.9
Indians 0.9 1.1 - - 1.2 1 1.5 1.5 1.5
Others - - - - - - - 0.9 0.8
Nominee Companies 2.1 6 - - 1.3 8.5 8.3 7.9 9.2
Locally-Controlled
Firms 10.1 - - - 7.2 0.3 1 - -
Foreigners 62.1 63.4 53.3 42.9 26 25.4 27.7 32.7 28.8
Sources: Malaysia (1996, 2001)
Table 3. Malaysia poverty statistics, 1970 – 2007 (%)
1970 1980 1985 1990 1995 2000 2004 2005 2007
Poverty 52.4 37.4 20.7 16.5 8.9 7.5 5.7 5.2 3.6
Urban Poverty 22.3 - 8.5 7.1 3.7 3.5 2.5 2.4 2.0
Rural poverty 60.0 - 27.3 21.1 15.3 14.0 11.9 11.2 7.1
Hardcore
Poverty - - 6.9 3.9 2.1 2.4 1.2 1.1 0.7
Urban Hardcore
Poverty - - 2.4 1.4 0.9 0.8 0.4 0.4 0.3
Rural Hardcore
Poverty - - 9.3 5.2 3.7 3.1 2.9 2.1 1.4
Source: Malaysia (2006).
Note: A projection for total poverty in 2010 is 2.8%, which was done recently by Economic Planning Unit,
Prime Minister‟s Department, Malaysia
Recently, the country made an inroad to political maturity having attained the competitive political culture
with less than absolute (two-third) majority by the governing political party/alliance at the parliament.
Undoubtedly this is a chapter of great achievements in terms of political maturity and social empowerment.
For ascertaining the contribution of globalization to these achievements firstly a simple log-linear regression
analysis of the GNP and gross domestic product (GDP) as functions of the Globalization Index has been made.
Results suggest that globalization has a strong positive influence on GNP and GDP; for a one percent increase in
globalization GNP and GDP increase by 8.33% and 8.02% respectively (Table 4). This shows that Malaysia
effectively enjoys positive effects of economic globalization.
lnY1t = α + β1 lnX1t + ε (1)
lnY2t = α + β1 lnX1t + ε (2)
Where, Y1t = Total Real GNP/GNI of Malaysia, Y2t = Total Real GDP of Malaysia,
X1t = Economic Globalization Index,
α = Constant, and ε = Residual.
- 7 -
Table 4. Statistical output of the GNP/GNI and GDP as functions of globalization index in Malaysia (1970-
2006)
Equation
No.
Dependent
Variable
Independent
Variables Coefficient t-stat P-value DW R
2
1 lnY1t α -10.61* -4.72 0.000
0.67 0.875 lnX1t 8.33* 15.70 0.000
2 lnY2t α -9.25* -4.48 0.000
0.71 0.885 lnX1t 8.02* 16.44 0.000
* indicates significant at 1% level.
Secondly for a closer and more rigorous examination multiple log-linear regression analysis of GNP and
GDP as functions of fixed capital formation, employment, foreign direct investment, and globalization index
have been made. There again results show that Globalization positively contributes to GNP and GDP; a one
percent increase in globalization increases GNI and GDP by 1.47% and 0.78% respectively ( Table 5 and Table
6). However the coefficients were not found statistically significant even at 5%. Therefore, these results cannot
be statistically relied upon and these could at best be taken as indicative of globalization having positive
influence on national economic growth. It is interesting and encouraging to note that globalization appears to
have relatively more influence on GNI than GDP.
lnY1t = α + β1 lnX1t + β2 lnX5t + β3 lnX6t + β4 lnX4t + ε (3)
Where, Y1t = Total Real GNP/GNI of Malaysia,
X1t = Economic Globalization Index,
X5t = Local Fixed Capital Formation in Malaysia,
X6t = Total foreign direct investment (FDI) outflow from Malaysia,
X4t = Total Employment in Malaysia,
α = Constant, and ε = Residual.
Because of non availability of local labor employment data for all the years of the period of
study total employment data (X4t) have been used in equation 3.
Table 5. Statistical output of the GNP/GNI as a function of globalization index and other variables in Malaysia
(1970-2006)
Equation
No.
Dependent
Variable
Independent
Variables Coefficient t-stat P-value DW R
2
3 lnY1t
α -1.66 -0.89 0.379
0.64 0.979
lnX5t 0.52* 9.35 0.000
lnX6t -0.01~ -1.70 0.100
lnX4t 0.53~ 1.92 0.064
lnX1t 1.47 1.23 0.229
* and ~ indicate significant at 1% and 10% levels, respectively.
lnY2t = α + β1 lnX1t + β2 lnX2t + β3 lnX3t + β4 lnX4t + ε (4)
Where, Y2t = Total Real GDP of Malaysia,
X1t = Economic Globalization Index,
X2t = Total Fixed Capital Formation in Malaysia,
X3t = Total FDI Inflow in Malaysia,
X4t = Total Employment in Malaysia, α = Constant, and ε = Residual.
- 8 -
Table 6. Statistical output of the GDP as a function of globalization index and other variables in Malaysia
(1970-2006)
Equation
No.
Dependent
Variable
Independent
Variables Coefficient t-stat P-value DW R
2
4 lnY2t
α 1.87 0.81 0.425
0.74 0.979
lnX2t 0.41* 4.66 0.000
lnX3t 0.01 0.17 0.863
lnX4t 0.64** 2.12 0.042
lnX1t 0.78 0.55 0.584
* and ** indicate significant at 1% and 5% levels, respectively.
Global competitiveness and income convergence goals
Industrial performance/ competitiveness
At the level of international competitiveness Malaysian economy maintained a steady improvement moving
from 40th
in 1980 to 21st position in 2007 in terms of global industrial performance/competitiveness ranking
(Table 7).
Table 7. Competitive industrial performance of selected countries – rank
Economy 1980* 1990* 2000* 2008**
United States 13 14 11 1
Singapore 2 1 1 7
Japan 5 4 6 8
United Kingdom 12 13 17 9
Korea 23 18 10 11
Malaysia 40 23 15 21
Thailand 47 32 23 28
China 39 26 24 34
South Africa 36 44 35 44
India 38 36 40 48
Mexico 31 29 26 52
Indonesia 75 54 38 54
Philippines 42 43 25 71
Brazil 24 27 31 72
Sources: * United Nations Industrial Development Organization (2004) & ** World Economic Forum (2008)
This may suggest that globalization has created an attractive and efficient industrial environment and caused
transfer of technology in management, process, and products to increase economy‟s competitiveness and
performance level.
Income convergence with industrialized partner countries
Income convergence analysis signifies the nature of change in income gaps between countries over time. It can
be conveniently used to study the political economy of globalization - to test how fairly a developing country,
by pursuing the strategy of economic globalization, shares the gains from trade and growth with its
industrialized rich trading partners. If the income gap between the rich and developing country trading and
growth partners decreases over time it may signify that the developing country partners are sharing the gains
from trade and growth more than proportionately with the rich country trading partners. When the income gap
between them increases it may signify sharing of the gains from trade and growth less than proportionately with
the rich trading partner countries. Bernard and Durlauf (1994), however, provided the definitions of the
convergence hypothesis that are interpretable in terms of unit roots and co-integration theory. Specifically, there
will be income convergence over time if a stationary process with zero mean forecast value, integrated order
I(0), shows a stable long run co-movement between two countries‟ income; otherwise the result would be
income divergence. Oxley and Greasley (1995) defined the concept of long-run convergence as the attainment
of long-run steady-state equilibrium in the income differential between two contrasting economies. They also
- 9 -
defined the concept of long-run catching up as a narrowing down of income gap between two contrasting
economies over time and hence the convergence process is yet to be completed. In fact, the log-linear model of
time series frameworks shows both long-run convergence and catching up when the trend in income differential
between two economies is found to be stationary.
Observations also reveal that during 1970s, 1980s, and 1990s there were at least three structural breaks in the
economies of Malaysia, Japan, and the United States of America. In order to test whether the income ratios of
these three economies have had really experienced such breaks during the aforesaid periods we have
transformed equations 5, 6, 7, and 8 in the form of lag. This allows us first to transform these equations onto
Least Squares (NLS and ARMA) form. With these transformed equations we have then employed a stability
test, namely Chow Breakpoint Test to ultimately identify the structural breaks using a single series of data set.
With results from Chow‟s Breakpoint Test we have then conducted a recursive estimation, namely CUSUM
Test in order for us to graphically view the structural breaks, if any, for the above three economies. The Chow
Breakpoint Tests, however, reveal that at 1% level of significance only income ratio of Japan and Malaysia has
had experienced structural breaks in terms of GDP during the periods 1980s, 1990s, and 2000s. But in respect of
GNI, only at 5% level of significance their income ratio has had experienced structural breaks during these
periods. Income ratio of the USA and Malaysia does not have any structural break in respect of both GNI and
GDP. Researchers in this area are generally reluctant to accept the validity of the test results if they are
significant only at more than 1% level. Since we are more interested in the convergence of GNI, we have
selected and applied the augmented Dickey-Fuller (ADF) model for income convergence analyses in this study.
Liew and Ahmad (2006) noted that by adopting augmented version of the linear Dickey-Fuller (DF) test
with constant trend the following can be concluded:
o Income divergence - if the null hypothesis of non-stationary cannot be rejected.
o Long-run convergence - if the null hypothesis of non stationary has been rejected but the trend term is
statistically insignificant.
o Catching up - if the null hypothesis of non-stationary has been rejected and the trend term is
statistically significant.
When trend term (i.e., β1) is significant, the decision criteria can be broken down further based on the values
of β1 and β2, as in the Table 8.
Table 8. Interpretation of the ADF tests (when both β1 and β2 are significant)
β1 β2 Process
0 0 Divergence
> 0 < 0 Lagging-behind
> 0 0 Loose Lagging-behind
< 0 0 Loose Catching-up
< 0 < 0 Catching-up
0 < 0 Convergence
Source: Gomez and Ventosa-Santaularia (2007)
In fact, there are two measurements of growth convergence: β-convergence and δ-convergence. The β-
convergence describes an inverse relationship between initial income levels and growth differences among
countries, where the δ-convergence focuses on the actual income differences among countries. There will be β-
convergence if an initially poorer economy grows faster than an initially richer one, and δ-convergence if
income differences between the economies decrease over time. This paper focuses on the δ-convergence criteria,
which has been determined by the augmented Dickey-Fuller (ADF) test using time series data.
ΔYt = α+ β1T + β2Yt-1 +
n
k k1 ΔYt-k + t
Where, ε is a pure white noise error term, T is a deterministic trend, α is a constant term, β1 and β2 denote the
parameters of convergence to be estimated. The unit root test of the income convergence hypothesis for the time
- 10 -
series properties is the logarithm differences of real GDP or GNI per capita between country i and country j,
where,
Yt = ln(Yit / Yjt) = 1nYit – 1nYjt
The framework can further be defined as:
Δ(lnYi t-k – Yj t-k) = α + β1 lnT + β2 (lnYi t-1 – lnYj t-1) +
n
k k1 Δ(lnYij t-k – lnYj t-k) + εt
The usable format of the model is presented below:
ΔlnY3t = α + β1 lnT + β2 lnY3 t-1 +
n
k k1 ΔlnY3 t-k + ε (5)
ΔlnY4t = α + β1 lnT + β2 lnY4 t-1 +
n
k k1 ΔlnY4 t-k + ε (6)
ΔlnY5t = α + β1 lnT + β2 lnY5 t-1 +
n
k k1 ΔlnY5 t-k + ε (7)
ΔlnY6t = α + β1 lnT + β2 lnY6 t-1 +
n
k k1 ΔlnY6 t-k + ε (8)
Where, Y3t = USA per Capita Real GNI / Malaysia per Capita Real GNI,
Y4t = USA per Capita Real GDP / Malaysia per Capita Real GDP,
Y5t = Japan per Capita Real GNI / Malaysia per Capita Real GNI,
Y6t = Japan per Capita Real GDP / Malaysia per Capita Real GDP,
T = A deterministic trend, α = Constant, and ε = Residual.
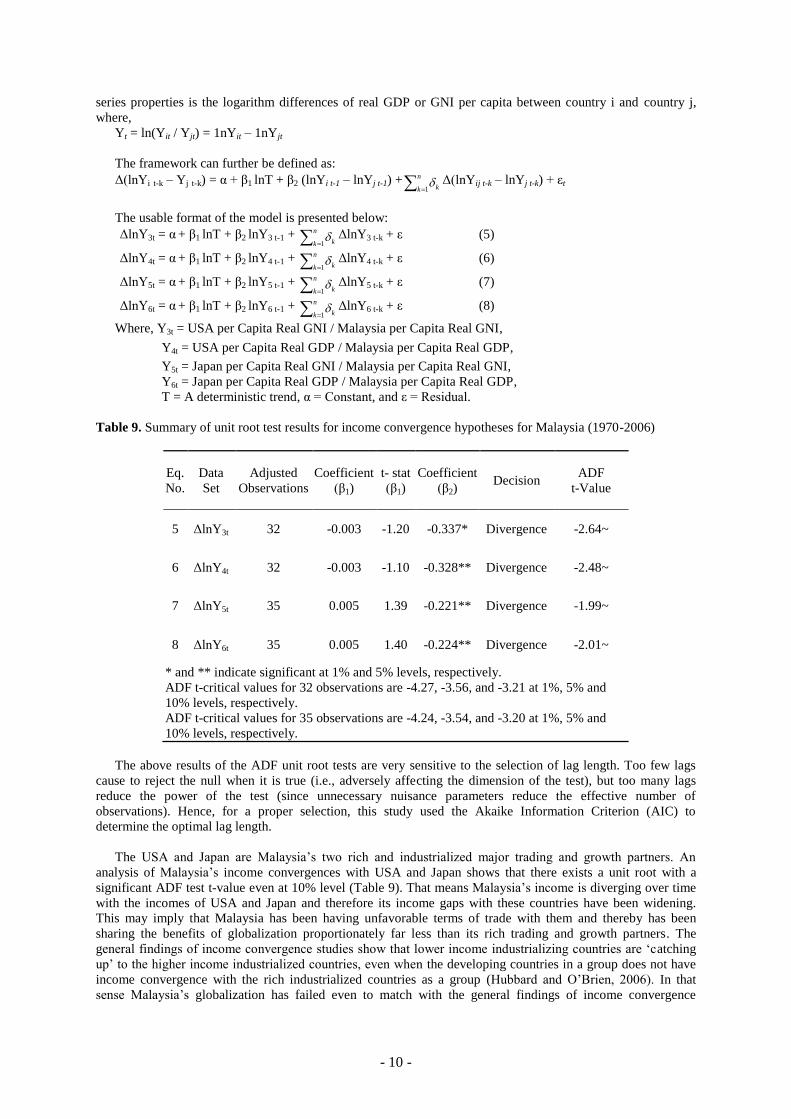
Table 9. Summary of unit root test results for income convergence hypotheses for Malaysia (1970-2006)
Eq.
No.
Data
Set
Adjusted
Observations
Coefficient
(β1)
t- stat
(β1)
Coefficient
(β2) Decision
ADF
t-Value
5 ΔlnY3t 32 -0.003 -1.20 -0.337* Divergence -2.64~
6 ΔlnY4t 32 -0.003 -1.10 -0.328** Divergence -2.48~
7 ΔlnY5t 35 0.005 1.39 -0.221** Divergence -1.99~
8 ΔlnY6t 35 0.005 1.40 -0.224** Divergence -2.01~
* and ** indicate significant at 1% and 5% levels, respectively.
ADF t-critical values for 32 observations are -4.27, -3.56, and -3.21 at 1%, 5% and
10% levels, respectively.
ADF t-critical values for 35 observations are -4.24, -3.54, and -3.20 at 1%, 5% and
10% levels, respectively.
The above results of the ADF unit root tests are very sensitive to the selection of lag length. Too few lags
cause to reject the null when it is true (i.e., adversely affecting the dimension of the test), but too many lags
reduce the power of the test (since unnecessary nuisance parameters reduce the effective number of
observations). Hence, for a proper selection, this study used the Akaike Information Criterion (AIC) to
determine the optimal lag length.
The USA and Japan are Malaysia‟s two rich and industrialized major trading and growth partners. An
analysis of Malaysia‟s income convergences with USA and Japan shows that there exists a unit root with a
significant ADF test t-value even at 10% level (Table 9). That means Malaysia‟s income is diverging over time
with the incomes of USA and Japan and therefore its income gaps with these countries have been widening.
This may imply that Malaysia has been having unfavorable terms of trade with them and thereby has been
sharing the benefits of globalization proportionately far less than its rich trading and growth partners. The
general findings of income convergence studies show that lower income industrializing countries are „catching
up‟ to the higher income industrialized countries, even when the developing countries in a group does not have
income convergence with the rich industrialized countries as a group (Hubbard and O‟Brien, 2006). In that
sense Malaysia‟s globalization has failed even to match with the general findings of income convergence
- 11 -
studies. This unexpected departure from the general findings, therefore, calls for further investigation, more
particularly, in respect of Malaysia‟s terms of trade with the USA and Japan.
Income ratios and globalization
A simple log-linear regression analysis of the income ratios of Malaysia with the USA and Japan as functions of
Malaysia‟s economic globalization index, nonetheless, are found inclined to support a phenomenon of
convergence or „catching up‟ with USA and a phenomenon of divergence or „lagging behind‟ with Japan.
Results show that with increase in globalization income gap between Malaysia and the USA has a tendency to
decrease – a convergence or „catching up‟ phenomenon - and that of between Malaysia and Japan has a
tendency to increase – a divergence or „lagging behind‟ phenomenon (Table 10). The results are found to be
statistically highly significant but the R2 of the equations are found rather low. It may signify that Malaysia‟s
economic globalization may not be the most reliable and accountable factor for explaining these relationships.
lnY3t = α + β1 lnX1t + ε (9)
lnY4t = α + β1 lnX1t + ε (10)
lnY5t = α + β1 lnX1t + ε (11)
lnY6t = α + β1 lnX1t + ε (12)
Where, Y3t = USA Per Capita Real GNI / Malaysia Per Capita Real GNI,
Y4t = USA Per Capita Real GDP / Malaysia Per Capita Real GDP,
Y5t = Japan Per Capita Real GNI / Malaysia Per Capita Real GNI,
Y6t = Japan Per Capita Real GDP / Malaysia Per Capita Real GDP,
X1t = Economic Globalization Index,
α = Constant, and ε = Residual.
Table 10. Statistical outputs of regression analyses of income ratios of the USA and Japan with Malaysia and
globalization of Malaysia (1970-2006)
Equation
No.
Dependent
Variable
Independent
Variables Coefficient t-stat P-value DW R
2
9 lnY3t α 12.57* 5.95 0.000
0.33 0.410 lnX1t -2.44* -4.90 0.000
10 lnY4t α 13.07* 6.31 0.000
0.34 0.440 lnX1t -2.57* -5.26 0.000
11 lnY5t α -14.21* -5.69 0.000
0.41 0.540 lnX1t 3.78* 6.42 0.000
12 lnY6t α -13.27* -5.34 0.000
0.41 0.511 lnX1t 3.55* 6.06 0.000
* indicates significant at 1% level.
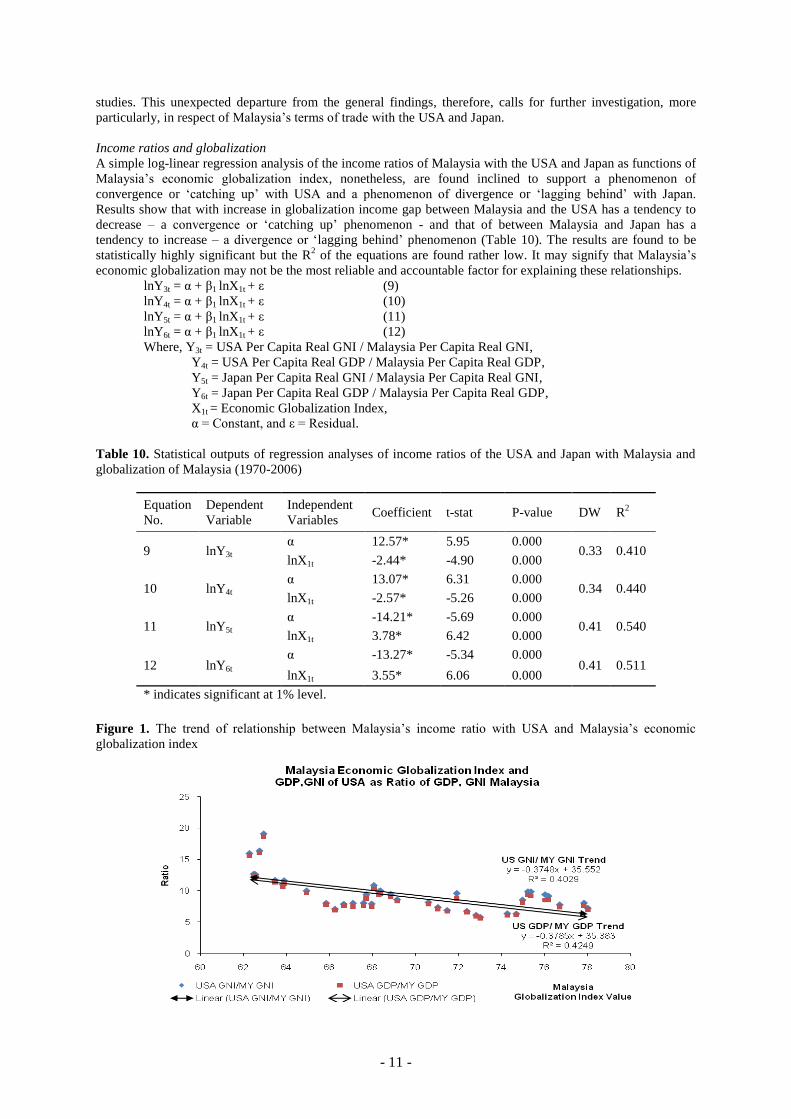
Figure 1. The trend of relationship between Malaysia‟s income ratio with USA and Malaysia‟s economic
globalization index
- 12 -
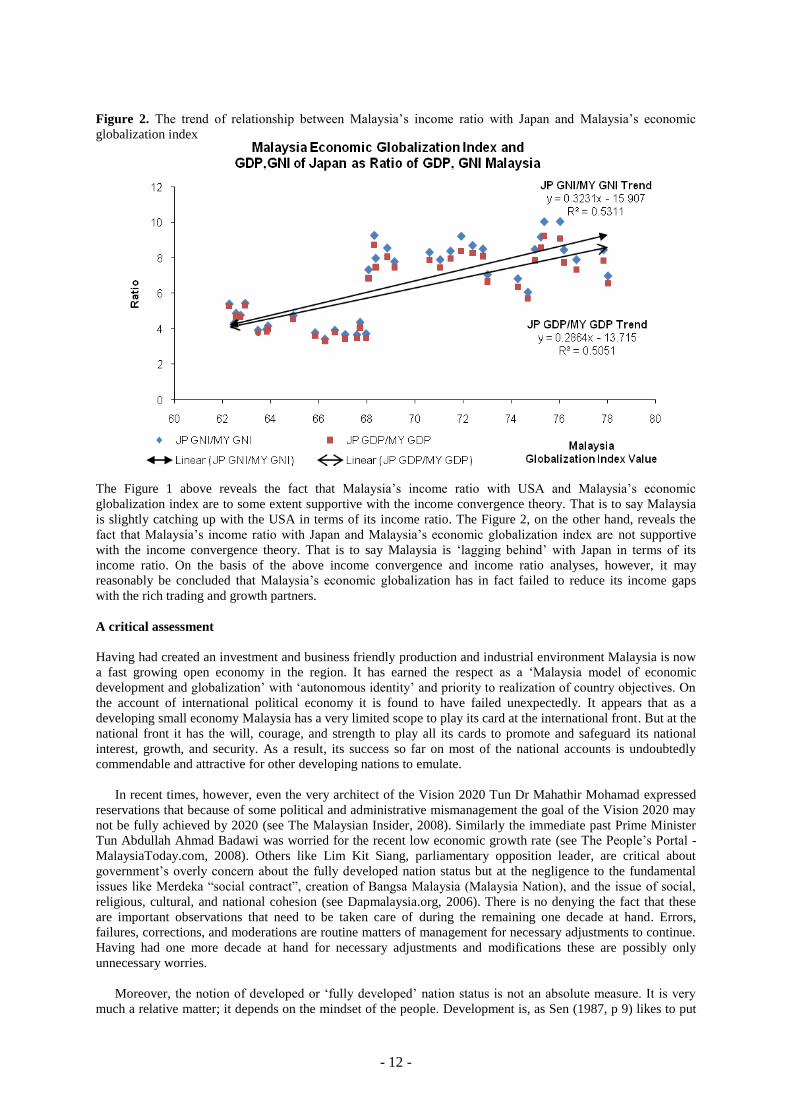
Figure 2. The trend of relationship between Malaysia‟s income ratio with Japan and Malaysia‟s economic
globalization index
The Figure 1 above reveals the fact that Malaysia‟s income ratio with USA and Malaysia‟s economic
globalization index are to some extent supportive with the income convergence theory. That is to say Malaysia
is slightly catching up with the USA in terms of its income ratio. The Figure 2, on the other hand, reveals the
fact that Malaysia‟s income ratio with Japan and Malaysia‟s economic globalization index are not supportive
with the income convergence theory. That is to say Malaysia is „lagging behind‟ with Japan in terms of its
income ratio. On the basis of the above income convergence and income ratio analyses, however, it may
reasonably be concluded that Malaysia‟s economic globalization has in fact failed to reduce its income gaps
with the rich trading and growth partners.
A critical assessment
Having had created an investment and business friendly production and industrial environment Malaysia is now
a fast growing open economy in the region. It has earned the respect as a „Malaysia model of economic
development and globalization‟ with „autonomous identity‟ and priority to realization of country objectives. On
the account of international political economy it is found to have failed unexpectedly. It appears that as a
developing small economy Malaysia has a very limited scope to play its card at the international front. But at the
national front it has the will, courage, and strength to play all its cards to promote and safeguard its national
interest, growth, and security. As a result, its success so far on most of the national accounts is undoubtedly
commendable and attractive for other developing nations to emulate.
In recent times, however, even the very architect of the Vision 2020 Tun Dr Mahathir Mohamad expressed
reservations that because of some political and administrative mismanagement the goal of the Vision 2020 may
not be fully achieved by 2020 (see The Malaysian Insider, 2008). Similarly the immediate past Prime Minister
Tun Abdullah Ahmad Badawi was worried for the recent low economic growth rate (see The People‟s Portal -
MalaysiaToday.com, 2008). Others like Lim Kit Siang, parliamentary opposition leader, are critical about
government‟s overly concern about the fully developed nation status but at the negligence to the fundamental
issues like Merdeka “social contract”, creation of Bangsa Malaysia (Malaysia Nation), and the issue of social,
religious, cultural, and national cohesion (see Dapmalaysia.org, 2006). There is no denying the fact that these
are important observations that need to be taken care of during the remaining one decade at hand. Errors,
failures, corrections, and moderations are routine matters of management for necessary adjustments to continue.
Having had one more decade at hand for necessary adjustments and modifications these are possibly only
unnecessary worries.
Moreover, the notion of developed or „fully developed‟ nation status is not an absolute measure. It is very
much a relative matter; it depends on the mindset of the people. Development is, as Sen (1987, p 9) likes to put
- 13 -
it, ‘a life we want to lead and the freedom we want to enjoy’ and, economic development is, as a former minister
of Uganda in mid-1970s stressed, ‘a means towards building the kind of society we want to build’.
Westernization can not be the necessary criterion to measure it. Similarly the capitalist globalization cannot be
the relevant strategy for economic emancipation of the developing countries. As noted earlier that India‟s lion
economy was stimulated to roar not by any call for globalization but by Nehru‟s first economic policy
declaration: „produce or go without it‟ – a project of effectiveness as against efficiency; and by the touch of the
same magic wand of effectiveness China activated its dragon economy to spread its wings. Therefore having
had all the achievements thus far along the road map of development and a decade more at hand to work on,
there is no scope now for anyone to doubt about the full realization of the goals of Vision 2020 as long as the
mindset of the Malaysians and their leaders do not become corrupted by what the late president Julius Nyerere
of Tanzania called the „catching up with the north syndrome‟, and „westernization‟ does not take precedence
over the „look east‟ vision of development. Scholars will always have research interest to identify the core
factors that contributed to this commendable achievement. There are reasons to believe that the wisdom of a
„Malaysia-centric‟ development strategy and application of the strict political and administrative discipline at all
levels played the pivotal role in this game of success. But we leave this for some other studies to cover more
rigorously. Moreover, for maintaining and enhancing its image, further studies are required to identify the
limitations and scopes of Malaysia‟s management strategy of globalization specifically for realization of the
international goal of reducing income gaps with the industrialized economic partners.
Conclusions
Malaysia‟s economy is considered as one of the most globalized and successful among the developing countries.
Its economic globalization is a kind of guided globalization. „Malaysia-centric‟ and „look east‟ strategies are its
unique features. Its success in respect of achieving the national macroeconomic goals is found commendable.
But it has clearly failed in respect of the international political economy objective; it has failed to reduce
Malaysia‟s income gaps with its industrialized economic partners like USA and Japan. This tends to suggest that
even a guided and regulated globalization like that in Malaysia will have the tendency to yield relatively more
benefits to the developed industrialized economic partners. It, therefore, confirms the fact that the developing
countries must pursue globalization only selectively, rationally, and prudently without joining the bandwagon of
the industrialized countries. Therefore, the paper suggests for the model of target oriented „inclusive
globalization‟, under the framework of internationalization of the economies instead of globalization of trade
and the perspective of „fair market‟ instead of „free market‟, to ensure equitable sharing of benefits of
specialization and globalization among the industrialized and industrializing partner nations. The focus should
be on reducing the income gap between nations and societies. This gap has become so wide that the U.N. High-
Level Panel on Financing for Development, in 2001, had to sadly comment that “Increasing polarization
between the haves and have-nots has become a feature of our world. Reversing this shameful trend is the
preeminent moral and humanitarian challenge of our age” (reported in Todero, M.P. & S.C.Smith, 2006).
References
Bernard, A.B. & Durlauf, S.N. 1994. "Interpreting Tests of the Convergence Hypothesis," NBER Technical
Working Papers 0159, National Bureau of Economic Research, Inc.
Billington, G.G. 2002. Malaysia's Mahathir: Back to Production, Dump Globalization. Executive Intelligence
Review. 29(40): 12-13, Available at
<http://www.larouchepub.com/eiw/public/2002/eirv29/eirv29n40.pdf>
Cheng, M.Y. 2008. Malaysia: Moving towards Vision 2020. ACI Working Paper Series, Lee Kuan Yew School
of Public Policy, National University of Singapore.
Crotty, J. and Dymski, G. (2001) Can the Global Neoliberal Regime Survive Victory in Asia? The Political
Economy of the Asian Crisis, Political Economy Research Institute, University of Massachusetts,
Amherst, USA.
Dapmalaysia.org. 2006. NEP vs. Vision 2020. Available at:
http://www.dapmalaysia.org/english/2006/sept06/lks/lks4050.htm, Published on: September 26,
Retrieved on: July 21, 2009.
Gilpin, R. 1975. U.S. Power and the Multinational Corporation- The Political Economy of Foreign Direct
Investment. New York: Basic Books.
Gomez, M. and Ventosa-Santaularia, D. 2007. Income Convergence: The Dickey-Fuller Test under the
Simultaneous Presence of stochastic and Deterministic Trends, School of Economics Working Paper
No. EM200703, Universidad de GuanaJuato, Mexico.
Harvey, D. (2005) A brief History of Neoliberalism, Oxford: Oxford University Press.
- 14 -
Harvey, D. (2009) Is this Really the End of Neoliberalism?, Counterpunch, March 13-15. Available at
<http://www.counterpunch.org/harvey03132009.html>
Heilbroner, R. L. and Milberg, W. (2009) The Making of Economic Society (12th
ed), New Jersey: Pearson
Prentice Hall.
Hubbard, R.G. & O‟Brien, A.P. 2006. Economics. New Jersey: Pearson.
Index Mundi. 2009. Malaysia Unemployment Rates. Available at
<http://www.indexmundi.com/malaysia/unemployment_rate.html>, Retrieved on: 03 June 2009.
International Labor Organization. 2003. 2003-2004 Key Indicators of the Labor Market. Geneva: ILO.
Liew, V. K. & Ahmad, Y. 2006. "Income convergence? Evidence of non-linearity in the East Asian Economies:
A comment," MPRA Paper 519, University Library of Munich, Germany.
Malaysia. 1996. Seventh Malaysia Plan, 996 – 2000. Putrajaya: Economic Planning Unit.
Malaysia. 2001. Eighth Malaysia Plan, 2001-2005. Putrajaya: Economic Planning Unit.
Malaysia. 2006. Ninth Malaysian Plan, 2006-2010. Putrajaya: Economic Planning Unit.
Oxley, L. & Greasley, D. 1995. A Time Series Perspective on Convergence: Australia, UK and USA since
1870. The Economic Record, 71: 259–270.
Sen, A. 1987. Food and Freedom. Sir John Crawford Memorial Lecture, Washington, D.C., October 29.
Shakur, M. 2002. The Globalization of the Malaysian Economy. Available at
<http://www.freewebs.com/suaraanum/0310b02.htm>, Retrieved on July 20, 2009.
Stiglitz, J. (2002) Globalization and Its Discontents, New York: W.W. Norton and Company.
The Malaysian Insider. 2008. Will Malaysia achieve its target of becoming a developed country by 2020?
Available at <http://www.themalaysianinsider.com/index.php/malaysia/14073-dr-m-thinks-vision-
2020-not-likely-to-happen>, Published on: December 11, Retrieved on: July 21, 2009.
The People‟s Portal – MalaysiaToday.com. 2008. Vision 2020 facing hiccups. Available at:
<http://www.malaysiatoday.com/Latest-News/vision-2020-facing-hiccups.html>, Published on: August
03, Retrieved on: July 21, 2009.
Todaro, M.P. and Smith, S.C. 2006. Economic Development, p577, New York: Addison
Wesley. UNDP. 2006. Malaysia International Trade, Growth, Poverty Reduction and Human Development. UNDP
Malaysia, Kuala Lumpur. Available at
<http://www.undp.org.my/uploads/UNDP_Booklet_PDF_FORMAT.pdf>.
United Nations Industrial Development Organization. 2004. Annual Report 2004. United Nations Industrial
Development Organization, Vienna International Centre, Vienna, Austria. Also available at
<http://www.unido.org/fileadmin/import/37469_eannualreport>
World Economic Forum. 2008. The Global Competitiveness Report 2008–2009. Available at
<http://www.weforum.org/pdf/GCR08/GCR08.pdf>
- 15 -
Appendices
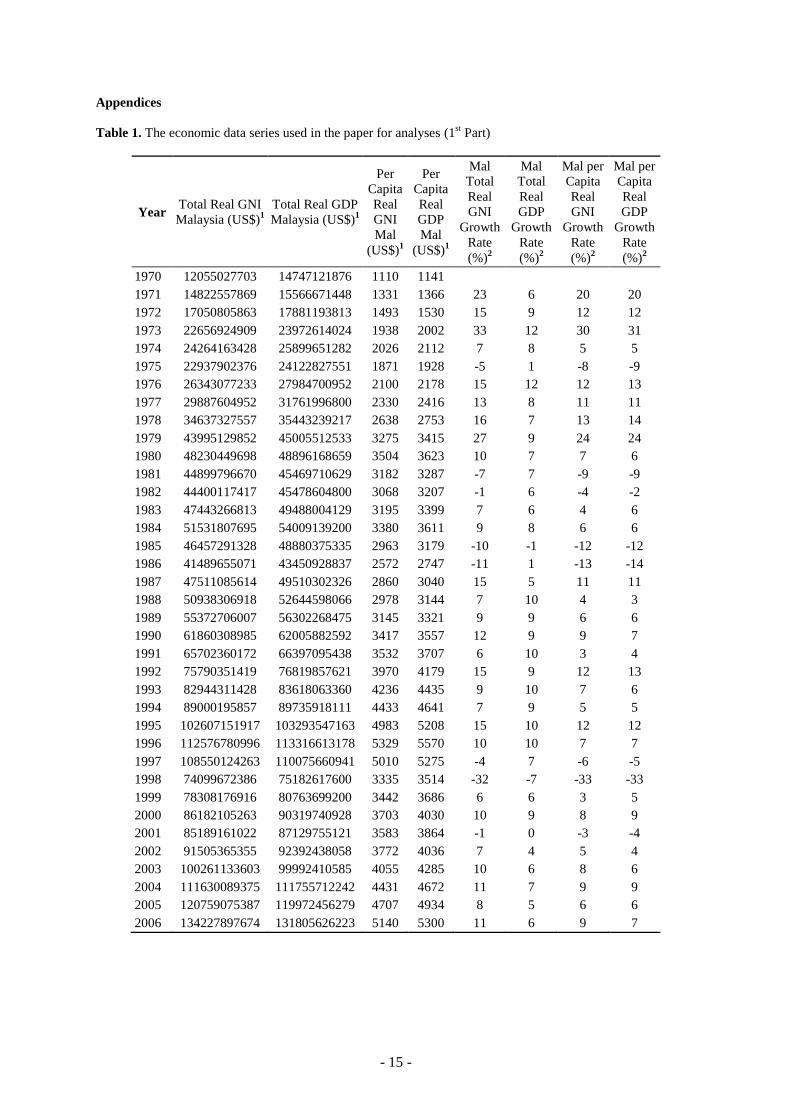
Table 1. The economic data series used in the paper for analyses (1st Part)
Year Total Real GNI
Malaysia (US$)1
Total Real GDP
Malaysia (US$)1
Per
Capita
Real
GNI
Mal
(US$)1
Per
Capita
Real
GDP
Mal
(US$)1
Mal
Total
Real
GNI
Growth
Rate
(%)2
Mal
Total
Real
GDP
Growth
Rate
(%)2
Mal per
Capita
Real
GNI
Growth
Rate
(%)2
Mal per
Capita
Real
GDP
Growth
Rate
(%)2
1970 12055027703 14747121876 1110 1141
1971 14822557869 15566671448 1331 1366 23 6 20 20
1972 17050805863 17881193813 1493 1530 15 9 12 12
1973 22656924909 23972614024 1938 2002 33 12 30 31
1974 24264163428 25899651282 2026 2112 7 8 5 5
1975 22937902376 24122827551 1871 1928 -5 1 -8 -9
1976 26343077233 27984700952 2100 2178 15 12 12 13
1977 29887604952 31761996800 2330 2416 13 8 11 11
1978 34637327557 35443239217 2638 2753 16 7 13 14
1979 43995129852 45005512533 3275 3415 27 9 24 24
1980 48230449698 48896168659 3504 3623 10 7 7 6
1981 44899796670 45469710629 3182 3287 -7 7 -9 -9
1982 44400117417 45478604800 3068 3207 -1 6 -4 -2
1983 47443266813 49488004129 3195 3399 7 6 4 6
1984 51531807695 54009139200 3380 3611 9 8 6 6
1985 46457291328 48880375335 2963 3179 -10 -1 -12 -12
1986 41489655071 43450928837 2572 2747 -11 1 -13 -14
1987 47511085614 49510302326 2860 3040 15 5 11 11
1988 50938306918 52644598066 2978 3144 7 10 4 3
1989 55372706007 56302268475 3145 3321 9 9 6 6
1990 61860308985 62005882592 3417 3557 12 9 9 7
1991 65702360172 66397095438 3532 3707 6 10 3 4
1992 75790351419 76819857621 3970 4179 15 9 12 13
1993 82944311428 83618063360 4236 4435 9 10 7 6
1994 89000195857 89735918111 4433 4641 7 9 5 5
1995 102607151917 103293547163 4983 5208 15 10 12 12
1996 112576780996 113316613178 5329 5570 10 10 7 7
1997 108550124263 110075660941 5010 5275 -4 7 -6 -5
1998 74099672386 75182617600 3335 3514 -32 -7 -33 -33
1999 78308176916 80763699200 3442 3686 6 6 3 5
2000 86182105263 90319740928 3703 4030 10 9 8 9
2001 85189161022 87129755121 3583 3864 -1 0 -3 -4
2002 91505365355 92392438058 3772 4036 7 4 5 4
2003 100261133603 99992410585 4055 4285 10 6 8 6
2004 111630089375 111755712242 4431 4672 11 7 9 9
2005 120759075387 119972456279 4707 4934 8 5 6 6
2006 134227897674 131805626223 5140 5300 11 6 9 7

- 16 -
Table 1. Continues… (2nd
Part)
Year
Per
Capita
Real
GNI
USA
(US$)1
Per
Capita
Real
GDP
USA
(US$)1
Per Capita
Real GNI
Japan(US$) 1
Per Capita
Real GDP
Japan (US$)1
Malaysia
Total Fixed
Capital
Formation
(constant
(US$))3
Malaysia
Local Fixed
Capital
Formation
(constant
(US$))4
1970 21191 21210 6044 6079 1681786747 1397282333
1971 21792 21870 6344 6379 2129990222 1889291042
1972 23838 23845 8063 8094 2506330010 2255439922
1973 24446 24377 9453 9488 3348558576 3015010156
1974 23572 23497 8433 8483 4328010473 3302364706
1975 23726 23794 8076 8117 3587133916 3049898103
1976 24567 24679 8230 8271 3841104544 3241356929
1977 25631 25656 9263 9304 4718555119 4076598817
1978 26400 26458 12524 12569 5471139840 4795778237
1979 26348 26495 12383 12417 6574277284 5900746257
1980 24915 24981 11995 12046 8051571777 7065322712
1981 25138 25121 12470 12542 9422567314 8099892938
1982 24750 24475 11244 11286 9826016221 8416370950
1983 25348 25411 11899 11932 10569106568 9342546404
1984 27190 27039 12440 12466 10477192251 9705976096
1985 27853 27787 12956 12960 9484135669 8776642331
1986 27983 28169 18871 18883 7205441378 6723427567
1987 28686 28709 22826 22792 7190361857 6771448256
1988 29517 29267 27601 27554 8139852328 7440302864
1989 29751 29826 26911 26843 10459258880 8914931053
1990 29418 29580 26615 26557 13291110400 10905537600
1991 28875 29081 29379 29307 16144117459 12490274579
1992 29319 29663 31357 31225 18673563562 14245158442
1993 29242 29726 35527 35368 21264074524 16569541923
1994 30014 30520 38573 38432 26042187200 22062325036
1995 30599 30874 42383 42245 32242125203 27399801285
1996 30993 31230 37620 37217 35168252749 29180327325
1997 31992 32140 34201 33758 24869922221 21228742626
1998 32943 32808 30607 30192 14520262872 12484892642
1999 33959 33705 34559 34122 13570526585 10519677805
2000 34863 34280 37211 36742 17155789878 14416489407
2001 34436 33986 33047 32504 16592104825 16197812878
2002 34613 34442 31887 31363 16644473263 14393090708
2003 34720 34694 34392 33804 17094736842 15383150538
2004 35795 35620 37486 36776 17630525979 14511781491
2005 36713 36526 37177 36319 18564814425 15962605423
2006 37279 37065 35887 34898 19816946946 16141178017
- 17 -
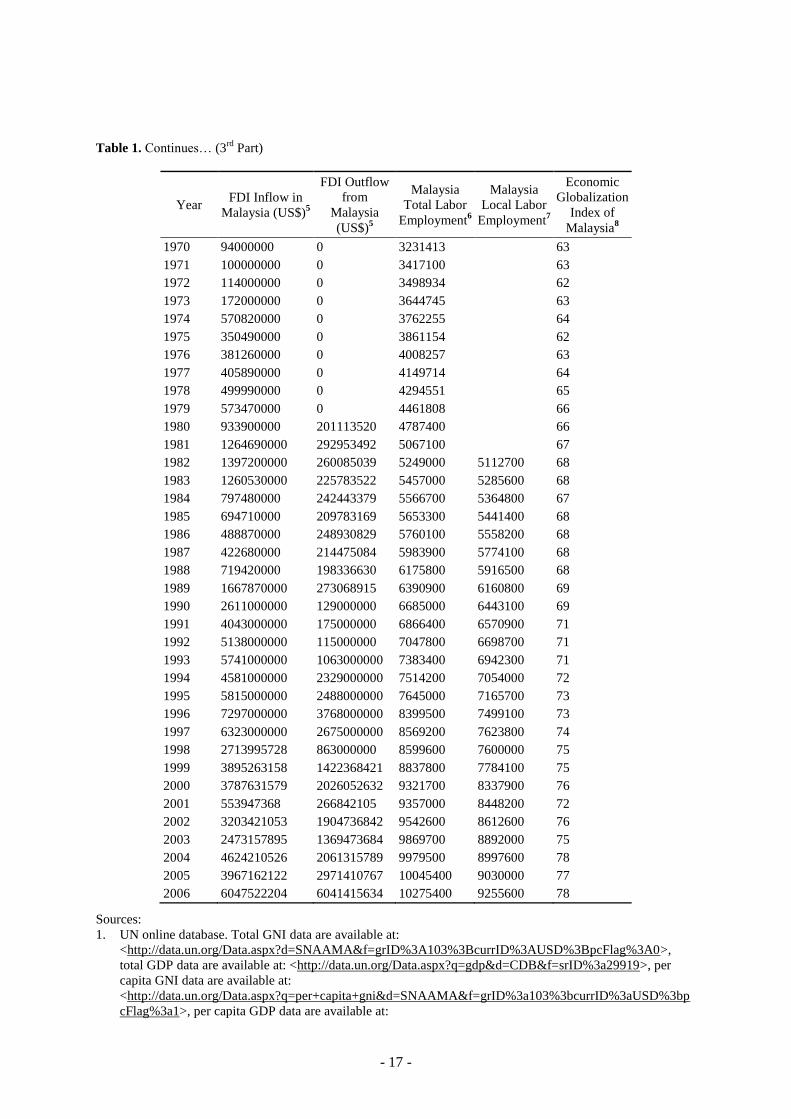
Table 1. Continues… (3rd
Part)
Year FDI Inflow in
Malaysia (US$)5
FDI Outflow
from
Malaysia
(US$)5
Malaysia
Total Labor
Employment6
Malaysia
Local Labor
Employment7
Economic
Globalization
Index of
Malaysia8
1970 94000000 0 3231413 63
1971 100000000 0 3417100 63
1972 114000000 0 3498934 62
1973 172000000 0 3644745 63
1974 570820000 0 3762255 64
1975 350490000 0 3861154 62
1976 381260000 0 4008257 63
1977 405890000 0 4149714 64
1978 499990000 0 4294551 65
1979 573470000 0 4461808 66
1980 933900000 201113520 4787400 66
1981 1264690000 292953492 5067100 67
1982 1397200000 260085039 5249000 5112700 68
1983 1260530000 225783522 5457000 5285600 68
1984 797480000 242443379 5566700 5364800 67
1985 694710000 209783169 5653300 5441400 68
1986 488870000 248930829 5760100 5558200 68
1987 422680000 214475084 5983900 5774100 68
1988 719420000 198336630 6175800 5916500 68
1989 1667870000 273068915 6390900 6160800 69
1990 2611000000 129000000 6685000 6443100 69
1991 4043000000 175000000 6866400 6570900 71
1992 5138000000 115000000 7047800 6698700 71
1993 5741000000 1063000000 7383400 6942300 71
1994 4581000000 2329000000 7514200 7054000 72
1995 5815000000 2488000000 7645000 7165700 73
1996 7297000000 3768000000 8399500 7499100 73
1997 6323000000 2675000000 8569200 7623800 74
1998 2713995728 863000000 8599600 7600000 75
1999 3895263158 1422368421 8837800 7784100 75
2000 3787631579 2026052632 9321700 8337900 76
2001 553947368 266842105 9357000 8448200 72
2002 3203421053 1904736842 9542600 8612600 76
2003 2473157895 1369473684 9869700 8892000 75
2004 4624210526 2061315789 9979500 8997600 78
2005 3967162122 2971410767 10045400 9030000 77
2006 6047522204 6041415634 10275400 9255600 78
Sources:
1. UN online database. Total GNI data are available at:
<http://data.un.org/Data.aspx?d=SNAAMA&f=grID%3A103%3BcurrID%3AUSD%3BpcFlag%3A0>,
total GDP data are available at: <http://data.un.org/Data.aspx?q=gdp&d=CDB&f=srID%3a29919>, per
capita GNI data are available at:
<http://data.un.org/Data.aspx?q=per+capita+gni&d=SNAAMA&f=grID%3a103%3bcurrID%3aUSD%3bp
cFlag%3a1>, per capita GDP data are available at:

- 18 -
<http://data.un.org/Data.aspx?q=GDP+per+capita&d=SNAAMA&f=grID%3a101%3bcurrID%3aUSD%3b
pcFlag%3a1>, and CPI data are available at: <http://data.un.org/Data.aspx?d=CDB&f=srID%3a5980>.
2. Growth Rate data has been calculated from the table itself.
3. UN online database. Total Fixed Capital Formation data are available at:
<http://data.un.org/Data.aspx?q=Fixed+Capital+Formation&d=CDB&f=srID%3a29930>. Year End
Exchange rates (RM/$) are available at:
<http://data.un.org/Data.aspx?q=+Exchange+rate&d=CDB&f=srID%3a6100>.
4. UNCTAD online database. Local Fixed Capital Formation has been calculated from Total Fixed Capital
Formation (Table 11) adjusted with Inward FDI flows as a percentage of Gross Fixed Capital Formation.
Available at: <http://www.unctad.org/Templates/Download.asp?docid=10589&lang=1&intItemID=3277>.
5. UNCTAD online database. FDI Inflow available at:
<http://www.unctad.org/Templates/Download.asp?docid=10590&lang=1&intItemID=3277> and FDI
Outflow is available at:
<http://www.unctad.org/Templates/Download.asp?docid=10597&lang=1&intItemID=3277>.
6. Malaysia Total Labor Employment Data (1980-1990, 1992-1993, 1995-2007). Data from 1989 to 2002 are
compiled from: Department of Statistics Malaysia (2004). Malaysia Labor Force Survey 2003: Country
Report. Department of Statistics, Putrajaya, Malaysia. Total Employment Data for 1991, 1994 are
interpolated (average of previous and next year data). Employment data (1970- 1979) was calculated from
Unemployment Rate (Prime Minister's Department of Malaysia:
<http://www.epu.jpm.my/ses/pdf/1.3.1.pdf>, and Total Population, Population ages 15-64 (% of total),
Total Labor force participation rate (% of total population ages 15-64 of 1980) (World Development
Indicator, 2007. World Bank, Washington, DC).
7. Malaysia Local Labor Employment Data from 1989 to 2002 are compiled from: Department of Statistics
Malaysia (2004). Malaysia Labor Force Survey 2003: Country Report. Department of Statistics, Putrajaya,
Malaysia. Data from 1982 to 1988 and from 2003 to 2006 are compiled from ILO Labor Statistics,
Available at: <http://laborsta.ilo.org/STP/do>.
8. KOF Index of Globalization is available at: <http://globalization.kof.ethz.ch/>.
Notes to above table:
(i) Data available on current price has been converted to real value by CPI (value of year 2000 = 100).
(ii) Formula for Growth Rate Calculation = (t1 – t0) / t0.
(iii) Total Fixed Capital Formation data is available in RM which is converted by exchange rate. Formula: Total
Fixed Capital Formation / Exchange rate (RM/$).
(iv) Local Fixed Capital Formation (Constant USD) has been calculated by “Total Fixed Capital Formation *
(1- FDI flows as a percentage of Gross Fixed Capital Formation”.
(v) FDI Outflow data is not available for 1970-1979, which is considered as 0.
(vi) Total Employment Data (1970-1979) Formula = Total Population* Population ages 15-64 (% of total) *
Total Labor force participation rate (% of total population ages 15-64 of 1980)* Employment rate (1-
unemployment rate).
(vii) As Local Employment data is not available from 1970, this paper considers Total Employment instead of
Local Employment in Equation No. 3 (Table 5).
(viii) In the index of 100.00 for globalization was considered as the maximum value for full globalization and
one is the minimum value. Higher values denote greater globalization.
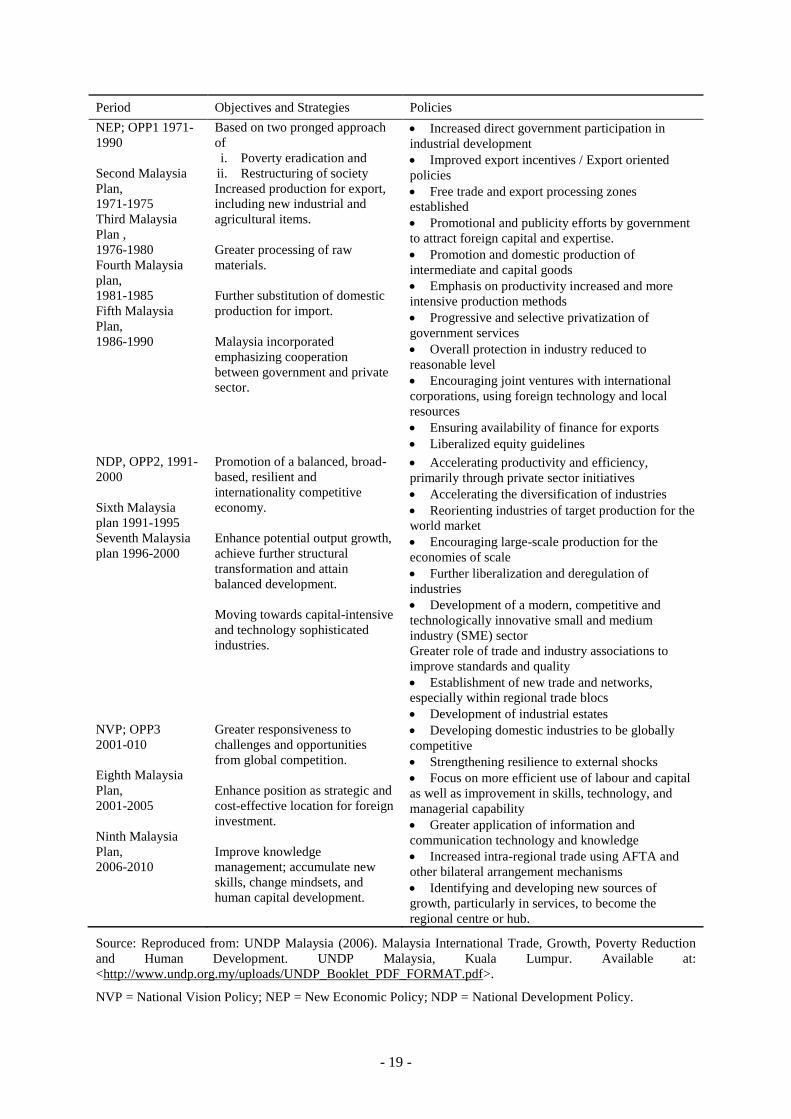
Table 2. International trade objectives, strategies, and policies in Malaysian development plans
Period Objectives and Strategies Policies
PRE-NEP 1960-
1970
First Malaysia
plan, 1966-1970
Fuller and more efficient use of
natural resources. Expansion of
economic base to reduce
dependence on raw material
exports.
Generation of higher income
through expanding domestic
production and increasing exports
of manufactured products.
Import substitution policy
Promotion of traditional and new export
possibilities
Industrial development led by private sector
Favourable investment climate, industrial estates,
and transport; power and communication provided by
government
Foreign private entrepreneurship and capital
welcomed
Protective tariff for selected infant industries.
Tax intensives and subsidies to facilitate
industrial development
- 19 -
Period Objectives and Strategies Policies
NEP; OPP1 1971-
1990
Second Malaysia
Plan,
1971-1975
Third Malaysia
Plan ,
1976-1980
Fourth Malaysia
plan,
1981-1985
Fifth Malaysia
Plan,
1986-1990
Based on two pronged approach
of
i. Poverty eradication and
ii. Restructuring of society
Increased production for export,
including new industrial and
agricultural items.
Greater processing of raw
materials.
Further substitution of domestic
production for import.
Malaysia incorporated
emphasizing cooperation
between government and private
sector.
Increased direct government participation in
industrial development
Improved export incentives / Export oriented
policies
Free trade and export processing zones
established
Promotional and publicity efforts by government
to attract foreign capital and expertise.
Promotion and domestic production of
intermediate and capital goods
Emphasis on productivity increased and more
intensive production methods
Progressive and selective privatization of
government services
Overall protection in industry reduced to
reasonable level
Encouraging joint ventures with international
corporations, using foreign technology and local
resources
Ensuring availability of finance for exports
Liberalized equity guidelines
NDP, OPP2, 1991-
2000
Sixth Malaysia
plan 1991-1995
Seventh Malaysia
plan 1996-2000
Promotion of a balanced, broad-
based, resilient and
internationality competitive
economy.
Enhance potential output growth,
achieve further structural
transformation and attain
balanced development.
Moving towards capital-intensive
and technology sophisticated
industries.
Accelerating productivity and efficiency,
primarily through private sector initiatives
Accelerating the diversification of industries
Reorienting industries of target production for the
world market
Encouraging large-scale production for the
economies of scale
Further liberalization and deregulation of
industries
Development of a modern, competitive and
technologically innovative small and medium
industry (SME) sector
Greater role of trade and industry associations to
improve standards and quality
Establishment of new trade and networks,
especially within regional trade blocs
Development of industrial estates
NVP; OPP3
2001-010
Eighth Malaysia
Plan,
2001-2005
Ninth Malaysia
Plan,
2006-2010
Greater responsiveness to
challenges and opportunities
from global competition.
Enhance position as strategic and
cost-effective location for foreign
investment.
Improve knowledge
management; accumulate new
skills, change mindsets, and
human capital development.
Developing domestic industries to be globally
competitive
Strengthening resilience to external shocks
Focus on more efficient use of labour and capital
as well as improvement in skills, technology, and
managerial capability
Greater application of information and
communication technology and knowledge
Increased intra-regional trade using AFTA and
other bilateral arrangement mechanisms
Identifying and developing new sources of
growth, particularly in services, to become the
regional centre or hub.
Source: Reproduced from: UNDP Malaysia (2006). Malaysia International Trade, Growth, Poverty Reduction
and Human Development. UNDP Malaysia, Kuala Lumpur. Available at:
<http://www.undp.org.my/uploads/UNDP_Booklet_PDF_FORMAT.pdf>.
NVP = National Vision Policy; NEP = New Economic Policy; NDP = National Development Policy.