ominvest.netkhalid muhammad al zubair 5 yes taya jandal ali 6 yes abdullah said al balushi 6 yes...
TRANSCRIPT


1


3
BOARD OF DIRECTORS
Khalid Muhammad Al ZubairChairman (E)
Taya Jandal AliDeputy Chairman (E)
Abdullah Said Al BalushiDirector
Jamal Shamis Al HootiDirector (A)
Khalid Abdullah Al KhaliliDirector (A)
Majid Sultan Al TokyDirector (E)
C.S. BadrinathDirector (E)
Majid Salim Al AraimiDirector (A)
Khalil Abdulla Al KhonjiDirector (A)
Saif Said Al YazidiDirector (E)
(E) - Member of Executive Committee (A) Member of Audit Committee

4
Dear Shareholders, On behalf of the Board of Directors, it is my great honour to welcome you to the 30th Annual General Meeting of Ominvest. I am pleased to present to you the Annual Report together with the audited financial statements for the Group and the Parent Company for the year ended 31 December 2014.
OMINVEST - 30 YEARS OF EXCELLENCEOminvest continues to uphold its long standing track record of consistent profitability and healthy dividend payments to its esteemed shareholders. Established in 1983 with a paid-up capital of RO 8m, Ominvest’s paid-up capital now stands at RO 33.67m. Over the preceding 30 years, the company has distributed a total of RO 68.4m in cash dividends to the shareholders. At the end of 2014, Ominvest’s total Book Value of Group Equity attributable to Parent Company equity holders (including retained profits) rose to RO 136m, while the Market Value of Equity climbed to RO 140m. As a result, the shareholders have earned an IRR of 16%, since inception of the Company. We are pleased to see such decent investment returns over the long period and expect even better performance in years to follow.
FINANCIAL PERFORMANCE FOR THE YEAR 2014 The Group’s consolidated profits rose by 7% to RO 28.42m from RO 26.44m in 2013. Profit attributable to the equity holders of the Parent Company increased to RO 14.51m from RO 14.18m, resulting in Earnings per Share of RO 0.043 in 2014.
In accordance with the directives of the Capital Market Authority (CMA), we are pleased to present Parent Company financial statements along with Group financial statements. The Parent Company’s balance sheet grew to RO 106.4m from RO 81.4m – an increase of 31%. Total liabilities rose to RO 46.53m from RO 22.86 in 2013. The total Shareholders’ Equity
DIRECTORS’REPORT

5
“The Group’s consolidated profits rose by 7% to RO 28.42m from RO 26.44m.”
as at December 31, 2014 stood at RO 59.9m compared to RO 58.53m. The Net Asset Value per Share rose to RO 0.178 from RO 0.174 – an increase of 2.3%. The Parent Company recorded a profit of RO 5m in 2014 compared to RO 8m in 2013. The decrease in the Parent Company’s net profit was due to lacklustre performance of Muscat Securities Market in 2014 and downturn in regional equity markets in the second half of 2014 due to dramatic decline in oil prices. Our banking subsidiary, Oman Arab Bank SAOC “OAB”, reported a profit of RO 28.4m for 2014 compared with RO 25.02m for 2013 – an increase of 13.5%. OAB’s gross loans and advances climbed by 17% to RO 1.26b and customer deposits witnessed an increase of 28% to RO 1.47b. OAB’s balance sheet remains robust, which will continue to produce healthy profits over time.
The share of profit attributable to the equity holders of the Parent Company for the year was RO 14.48m. Cash dividend from OAB’s 2013 profits received during 2014 by the Parent Company amounted to RO 5.91m. We are pleased to see our largest investment in the banking sector continue to perform well. With modern banking initiatives underway and new leadership at OAB, we are confident of delivering better results over the next few years.
STRATEGIC INITIATIVES AND OPERATIONAL PROGRESS During 2014, Ominvest went through significant transformation. We took a number of major operational, investment and strategic initiatives to further strengthen the company’s position as one of the premier investment companies in Oman:
Strategic Initiatives – We have signed an MOU with ONIC Holding to explore the viability of a merger between the two companies. The due diligence process is progressing well. Once the proposed transaction is finalized, we will be able to create larger opportunities for its stakeholders and add value to the society at large.
Operational Initiatives – In order to implement new strategy, necessary changes were effected to the organisation structure with clear direction. Further, organisation was strengthened with appointment of senior management in key thrust areas identified for implementation of new strategy. Also, new policies and manuals are now put in place to ensure that within the new structure, the management team operates more effectively.
Investment Initiatives – The Investment Philosophy, Policy & Strategy framework was reviewed and revised. As a result, we are now well positioned to generate healthy investment returns over the medium to long term. The focus remains on earning attractive dividends from our investment portfolio
and realizing significant capital appreciation, over time.
DIVIDENDS FOR THE YEAR 2014In line with its long established track record, Ominvest endeavours to provide steady dividends to its shareholders. With 2014 being another good year for Ominvest, the Board is pleased to recommend a dividend of 30% comprising of cash dividend of 20% of the total paid-up share capital (the cash dividend in 2013 was 15% of the paid-up share capital) and a stock dividend of 10% of the paid-up share capital (the stock dividend in 2013 was 10% of paid-up share capital).
ECONOMIC ENVIRONMENT & OUTLOOKThe Sultanate of Oman’s economy forecast for 2015 remains stable as the Government opts to continue to have a prudent expansionary fiscal approach. Despite the challenges in 2015 due to the drop in oil price, the Government is targeting a GDP growth of 5% against an estimated 4.4% growth in 2014. Other key drivers to achieve and sustain such a GDP growth include strong domestic demand, growth of non-oil economy and increase in oil production.
Ominvest Board of Directors and Management remains optimistic on the future prospects of your Company. We are committed to nurturing our existing assets, identifying new opportunities, and dedicated to the tradition of enhancing shareholder value. The Sultanate under the wise leadership of His Majesty Sultan Qaboos Bin Said stands today as an enviable model for sound economic policies aimed at spurring growth while ensuring stability. The standards of corporate governance prevalent among commercial enterprises operating in the country are comparable to the best in the world. The sound legal and regulatory framework governing commercial activity in the country ensures due process and an environment conducive for business to be conducted in conditions of security and fairness.
Finally, I would like to thank the Directors, management, staff, and shareholders for their support in 2014 and look forward to the Company’s continued progress in 2015 and beyond.
KHALID MUHAMMAD AL ZUBAIRCHAIRMANFebruary 22, 2015

66
7
CORPORATEGOVERNANCE REPORTThe principles of Corporate Governance mainly deals with the way companies are led and managed, the role of the Board of Directors and a framework of internal controls. At Ominvest, the Board supports the highest standards in Corporate Governance. The Board of Directors is responsible for approving and monitoring the Company’s overall strategy and policies, including risk management policies, control systems, business plan and annual budget. The Management is responsible to provide the Board with appropriate and timely information to monitor and maintain effective control over strategic, financial, operational and compliance issues. The Board confirms that Ominvest (the Company) applies the principles set out in the Capital Market Authority’s (CMA) Code of Corporate Governance for public listed companies published on 3 June 2002 (Circular no. 11/2002) as amended on 11 January 2003 (Circular no. 1/2003), and other relevant amendments to the Code, rules and guidelines issued by the CMA from time to time.
BOARD OF DIRECTORSAppointment of DirectorsThe Articles of Association of the Company provide for ten (10) directors. Each director on the Board is required to own/represent at least two hundred thousand (200,000) shares in the Company as qualification shares. Election to the Board is subject to approval by the regulatory authorities based on nomination form filed by the candidate who meets the minimum qualification requirements as per CMA guidelines. The election for the Board of Directors was held at the Annual General Meeting (AGM) held on 31 March 2014 for a term of three years and the next election to the Board is due to be held at the AGM scheduled for 31 March 2017.
Composition of the BoardDuring the year 2014, the Board consisted of ten directors who have varied backgrounds and experience and who individually and collectively exercise independent and objective judgement. The composition of the board of directors is in accordance with the Article 3 of the Code.
All Directors, including the Chairman, are non-executive. With the exception of one Director, all other Directors are independent.
All Directors with the exception of one nominee director representing an institutional shareholder, were elected by the shareholders in their individual capacities.
Directors meet the criteria of ‘independent director’ as defined by Article 1 of the CMA Code of Corporate Governance issued under Circular no. 11/2002 dated 3 June 2002 and subsequent amendments.
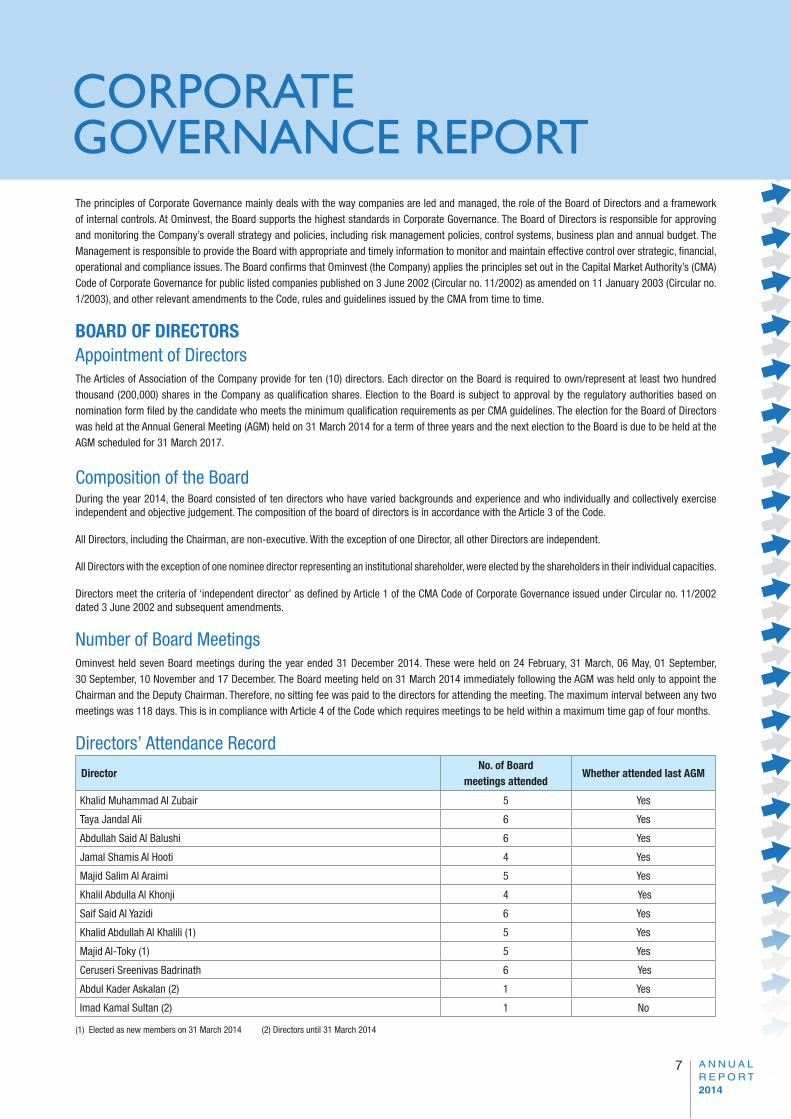
Number of Board MeetingsOminvest held seven Board meetings during the year ended 31 December 2014. These were held on 24 February, 31 March, 06 May, 01 September, 30 September, 10 November and 17 December. The Board meeting held on 31 March 2014 immediately following the AGM was held only to appoint the Chairman and the Deputy Chairman. Therefore, no sitting fee was paid to the directors for attending the meeting. The maximum interval between any two meetings was 118 days. This is in compliance with Article 4 of the Code which requires meetings to be held within a maximum time gap of four months.
Directors’ Attendance Record
DirectorNo. of Board
meetings attendedWhether attended last AGM
Khalid Muhammad Al Zubair 5 Yes
Taya Jandal Ali 6 Yes
Abdullah Said Al Balushi 6 Yes
Jamal Shamis Al Hooti 4 Yes
Majid Salim Al Araimi 5 Yes
Khalil Abdulla Al Khonji 4 Yes
Saif Said Al Yazidi 6 Yes
Khalid Abdullah Al Khalili (1) 5 Yes
Majid Al-Toky (1) 5 Yes
Ceruseri Sreenivas Badrinath 6 Yes
Abdul Kader Askalan (2) 1 Yes
Imad Kamal Sultan (2) 1 No
(1) Elected as new members on 31 March 2014 (2) Directors until 31 March 2014

8
None of the Directors is a member of the board of more than four public joint stock companies whose principal place of business is in the Sultanate of Oman, or is a chairman of more than two such companies. Particulars of directorships of other joint stock companies and memberships of other Board Committees is set out in Appendix I of this Report. Furthermore, no director is a member of the board of directors of a joint stock company which practices similar activities to the Company and whose principal place of business is in the Sultanate of Oman.
Directors with Materially Significant related Party Transactions, Pecuniary or Business Relationship with the CompanyAll details relating to financial and commercial transactions where directors may have a potential interest are provided to the Board, and the interested directors neither participate in the discussion, nor do they vote on such matters. All such matters are also discussed in detail by the Audit Committee.
The Company has its related party policy and all related party transaction were reviewed by the Audit Committee and approved by the Board collectively. During the year, there were no material related party transactions or pecuniary transactions between the Company and its directors that may have potential conflict with the interests of the Company at large.
The following shareholders are deemed to be related parties by virtue of their shareholding during the year (10% or more of the voting power) in the Company:
At 31 Dec 2014 (% Holding)• Al Hilal Investment Company LLC 20.22%• Civil Service Employees Pension Fund 14.26%
COMMITTEES OF THE BOARDAudit CommitteeThe Committee consists of four non-executive and independent directors. All members of the Committee are familiar with finance, industry, Omani laws and regulations governing SAOG companies.
The Audit Committee met five times during the year on 19 February, 4 May, 10 July, 4 November and 16 December and the attendance record is tabled below.
Attendance record of Audit Committee Members:
Name of Committee Member PositionMeetings attended
during the year
Majid Salim Al Araimi Chairman 5
Jamal Shamis Al Hooti Member 5
Khalil Abdulla Al Khonji Member 4
Khalid Abdullah Al Khalili Member 4
The Committee receives reports on the findings of internal and external audits and on actions taken by the Management in response to these. It meets with the external auditors at least once every year and reviews the scope, findings and cost effectiveness of the Company’s statutory audit and the independence and objectivity of the external auditors. It also reviews changes to the accounting policies and reviews the audited annual and unaudited quarterly financial statements and recommends for Board approval. In addition, the Committee periodically reviews and reports to the Board on the effectiveness of the Company’s system of internal control and risk management process.
Executive CommitteeThe Executive Committee is delegated powers and authority to facilitate the smooth running of the operations of the Company and exercise all of the responsibilities of the Board between its meetings within the limits set out in the Delegation of Authority Manual approved by the Board. The exceptions to the delegated powers are:
Approval of the Company’s annual budget and business plan;Approval of the Group’s and Company’s quarterly unaudited financial statements and the annual audited financial statements; andAcquisition and disposal of strategic investments.
The Executive Committee (EC) consists of four independent and one non independent Directors. All EC members are non-executive Directors.
The Committee met five times during the year on 17 February, 5 May, 17 July, 4 November and 15 December and the attendance record of the members is tabled below:
Name of Committee Member PositionMeetings attended
during the year
Khalid Muhammad Al Zubair Chairman 5
Taya Jandal Ali Member 5
Saif Said Al Yazidi Member 4
Ceruseri Sreenivas Badrinath Member 5
Majid Sultan Al Toky Member 4
Imad Kamal Sultan* Member 1
*Member until 31 March 2014.

9
In addition, certain Committee members, together with the management of the Company, attended various meetings with Government authorities and consultants in Muscat and Salalah. There was no specific compensation to members made by the Company for the time spent on Company business.
Remuneration of DirectorsDuring the year, following the approval by the shareholders at the AGM held on 31 March 2014, the Directors were paid a remuneration of RO 157,000 for 2013.
Directorship sitting fees of RO 500 was paid to the Directors for each Board/Board Committee meeting attended during the year. Total sitting fees for Board and Board Committee meetings held during 2014 were as follows:
(RO)Board 27,000
Executive Committee 12,000
Audit Committee 9,000
Total 48,000
There was no other remuneration paid by the Company to any of the Directors.
There were no travel and incidental expenses relating to Group’s business paid by the Parent Company to any Board members during the year.Remuneration for 2013 paid in 2014 and sitting fees paid for 2014 relating to individual Directors was (in RO):
DirectorSitting Fees
Remunerationfor 2013
TotalBoard
ExecutiveCommittee
AuditCommittee
Total
Khalid Muhammad Al Zubair 2,500 2,500 5,000 22,000 27,000
Taya Jandal Ali 3,000 2,500 5,500 19,000 24,500
Abdullah Said Al Balushi 3,000 3,000 14,500 17,500
Jamal Shamis Al Hooti 2,000 2,500 4,500 14,500 19,000
Majid Salim Al Araimi 2,500 2,500 5,000 14,500 19,500
Khalil Abdulla Al Khonji 2,000 2,000 4,000 14,500 18,500
Saif Said Al Yazidi 3,000 2,000 5,000 14,500 19,500
Ceruseri Sreenivas Badrinath 3,000 2,500 5,500 14,500 20,000
Majid Al-Toky (1) 2,500 2,000 4,500 - 4,500
Khalid Abdullah Al Khalili (1) 2,500 - 2,000 4,500 4,500
Abdul Kader Askalan (2) 500 - 500 14,500 15,000
Imad Kamal Sultan (2) 500 500 1,000 14,500 15,500
Total 27,000 12,000 9,000 48,000 157,000 205,000(1) Directors from 31 March 2014 (2) Directors until 31 March 2014
Directors’ Remuneration proposed for 2014 is RO 152,000 and this is subject to shareholders’ approval at the AGM scheduled to be held on Monday, 30 March 2015. As per Royal Decree 99/2005 of 5 December 2005, the maximum permissible limit on Board remuneration, including sitting fees is 5% of annual net profit, subject to an overall limit of RO 200,000. Each Director’s sitting fees per annum is limited to RO 10,000 after deduction at a rate not less than 5% of the capital.
Internal Control ReviewThe Code introduced a requirement that the directors should, at least annually, review the effectiveness of the Company’s system of internal controls and report to the shareholders that they have done so. The Board attach great importance to maintaining a strong control environment and confirm that its review has covered the financial statements, all controls, including financial, operational, compliance and risk management. The Board has reviewed the Parent Company’s internal control policies and procedures and is satisfied that appropriate procedures are in place to implement the Code’s requirement.
MANAGEMENTManagement Discussion and AnalysisA copy of the Management Discussion and Analysis is included in the annual report.
Management RemunerationAt 31 December 2014, the Company had twenty nine (29) full-time employees. The expense (salaries and allowances and other statutory payments) incurred for 2014 relating to the (6) full-time executive management team of the Company was RO 878,233.
In addition, Sitting fees and funds received by the Company from the investee companies was RO 76,958. No Travel and incidental expenses for Group’s business incurred by any of the above executives for the year 2014.
All employees are employed on two year renewable employment contracts. Notice period is 3 months for all positions or salary in lieu thereof.

10
PROFILE OFEXECUTIVE MANAGEMENT
ABDULAZIZ AL BALUSHIChief Executive OfficerAbdulAziz is an experienced and professional banker with more than 28 years of experience in the banking industry and capital markets. He was the CEO of Ahli Bank SAOG from 2007 to 2013 and was primarily responsible in converting a single product mortgage bank into a full-fledged commercial bank. During his tenure, Ahli Bank won many prestigious awards including the best bank of Oman for three consecutive years by OER, the best bank in Oman 2012 by World Finance and the Bankers award 2013.
In a career which has spanned over two decades, Mr. Al Balushi has held positions of increasing responsibility in all major areas of banking. AbdulAziz started his career with Oman International Bank and prior to joining Ahli Bank, he was Deputy CEO of National Bank of Oman. AbdulAziz holds Master of Science Degree in Finance from the University of Strathclyde (UK) and a Fellow Chartered Institute of Bankers (UK). He has attended a host of Specialized Executive Management Development Programmes at International Institutes of worldwide repute such as Strathclyde; London and INSEAD Business Schools. In November 2012, he was ranked as the “Second Best CEO in the Arab Banking World” by Forbes Magazine. AbdulAziz served in various Boards of companies across the Sultanate including ONIC Holding, Al Ahlia Insurance Company, National Life Insurance, Oman Investment & Finance Company, Gulf Hotels Co. and as Advisory Board Member in the College of Agricultural and Marine Services at Sultan Qaboos University. He is currently the Chairman of Oman Electricity Transmission Company, a wholly government-owned entity. He is also a member “The British Scholarships of Oman”, a local organisation that sponsors outstanding Omanis for post graduate studies in the U.K.
SHAHID RASOOL Chief Investment OfficerShahid joined the company in 2014 and brings on board significant experience in the areas of public and private equity investments and equity research. Before joining Ominvest, he was Head of Public Securities at QInvest (Qatar’s largest investment bank) and managed the Bank’s proprietary capital and client portfolios focusing on MENA and Global Equities. Previously, he was Head of Investments at First Gulf Bank (FGB) in Abu Dhabi, where he managed a large team and multi-asset global portfolios comprising private equity, public equities and hedge funds. He also managed private equity investments at ADIC – an Abu Dhabi based SWF. Shahid is a CFA Charter holder and received his MBA from The University of Chicago, Booth School of Business, Illinois, USA.
BIKRAM MONGA Chief Risk OfficerBikram is a senior risk management professional with 19 years of international experience in financial services / banking across Commercial & Investment Banking, Brokerage, Advisory and Islamic Banking. His experience includes working with leading institutions across GCC, Western & Eastern Europe and Central Asia, where he has accumulated an extensive understanding of various markets and advised businesses in multicultural environments. Bikram holds a BSc (with honours) in Mechanical Engineering from Moscow and an MBA from University of Alberta, Canada. At Ominvest, Bikram is responsible for the Risk Management, Compliance and Legal functions.

11
SHAREHOLDERSCommunication to Shareholders and InvestorsInformation relating to the Company and its quarterly and annual financial statements are posted on the Company’s website - www.ominvest.net. Financial statements, in Arabic and English, are also available at the Company’s offices during the Company’s business hours. The quarterly unaudited and annual audited sections of the financial statements of the Group and Parent Company are published in leading Arabic and English newspapers in the Sultanate of Oman.
Audited financial statements (abridged), in Arabic, together with the Notice and Agenda for the AGM are sent by post to all shareholders to their registered addresses provided by the Muscat Clearing and Depository Company SAOC. Extracts from the financial statements are published in an Arabic and an English newspaper within five days of filing it through electronic transmission system of MSM.
Distribution of ShareholdingThe shareholding pattern as on 31 December 2014 was:
Number of Shares % HeldNumber of
shareholders Total Shares % of Share Capital
33,674,301 and above Above 10% 2 116,123,992 34.48%
16,837,151 to 33,674,300 5% - 10% - - -
3,367,431 to 16,837,150 1% - 5% 14 114,712,361 34.07%
Below 3,367,430 Below 1% 1,098 105,906,647 31.45%
1,114 336,743,000 100.00%
NASHAT HELALFinancial ControllerNashat is a CPA & CMA by profession and he is a member of the Institute of Management Accountants and CFA Institute with over than 12 years of professional experience in managing the finance functions, formulating strategic business plans, budgeting and financial planning. Previously he was with Ernst & Young in Jordan and Oman where he was the Executive Manager leading the risk management team and led projects across various industries covering government, utilities, insurance, energy, banking and financial services. He joined the Company in July 2013 and is responsible of the finance department after he worked as a Chief Financial Officer of Oman Sail. He holds Bachelor degree in Marketing from Yarmouk University in Jordan.
HAMID AL HARTHI Head of Support ServicesHamid joined OMINVEST in 2009 as a Vice President Internal Audit, reporting to Audit Committee. Currently, he changed his career to Head of Support Services at OMINVEST. Hamid is a Certified Internal Auditor (CIA) – from the Institution of Internal Auditors (IIA), United State of America (USA) and Certified Internal Quality Auditor (CIQA). He is a Member of Institution of Internal Auditors (IIA), USA. He is also a member of Information Systems Audit and Control Association (ISACA), USA. He has over 12 years of professional experience in internal audit in various institutions in Oman including Oman Development Bank, Gulf Investment Services (GIS) as a Head of Internal Audit & Group Compliance Officer, at Gulf Baadar Capital Markets as Management representative of GIS. Hamid graduated from Sultan Qaboos University with a bachelor degree of Science in Accounting from College of Commerce and Economics.
MUNEER AL MUGHAIRIChief Internal AuditorMuneer has over 12 years of experience in Internal Audit. He worked for various reputable companies such as Oman LNG, Takamul Investment Company, Al Maha Petroleum Marketing Company. In his capacity as Internal Audit Manager at Takamul Investment Company, Muneer was responsible to oversee the Internal Audit Department over the parent company and to evaluate the requirement of conducting shareholders audit over around 8 subsidiaries. Muneer is a Certified Internal Auditor, a Certified Fraud Examiner and a Certified Information System Auditor.

12
PROFESSIONAL PROFILE OF THE STATUTORY AUDITORThe shareholders of the Company have appointed M/s Deloitte & Touche as the auditors for the year ended 31 December 2014.
Deloitte & Touche (M.E.) & Co. LLC - Statutory AuditorsDeloitte refers to one or more of Deloitte Touche Tohmatsu Limited, a UK private company limited by guarantee, and its network of member firms, each of which is a legally separate and independent entity.
Deloitte provides audit, tax, consulting, and financial advisory services to public and private clients spanning multiple industries. With a globally connected network of member firms in more than 150 countries, Deloitte brings world-class capabilities and high-quality service to clients, delivering the insights they need to address their most complex business challenges. Deloitte’s more than 200,000 professionals are committed to becoming the standard of excellence.
Deloitte & Touche (M.E.) is a member firm of Deloitte Touche Tohmatsu Limited (DTTL) and is the first Arab professional services firm established in the Middle East region with uninterrupted presence for over 85 years. Deloitte is among the region’s leading professional services firms, providing audit, tax, consulting, and financial advisory services through 26 offices in 15 countries with over 2,500 partners, directors and staff.
Remuneration to statutory auditors: (RO)
(RO)
Audit fees for 2014: Parent Company 9,950
Subsidiaries 39,700
49,650
LEGAL ADVISORM/s Al Busaidy, Mansoor Jamal & Co. continued to serve the Company as the Legal Advisor during the year.
MARKET PRICE DATAThe performance of the Company’s share price (total returns) in 2014 versus MSM-30 Index is shown below:
Details of Ominvest’s high, low and closing share prices during each month are as follows:
Dec’13 Jan’14 Feb’14 Mar’14 Apr’14 May’14 Jun’14 Jul’14 Aug’14 Sep’14 Oct’14 Nov’14 Dec’14
High 0.456 0.466 0.448 0.424 0.384 0.378 0.398 0.434 0.440 0.490 0.464 0.440 0.440
Low 0.424 0.436 0.412 0.404 0.360 0.358 0.372 0.392 0.420 0.428 0.398 0.404 0.374
Close 0.434 0.442 0.412 0.418 0.366 0.376 0.392 0.430 0.428 0.456 0.434 0.406 0.416
Source : MSM Monthly Investors’ Guide
13
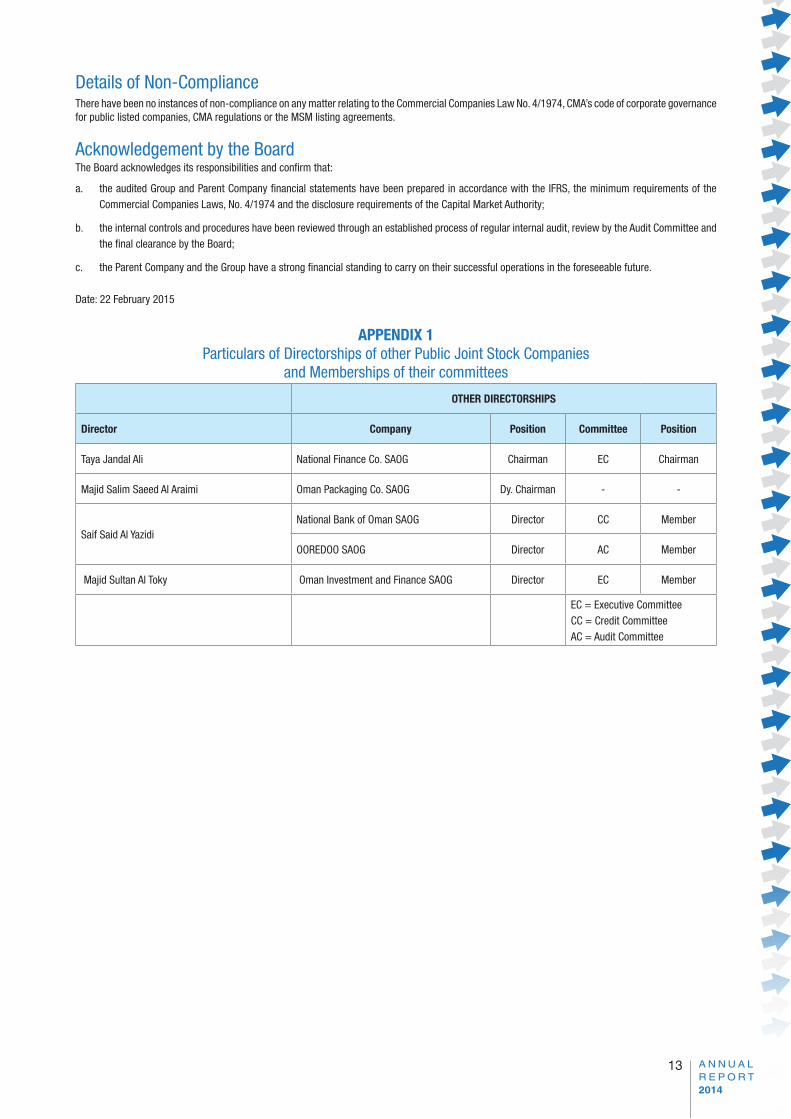
Details of Non-ComplianceThere have been no instances of non-compliance on any matter relating to the Commercial Companies Law No. 4/1974, CMA’s code of corporate governance for public listed companies, CMA regulations or the MSM listing agreements.
Acknowledgement by the BoardThe Board acknowledges its responsibilities and confirm that:
a. the audited Group and Parent Company financial statements have been prepared in accordance with the IFRS, the minimum requirements of the Commercial Companies Laws, No. 4/1974 and the disclosure requirements of the Capital Market Authority;
b. the internal controls and procedures have been reviewed through an established process of regular internal audit, review by the Audit Committee and the final clearance by the Board;
c. the Parent Company and the Group have a strong financial standing to carry on their successful operations in the foreseeable future.
Date: 22 February 2015
APPENDIX 1Particulars of Directorships of other Public Joint Stock Companies
and Memberships of their committees
OTHER DIRECTORSHIPS
Director Company Position Committee Position
Taya Jandal Ali National Finance Co. SAOG Chairman EC Chairman
Majid Salim Saeed Al Araimi Oman Packaging Co. SAOG Dy. Chairman - -
Saif Said Al Yazidi National Bank of Oman SAOG Director CC Member
OOREDOO SAOG Director AC Member
Majid Sultan Al Toky Oman Investment and Finance SAOG Director EC Member
EC = Executive CommitteeCC = Credit CommitteeAC = Audit Committee

14
MANAGEMENT DISCUSSION AND ANALYSIS REPORTOVERVIEWOman International Development and Investment Company SAOG (Ominvest or the Company), an Omani General Joint Stock Company, was established by a Ministerial Decree in 1983. The Company’s shares are listed on the Muscat Securities Market (MSM) and it is a constituent of the MSM Index which comprises a basket of 30 listed companies.
The Company’s stated objectives are to provide its shareholders a consistent annual return on their capital, together with an opportunity to participate in the long-term gains from its sound investments.
To achieve these objectives, the Company’s current investment strategy focuses on the following major areas:
• Strategic investments
• Public and Private Equity investments
• Real Estate investments
Within the above strategy, Ominvest is exploring opportunities to increase and diversify its portfolio of investments within and outside the Sultanate with an objective of growth in sustainable earnings and to mitigate volatility in its portfolio of investments.
GROUP AUDITED CONSOLIDATED FINANCIAL STATEMENTSThe Group audited consolidated financial statements include the audited financial statements of the following companies for the financial year ended 31 December 2014:
Company Activity Country Staff * Status
Oman International Development& Investment Company SAOG
Investment Oman 29 Parent Company
Oman Arab Bank SAOC Banking Oman 1,187 Subsidiary (51%)
Oman Investment Services SAOC Investment Oman 3 Subsidiary (99.98%)
Salalah Resorts SAOC Integrated Oman - Subsidiary (100%)
Tourism
Al Jabal Al Aswad Investment LLC Tourism Oman - Subsidiary (100%)
Budva Beach Properties d.o.o. Tourism Montenegro 2 Subsidiary (100%)
[Subsidiary of Al Jabal Al Aswad Inv. LLC]
* at 31 December 2014
The financial highlights based on the audited financial statements for the financial year ended 31 December 2014 are:
GROUP PARENT COMPANY
2014(RO ’000)
2013(RO ’000)
2014(RO ’000)
2013(RO ’000)
Profit for the year attributable to the shareholders of the Parent Company 14,505 14,177 5,013 8,016
Share capital 33,674 30,613 33,674 30,613
Shareholders’ funds 132,669 123,176 59,907 58,533
Proposed cash dividend 6,735 4,592 6,735 4,592
Proposed stock dividend 3,367 3,061 3,367 3,061
Basic earnings per share (RO) 0.043 0.042 0.015 0.024
Net assets per share (RO) 0.394 0.366 0.178 0.174
Cash dividend per share (RO) 0.020 0.015 0.020 0.015
Stock dividend per share (RO) 0.010 0.010 0.010 0.010

15
PERFORMANCE FOR THE YEARThe Group consolidated profit for the year was RO 28.42m (2013: RO 26.44m) and is attributable to:
2014(RO’000)
2013(RO’000)
Shareholders of the Parent Company 14,505 14,177
Non-Controlling interests 13,919 12,264
28,424 26,441
Non-controlling interests represents 49% of the banking subsidiary’s equity owned by the minority shareholder, Arab Bank, Jordan. Accordingly, 49% of Oman Arab Bank’s profit for the year is attributable to non-controlling interests.
Earnings per share increased to RO 0.043 (2013: RO 0.042) for the Group and decreased to RO 0.015 (2013: RO 0.024) for the Parent Company. NAV per share increased to RO 0.394 (2013: RO 0.366) for the Group and RO 0.178 (2013: RO 0.174) for the Parent Company.
PARENT COMPANY IncomeInvestment Income: RO 8.47m (2013: RO 11.18m)Investment income comprise dividend income, profit from capital market investments and from available for sale investments. Investment income details are presented in Note 19 of the financial statements.
i. Dividend income – RO 7.31m (2013: RO 7.60)Ominvest’s main income was from its single largest investment (at cost) of RO 41.30m (39% of total assets) in its banking subsidiary, Oman Arab Bank SAOC (OAB). During 2014, cash dividend of RO 5.91m (2013: RO 5.91m) was received from OAB.
Cash dividend and directors’ sitting fees received from associate investments in National Finance Company, National Detergent Company and National Biscuits Industries Limited was RO 0.77m (2013: RO 0.75m).
Cash dividend received from capital market investments in Oman and other GCC markets amounted to RO 0.25m (2013: RO 0.26m) and cash dividend received from other investments in Oman was RO 0.42m (2013: RO 0.68m).
ii. Profit from capital markets investments Profit from capital markets investments amounted to RO -703.7m (2013: RO 3.36m) representing net realized and unrealized gains. Capital market investments incurred a loss of -0.97% (2013: +37.5% gains) for the year.
Movement in capital market investments for the year was as follows:
MSMOther GCC* Portfolio
OthersMarkets Total
(RO‘000) (RO‘000) (RO‘000) (RO‘000)
At 1 January 2014 3,296 2,061 1,515 6,872
Market gains (402) (329) 28 (703)
Net flows 740 589 (879) 450
At 31 December 2014 3,634 2,321 664 6,619
* include managed GCC focused mutual funds.
Movement in the index of selected GCC markets was as follows:
PERIOD MSM General Index DFM General Index ADSM Index31 December 2014 6343.22 3774.00 4528.93
31 December 2013 6834.56 3369.81 4290.30
Change for the year � 7.19% �11.99% �5.56%
DFM = Dubai Financial Market ADSM = Abu Dhabi Stock Market
iii. Available for Sale investmentsAvailable for sale investments included under investment securities comprise:
a) Quoted local investmentsThese positions represent investments in public equities to be held for medium to long term horizon. The Balance of these investments was RO 25.09m as of 31 December 2014, with recorded unrealized gains through other comprehensive income of RO 0.953m.
a-1) Investments in overseas unquoted private equity direct investments and managed funds: These positions are generally held for long periods. Fair values of these investments are estimated based on periodic reports received from the
fund managers. Based on the periodic reports received, following a review of each position, the management estimates impairment charges, if any, and such charge is recognized as an expense in the statement of comprehensive income. Estimated positive fair value changes, if any, are recognized in shareholders total equity through ‘other comprehensive income’ in the statement of comprehensive income.
During 2014, the Company exited its investment in Mountain Partners AG.

16
a-2) Loss/Profit realized from private equity managed funds was RO -0.006m (2013: RO 0.2m). This was earned from those private equity funds which mainly represent residual balances.
1 managed fund which was fully provided for in earlier years and written off during the year, amounted to RO 0.30m.Movement during the year, investments at cost, impairment provision for changes in fair values is as follows:
Particulars InvestmentsProvisions for
Impairment Fair value Reserve
(RO’000) (RO’000) (RO’000)
At 1 January 2014 4,335 2,906 78
Net Additions - 306 -
Disposals (765) - -
Investments written off (1,741) (1,737) -
Reduction - - (14)
At 31 December 2014 1,829 1,475 64
(b) Unquoted Local Investments Unquoted local investments are initially recognized at acquisition cost, being the fair value. At the reporting date, these investments were fair
valued mainly based on DCF valuation which is considered to be the most appropriate basis. Following this, these investments are reported at a fair value of RO 6.6m (recognised in previous years) compared to acquisition cost of RO 0.7m. The positive changes in fair values amounting to RO 5.6m (before deferred tax reserve) is recognized through other comprehensive income and included in shareholders’ equity.
Statement of Financial PositionTotal Assets were RO 106.44m vs. RO 81.40m at 31 December 2013. Concentration of total assets by geography is, Sultanate of Oman: RO 95.13m 89% (2013: RO 68.25m) and outside the Sultanate RO 11.31m 11% (2013: RO 13.15m).
Shareholders’ Total Equity at RO 59.91m grew by 2.35% from RO 58.53m at 31 December 2013. Share Capital increased to RO 33.67m (from RO 30.61m), the increase represent stock dividend of RO 3.06m approved at the Annual General Meeting held on 31 March 2014. Retained Earnings rose to RO 19.19m compared to RO 13.33m as at 31 December 2013.
Investments in associates (Group) 2014 2013
(RO’000) (RO’000)
13,908 12,372
There are 3 (2013: 3) SAOG companies in which the Group and the Parent Company have shareholding between 20% and 50% of the voting rights, and deemed to exercise significant influence by representation on the investee company Board and Board committees. The market value of investments in associate companies quoted on the Muscat Securities Market held by the Group amounted to RO 13.56m (2013: RO 13.46m). The major exposure is to a leasing associate which accounted for a carrying value of RO 10.05m (market value: RO 9.97m). The Group will continue to hold these investments subject to returns meeting internal benchmarks.
Associates generally performed well and contributed positively. Share of profits from associates recognised in the Group’s statement of comprehensive income amounted to RO 1.69m for 2014 (2013: RO 1.52m). Cash dividend from associates recognised in the parent company amounted to RO 0.77m (2013: RO 0.75m)
Fair Value DisclosuresAs per International Accounting Standard 27: Consolidated and Separate Financial Statements, the parent company is only required to present the consolidated financial statements which incorporate its results and financial position as well as those of the subsidiary companies. IAS 27 also prescribes the accounting treatment for investments in subsidiaries and associates when the parent company is required to prepare separate financial statements by the local regulators.
In accordance with the (Capital Market Authority’s Circular E/2/2007 issued on 14th January 2007) the Parent Company’s detailed financial statements are presented along with the Group financial statements. These financial statements are prepared in compliance with the International Financial Reporting Standards (IFRS).
We would like to highlight the following important disclosures related to the Fair Value of investments in subsidiaries and investments in associate companies in the Parent Company’s separate financial statements.

17
Investments in SubsidiariesThe Parent Company’s investments in subsidiaries, which are unquoted, are stated “at cost” and comprise the following:
2014 2013
%held (RO’000) %held (RO’000)
Oman Arab Bank SAOC 50.99 41,302 50.99 41,302
Oman Investment Services SAOC 99.98 903 99.98 903
Salalah Resorts SAOC 100.00 3,000 100.00 1,000
Al Jabal Al Aswad Investment LLC 100.00 - 100.00 -
Budva Beach Properties(fully owned subsidiary of Al Jabal Al Aswad Investment LLC)
100.00 5,231 100.00 5,231
While the investment in the banking subsidiary is reported at cost (RO 41.3m) under IAS 27, the fair value of the Parent Company’s investment in Oman Arab Bank SAOC’s equity (50.99%) could be significantly higher. IFRS set out valuation techniques such as using recent arm’s length market transactions between knowledgeable, willing parties, if available, reference to the current fair value of another instrument that is substantially the same, discounted cash flow analysis and options pricing models for determining the fair value of unquoted investments. Fair value of Parent Company’s investment in Oman Arab Bank could vary depending on the valuation technique that may be applied.
Budva Beach Properties and Salalah Resorts SAOC were established to focus on property development. Salalah Resort SAOC is an Integrated Tourism Complex project.
Investments in AssociatesIn accordance with International Accounting Standard 28: Investments in Associates (revised), investments in associates are stated “at cost”. Income from such investments is recognised in the Parent Company’s separate financial statements as the cash dividend received from associate companies.
Investments in associates are in companies which are listed on the Muscat Securities Market. At the balance sheet date, the market value of these investments at closing prices was RO 13.43m (2013: RO 13.36m) compared with the balance sheet carrying value (at cost) in the Parent Company’s separate financial statements of RO 6.25m (2013: RO 5.63m) reflecting a positive value difference of RO 7.18m (2013: RO 7.73m).
Therefore, to conclude, the fair value of net assets held by the Parent Company as shown in its separate financial statements, would be significantly higher as compared to the reported net asset value of RO 59.91m (2013: RO 58.53m) considering the value ascribed to subsidiaries and associates at the balance sheet date under IFRS.
All other financial assets and liabilities of the Parent Company are reported at fair values, as per IFRS.
In adopting these policies, the Group applies prudence and consistency in methodology used as this involves certain judgements and estimates. It is the Group’s policy to promptly report any material issues relating to its results and financial position immediately.
Due from Subsidiaries: RO 2.78m (2013: RO 4.52m)This represents the development costs and expenses paid by the Parent Company on behalf of the directly managed and fully owned subsidiaries in the real estate sector.
Property & Equipment: RO 0.35m (2013: RO 5.52m)During 2014, the company completed the commercial property and transferred it to investment property. The same property was sold during the year. The remaining balance of property and equipment as of 31 December 2014 represents furniture & fixture and computer equipment & software.
Bank borrowingsIncrease
in 2014 2014 2013
(RO’000) (RO’000) (RO’000)
22,800 44,000 21,200
This comprises the Parent Company borrowings (including short-term and medium term borrowings from the banking subsidiary) of RO 19.5m (2013: RO 5m) which was eliminated on consolidation. The borrowings are mainly to fund Parent Company’s investment activities. All outstanding borrowings are clean facilities without any tangible securities and are due for settlement within one year to two years.
Ominvest’s debt/equity ratio at the balance sheet date is positioned at 0.73:1 on shareholders’ total equity of RO 59.91m in the Parent Company.

18
INTERNAL CONTROLThe Board has collective responsibility for the establishment and maintenance of a system of Internal Controls that provides reasonable assurance of effective and efficient operations, internal financial controls and compliance with laws and regulations. However, the Board recognises that any system of internal control can provide only reasonable, and not absolute, assurance against material misstatement or loss.
The system of internal controls is monitored regularly by the Board, its Committees, Management and Internal Audit. The Company’s business is conducted with a regulated control framework, underpinned by policy statements, written procedures and control manuals. The Board has established a management structure which clearly defines roles, responsibilities and reporting lines. Delegated authorities are documented and communicated.
The business performance of the Company is reported regularly to its management and the Board. Performance trends, forecasts as well as actual performance against budgets and prior periods are closely monitored. Financial information is prepared using appropriate accounting policies fully in compliance with the IFRS which are applied consistently. Operational procedures and controls have been established to facilitate complete, accurate and timely processing of transactions and the safeguarding of assets. These controls also include the segregation of duties, the regular reconciliation of accounts and the valuation of assets and positions.
Critical Accounting PoliciesThe Group’s accounting policies have been adopted in conformity with the International Financial Reporting Standards (IFRS) and have been consistently applied.
In applying certain accounting policies, the management of the Parent Company and of investee companies is required to make estimates and judgements regarding certain assets which are expected to be generating income and cash flows over a longer period, say up to ten years. Carrying values of assets recognised in the financial statements from such estimates are necessarily based on assumptions about numerous factors involving varying, and possibly significant, degrees of judgement and uncertainty. Accordingly, the carrying values reported in the financial statements may prove, with the benefit of hindsight, to be inaccurate. The balance sheet items which may most significantly be affected by these estimates are unquoted investments held by the Group and loans and advances to customers by the banking subsidiary.
Considering the Group’s principal activities, the following accounting policies (fully detailed in the consolidated financial statements) are critical as their application may have a significant bearing on the reported results and the financial position of the Group:
• Impairment and uncollectability of financial assetsAn assessment is made at each balance sheet date to determine whether there is any indication that a specific financial asset may be impaired. If such indication exists, the estimated recoverable amount of that asset is determined and any impairment loss, based on the net present value of future anticipated cash flows, is recognised in the statement of comprehensive income.
Loans and advances to customers are presented net of specific and general allowances for uncollectibility.
• Fair ValuesFair values relating to valuation of unquoted investments and measurement of estimated change in values is by reference to external reports received. Fair values of unquoted investments cannot be determined without extensive, subjective, judgmental and possibly speculative estimates by the Company. Such investments are initially stated at cost, re-measured to estimated values at periodic intervals.
Unrealised gains and losses on re-measurement of fair values of financial assets at fair value through profit or loss are included in the statement of comprehensive income and positive changes in fair values on available for sale financial assets are included under shareholders equity.
Dividends and Share CapitalThe Parent Company’s objective is to provide its shareholders with a reasonable and consistent annual cash return on their investment in the share capital of the Company.
Since inception, the Parent Company has a track record of consistent dividend payments. Cash dividends of RO 68.36m have been declared and distributed to shareholders. In addition, stock dividends totalling RO 21.67m were distributed since inception.
Share Capital paid in by the shareholders to date amounted to RO 12m as, of which RO 8 m was paid in November 1983 when the Company was incorporated and RO 4m in April 1994, following an increase in paid up share capital.
The market capitalisation of the Parent Company at end 2014 was RO 140m (2013: RO 132.86m).

19
Potential Risks and Concerns We discuss below risks associated with our operations. However, these risks and uncertainties may not be the only ones facing our Company. Additional risks and uncertainties not presently known to us or that we currently deem immaterial may also affect us. If any of these risks actually occur, our business, financial condition or results of operations could be impacted.
Banking Sector Exposure:• The banking subsidiary, Oman Arab Bank SAOC, is the largest investment of the Parent Company. The Bank operates within the confines of the Omani
economy which is substantially dependent on income derived from oil and gas which is dependent on the crude reserves, annual production and international demand and supply. The growth in the Bank’s loan book and resultant earnings is dependent on the continuous growth in Oman’s economic activities.
• The banking industry is licensed and regulated by the Central Bank of Oman. Changes in regulations could impact the earnings and operational ability of the Bank.
Real Estate Sector Exposure:The Real Estate investments by the Company include the development of properties over time. This exposes the Company to the risks in property market conditions and thereby potential decrease in the value of its real estate investments.
Leasing Sector Exposure:• The leasing associate, National Finance Company SAOG, is carried on an equity basis at a value of RO 10.05 million in the consolidated financial
statements. Any deterioration in the fundamentals of leasing industry could impact the financial statements of the associate thus reducing earnings recorded by the Group and the carrying value of our investment.
• The leasing industry is regulated by the Central Bank of Oman and any changes in regulations may impact the earnings ability of this company.
Private Equity Exposure: • The investment in private equity is illiquid and the timing and size of distributions is not under the control of the Company’s management. Furthermore,
exits are dependent on the market conditions prevalent in the global economies.
• Provisions for impairments, which are considered other than temporary, have been estimated by management and are mainly based on external reports issued by the Fund Managers and investee companies. Continued economic weakness in developed markets and the lack of availability of funding could affect the viability of some of these investments.
Public Equity Exposure: • While the Group’s exposure to the companies listed on the Muscat Securities Market is primarily in Blue Chips stocks, any volatility in the local,
regional and Asian markets could impact the returns from this segment of the Group’s assets. As the portfolio is fairly well diversified, relatively small compared to Group’s total assets, and is regularly monitored by the management, timely response would minimise the impact.
Date: February 22, 2015

20

21

22
GROUP AND PARENT COMPANY STATEMENTS OF FINANCIAL POSITIONAT 31 DECEMBER 2014
Notes Group Parent Company
2014(RO’000)
2013(RO’000)
2014(RO’000
2013(RO’000)
ASSETS
Balances with banks and money at call 25 115,302 134,338 3,549 2,078
Certificates of deposit 6 200,000 100,000 - -
Deposits with banks 7 96,258 35,150 - -
Investment securities 8 113,657 68,476 39,733 15,017
Investments in associates 8(d) 13,908 12,372 6,249 5,627
Investments in subsidiaries 8(e) - - 50,436 48,436
Loans and advances to customers 9 1,240,336 1,071,291 - -
Due from subsidiaries - - 2,776 4,522
Other assets 10 43,350 32,850 367 193
Investment properties 11(a) 2,980 - 2,980 -
Projects work in progress 11(b) 8,778 8,717 - -
Property and equipment 11(c) 29,669 32,333 346 5,522
TOTAL ASSETS 1,864,238 1,495,527 106,436 81,395
EQUITY AND LIABILITIES
CAPITAL AND RESERVE
Share capital 12 33,674 30,613 33,674 30,613
Legal reserve 13(a) 24,802 22,838 9,072 8,571
Capital reserve 13(b) 17,846 17,846 - -
General reserve 13(c) 12,064 10,615 - -
Subordinated debt reserve 13(d) 15,297 10,198 - -
Revaluation reserve 13(e) 1,677 1,677 - -
Cumulative changes in fair value 8(b) 6,292 6,712 6,970 6,017
Retained earnings 21,017 22,677 10,191 13,332
Equity attributable to equity holders of the Parent Company 132,669 123,176 59,907 58,533
Non-controlling interests 104,323 97,410 - -
TOTAL EQUITY 236,992 220,586 59,907 58,533
LIABILITIES
Due to banks 15 30,391 20,062 44,000 21,200
Deposits from customers 1,465,206 1,148,504 - -
Other liabilities 16 77,413 52,683 2,529 1,662
Taxation 18 4,236 3,692 - -
Subordinated bonds 17 50,000 50,000 - -
TOTAL LIABILITIES 1,627,246 1,274,941 46,529 22,862
TOTAL EQUITY AND LIABILITIES 1,864,238 1,495,527 106,436 81,395
Net assets per share (Rial Omani) 38 0.394 0.366 0.178 0.174
These financial statements were approved and authorised for release by the Board of Directors on 22 February 2015 and were signed by:
_______________________________ ___________________________Khalid Muhammad Al Zubair AbdulAziz Al BalushiChairman Chief Executive Officer
The accompanying notes form an integral part of these consolidated financial statements.

23
GROUP AND PARENT COMPANY STATEMENTS OF PROFIT OR LOSSAND OTHER COMPREHENSIVE INCOMEFOR THE YEAR ENDED 31 DECEMBER 2014
Notes Group Parent Company
2014(RO’000)
2013(RO’000)
2014(RO’000)
2013(RO’000)
Interest income 19 57,767 53,504 - -
Interest expense 20 (14,468) (11,523) (509) (463)
Net interest income / (expense) 43,299 41,981 (509) (463)
Investment income - net 21 4,850 6,933 8,470 11,180
Fee and commission income - net 22 19,475 14,417 - -
Other operating income 23 5,781 4,721 127 70
Total income 73,405 68,052 8,088 10,787
Operating expenses 24 (40,362) (36,064) (2,769) (2,041)
Provision for impairment of work in progress 11 (b) - (1,329) - -
Allowance for loan impairment 9 (b) (8,885) (6,351) - -
Recoveries / release from allowance for loan impairment 9 (b) 6,871 4,999 - -
Provision for impairment on investments (306) (730) (306) (730)
OPERATING PROFIT 30,723 28,577 5,013 8,016
Share of profit from associates 8 (d) 1,687 1,519 - -
PROFIT BEFORE TAX 32,410 30,096 5,013 8,016
Income tax expense 18 (3,986) (3,655) - -
PROFIT FOR THE YEAR 28,424 26,441 5,013 8,016
Other comprehensive income:
Items that may be reclassified subsequently to profit or loss:
Changes in the fair value of available-for-sale investments (1,740) 2,180 953 962
Other comprehensive income for the year (1,740) 2,180 953 962
TOTAL COMPREHENSIVE INCOME FOR THE YEAR 26,684 28,621 5,966 8,978
Profit for the year attributable to:
Shareholders of the Parent Company 14,505 14,177 5,013 8,016
Non-controlling interests 13,919 12,264 - -
28,424 26,441 5,013 8,016
Total comprehensive income for the year attributable to:
Shareholders of the Parent Company 14,085 15,759 5,966 8,978
Non-controlling interests 12,599 12,862 - -
26,684 28,621 5,966 8,978
Basic earnings per share on profit attributable to the shareholders of the Parent Company (Rial Omani) 37 0.043 0.042 0.015 0.024
The accompanying notes form an integral part of these consolidated financial statements.

24
STAT
EMEN
T OF
CHA
NGES
IN E
QUIT
Y FO
R TH
E YE
AR E
NDED
31
DECE
MBE
R 20
14
Shar
e ca
pita
lLe
gal
rese
rve
Capi
tal
rese
rve
Gene
ral
rese
rve
Sub-
or
dina
ted
debt
re
serv
eRe
valu
atio
nre
serv
e
Cum
ulat
ive
chan
ges
infa
ir va
lue
Reta
ined
earn
ings
Attr
ibut
able
to
equi
ty h
olde
rs
of th
e Pa
rent
Co
mpa
ny
Non-
co
ntro
lling
inte
rest
sTo
tal
(RO’
000)
(RO’
000)
(RO’
000)
(RO’
000)
(RO’
000)
(RO’
000)
(RO’
000)
(RO’
000)
(RO’
000)
(RO’
000)
(RO’
000)
GROU
P
At 3
1 De
cem
ber 2
012
27,8
3020
,757
17,8
469,
977
5,09
91,
677
5,13
022
,441
110,
757
90,2
3320
0,99
0
Profi
t for
the
year
--
--
--
-14
,177
14,1
7712
,264
26,4
41
Net c
hang
es in
fair
valu
es-
--
--
-1,
582
-1,
582
598
2,18
0
Tota
l com
preh
ensi
ve in
com
e fo
r the
yea
r-
--
--
-1,
582
14,1
7715
,759
12,8
6228
,621
Tran
sfer
to le
gal r
eser
ve (n
ote
13a)
-2,
081
--
--
-(2
,081
)-
--
Tran
sfer
to g
ener
al re
serv
e (n
ote
13c)
--
-63
8-
--
(638
)-
--
Tran
sfer
to s
ubor
dina
ted
debt
rese
rve
(not
e 13
d)-
--
-5,
099
--
(5,0
99)
--
-
Bonu
s sh
ares
issu
ed d
urin
g th
e y
ear (
note
12)
2,78
3-
--
--
-(2
,783
)-
--
Divi
dend
pai
d re
latin
g to
201
2-
--
--
--
(3,3
40)
(3,3
40)
(5,6
85)
(9,0
25)
At 3
1 De
cem
ber 2
013
30,6
1322
,838
17,8
4610
,615
10,1
981,
677
6,71
222
,677
123,
176
97,4
1022
0,58
6
Profi
t for
the
year
--
--
--
-14
,505
14,5
0513
,919
28,4
24
Net c
hang
es in
fair
valu
es-
--
--
-(4
20)
-(4
20)
(1,3
20)
(1,7
40)
Tota
l com
preh
ensi
ve in
com
e fo
r the
yea
r-
--
--
-(4
20)
14,5
0514
,085
12,5
9926
,684
Tran
sfer
to le
gal r
eser
ve (n
ote
13a)
-1,
964
--
--
-(1
,964
)-
--
Tran
sfer
to g
ener
al re
serv
e (n
ote
13c)
--
-1,
449
--
-(1
,449
)-
--
Tran
sfer
to s
ubor
dina
ted
debt
re
serv
e (n
ote
13d)
--
--
5,09
9-
-(5
,099
)-
--
Bonu
s sh
ares
issu
ed d
urin
g th
e y
ear (
note
12)
3,06
1-
--
--
-(3
,061
)-
--
Divi
dend
pai
d re
latin
g to
201
3-
--
--
--
(4,5
92)
(4,5
92)
(5,6
86)
(10,
278)
At 3
1 De
cem
ber 2
014
33,6
7424
,802
17,8
4612
,064
15,2
971,
677
6,29
221
,017
132,
669
104,
323
236,
992
The
acco
mpa
nyin
g no
tes
form
an
inte
gral
par
t of t
hese
con
solid
ated
fina
ncia
l sta
tem
ents
.

25
STAT
EMEN
T OF
CHA
NGES
IN E
QUIT
YFO
R TH
E YE
AR E
NDED
31
DECE
MBE
R 20
14
Shar
e ca
pita
lLe
gal
rese
rve
Cum
ulat
ive
chan
ges
infa
ir va
lue
Reta
ined
earn
ings
Tota
l
(RO’
000)
(RO’
000)
(RO’
000)
(RO’
000)
(RO’
000)
PARE
NT C
OMPA
NY
At 1
Jan
uary
201
327
,830
7,77
05,
055
12,2
4052
,895
Profi
t for
the
year
--
-8,
016
8,01
6
Net c
hang
es in
fair
valu
e-
-96
2-
962
Tota
l com
preh
ensi
ve in
com
e fo
r the
yea
r-
-96
28,
016
8,97
8
Bonu
s sh
ares
issu
ed d
urin
g th
e ye
ar (n
ote
12)
2,78
3-
-(2
,783
)-
Tran
sfer
to le
gal r
eser
ve (n
ote
13a)
-80
1-
(801
)-
Divi
dend
pai
d re
latin
g to
201
2 (n
ote
14)
--
-(3
,340
)(3
,340
)
At 1
Jan
uary
201
430
,613
8,57
16,
017
13,3
3258
,533
Profi
t for
the
year
--
-5,
013
5,01
3
Net c
hang
es in
fair
valu
e-
-95
3-
953
Tota
l com
preh
ensi
ve in
com
e fo
r the
yea
r-
-95
35,
013
5,96
6
Tran
sfer
to le
gal r
eser
ve (n
ote
13a)
-50
1-
(501
)-
Bonu
s sh
ares
issu
ed d
urin
g th
e ye
ar (n
ote
12)
3,06
1-
-(3
,061
)-
Divi
dend
pai
d re
latin
g to
201
3 (n
ote
14)
--
-(4
,592
)(4
,592
)
At 3
1 De
cem
ber 2
014
33,6
749,
072
6,97
010
,191
59,9
07
The
acco
mpa
nyin
g no
tes
form
an
inte
gral
par
t of t
hese
con
solid
ated
fina
ncia
l sta
tem
ents
.
26
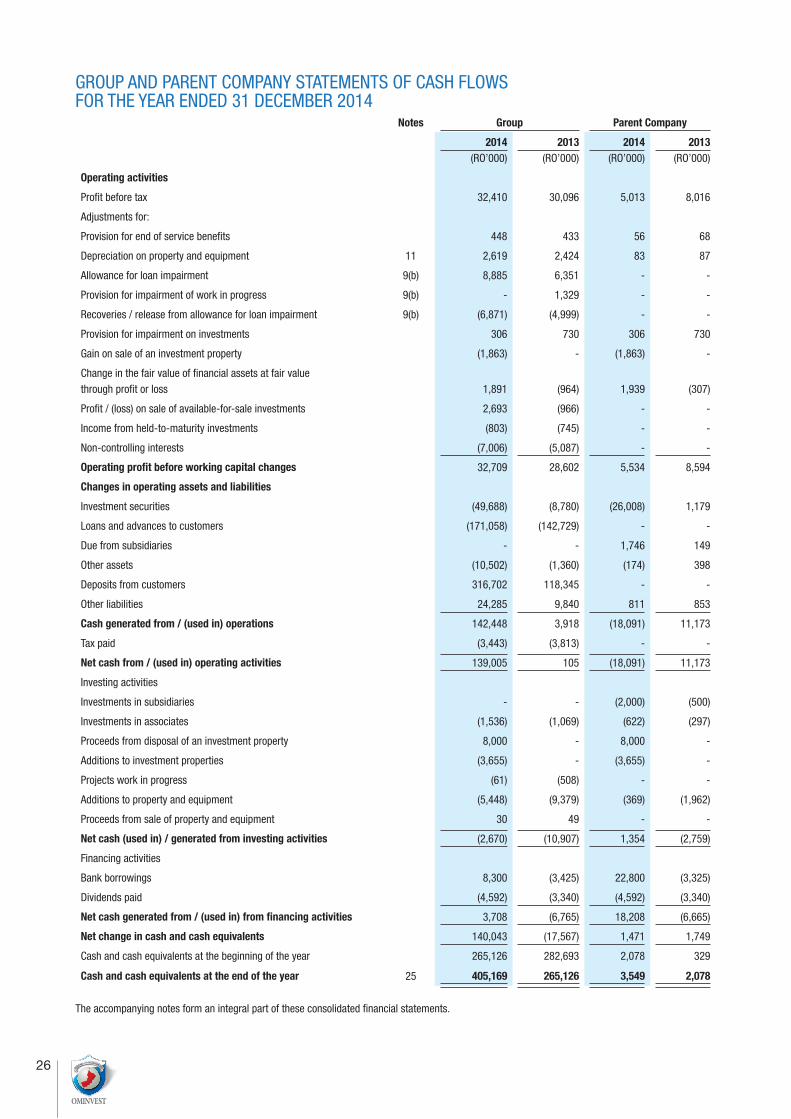
GROUP AND PARENT COMPANY STATEMENTS OF CASH FLOWS FOR THE YEAR ENDED 31 DECEMBER 2014
Notes Group Parent Company
2014(RO’000)
2013(RO’000)
2014(RO’000)
2013(RO’000)
Operating activities
Profit before tax 32,410 30,096 5,013 8,016
Adjustments for:
Provision for end of service benefits 448 433 56 68
Depreciation on property and equipment 11 2,619 2,424 83 87
Allowance for loan impairment 9(b) 8,885 6,351 - -
Provision for impairment of work in progress 9(b) - 1,329 - -
Recoveries / release from allowance for loan impairment 9(b) (6,871) (4,999) - -
Provision for impairment on investments 306 730 306 730
Gain on sale of an investment property (1,863) - (1,863) -
Change in the fair value of financial assets at fair value through profit or loss 1,891 (964) 1,939 (307)
Profit / (loss) on sale of available-for-sale investments 2,693 (966) - -
Income from held-to-maturity investments (803) (745) - -
Non-controlling interests (7,006) (5,087) - -
Operating profit before working capital changes 32,709 28,602 5,534 8,594
Changes in operating assets and liabilities
Investment securities (49,688) (8,780) (26,008) 1,179
Loans and advances to customers (171,058) (142,729) - -
Due from subsidiaries - - 1,746 149
Other assets (10,502) (1,360) (174) 398
Deposits from customers 316,702 118,345 - -
Other liabilities 24,285 9,840 811 853
Cash generated from / (used in) operations 142,448 3,918 (18,091) 11,173
Tax paid (3,443) (3,813) - -
Net cash from / (used in) operating activities 139,005 105 (18,091) 11,173
Investing activities
Investments in subsidiaries - - (2,000) (500)
Investments in associates (1,536) (1,069) (622) (297)
Proceeds from disposal of an investment property 8,000 - 8,000 -
Additions to investment properties (3,655) - (3,655) -
Projects work in progress (61) (508) - -
Additions to property and equipment (5,448) (9,379) (369) (1,962)
Proceeds from sale of property and equipment 30 49 - -
Net cash (used in) / generated from investing activities (2,670) (10,907) 1,354 (2,759)
Financing activities
Bank borrowings 8,300 (3,425) 22,800 (3,325)
Dividends paid (4,592) (3,340) (4,592) (3,340)
Net cash generated from / (used in) from financing activities 3,708 (6,765) 18,208 (6,665)
Net change in cash and cash equivalents 140,043 (17,567) 1,471 1,749
Cash and cash equivalents at the beginning of the year 265,126 282,693 2,078 329
Cash and cash equivalents at the end of the year 25 405,169 265,126 3,549 2,078
The accompanying notes form an integral part of these consolidated financial statements.

27
Notes to the Group and Parent Company Financial Statements for the Year Ended 31 December 2014
1. GENERAL INFORMATIONOman International Development and Investment Company SAOG (‘the Company’ or ‘the Parent company’) is incorporated in the Sultanate of Oman as a public joint stock company and is principally engaged in investment related activities. The Parent Company is listed on the Muscat Securities Market.
The Parent Company’s principal place of business and registered address is Al Shatti Al Qurum, Way No. 3036 Building No. 2832, Penthouse, P O Box 3886, Ruwi, Postal Code 112, Sultanate of Oman.
These consolidated financial statements for the year ended 31 December 2014 comprise the Parent Company and its subsidiaries (together referred to as the Group) and the Group’s interest in associates. The separate financial statements represent the financial statements of the Parent Company on a stand-alone basis. The consolidated and separate financial statements are collectively referred to as “the financial statements”.
2. SUMMARY OF SIGNIFICANT ACCOUNTING POLICIES2.1 Statement of complianceThe consolidated financial statements have been prepared in accordance with International Financial Reporting Standards (“IFRS”) as promulgated by the International Accounting Standards Board (IASB) and the interpretations issued by the International Financial Reporting Interpretations Committee (IFRIC) of the IASB. The consolidated financial statements comply with the relevant disclosure requirements of the Commercial Companies Law of 1974, as amended and the provisions for disclosure included in the Executive Regulations of the Capital Market Law.
2.2 Basis of preparationThese financial statements are prepared under the historical cost convention, as modified by remeasurement of fair value of financial assets at fair value through profit or loss and available-for-sale financial assets. The basis of consolidation is set out in note 2.4.
The statement of financial position is presented in descending order of liquidity as this presentation is more appropriate to the Group’s operations.
The preparation of financial statements in conformity with IFRS requires the use of certain critical accounting estimates. It also requires management to exercise its judgement in the process of applying the Group’s accounting policies. The areas involving a higher degree of judgement or complexity, or areas where assumptions and estimates are significant to these financial statements are disclosed in note 3 2.3 Changes in accounting policies and disclosuresThe accounting policies are consistent with those used in the previous financial year except for where the Group has adopted certain new standards of, amendments and interpretations to IFRS.
2.4 Basis of consolidationThe consolidated financial statements comprise those of the Parent Company and each of its subsidiaries as at 31 December each year. Subsidiaries are all entities (including special purpose entities) over which the Group exercises control. Control is achieved when the Parent Company:• Haspowerovertheinvestee;• Isexposed,orhasrights,tovariablereturnsfromitsinvolvementwiththeinvestee;and• Hastheabilitytouseitspowertoaffecttheinvestee’sreturns.
The Parent Company reassesses whether or not it controls an investee if facts and circumstances indicate that there are changes to one or more of the three elements of control listed above.
When the Parent Company has less than a majority of the voting rights of an investee, it has power over the investee when the voting rights are sufficient to give it the practical ability to direct the relevant activities of the investee unilaterally. The Parent Company considers all relevant facts and circumstances in assessing whether or not the Parent company’s voting rights in an investee are to give it power including:
• The size of the Parent company’s holding of the voting rights relative to the size and dispersion of holdings of the other vote holders;• Potential voting rights held by the Parent Company, or other holders or other parties;• Rights arising from other contractual arrangements;• Any facts and circumstances that indicates that the Parent Company has, or does not have, the current ability to direct the relevant activities at the
time the decisions need to be made, including voting patterns at previous shareholders meetings.

28
Consolidation of a subsidiary begins when the Parent Company obtains control over the subsidiary and ceases when the Parent Company loses control of the subsidiary. Specifically, income and expenses of a subsidiary acquired or disposed of during the year are included in the consolidated statement of comprehensive income from the date the Parent Company gains control until the date when the Parent Company ceases to control the subsidiary.
Profit or loss and each component of other comprehensive income are attributed to the owners of the Parent Company and to the non-controlling interests. Total comprehensive income of subsidiary is attributed to the owners of the Parent Company and to the non-controlling interests even if this results in the non-controlling interests having a deficit balance.
Subsidiaries are fully consolidated from the date of acquisition, being the date on which the Group obtains control, and continue to be consolidated until the date when such control ceases. The financial statements of the subsidiaries are prepared for the same reporting period as the Parent Company, using consistent accounting policies. All intra-group balances, transactions, unrealised gains and losses resulting from intra-group transactions and dividends are eliminated in full.
A change in the ownership interest of a subsidiary, without a loss of control, is accounted for as an equity transaction. The carrying amounts of the Group’s interest and non-controlling interest are adjusted to reflect the changes in their relative interest in subsidiaries. Any difference between the amount by which the non-controlling interest are adjusted and the fair value of the consideration paid or received directly is equity and attributed to the owners of the Parent Company.
If the Group loses control over a subsidiary, a gain or loss is recognised in profit or loss and is calculated as the difference between:• The aggregate of the fair value of consideration received and the fair value of any retained interest; and• The carrying amount of assets (including goodwill), and liabilities of the subsidiary and any non-controlling interest.
All amounts previously recognised in other comprehensive income in relation to subsidiary are accounted for as if the Group has directly disposed of the assets and liabilities of the subsidiary (i.e. reclassified to profit or loss or transferred to another category of equity as specified / permitted by applicable IFRS). The fair value of any investment retained in the former subsidiary at the date when control is lost is regarded as the fair value on initial recognition for subsequent accounting under IAS 39, when applicable, the cost on initial recognition of an investment as associate or joint venture.
In the Parent company’s separate financial statements investments in subsidiaries are stated at cost, less provision for impairment in value of any individual investment. Dividend income is recognised in the profit or loss in the period in which entitlement is established.
2.4.1 AssociatesAssociates are all entities over which the Group has significant influence but not control, generally accompanying a shareholding of between 20% and 50% of the voting rights. In the consolidated financial statements, investments in associates are accounted for using the equity method of accounting and are initially recognised at cost. The Group’s investments in associates includes goodwill (net of any accumulated impairment loss) identified on acquisition. The Group’s share of its associates’ post-acquisition profits or losses and movements in reserves are recognised in the profit or loss. The cumulative post-acquisition movements are adjusted against the carrying amount of the investment.
When the Group’s share of losses in an associate equals or exceeds its interest in the associate, including any other unsecured receivables, the Group does not recognise further losses, unless it has incurred obligations or made payments on behalf of the associate. Unrealised gains on transactions between the Group and its associates are eliminated to the extent of the Group’s interest in the associates. Unrealised losses are also eliminated unless the transaction provides evidence of an impairment of the asset transferred.
In the Parent company’s separate financial statements investments in associates are stated at cost, less provision for impairment in value of any individual investment. Dividend income is recognised in the profit or loss in the period in which entitlement is established.
2.5 Financial assets – Initial recognition and subsequent measurementThe Group classifies its financial assets in the following categories: at fair value through profit or loss, available for sale, loans and advances and held-to-maturity. The classification depends on the purpose for which the financial assets were acquired. Management determines the classification of its financial assets at initial recognition.
2.5.1 Date of recognitionAll financial assets and liabilities are initially recognised on the trade date, i.e., the date that the Group becomes a party to the contractual provisions of the instrument. This includes “regular way trades”: purchases or sales of financial assets that require delivery of assets within the time frame generally established by regulation or convention in the market place.
29
2.5.2 Initial measurement of financial instrumentsThe classification of financial instruments at initial recognition depends on the purpose and the management’s intention for which the financial instruments were acquired and their characteristics. All financial instruments are measured initially at their fair value plus transaction costs, except in the case of financial assets and financial liabilities recorded at fair value through profit or loss.
2.5.3 Financial assets at fair value through profit or lossFinancial assets at fair value through profit or loss comprise financial securities held-for-trading which are acquired principally for the purpose of selling in the short-term and instruments so designated by management upon inception. Financial assets at fair value through profit or loss are initially recognised at fair value and transaction costs are expensed in the statement of comprehensive income. Unrealised gains or losses arising from changes in fair value are included in the statement of profit or loss and other comprehensive income in the period in which they arise. Derivatives are also categorised as held for trading unless they are designated as hedging instruments.
Management may only designate an instrument at fair value through profit or loss upon initial recognition when the following criteria are met, and designation is determined on an instrument by- instrument basis:• The designation eliminates or significantly reduces the inconsistent treatment that would otherwise arise from measuring the assets or liabilities or
recognising gains or losses on them on a different basis.• The assets and liabilities are part of a group of financial assets, financial liabilities or both, which are managed and their performance evaluated on a
fair value basis, in accordance with a documented risk management or investment strategy.• The financial instrument contains one or more embedded derivatives, which significantly modify the cash flows that would otherwise be required by
the contract.
2.5.4 Available-for-sale investmentsAvailable-for-sale investments include equity and debt securities. Equity investments classified as available-for-sale are those which are neither classified as held for trading nor designated at fair value through profit or loss. Debt securities in this category are intended to be held for an indefinite period of time and may be sold in response to needs for liquidity or in response to changes in the market conditions. The Group has not designated any loans or receivables as available-for-sale. After initial measurement, available-for-sale financial investments are subsequently measured at fair value.
Unrealised gains and losses are recognised directly in other comprehensive income in the cumulative changes in fair value. When the investment is disposed of, the cumulative gain or loss previously recognised in equity is recognised in the statement of profit or loss in other operating income. Where the Group holds more than one investment in the same security, they are deemed to be disposed of on a first–in first–out basis. Interest earned whilst holding available-for-sale financial investments is reported as interest income using the Effective Interest Rate (EIR). Dividends earned whilst holding available-for-sale financial investments are recognised in the statement of profit or loss and other comprehensive income as investment income when the right of the payment has been established. The losses arising from impairment of such investments are recognised in the statement of profit or loss and other comprehensive income in ‘Impairment losses on financial investments’ and removed from the cumulative changes in fair value.
2.5.5 Financial investments held-to-maturityHeld-to-maturity investments are non-derivative financial assets with fixed or determinable payments and fixed maturities that the Group’s management has the positive intention and ability to hold to maturity. In the case where the Group sells more than an insignificant amount of held to maturity assets, the entire category would be tainted and reclassified as available-for-sale.
Held-to-maturity investments are initially recognised at fair value plus transaction costs. These are subsequently carried at amortised cost using the effective interest method.
2.5.6 Loans and advances to customers and due from banksLoans and receivables to customers and due from banks are non-derivative financial assets with fixed or determinable repayments that are not quoted in an active market. They arise when the Group provides money directly to a debtor with no intention of trading the receivable. Loans and receivables are recognised when cash is advanced to customers and are carried at amortised cost using the effective interest method.
2.5.7 Fair value measurement principlesRegular purchases and sales of financial assets are recognised on the trade-date basis – the date on which the Group commits to purchase or sell the asset. Investments are initially recognised at fair value plus transaction costs for all financial assets not carried at fair value through profit or loss. Financial assets carried at fair value through profit or losses are initially recognised at fair value, and transaction costs are expensed in the statement of profit or loss. The fair value of financial instruments is based on their quoted market bid price at the reporting date without any deduction for transaction costs. If a quoted market price is not available, the fair value of the instrument is estimated based on discounted cash flow and other valuation techniques. The fair value of derivatives that are not exchange-traded is estimated at the amount that the bank would receive or pay to terminate the contract at the reporting date taking into account current market conditions and the current creditworthiness of the counter-parties.

30
2.5.8 Derecognition of financial assets and liabilitiesA financial asset (or, where applicable a part of a financial asset or part of a group of similar financial assets) is derecognised when:• The rights to receive cash flows from the asset have expired; or• The Group has transferred its rights to receive cash flows from the asset or has assumed an obligation to pay the received cash flows in full without
material delay to a third party under a ‘pass-through’ arrangement; and either:• The Group has transferred substantially all the risks and rewards of the asset, or • The Group has neither transferred nor retained substantially all the risks and rewards of the asset, but has transferred control of the asset.
A financial liability is derecognised when the obligation under the liability is discharged or cancelled or expires. Where an existing financial liability is replaced by another from the same lender on substantially different terms, or the terms of an existing liability are substantially modified, such an exchange or modification is treated as a derecognition of the original liability and the recognition of a new liability, and the difference in the respective carrying amounts is recognised in profit or loss.
2.5.9 Impairment of financial assetsThe Group assesses at each reporting date whether there is objective evidence that a financial asset or a group of financial assets is impaired. A financial asset or a group of financial assets is impaired and an impairment loss is incurred if, and only if, there is objective evidence of impairment as a result of one or more events that occurred after the initial recognition of the asset (a ‘loss event’) and that loss event (or events) has an impact on the estimated future cash flows of the financial asset or group of financial assets that can be reliably estimated. Objective evidence that a financial asset or group of assets is impaired includes observable data that comes to the attention of the Group about the following loss events as well as considering the guidelines issued by the Central Bank of Oman:
• Significant financial difficulty of the issuer or obligor;• A breach of contract, such as a default or delinquency in interest or principal payments; • The Group granting to the borrower, for economic or legal reasons relating to the borrower’s financial difficulty, a concession that the lender would
not otherwise consider; • It becoming probable that the borrower will enter bankruptcy or other financial reorganisation;• The disappearance of an active market for that financial asset because of financial difficulties; or • Observable data indicating that there is a measurable decrease in the estimated future cash flows from a group of financial assets since the initial
recognition of those assets, although the decrease cannot yet be identified with the individual financial assets in the group, including adverse changes in the payment status of borrowers in the Group, or national or local economic conditions that correlate with defaults on the assets in the Group.
The Group first assesses whether objective evidence of impairment exists individually for financial assets that are individually significant, and individually or collectively for financial assets that are not individually significant. If the Group determines that no objective evidence of impairment exists for an individually assessed financial asset, whether significant or not, it includes the asset in a group of financial assets with similar credit risk characteristics and collectively assesses them for impairment. Assets that are individually assessed for impairment and for which an impairment loss is or continues to be recognised are not included in a collective assessment of impairment.
(a) Assets carried at amortised costIf there is objective evidence that an impairment loss on loans and receivables or held-to-maturity investments carried at amortised cost has been incurred, the amount of the loss is measured as the difference between the asset’s carrying amount and the present value of estimated future cash flows (excluding future credit losses that have not been incurred) discounted at the financial asset’s original effective interest rate. The carrying amount of the asset is reduced through the use of an allowance account and the amount of the loss is recognised in the statement of profit or loss.
If a loan or held-to-maturity investment has a variable interest rate, the discount rate for measuring any impairment loss is the current effective interest rate determined under the contract.
The calculation of the present value of the estimated future cash flows of a collateralised financial asset reflects the cash flows that may result from foreclosure less costs for obtaining and selling the collateral, whether or not foreclosure is probable.
Future cash flows in a group of financial assets that are collectively evaluated for impairment are estimated on the basis of the contractual cash flows of the assets in the Group and historical loss experience for assets with credit risk characteristics similar to those in the Group. Historical loss experience is adjusted on the basis of current observable data to reflect the effects of current conditions that did not affect the period on which the historical loss experience is based and to remove the effects of conditions in the historical period that do not exist currently.
The methodology and assumptions used for estimating future cash flows are reviewed regularly by the Group to reduce any differences between loss estimates and actual loss experience. When a loan is uncollectible, it is written off against the related allowance for loan impairment. Such loans are written off after all the necessary procedures have been completed and the amount of the loss has been determined. If, in a subsequent period, the amount of the impairment loss decreases and the decrease can be related objectively to an event occurring after the impairment was recognised, the previously recognised impairment loss is reversed by adjusting the allowance account. The amount of the reversal is recognised in the statement of profit or loss.

31
(b) Available-for-sale financial investmentsFor available-for-sale financial investments, the Group assesses at each reporting date whether there is objective evidence that an investment or a group of investments is impaired. In the case of equity investments classified as available-for-sale, objective evidence would include a significant or prolonged decline in the fair value of the investment below its cost. The determination of what is ‘significant’ or ‘prolonged’ requires judgement. Where there is evidence of impairment, the cumulative loss – measured as the difference between the acquisition cost and the current fair value, less any impairment loss on that investment previously recognised in the statement of profit or loss – is removed from equity and recognised in the statement of profit or loss.
Impairment losses on equity investments are not reversed through the statement of comprehensive income; increases in their fair value after impairment are recognised directly in other comprehensive income.
In the case of debt instruments classified as available-for-sale, impairment is assessed based on the same criteria as financial assets carried at amortised cost. Interest continues to be accrued at the original effective interest rate on the reduced carrying amount of the asset and is recorded as part of ‘Interest income’. If, in a subsequent year, the fair value of a debt instrument increases and the increase can be objectively related to an event occurring after the impairment loss was recognised in the statement of profit or loss, the impairment loss is reversed through the statement of profit or loss.
(c) Renegotiated loansLoans that are either subject to collective impairment assessment or individually significant and whose terms have been renegotiated are no longer considered to be past due but are treated as new loans. In subsequent years, the asset is considered to be past due and disclosed only if renegotiated.
2.5.10 Islamic banking
Murabaha to the Purchase OrdererMurabaha to the purchase orderer represents the sale of goods at cost plus an agreed profit. Murabaha receivables consist of deferred sales transaction agreements. Promise made in the Murabaha to the purchase orderer is not obligatory upon the customer.
Ijarah Muntahia BittamleekIjarah Muntahia Bittamleek is a lease whereby the legal title of the leased asset passes to the lessee at the end of the Ijarah (lease term), provided that all Ijarah installments are settled.
MusharakaMusharaka contracts represents a partnership between the Window and a customer whereby each party contributes to the capital in equal or varying proportions to establish a new project or share in an existing one, and whereby each of the parties becomes an owner of the capital on a permanent or declining basis and shall have a share of profits or losses.
Diminishing MusharakaDiminishing Musharaka is a form of partnership where two or more persons jointly own a tangible asset in an agreed proportion and one of the partners undertakes to buy the ownership rights of other partner by way of periodical payments till the title of such tangible assets completely transferred to the purchasing partner.
MudarabaA contract between two parties, whereby one party provides the funds (Rab Al Mal) and the other party (the Mudarib) invest the funds in an asset, project or particular activity and any generated profits are distributed between the parties according to the profit shares that were pre-agreed upon in the contract. The Mudarib is responsible for losses caused by his misconduct, negligence or violation of the terms and conditions of the Mudarib; otherwise, losses are borne by Rab Al Mal. The Mudaraba capital of Mudaraba is paid to the Mudarib or placed under his disposition.
WakalahA contract between two parties whereby one party (the principal: Muwakkil) appoints the other party (the agent: Wakil) to invest certain funds according to terms and conditions of the Wakalah for a fixed fee in addition to any profit exceeding the expected profits as an incentive for the Wakil for the good performance. Any losses as a result of the misconduct or negligence or violation of the terms and conditions of the Wakalah are borne by the Wakil; otherwise, they are borne by the principal.
Qard HassanA non-profit bearing loan enables the borrower to use the borrowed amounts for a specific period of time, at the end of which the same borrowed amounts would be repaid free of any charges of profits.
2.6 Segment reportingThe Group’s segmental reporting is based on the following operating segment:Investments for the Parent Company and retail banking, corporate banking, investment banking and support and unallocated functions for the banking subsidiary. The segment information is set out in note 27.

32
2.7 Foreign currency translation
2.7.1 Functional and presentation currencyItems included in the financial statements of each of the Group’s entities are measured using Rial Omani which is the currency of the primary economic environment in which the entity operates (the functional currency). These financial statements are presented in Rial Omani, which is the Group’s functional and presentation currency.
2.7.2 Transactions and balancesEach entity in the Group determines its own functional currency and items included in the financial statements of each entity are measured using that functional currency. Transactions in foreign currencies are initially recorded in the functional currency rate ruling at the date of the transaction. Monetary assets and liabilities denominated in foreign currencies are retranslated at the functional currency rate of exchange ruling at the reporting date. All differences are taken to the profit or loss. Non-monetary items that are measured in terms of historical cost in a foreign currency are translated using the exchange rates as at the dates of the initial transactions. Non-monetary items measured at fair value in a foreign currency are translated using the exchange rates at the date when the fair value was determined.
As at the reporting date, the assets and liabilities of the Group entities are translated into the functional currency of the consolidated financial statements (the Rial Omani) at the rate of exchange ruling at the reporting date and its profit or loss is translated at the weighted average exchange rates for the year. The exchange differences arising on the translation are taken directly to a foreign currency translation reserve in other comprehensive income.
On disposal of foreign operations, the deferred cumulative amount recognised in equity relating to that particular foreign operation is recognised in the profit or loss.
2.8 Investment propertiesInvestment properties comprise land and buildings that is held for long-term rental yields and not occupied by the Group. Investment properties are carried at cost less accumulated depreciation, less impairment, if any. Any required impairment charge is recorded in the statement of profit or loss. Depreciation on the assets except land is calculated using the straight-line basis to allocate their cost over the estimated useful lives, as follows:
Freehold property - 25 years
2.9 Property and equipmentProperty and equipment are stated at historical cost, less accumulated depreciation and impairment losses. Historical cost includes expenditure that is directly attributable to the acquisition of the items.
Subsequent costs are included in the asset’s carrying amount or recognised as a separate asset, as appropriate, only when it is probable that future economic benefits associated with the item will flow to the Group and the cost of the item can be measured reliably. All other repairs and maintenance are charged to the profit or loss during the financial period in which they are incurred.
Land is not depreciated. Depreciation of other assets is calculated using the straight-line method to allocate their cost to their residual values over their estimated useful lives, as follows:Freehold building 25 years Leasehold buildings lower of 25 years and unexpired lease periodFurniture, fixtures and equipment up to 5 yearsMotor vehicles up to 5 years
The assets’ residual values and useful lives are reviewed, and adjusted if appropriate, at each reporting date. An asset’s carrying amount is written down immediately to its recoverable amount if the asset’s carrying amount is greater than its estimated recoverable amount.
Freehold land and land with factory buildings are considered as a separate class of assets by the Group’s associate companies. These are revalued on a regular basis.
Gains and losses on disposals are determined by comparing proceeds with carrying amount. These are included in the statements of profit or loss.
Projects work-in-progressProjects work-in-progress is recognised at cost and not depreciated. The carrying values of projects work-in-progress are reviewed for impairment when events or changes in circumstances indicate the carrying value may not be recoverable. If any such indication exists and where the carrying values exceed the estimated recoverable amount, the assets are written down to their recoverable amount, being the higher of their fair value less costs to sell and their value in use.

33
2.10 Impairment of non-financial assetsAssets that are subject to amortisation are reviewed for impairment whenever events or changes in circumstances indicate that the carrying amount may not be recoverable. An impairment loss is recognised for the amount by which the asset’s carrying amount exceeds its recoverable amount. The recoverable amount is the higher of an asset’s fair value less costs to sell and value in use. For the purpose of assessing impairment, assets are grouped at the lowest levels for which there are separately identifiable cash flows (cash-generating units). Non-financial assets other than goodwill that suffered impairment are reviewed for possible reversal of the impairment at each reporting date.
2.11 Cash and cash equivalentsCash and cash equivalents include cash in hand, deposits held at call with banks, other short-term highly liquid investments with original maturities up to three months or less and bank overdrafts. Bank overdrafts are shown within borrowings in the statement of financial position.
2.12 BorrowingsBorrowings are initially recognised at fair value, net of transaction costs incurred. Borrowings are subsequently stated at amortised cost; any difference between the proceeds (net of transaction costs) and the redemption value is recognised as interest expense in the statements of profit or loss over the period of the borrowings using the effective interest method.
Fees paid on the establishment of loan facilities are recognised as transaction costs of the loan to the extent that it is probable that some or all of the facility will be drawn down. In this case, the fee is deferred until the draw-down occurs. To the extent there is no evidence that it is probable that some or all of the facility will be drawn down, the fee is capitalised as a pre-payment for liquidity services and amortised over the period of the facility to which it relates.2.13 Other liabilitiesOther liabilities are stated at amortised cost using the effective interest method.
2.14 TaxationIncome tax on the profit or loss for the year comprises current and deferred tax. Income tax is recognised in the profit or loss except to the extent that it relates to items recognised directly to equity, in which case it is recognised in other comprehensive income.
Current tax is the expected tax payable on the taxable income for the year, using tax rates enacted or substantially enacted at the reporting date, and any adjustment to tax payable in respect of previous years.
Deferred tax is calculated using the liability method, providing for temporary differences between the carrying amounts of assets and liabilities for financial reporting purposes and the amounts used for taxation purposes. The amount of deferred tax provided is based on the expected manner of realisation or settlement of the carrying amount of assets and liabilities, using tax rates enacted or substantially enacted at the reporting date.
A deferred tax asset is recognised only to the extent that it is probable that future taxable profits will be available against which the asset can be utilised. Deferred tax assets are reduced to the extent that it is no longer probable that the related tax benefit will be realised.
2.15 Employees’ end of service benefitsEnd of service benefits are accrued in accordance with the terms of employment of the Group’s employees at the reporting date, having regard to the requirements of the Oman Labour Law 2003, as amended. Employee entitlements to annual leave and leave passage are recognised when they accrue to employees and an accrual is made for the estimated liability arising as a result of services rendered by employees up to the reporting date.
Contributions to the Omani Government Social Security Scheme under Royal Decree No. 72/91 for Omani employees in accordance with the Omani Social Insurance Law 1991 are recognised as an expense in the statements of profit or loss as incurred.
2.16 ProvisionsProvisions are recognised when the Group has a present legal or constructive obligation as a result of past events; it is more likely than not that an outflow of resources will be required to settle the obligation; and the amount has been reliably estimated. If the effect is material, provisions are determined by discounting the expected future cash flows at a rate that reflects current market assessments of the time value of money and, where appropriate, the risks specific to the liability.
Where there are a number of similar obligations, the likelihood that an outflow will be required in settlement is determined by considering the class of obligations as a whole. A provision is recognised even if the likelihood of an outflow with respect to any one item included in the same class of obligations may be small.

34
2.17 Revenue recognition
Interest income and expense Interest income and expense are recognised in the profit or loss for all instruments measured at amortised cost using the effective interest method, unless collectability is in doubt. The effective interest method is a method of calculating the amortised cost of a financial asset or a financial liability and of allocating the interest income or interest expense over the relevant period. The effective interest rate is the rate that exactly discounts estimated future cash payments or receipts through the expected life of the financial instrument or, when appropriate, a shorter period to the net carrying amount of the financial asset or financial liability. When calculating the effective interest rate, the Group estimates cash flows considering all contractual terms of the financial instrument but does not consider future credit losses. The calculation includes all fees and points paid or received between parties to the contract that are an integral part of the effective interest rate, transaction costs and all other premiums or discounts.Fee and commission incomeFees and commissions are generally recognised on an accrual basis when the service has been provided. Loan commitment fees for loans that are likely to be drawn down are deferred (together with related direct costs) and recognised as an adjustment to the effective interest rate on the loan. Loan syndication fees are recognised as revenue when the syndication has been completed and the Group retained no part of the loan package for itself or retained a part at the same effective interest rate for the other participants. Portfolio and other management advisory and service fees are recognised based on the applicable service contracts, usually on a time-apportionment basis. Asset management fees related to investment funds are recognised pro-rata over the period the service is provided. The same revenue recognition criteria are applied for custody services that are continuously provided over an extended period of time.
Dividend incomeDividend income is recognised when the right to receive payment is established.
2.18 Fiduciary assets Assets held in trust or in a fiduciary capacity are not treated as assets of the Group and accordingly are shown as off-balance sheet items in these financial statements.
2.19 Derivative financial instruments Derivatives are initially recognised at fair value on the date on which a derivative contract is entered into and are subsequently re-measured at their fair value. Fair value adjustments are recorded in the profit or loss. Fair values are obtained from quoted market prices in active markets, including recent market transactions. All derivatives are carried as assets when fair value is positive and as liabilities when fair value is negative.
2.20 Trade and settlement date accountingAll regular way purchases and sales of financial assets are recognised on the trade date, i.e., the date that the entity commits to purchase or sell the asset. Regular way purchases or sales are purchases or sales of financial assets that require delivery of assets within the time frame generally established by regulation or convention in the market place.
2.21 Offsetting Financial assets and financial liabilities are only offset and the net amount reported in the balance sheet when there is a legally enforceable right to set off the recognised amounts and the Group intends to either settle on a net basis, or to realise the asset and settle the liability simultaneously.
2.22 Dividends Dividend distribution to the Parent company’s shareholders is recognised as a liability in these financial statements in the period in which the dividends are approved by the Parent company’s shareholders.
2.23 Directors’ remuneration Directors’ remuneration is calculated based on the Group profit for the year (before Directors’ remuneration), applying the overall limits set out by the current regulations governing the determination of Directors’ remuneration including sitting fees.
2.24 Earnings per shareThe Group and the Parent Company presents basic earnings per share (EPS) data for its ordinary shares. Basic EPS is calculated by dividing the profit or loss attributable to ordinary shareholders of the Group and the Parent Company by the weighted average number of ordinary shares outstanding during the period.
3. CRITICAL ACCOUNTING ESTIMATES AND JUDGMENTS IN APPLYING ACCOUNTING POLICIESThe preparation of the consolidated financial statements, as per IFRS, requires management to make estimates and assumptions that affect the reported amount of assets and liabilities at the reporting date and the resultant provisions and changes in fair value for the year. Such estimates are necessarily based on assumptions about several factors involving varying, and possibly significant, degrees of judgment and uncertainty and actual results may differ from management’s estimates resulting in future changes in estimated assets and liabilities.

35
3.1 Going concernThe Group’s management has made an assessment of the Group’s ability to continue as a going concern and is satisfied that the Group has the resources to continue in business for the foreseeable future. Furthermore, the management is not aware of any material uncertainties that may cast significant doubt upon the Group’s ability to continue as a going concern. Therefore, the financial statements continue to be prepared on the going concern basis.
3.2 Impairment losses on loans and advancesThe Group reviews its loan portfolios to assess impairment at least on a quarterly basis. In determining whether an impairment loss should be recorded in the statement of profit or loss, the Group makes judgments as to whether there is any observable data indicating that there is a measurable decrease in the estimated future cash flows from a portfolio of loans before the decrease can be identified with an individual loan in that portfolio. This evidence may include observable data indicating that there has been an adverse change in the payment status of borrowers in a group, or national or local economic conditions that correlate with defaults on assets in the group. Management uses estimates based on historical loss experience for assets with credit risk characteristics and objective evidence of impairment similar to those in the portfolio when scheduling its future cash flows and in line with the Central Bank of Oman guidelines in this respect. The methodology and assumptions used for estimating both the amount and timing of future cash flows are reviewed regularly to reduce any differences between loss estimates and actual loss experience.
3.3 Held-to-maturity investmentsThe Group follows the guidance of IAS 39 on classifying non-derivative financial assets with fixed or determinable payments and fixed maturity as held-to-maturity. This classification requires significant judgment. In making this judgment, the Group evaluates its intention and ability to hold such investments to maturity. If the Group fails to keep these investments to maturity other than for the specific circumstances – for example, selling an insignificant amount close to maturity – it will be required to reclassify the entire class as available-for-sale. In such situations, the investments would therefore be measured at fair value and not at amortised cost.
3.4 Fair value of financial instrumentsWhere the fair values of financial assets and financial liabilities recorded on the statement of financial position cannot be derived from active markets, they are determined using certain valuation techniques, derived from observable market data where possible. Where observable market data are not available, judgment is used to establish fair values.
3.5 Classification of investmentsManagement decides on acquisition of an investment whether it should be classified as held for trading, carried at fair value through profit or loss, or available-for-sale or held-to-maturity investments.
3.6 Impairment of available-for-sale investmentsThe Group reviews its debt securities classified as available-for-sale investments at each reporting date to assess whether they are impaired. This requires similar judgment as applied to the individual assessment of loans and advances.
The Group also records impairment charges on available-for-sale equity investments when there has been a significant or prolonged decline in the fair value below their cost. The determination of what is ‘significant’ or ‘prolonged’ requires judgment.
In making this judgment, the Group and the Parent Company evaluates, among other factors, historical share price movements and duration and extent to which the fair value of an investment is less than its cost.
3.7 Useful lives of property and equipment and investment propertiesDepreciation is charged so as to write off the cost of assets over their estimated useful lives. The calculation of useful lives is based on management’s assessment of various factors such as the operating cycles, the maintenance programs, and normal wear and tear using its best estimates.
3.8 TaxesThe Group and the Parent Company establishes provisions, based on reasonable estimates, for possible consequences of finalisation of tax assessments. The amount of such provisions is based on factors such as experience of previous tax assessments and interpretations of tax regulations by the Group and the responsible tax authority.
4. ADOPTION OF NEW AND REVISED INTERNATIONAL FINANCIAL REPORTING STANDARDS (IFRS) For the year ended 31 December 2014, the Group has adopted all the new and revised standards and interpretations issued by the International Accounting Standards Board (IASB) and the International Financial Reporting Interpretations Committee (IFRIC) of the IASB that are relevant to its operations and effective for the period beginning on 1 January 2014.

36
4.1 Standards and Interpretations adopted with no effect on the financial statementsThe following new and revised Standards and Interpretations have been adopted in these consolidated financial statements. Their adoption has not had any significant impact on the amounts reported in these financial statements but may affect the accounting for future transactions or arrangements.
The following new and revised Standards and Interpretations have been adopted in these financial statements. Their adoption has not had any significant impact on the amounts reported in these financial statements but may affect the accounting for future transactions or arrangements.
Amendments to IFRS 10, IFRS 12 and IAS 27: Investment Entities
The amendments to IFRS 10 define an investment entity and require a reporting entity that meets the definition of an investment entity not to consolidate its subsidiaries but instead to measure its subsidiaries at fair value through profit or loss in its consolidated and separate financial statements. Consequential amendments have been made to IFRS 12 and IAS 27 to introduce new disclosure requirements for investment entities.
Amendments to IAS 32: Offsetting Financial Assets and Financial Liabilities
The amendments to IAS 32 clarify the requirements relating to the offset of financial assets and financial liabilities. Specifically, the amendments clarify the meaning of ‘currently has a legally enforceable right of set-off’ and ‘simultaneous realisation and settlement’.
Amendments to IAS 36: Recoverable Amount Disclosures for Non-Financial Assets
The amendment to IAS 36 remove the requirement to disclose the recoverable amount of a cash-generating unit (CGU) to which goodwill or other intangible assets with indefinite useful lives had been allocated when there has been no impairment or reversal of impairment of the related CGU. Furthermore, the amendments introduce additional disclosure requirements applicable to when the recoverable amount of an asset or a CGU is measured at fair value less cost of disposal.
Amendments to IAS 39: Novation of Derivatives and Continuation of Hedge Accounting
The amendments to IAS 39 provide relief from the requirement to discontinue hedge accounting when a derivative designated as a hedging instrument is novated under certain circumstances. The amendments also clarify that any change to the fair value of the derivative designated as hedging instrument arising from the novation should be included in the assessment and measurement of hedge effectiveness.
IFRIC 21: Levies IFRIC 21 addresses the issue as to when to recognise a liability to pay a levy imposed by a government. The Interpretation provides guidance on how different levy arrangements should be accounted for, in particular, it clarifies neither economic compulsion nor the going concern basis financial statements preparation implies that an entity has a present obligation to pay a levy that will be triggered by operating in a future period.
4.2 Standards and Interpretations in issue not yet effectiveAt the date of authorisation of these consolidated financial statements, the following new and revised Standards and Interpretations were in issue but not yet effective:
Effective for annual periods beginning on or after
New IFRS and relevant amendmentsIFRS 9: Financial Instruments 1 January 2018IFRS 15: Revenue from Contracts with Customers 1 January 2017Amendment to IFRS 11: Accounting for Acquisition of Interest in Joint Operations 1 January 2016Amendment to IAS 16 and IAS 38: Clarification of Acceptable Methods of Depreciation and Amortisation 1 January 2016Amendment to IAS 16 and IAS 41: Agriculture – Bearer Plants. 1 January 2016Amendment to IAS 19: Employee Benefit Plans – Employee Contributions 1 July 2014Amendments to IAS 27: Permits use of equity method for investments in subsidiaries, associates and joint ventures when an entity prepares its separate financial statements. 1 January 2016Amendments to IFRS 10 and IAS 28: Specifies the accounting treatment for gain or loss on sale or contribution of assets between investor and joint ventures based on whether or not the sale or contribution results in a business.
1 January 2016Annual Improvements to IFRSs 2010 – 2012 cycle 1 July 2014Annual Improvements to IFRSs 2011 – 2013 cycle 1 July 2014Annual Improvements to IFRSs 2012 – 2014 cycle 1 January 2016
The Group and the Parent Company anticipate that the adoption of these Standards and Interpretations in future periods will have no material impact on the financial statements of the Group’s in the period of initial application. The adoption of these standards and interpretations has not resulted in changes to the Group’s accounting policies and has not affected the amounts reported for the current or prior periods except for IFRS 9: Financial Instruments 9. IFRS 9 introduces new requirements for the classification and measurement of financial instruments. The management is currently assessing this standard which may have an impact on the financial statements of the Group as described above.

37
5. FINANCIAL RISK MANAGEMENT POLICIES5.1 Financial risk managementThe Group’s activities expose it to a variety of financial risks and those activities involve the evaluation, analysis, acceptance and management of risk or combination of risks. As taking risk is core to the financial business and operational risks are an inevitable consequence of any business, the Group’s aim is to achieve an appropriate balance between risk and return while minimising the potential adverse effects on the Group’s financial performance of the respective Group companies.
The Board of Directors defines risk limits and sets suitable policies in this regard for management of credit risk, liquidity risk as well as market risk in both the trading and the banking book of the respective Group Company. Risk Management is carried out by the Risk Management team in accordance with documented policies approved by the Board of Directors of the respective Group Company.
The principal types of risks at the Group and Parent Company are credit risk, liquidity risk, market risk (market price risk, interest rate risk and currency risk) and operational risk.
5.2 Credit riskCredit risk is the risk that one party to a financial instrument will fail to discharge an obligation and cause the other party to incur a financial loss. Credit exposures arise principally from lending activities at the banking subsidiary and investment activities and other assets in the Group’s asset portfolio. There is also credit risk in off-balance sheet financial instruments, such as loan commitments and financial guarantees given by the banking subsidiary.
5.2.1 Credit risk managementThe Group attempts to control credit risk by monitoring credit exposures, limiting transactions with specific counterparties, and continually assessing the creditworthiness of counterparties. Concentrations of credit risk arise when a number of counterparties are engaged in similar business activities, or have similar economic features that would cause their ability to meet contractual obligations to be similarly affected by changes in economic, political or other conditions. Concentrations of credit risk indicate the relative sensitivity of the Group’s performance to developments affecting a particular industry or geographic location. The details of concentrations of credit risk based on counterparties by industry are disclosed in Note 9(d) and the geographical concentration is disclosed in Note 33.
5.2.2 Risk mitigation policiesThe Group manages, limits and controls concentrations of credit risk − in particular, to individual counterparties and Groups, and to industries and countries.
The banking subsidiary structures the levels of credit risk it undertakes by placing limits on the amount of risk accepted in relation to one borrower, or Groups of borrowers, and to geographical and industry segments. Such risks are monitored and reviewed periodically by the Management Credit Committee, Audit & Risk Management committee of the Board of Directors and the Executive Committee of the Board of Directors of the banking subsidiary.
The exposure to any one borrower including banks and brokers is further restricted by sub-limits covering on and off-balance sheet exposures. Exposure to credit risk is also managed through regular analysis of the ability of borrowers and potential borrowers to meet interest and capital repayment obligations and by changing these lending limits where appropriate.
Some other specific control and mitigation measures are outlined below.
(a) Collateral The banking subsidiary employs a range of policies and practices to mitigate credit risk. The most traditional of these is the taking of security for funds advanced, which is common practice. The bank implements guidelines on the acceptability of specific classes of collateral or credit risk mitigation. The principal collateral types for loans and advances are:charges over business assets such as premises, inventory and accounts receivable lien on fixed deposits cash margins mortgages over residential and commercial properties pledge of marketable shares and securities
Longer-term finance and lending to corporate entities are generally secured. The housing loans are secured by mortgage over the residential property. Credit cards and similar revolving credit facilities are unsecured. Additionally, in order to minimise the credit loss the bank seeks additional collateral from the counterparty as soon as impairment indicators are noticed for the relevant individual loans and advances.
(b) Assessment of the financial capabilities of the borrowersThe borrowers with balances above the limit specified are subject to the review of their audited financial statements. The banking subsidiary assesses the financial performance of the borrowers by reviewing key performance ratios, including solvency and liquidity ratios. The annual reviews are performed by the relationship managers and are also reviewed by the Risk Management team.

38
(c) Credit-related commitmentsThe primary purpose of these instruments is to ensure that funds are available to a customer as required. Guarantees and standby letters of credit carry the same credit risk as loans. Documentary and commercial letters of credit – which are written undertakings by the banking subsidiary on behalf of a customer authorising a third party to draw drafts on the banking subsidiary up to a stipulated amount under specific terms and conditions – are collateralised by the underlying shipments of goods to which they relate and therefore carry less risk than a direct loan.
An analysis of the loans and advances, other than government soft loans, for which collaterals or other credit enhancements are held is as follows:
Performing loans (neither past due
nor impaired)Loans past due
but not impairedNon performing
loans Gross loans
RO’000 RO’000 RO’000 RO’000
Loans and advances with available collateral 278,060 22,432 11,502 328,385
Loans and advances with available guarantees 96,787 - 8,567 96,787
At 31 December 2014 374,847 22,432 20,069 425,172
At 31 December 2013 282,213 13,462 30,346 326,021
5.2.3 Impairment and provisioning policyImpairment provisions are recognised for financial reporting purposes only for losses that have been incurred at the reporting date based on objective evidence of impairment. Objective evidence that a financial asset or group of assets is impaired includes observable data that comes to the attention of the banking subsidiary about the loss events set out in Note 2.5.9 as well as considering the guidelines issued by the Central Bank of Oman.
The banking subsidiary’s credit policy requires the review of individual financial assets on a quarterly basis or earlier when individual circumstances require. Impairment allowances on individually assessed accounts are determined by an evaluation of the incurred loss at the reporting date on a case-by-case basis, and are applied to all individually significant accounts. The assessment normally encompasses collateral held (including re-confirmation of its enforceability) and the anticipated receipts for that individual account.
Collectively assessed impairment allowances are provided for: (i) portfolios of homogenous assets that are individually not significant; and (ii) losses that have been incurred but have not yet been identified, by using the available historical experience and experienced judgment.
5.2.4 Maximum exposure to credit risk before collateral held or other credit enhancements
Group
2014RO’ 000
2013RO’ 000
Items on the statement of financial position
Certificates of deposit (note 6) 200,000 100,000
Deposit from banks - Money market placement 96,258 35,150
Loans and advances
Corporate loans 748,659 677,178
Personal loans 528,667 428,427
Other assets 43,350 32,850
Investment in securities
Government Development Bonds 50,402 32,073
1,667,336 1,305,678
Off - balance sheet items
Financial guarantees 97,224 89,681
Undrawn loan commitments 642 770
97,866 90,451
The above table represents the worst case scenario of credit risk exposure to the Group at 31 December 2014 and 31 December 2013 without taking into account the collateral held or other credit enhancements. Management is confident that the Group has suitable policies to measure and control the credit risk. In addition, credit risk is mitigated through collaterals in the form of mortgages and guarantees wherever required.

39
(a) 76.7% (2013 - 100%) of the inter-bank money market placements are with banks rated investment grade and above based on the ratings assigned by External Credit Rating Agencies.
(b) Loans and advances represent 67% (2013 – 72%) of the total on-balance sheet items. Of the total loans and advances 95% (2013 - 96%) are neither past due nor impaired.
(c) The impaired loans have decreased from 3.3% at 31 December 2013 to 2.7% at 31 December 2014. The impaired personal loans constitute 0.9% of the total loans at 31 December 2014 compared to 0.9% at 31 December 2013.
(d) Certificates of deposit which represent 11% (2013 – 7%) of the total on-balance sheet items are placed with the Central Bank of Oman.
5.2.5 Loans and advances to customers and due from banks(a) Loans and advances to customers and due from banks held by the Group are summarised as follows:
2014 2013
Loans and advances to
customers(RO’000)
Due from banks
(RO’000)Total
(RO’000)
Loans and advances to
customers(RO’000)
Due from banks
(RO’000)Total
(RO’000)
Neither past due nor impaired 1,211,603 95,758 1,307,361 1,048,174 35,150 1,083,324
Special mentioned loans 5,106 - 5,106 7,357 - 7,357
Past due but not impaired 22,432 - 22,432 13,462 - 13,462
Impaired 38,185 - 38,185 36,613 - 36,613
Gross loans and advances 1,277,326 95,758 1,373,084 1,105,606 35,150 1,140,756
Less: allowance for loanimpairment and contractual interest not recognised (refer to note (a) below)
(36,990) - (36,990) (34,315) - (34,315)
Net loans and advances 1,240,336 95,758 1,336,094 1,071,291 35,150 1,106,441
(b) The total impairment provision for loans and advances is RO 36,904,000 (2013 - RO 34,315,000) of which RO 19,485,000 (2013 - RO 19,674,000) represents the individually impaired loans and the remaining amount of RO 17,419,000 (2013 – RO 13,369,000) represents the collective impairment provision made on a portfolio basis.
(c) The break-up of the loans and advances to customers in respect of the risk ratings adopted by the banking subsidiary are:
2014 2013
Retail loans
(RO’000)
Corporateloans
(RO’000)Total
(RO’000)
Retail loans
(RO’000)
Corporateloans
(RO’000)Total
(RO’000)
Standard loans 516,296 717,739 1,234,035 417,334 644,302 1,061,636
Special mention loans 1,015 4,091 5,106 1,077 6,280 7,357
Substandard loans 4,026 576 4,602 1,110 5,155 6,265
Doubtful loans 1,256 5,423 6,679 1,484 1,533 3,017
Loss 6,073 20,831 26,904 7,422 19,909 27,331
528,666 748,660 1,277,326 428,427 677,179 1,105,606
(d) Age analysis of the Group’s loans and advances past due but not impaired
2014(RO’000)
2013(RO’000)
Past due up to 30 days 3,348 1,520
Past due 30-60 days 9,941 7,181
Past due 60-89 days 9,143 4,761
Total 22,432 13,462
Fair value of related collateral 27,831 5,535

40
(e) Loans and advances individually impaired
2014(RO’000)
2013(RO’000)
Individually impaired loans 38,185 36,613
Fair value of related collateral available 19,326 15,561
5.2.6 Loans and advances renegotiatedThese arrangements include extended payment arrangements, deferral of payments and modification of interest rates. Following restructuring, a previously past due loan account is reclassified as a normal loan and managed with other similar loans which are neither past due nor impaired. The restructuring arrangements are based on the criteria and indicators which in the judgement of the management will indicate that the payment will most likely continue.The Group’s total restructured loans at 31 December 2014 amounted to RO 9,167,000 (2013 – RO 6,060,000).
5.2.7 Debt securitiesThe Group’s investments in debt securities are mainly in Government Development Bonds or Certificates of Deposit denominated in Rial Omani issued mainly by the Government of Oman. The Group also invests in debt securities issued by other banks based on their individual external credit rating. These investments are made to deploy the surplus liquid funds with maximum return.
5.2.8 Repossessed collateralRepossessed properties are sold as soon as practicable with the proceeds used to reduce the outstanding balance of the debt. Repossessed assets are classified as other assets in the statement of financial position. The value of assets obtained by the Group by taking possession held as collateral as security at 31 December 2014 is RO 310,000 (2013 – RO 310,000).
5.3 Market riskThe Group and the Parent Company take on exposures to market risk which is the risk that the fair value or the future cash flows of the financial assets carried at fair value will fluctuate because of changes in market prices. Market risks arise from the open positions in interest rate, currency and equity products, all of which are exposed to changes in interest rates, credit spreads, equity prices and foreign exchange rates for the banking subsidiary.
The market risks on investments listed in the securities markets for the Parent Company are monitored by the Board and Management committees. The Management committee monitor the risks, allocations and returns from local and foreign investments through regular meetings. The Management of the Parent Company has proper risk management policies in place to ensure that interest risk, liquidity risk and foreign exchange risk are mitigated considering the macroeconomic indicators affecting the investment activities.
5.3.1 Market price risk measurement techniques The Group and Parent Company manages its market risk in the trading book using various techniques such as position limits, stop loss limits and regular monitoring of risk statistical data. The impact of 10% change in the market price of the quoted equities and funds which are part of the financial assets at fair value through profit or loss at 31 December 2014 is 2.8% of the Group’s total income (2013 – 3.19%).The Parent Company is exposed to equity securities price risk because of investments held and classified as investments at fair value through profit or loss and available for sale financial assets. The Parent Company manages its market risk from its investing activities by diversification based on extensive research on equity or fund positions. Market risks are measured against management targets, past trends in world indices and market specific indices, before taking positions and subsequently monitored regularly.
The impact of 10% change in the market price of the quoted equities which are classified as financial assets at fair value through profit or loss at 31 December 2014 is 13.2% of the Parent company’s total income (2013 – 6.11%).
5.3.2 Interest rate riskInterest rate risk is the risk that the value of a financial instrument carried at fair value will fluctuate due to changes in the market interest rates. The Group is exposed to interest rate risk as a result of mismatches or gaps in the amount of interest based assets and liabilities that mature or re-price in a given period. The Group manages this risk by matching/re-pricing of assets and liabilities. The Group is not excessively exposed to interest rate risk as its assets and liabilities are re-priced frequently. The banking subsidiary’s Assets and Liabilities Committee (ALCO) monitors and manages the interest rate risk with the objective of limiting the potential adverse effects on the banking subsidiary’s profitability. The table in Note 34 summarises the Group’s exposure to the interest rate risks. It includes the Group’s financial instruments at the carrying amount, categorised by the earlier of the contractual re-pricing and maturity dates.
For managing its interest rate risk in the banking book the Group stipulates limits on open interest rate sensitive gaps for maturities up to 1 year and also periodically calculates Earnings at Risk (EaR) impact on its Net Interest Income (NII) from 100 bps change in interest rates on open interest rate gaps for maturities up to 1 year. The EaR gap limit is stipulated as a certain percentage of the NII of the Group for the previous year. The EaR at 31 December 2014 is 2.26% (2013 – 1.57%).

41
The Parent company’s interest rate risk is limited since all of its financial assets are non-interest bearing and all of its borrowings are due within 6 months of the reporting date and are bearing a fixed interest rate for the period. The table in Note 34 summarises the Parent company’s exposure to the interest rate risk.
5.3.3 Currency riskCurrency risk arises where the value of a financial instrument changes due to changes in foreign exchange rates. In order to manage currency risk exposure the Group enters into ready, spot and forward transactions in the inter-bank market as per documented policies approved by the Board of Directors of the respective Group Company.
The Group’s foreign exchange exposure comprises of forward contracts, foreign currencies cash in hand, balances with banks abroad, foreign placements and other assets and liabilities denominated in foreign currency. The individual Group company’s management manages the risk by monitoring net open position in line with limits set by the management and entering into forward contracts based on the underlying commercial transactions with the customers. Additionally, appropriate segregation of duties exist between the front and back office functions while compliance with the net open position is independently monitored on an ongoing basis by the management and in the case of the banking subsidiary, the Assets and Liabilities Committee (ALCO).
Oman operates with a fixed exchange rate and the Omani Rial is pegged to the US Dollar at US$ 2.6008 per Omani Rial. Accordingly, currency risk arises on assets not denominated in Rial Omani or currencies linked to the US Dollar.
The Parent company’s exposure to assets denominated in foreign currencies (excluding US Dollars which the Omani Rial is pegged to) was 6.47% (2013 - 9.95%) of the total assets at the reporting date. Management regularly monitors the currency risk by reviewing the positions and within the overall context of its investment guidelines.
The net open position of the Group and Parent Company at the year-end is set out below:
Foreign currency exposures
Group Parent Company
2014(RO’000)
2013(RO’000)
2014(RO’000)
2013(RO’000)
Assets denominated in US Dollars(included assets denominated in GCC currency pegged with US Dollars) 9,486 5,169 3,879 3,883
Percentage of total assets 0.35% 3.64% 4.77%
Assets denominated in other foreign currencies 7,848 8,876 6,885 8,101
Percentage of total assets 0.42% 0.59% 6.47% 9.95%
5.4 Liquidity risk
Liquidity risk is the risk that the Group will encounter difficulty in raising funds to meet commitments associated with financial instruments. Liquidity risk may result from an inability to sell a financial asset quickly at close to its fair value. It includes the risk of being unable to fund assets at appropriate maturities and rates and the risk of being unable to liquidate an asset at a reasonable price and in an appropriate time frame.The Group’s funding activities are based on a range of instruments including deposits, other liabilities and assigned capital. Consequently, funding flexibility is increased and dependence on any one source of funds is reduced. The Group maintains liquidity by continually assessing, identifying and monitoring changes in funding needs required to meet strategic goals set in terms of the overall strategy. In addition the Group holds certain liquid assets as part of its liquidity risk management strategy.
The Group and the Parent Company hold investment securities listed on the securities markets and other quoted investments. Those investments are liquid in nature and can be sold in response to need for liquidity. As at 31 December 2014, the quoted investments for the Group were 48% of the total investment securities and 82% for the Parent Company (2013: 24% and 48% respectively).
5.5 Fair value estimationThe estimate of fair values of the financial instruments is based on information available to the individual Group Company’s management at the reporting date. Whilst management has used its best judgment in estimating the fair value of the financial instruments, there are inherent weaknesses in any estimation technique. The estimates involve matters of judgment and cannot be determined with precision. The bases adopted by the Group and Parent Company in deriving the fair values are as follows:
5.5.1 Current account balances due to and from banks
The carrying amount of current account balances due to and from banks was considered to be a reasonable estimate of fair value due to their short-term nature.

42
5.5.2 Loans and advances
The estimated fair value of loans whose interest rates are materially different from the prevailing market interest rates is determined by discounting the contracted cash flows using market interest rates currently charged on similar loans. The fair value of non-performing loans approximates to the book value as adjusted for allowance for loan impairment. For the remainder, the fair value is taken as being equivalent to the carrying amount as the prevailing interest rates offered on similar loans are not materially different from the actual loan rates.
5.5.3 Investments at fair value through profit or loss and available for sale
Quoted market prices, when available, are used as the measure for fair value. However, when the quoted market prices do not exist, fair value presented is estimated using discounted cash flow models or other valuation techniques. The total amount of changes in value estimated using valuation techniques that were recognised in the statement of comprehensive income during the year.
Where quoted market price do not exist and when investments are in closely held entities, the management of the Parent Company presents such investments at cost less impairment losses, by factoring all known elements which could influence the unrealisation for each investment individually. These elements would include both internal and external factors.
5.5.4 Customers’ deposits
The fair value of demand, call, and savings deposits is the amount payable on demand at the reporting date, which is equal to the carrying value of those liabilities. The estimated fair value of fixed rate deposits whose interest rates are materially different from the prevailing market interest rates are determined by discounting the contractual cash flows using the market interest rates currently offered for similar deposits.
5.5.5 Derivatives
The banking subsidiary usually enters into short term forward foreign exchange contracts, on behalf of its customers for the sale and purchase of foreign currencies. For forward foreign exchange contracts, it uses a valuation model with readily available market observable inputs. The model incorporates various inputs including the credit quality of counterparties, foreign exchange spot and forward rates and interest rate curves.
The related fair value details are set out in note 32.
5.6 Capital management
The Group’s objectives of capital management are:• to comply with the capital requirements set by the regulator for the banking subsidiary i.e. the Central Bank of Oman;• to safeguard the Group’s ability to continue as a going concern while providing adequate returns to the shareholders; and• to maintain a strong capital base to support the development of its business.
The principal objective of the Central Bank of Oman’s (CBO) capital adequacy requirements is to ensure that an adequate level of capital is maintained to withstand any losses which may result from the risks in a bank’s balance sheet, in particular credit risk. The CBO’s risk-based capital adequacy framework is consistent with the international standards of the Bank for International Settlements (BIS).
The CBO required the banks registered in the Sultanate of Oman to maintain a minimum capital adequacy ratio of 10% based on guidelines of the Basel II Accord from January 2007. The minimum capital adequacy ratio has been increased to 12% from 31 December 2010 onwards.
The ratio for the banking subsidiary calculated in accordance with the CBO and BIS capital adequacy guidelines as per the Basel II Accord is as follows:
2014RO’ 000
2013RO’ 000
Capital
Tier 1 202,276 185,788
Tier 2 36,660 45,255
Total capital base 238,936 231,043
Risk weighted assets
Credit risk 1,432,598 1,279,113
Market risk 4,963 7,713
Operational risk 122,288 112,025
Total risk weighted assets 1,559,849 1,398,851
Capital adequacy ratio % 15.32 16.52

43
The Tier 1 capital consists of paid-up capital and reserves. The Tier 2 capital consists of the subordinated bond and collective provisions made for the loan impairment on the performing portion of the loans and advances against the losses incurred but not identified.
The Parent company’s objectives when managing capital are to safeguard the Group’s ability to continue as a going concern in order to provide returns to shareholders and benefits for other stakeholders and to maintain an optimal capital structure to reduce the cost of capital. During 2014, the Parent company’s strategy, which was unchanged from 2013, was to maintain the gearing ratio at an acceptable level. The gearing ratio at 31 December 2014 and 2013 for the Parent Company was 40.31% and 24.62% respectively.
2014 2013
RO’ 000 RO’ 000
Total borrowings (44,000) (21,200)
Less: bank balances and cash 3,549 2,078
Net debt (40,451) (19,122)
Total equity (59,907) (58,533)
Total capital (100,358) (77,655)
Gearing ratio 40.31% 24.62%
6. CERTIFICATES OF DEPOSITCertificates of deposit are issued by the Central Bank of Oman for period of 28 days (2013 : ranging from 28 days to 57 days) and carry interest at rate ranging from 0.12% to 0.13% (2013 : ranging from 0.12% to 0.15%) per annum.
7. DEPOSITS WITH BANKSDeposits with banks include RO 500,000 (2013 - RO 500,000) being a capital deposit with the Central Bank of Oman in terms of regulations applicable to the banking subsidiary which earn interest at 1.5% (2013 – 1.5%) per annum. This deposit cannot be withdrawn without prior approval of the Central Bank of Oman. The remaining RO 95.76 million (2013 - RO 34.65 million) was placed with international and local banks.
8. INVESTMENT SECURITIESAs at the reporting date, investment securities comprised the following:
Group Parent Company
2014(RO’000)
2013(RO’000)
2014(RO’000)
2013(RO’000)
Financial assets at fair value through profit or loss (Note 8a) 7,748 9,371 6,619 6,872
Available-for-sale investments (Note 8b) 55,507 27,032 33,114 8,145
Held-to-maturity investments (Note 8c) 50,402 32,073 - -
113,657 68,476 39,733 15,017
(a) Financial assets at fair value through profit or loss(i) Financial assets designated at fair value through profit or lossAs at the reporting date, financial assets designated at fair value through profit or loss comprised the following:
Group Parent Company
2014(RO’000)
2013(RO’000)
2014(RO’000)
2013(RO’000)
Quoted investments
Local investments by sector
Banking 1,110 2,378 1,110 1,846
Investment 1,449 266 1,449 266
Services 276 509 229 461
Industrial 851 775 846 723
3,686 3,928 3,634 3,296
Oman Al Arabi Fund 430 539 - -
4,116 4,467 3,634 3,296

44
Group Parent Company
2014(RO’000)
2013(RO’000)
2014(RO’000)
2013(RO’000)
Foreign investments
Equity and equity related 2,985 3,576 2,985 3,576
7,101 8,043 6,619 6,872
Unquoted local investments 317 286 - -
Total financial assets designated at fair value through profit or loss 7,418 8,329 6,619 6,872
(ii) Financial assets held for trading
Group Parent Company
2014(RO’000)
2013(RO’000)
2014(RO’000)
2013(RO’000)
Total financial assets held for trading 330 1,042 - -
Total financial assets designated at fair value through profit or loss 7,748 9,371 6,619 6,872
Unquoted local investments held by the Group include investment in the Financial Settlement and Guarantee Fund of RO 196,438 (2013 - RO 189,783) which is not realisable until the date the banking subsidiary ceases its brokerage activities or the fund is liquidated, whichever is earlier.
(b) Available-for-sale investments
Group Parent Company
2014(RO’000)
2013(RO’000)
2014(RO’000)
2013(RO’000)
Local investments
Quoted investments (cost) 40,117 15,915 25,090 -
Fair value reserve 787 693 967 -
Unquoted investments (cost) 889 850 700 700
Fair value reserve 6,583 6,598 6,598 6,598
Deferred tax liability on fair value reserve (659) (659) (659) (659)
Total local investments 47,717 23,397 32,696 6,639
Foreign investments
Quoted investments (cost) 7,143 2,074 - -
Fair value reserve (457) 4 - -
6,686 2,078 - -
Unquoted investments (cost) 2,541 4,387 1,829 4,334
Less: Provision for impairment (1,475) (2,906) (1,475) (2,906)
1,066 1,481 354 1,428
Fair value reserve 38 76 64 78
1,104 1,557 418 1,506
Total available-for-sale investments 55,507 27,032 33,114 8,145
Fair value reserve changes in available-for-sale investments are recognised in other comprehensive income under “changes in fair value of available-for-sale investments”. Provision for impairment for available for sale investments are charged to profit or loss.
(c) Held-to-maturity investments
Group Parent Company
2014(RO’000)
2013(RO’000)
2014(RO’000)
2013(RO’000)
Oman Government Development Bonds
- held by the banking subsidiary 50,402 32,073 - -

45
All the bonds are denominated in Rial Omani and are issued by the Government of Oman. They carry interest rates varying between 2.75% and 5.5% (2013 - 2.75% and 5.5%) per annum. The maturity profile of the bonds based on the remaining period to maturity from the reporting date, is as follows:
2014 2013
RO’ 000 RO’ 000
Within one year - 2,400
Between one and five years 50,402 29,673
50,402 32,073
(d) Investments in associates As at the reporting date, investments in associates represented holdings in the following companies registered in the Sultanate of Oman:
2014 2013
HoldingCarrying
Value Cost HoldingCarrying
Value Cost
(%) RO’000 RO’000 (%) RO’000 RO’000
National Finance Company SAOG 25.87% 10,049 4,804 24.22 8,699 4,182
National Biscuit Industries Ltd. SAOG 29.22% 1,144 732 29.22 988 732
National Detergent Company SAOG 20.94% 2,715 713 20.94 2,685 713
13,908 6,249 12,372 5,627
All the Group’s associated companies’ shares are listed on the Muscat Securities Market (MSM). The market value of investments in associated companies as of the reporting date amounted to RO 13,555,066 (2013 - RO 13,455,015).
Total assets, liabilities and revenues of the Group’s associates, all of which are registered in the Sultanate of Oman are shown below, along with the Group’s share of the results of these associates:
Assets(RO’000)
Liabilities(RO’000)
Revenues(RO’000)
Share of profit(RO’000)
Name of the associate
2014
National Finance Company SAOG 165,300 126,553 15,911 1,330
National Biscuit Industries SAOG 6,656 2,915 11,353 185
National Detergent Company SAOG 25,651 12,364 23,386 172
1,687
2013
National Finance Company SAOG 151,119 115,069 14,538 1,152
National Biscuit Industries SAOG 6,898 3,698 11,305 140
National Detergent Company SAOG 24,073 10,943 21,704 227
1,519

46
(e) Investments in subsidiaries As at the reporting date, investments held by the Parent Company in subsidiaries are:
2014 2013
Country of Incorporation Holding Cost Holding Cost
% (RO’000) % (RO’000)
Oman Arab Bank SAOC(Principal activity: Banking) Oman 50.99 41,302 50.99 41,302
Oman Investment Services SAOC(Principal activity: Investments) Oman 99.98 903 99.98 903
Salalah Resorts SAOC(Principal activity: Integrated Tourism Project) Oman 100.00 3,000 100.00 1,000
Al Jabal Al Aswad Investment(Principal activity: Real Estate) Oman 100.00 - 100.00 -
Budva Beach Properties(Principal activity: Tourism project) Montenegro 100.00 5,231 100.00 5,231
50,436 48,436(f) Details of significant investments As at reporting date, the Group’s investments for which either, the Group’s holding represents 10% or more of the issuer’s share capital, or, the Group’s holding exceeds 10% of the market value of the Group’s investment portfolio, are detailed as follows:
Quoted securities
2014
Holding%
Number of shares
Fair value
(RO’000)
Carrying value
(RO’000)
Group
National Biscuit Industries Ltd SAOG 29.22 292,197 1,096 1,144
National Finance Company SAOG 25.87 66,440,917 9,966 10,049
National Detergent Company SAOG 20.94 3,561,700 2,493 2,715
Bank Muscat SAOG 0.46 10,110,369 5,884 5,884
Ahli Bank SAOG 6.48 83,898,163 20,555 20,555
Oman National Dairy Products Co. Ltd SAOG 19.65 482,726 - -
39,994 40,347
As at reporting date, the Parent company’s investments for which either, the Parent company’s holding represents 10% or more of the issuer’s share capital, or, the Parent company’s holding exceeds 10% of the market value of the Parent company’s investment portfolio, are detailed as follows:
Quoted securities
2014
Holding%
Number of shares
Fair value
(RO’000)
Carrying value
(RO’000)
Parent Company
National Biscuit Industries Ltd SAOG 28.92 289,197 1,084 732
National Finance Company SAOG 25.56 65,650,136 9,848 4,804
National Detergent Company SAOG 20.94 3,561,700 2,493 713
Bank Muscat SAOG 0.46 10,110,369 5,884 5,884
Ahli Bank SAOG 6.48 83,898,163 20,555 20,555
Oman National Dairy Products Co. Ltd SAOG 19.65 482,726 - -
39,864 32,688

47
2013
Holding%
Number of shares
Fair value
(RO’000)
Carrying value
(RO’000)
Group
National Biscuit Industries Ltd SAOG 29.22 292,197 1,096 988
National Finance Company SAOG 24.22 60,687,024 9,467 8,699
National Detergent Company SAOG 20.94 3,561,700 2,892 2,685
Bank Muscat SAOG 0.063 1,363,686 867 867
Ahli Bank SAOG 0.003 42,370 8 8
Oman National Dairy Products Co. Ltd SAOG 19.65 482,726 - -
14,330 13,247
2013
Parent Company
National Biscuit Industries Ltd SAOG 28.92 289,197 1,084 732
National Finance Company SAOG 24.01 60,146,475 9,383 4,182
National Detergent Company SAOG 20.94 3,561,700 2,892 713
Bank Muscat SAOG 0.063 1,363,686 867 867
Ahli Bank SAOG 0.003 42,370 8 8
Oman National Dairy Products Co. Ltd SAOG 19.65 482,726 - -
14,234 6,502
Unquoted securitiesHolding
Number of shares
Carrying value
2014 % (RO’000)
Group
Subsidiaries
Oman Arab Bank SAOC 51.00 59,160,000 108,538
Oman Investment Services SAOC 99.98 998,800 858
Salalah Resorts SAOC 100.00 3,000,00 1,311
Budva Beach Properties 100.00 - 4,911
Others
Al Shamal Plastics LLC (g) 21.44 200,000 913
Modern Steel Mills LLC (g) 19.49 136,395 4,828
Gulf Acrylic Industries LLC (g) 17.64 100,000 621
121,980
Unquoted securitiesHolding
Number of shares
Carrying value
2014 % (RO’000)
Parent Company
Subsidiaries
Oman Arab Bank SAOC 50.99 59,148,400 41,302
Oman Investment Services SAOC 99.98 999,800 903
Salalah Resorts SAOC 100.00 3,000,000 3,000
Budva Beach Properties 100.00 - 5,231
Others
Al Shamal Plastics LLC (g) 16.08 150,000 876
Modern Steel Mills LLC (g) 19.49 136,395 4,828
Gulf Acrylic Industries LLC (g) 13.23 75,000 561
56,701

48
Unquoted securitiesHolding
Number of shares
Carrying value
2013 % (RO’000)
Group
Subsidiaries
Oman Arab Bank SAOC 51.00 59,160,000 101,364
Oman Investment Services SAOC 99.98 999,800 714
Salalah Resorts SAOC 100.00 1,000,000 -
Budva Beach Properties 100.00 - 4,984
Others
Al Shamal Plastics LLC (g) 21.44 200,000 913
Modern Steel Mills LLC (g) 19.49 136,395 4,828
Gulf Acrylic Industries LLC (g) 17.64 100,000 621
113,424
Parent Company
Subsidiaries
Oman Arab Bank SAOC 50.99 59,148,400 41,302
Oman Investment Services SAOC 99.98 999,800 903
Salalah Resorts SAOC 100.00 1,000,000 1,000
Budva Beach Properties 100.00 - 5,231
Others
Al Shamal Plastics LLC (g) 16.08 150,000 876
Modern Steel Mills LLC (g) 19.49 136,395 4,828
Gulf Acrylic Industries LLC (g) 13.23 75,000 561
54,701
These are not recognised as investment in associates since the Group does not have significant influence.
9. LOANS AND ADVANCES TO CUSTOMERS(a) Loans and advances to customers extended by the banking subsidiary were as follows:
2014RO’ 000
2013RO’ 000
Corporate Loans
Term loans 577,860 541,682
Overdrafts 141,439 111,291
Bills discounted 22,793 21,319
Islamic finance 6,567 2,888
748,659 677,180
Personal Loans
Consumer loans 372,777 328,076
Mortgage loans 100,822 66,520
Overdrafts 35,383 27,237
Credit cards 5,072 5,759
Islamic finance 14,613 835
528,667 428,427
Gross loans and advances 1,277,326 1,105,606
Less: allowance for loan impairment and unrecognised contractual interest (note 9(b)) (36,990) (34,315)
Net loans and advances 1,240,336 1,071,291

49
(b) Allowance for loan impairment and unrecognised contractual interestThe movement in the allowance for loan impairment and unrecognised contractual interest was as follows:
2014
Allowance for loan impairment
(RO 000)
Unrecognised contractual interest
(RO 000)Total
(RO 000)
At 1 January 27,318 6,997 34,315
Additional provision made 8,577 2,408 10,985
Provided during the year for Islamic financing 308 - 308
Amounts written off (855) (892) (1,747)
Amounts released/recovered (4,697) (2,174) (6,871)
At 31 December 30,651 6,339 36,990
2013
At 1 January 24,777 6,744 31,521
Additional provision made 6,305 2,103 8,408
Provided during the year for Islamic financing 46 - 46
Amounts written off (276) (385) (661)
Amounts released/recovered (3,534) (1,465) (4,999)
At 31 December 27,318 6,997 34,315
At 31 December 2014, loans and advances on which contractual interest was not recognised or has not been accrued amounted to RO 38,185,000 (2013 - RO 36,613,000).
At 31 December 2014, loan impairment provision amounting to RO 17,419,000 (2013 - RO 14,641,000) has been made towards losses incurred but not identified on performing portion of the loans and advances on a portfolio basis.
(c) Islamic financingIncluded in the above loans and advances are the following Islamic financing contracts:
Personal Corporate Total
(RO 000) (RO 000) (RO 000)
2014
Musharaka 11,176 5,697 16,873
Murabaha 1,317 554 1,871
Ijarah Muntahia Bittamleek 2,120 316 2,436
At 31 December 14,613 6,567 21,180
2013
Musharaka 570 2,888 3,458
Murabaha 202 - 202
Ijarah Muntahia Bittamleek 63 - 63
At 31 December 835 2,888 3,723

50
Gross Investmentin lease
Present value of minimum lease payment
2014 RO’ 000 RO’ 000
Within one year 294 181
Two to five years 978 624
More than five years 2,269 1,631
3,541 2,436
Deferred profit (1,105) -
Net investment in lease finance 2,436 2,436
2013
Within one year 10 7
Two to five years 29 21
More than five years 49 35
88 63
Deferred profit (25) -
Net investment in lease finance 63 63
(d) All loans and advances were made to customers within the Sultanate of Oman. The concentration of loans and advances by sector is as follows:
2014RO’ 000
2013RO’ 000
Personal and consumer loans 528,667 428,427
Transportation 133,275 139,672
Manufacturing 105,518 110,532
Construction 136,135 105,490
Electricity, water and gas 65,896 44,249
Wholesale and retail trade 43,567 34,252
Services 45,949 34,007
Import trade 37,238 32,157
Financial institutions 11,746 23,952
Mining and quarrying 19,484 15,064
Agriculture and allied activities 6,383 4,771
Government 3,383 -
Others 140,085 133,033
1,277,326 1,105,606
10. OTHER ASSETSGroup Parent Company
2014(RO’000)
2013(RO’000)
2014(RO’000)
2013(RO’000)
Customers’ indebtedness against acceptances 28,559 16,748 - -
Interest receivable 3,999 4,199 - -
Prepayments 1,499 1,513 107 23
Receivable from investment customers 1,788 1,095 - -
Positive fair value of derivatives (Note 32) 220 251 - -
Others 7,285 9,044 260 170
43,350 32,850 367 193

51
11 (a). INVESTMENT PROPERTIESGroup and Parent Company
Land(RO’000)
Buildings(RO’000)
Capital work-in-progress(RO’000)
Total(RO’000)
Cost
At 1 January 2014 - - - -
Transfers {Note 11(c)} 2,427 973 2,586 5,986
Additions 2,531 - 1,124 3,655
Disposal (2,427) - (3,710) (6,137)
At 31 December 2014 2,531 973 - 3,504
Depreciation
At 1 January 2014 - - - -
Transfer {Note 11(c)} - 524 524
At 31 December 2014 - 524 - 524
Carrying value
At 31 December 2014 2,531 449 - 2,980
At 31 December 2013 - - - -
The Company has moved to a new location during the year resulting in a change in use of its owner occupied building which is reclassified to investment property. The building is now held for capital appreciation and to earn rentals.
Management also changed its intention to use the land and building under construction as an investment property and therefore reclassified the same. The property was disposed-off during the year.
The Company has also purchased a land during the year for capital appreciation which is recognised as an investment property.
At the reporting date fair value of the land and building was RO 4,127,500. Fair value was determined by the Company using market comparable approach based on recent market prices (level 2 hierarchy).
11 (b). PROJECTS WORK IN PROGRESSAt 31 December 2014, projects work in progress includes:
Group2014
RO’ 0002013
RO’ 000
Salalah Resorts SAOC
Initial stage 168 1,067
Consultancy charges 2,433 2,798
2,601 3,865
Less: provision for impairment - (1,329)
Total 2,601 2,536
Budva Beach Properties:
Cost of land 5,231 5,231
Consultancy and other costs 946 950
6,177 6,181
8,778 8,717
At 31 December 2014, the project development cost relating to Salalah Resorts SAOC amounted to RO 2.6 million (2013: 2.5 million). Although there are certain delays in execution of the Development Agreement (DA) the negotiations on terms and conditions of the DA are now in an advanced stage with the authorities involved. The Board of Directors believe that the DA will be formally signed and executed in due course and the project will generate returns to the shareholders. Accordingly, the development costs incurred as of 31 December 2014 will be fully realised.

52
The movement in provision for impairment of work-in-progress is as follows:
2014RO’ 000
2013RO’ 000
At 1 January 1,329,034 -
Charged during the year - 1,329,034
Written-off during the year (1,329,034) -
At 31 December - 1,329,034
11 (c). PROPERTY AND EQUIPMENT Land and buildings
Furniture, fixtures and equipment
Motorvehicles
Capital work in progress Total
(RO’000) (RO’000) (RO’000) (RO’000) (RO’000)
Group
Cost:
At 1 January 2013 11,157 19,665 588 12,367 43,777
Additions - 2,109 20 7,474 9,603
Transfers 13,931 2,336 - (16,267) -
Disposals (270) (132) (34) - (436)
At 1 January 2014 24,818 23,978 574 3,574 52,944
Additions 2 ,722 1,582 172 971 5,447
Transfers - 713 - (713) -
Transfers {Note 11(a)} (3,400) - - (2,586) (5,986)
Disposals - (15) (137) - (152)
At 31 December 2014 24,140 26,258 609 1,246 52,253
Depreciation:
At 1 January 2013 3,017 14,902 431 - 18,350
Charge for the year 411 1,947 66 - 2,424
Disposals - (129) (34) - (163)
At 1 January 2014 3,428 16,720 463 - 20,611
Charge for the year 649 1,930 40 - 2,619
Transfers {Note 11(a)} (524) - - - (524)
Disposals - (13) (109) - (122)
At 31 December 2014 3,553 18,637 394 - 22,584
Carrying value
At 31 December 2014 20,587 7,621 215 1,246 29,669
At 31 December 2013 21,390 7,258 111 3,574 32,333

53
Land and buildings
Furniture, fixtures and equipment
Motorvehicles
Capital work in progress Total
(RO’000) (RO’000) (RO’000) (RO’000) (RO’000)
Parent Company
Cost
At 1 January 2013 3,400 465 5 637 4,507
Additions - 13 - 1,949 1,962
Disposals - (3) - - (3)
At 1 January 2014 3,400 475 5 2,586 6,466
Additions - 330 39 - 369
Transfers {Note 11(a)} (3,400) - - (2,586) (5,986)
Disposals - - - - -
At 31 December 2014 - 805 44 - 849
Depreciation:
At 1 January 2013 448 407 5 - 860
Charge for the year 40 47 - - 87
Disposals - (3) - - (3)
At 1 January 2014 488 451 5 - 944
Charge for the year 36 35 12 - 83
Transfer (524) - - - (524)
At 31 December 2014 - 486 17 - 503
Carrying value
At 31 December 2014 - 319 27 - 346
At 31 December 2013 2,912 24 - 2,586 5,522
12. SHARE CAPITALThe Parent company’s authorised share capital is 500,000,000 (2013 – 500,000,000) shares of 100 baisa each (2013 – 100 baisa). 336,743,000 (2013 – 306,130,000) shares of 100 baisa (2013- 100 baisa) each have been issued and are fully paid. During the year 30,613,000 shares (2013: 27,830,000) were issued as stock dividend as approved in the Annual General Meeting, held on 31 March 2014.
Shareholders of the Parent Company who own 10% or more of the Parent company’s shares, whether in their name or through nominee accounts, and the number of shares they hold at the reporting date are as follows:
2014 2013
Holding % Shares Holding % Shares
Al Hilal Investment Co. LLC 20.22 68,092,793 20.22 61,902,542
Civil Service Employees’ Pension Fund 14.26 48,031,199 14.92 45,660,051
34.48 116,123,992 35.14 107,562,593

54
13. RESERVES(a) Legal reserveAs required by Article 106 of the Commercial Companies Law of Oman, the Parent Company and each of its Omani subsidiaries are required to transfer 10% of their profit for the year to this reserve until such time as the legal reserve amounts to at least one third of the respective company’s paid-up share capital. The reserve is not available for distribution. The balance at the end of the year represents amounts relating to the Parent Company and its share of the legal reserve of its Omani subsidiaries.
2014RO’ 000
2013RO’ 000
Parent Company 9,072 8,571
Share of subsidiaries’ legal reserve 15,730 14,267
Group 24,802 22,838
(b) Capital reserveOman Arab Bank SAOC, the banking subsidiary, has increased its paid up share capital through capitalisation of retained profits and issue of rights. The Parent company’s share of the increased paid up share capital (50.99%) through capitalisation of retained profits has been transferred to a non-distributable capital reserve in the Group’s financial statements.
2014 2013
RO’ 000 RO’ 000
Capital reserve 17,846 17,846
(c) General reserveThis discretionary reserve held by the banking subsidiary is available for distribution.
(d) Subordinated debt reserveThe subordinated debt reserve has been created by the banking subsidiary by a transfer of 10% of the subordinated bonds each year out of the profit after tax for the year. The Central Bank of Oman requires that a reserve be set aside annually for the subordinated bonds which are due to mature within five years. The reserve is available for transfer back to retained earnings upon maturity of the subordinated bonds.
(e) Revaluation reserveThe revaluation reserve represents the Parent company’s share of the revaluation reserve arising from the revaluation of land in associated companies.
14. DIVIDEND PROPOSED AND PAIDParent CompanyFinal dividends are not accounted for until they have been approved at the Annual General Meeting. At the forthcoming Annual General Meeting, to be held on 30 March 2015, a cash dividend of RO 0.020 per share (2013 - RO 0.015 per share) amounting to RO 6,734,860 (2013 - RO 4,591,950) and a stock dividend of RO 0.010 per share (2013 - RO 0.010) amounting to RO 3,367,430 (2013 - RO 3,061,300) in respect of year ended 31 December 2014 is to be proposed by the Board of Directors. The financial statements for the year ended 31 December 2014 do not reflect proposed dividend, which will be accounted for in shareholders’ equity as an appropriation of retained profits in the year ending 31 December 2015.
15. DUE TO BANKSAs at the reporting date, due to banks are as follows:
Group Parent Company
2014 2013 2014 2013
(RO’000) (RO’000) (RO’000) (RO’000)
Due to banks - current accounts 5,891 3,862 - -
Terms loans 24,500 16,200 44,000 21,200
30,391 20,062 44,000 21,200
Term loans are unsecured and carry interest ranging from 2% to 2.9% (2013: 2.25% to 3%).

55
The maturity profile of terms loans is as follows:
Group Parent Company
2014 2013 2014 2013
(RO’000) (RO’000) (RO’000) (RO’000)
Due within one year 10,500 16,200 15,000 21,200
Due in more than one year 14,000 - 29,000 -
24,500 16,200 44,000 21,200
16. OTHER LIABILITIESGroup Parent Company
2014(RO’000)
2013(RO’000)
2014(RO’000)
2013(RO’000)
Liabilities against acceptances 28,559 16,748 - -
Payable to investment customers 23,329 12,215 - 9
Accrued expenses and other payables 10,150 10,885 2,173 1,359
Interest payable 6,971 4,765 75 44
Cheques and trade settlement payable 4,249 3,877 - -
Staff terminal benefits (note 26) 2,610 2,568 281 251
Interest and commission received in advance 1,343 1,385 - -
Negative fair value of derivatives (Note 32) 202 240 - -
77,413 52,683 2,529 1,662
17. SUBORDINATED BONDSIn order to enhance the capital adequacy and to meet the funding requirements, in April 2012 the Banking subsidiary issued non-convertible unsecured subordinated bonds of RO 50 Million (50,000,000 units of RO 1 each) for a tenor of five years and one month through private placement. The bonds are listed in the Muscat Securities Market and are transferable through trading. The bonds carry a fixed coupon rate payable semi-annually with the principal payable on maturity.
18. TAXATION(a) Recognised in the statements of comprehensive income
Group Parent Company
2014(RO’000)
2013(RO’000)
2014(RO’000)
2013(RO’000)
Statement of profit or loss
Current year 3,940 3,659 - -
Deferred tax 46 (4) - -
Tax expense 3,986 3,655 - -
Statement of financial position
Current year 3,917 3,419 - -
Deferred tax 319 273 - -
4,236 3,692 - -
Deferred tax liability
At 1 January 273 277 - -
Movement for the year 46 (4) - -
319 273 - -
The Parent Company and each of its Omani subsidiaries are subject to income tax at the rate of 12% of taxable income in excess of RO 30,000. There is no concept of Group taxation in Oman.

56
(b) Reconciliation of income tax expenseThe following is a reconciliation of income tax calculated at the applicable tax rate with the income tax expense:
Group Parent Company
2014 2013 2014 2013
(RO’000) (RO’000) (RO’000) (RO’000)
Profit before tax 32,410 30,096 5,013 8,016
Income tax at the rates mentioned above 3,878 3,601 598 962
Tax-exempt revenues (586) (627) (920) (1,015)
Non-deductible expenses 764 520 494 284
Deferred tax (income) / expense not recognised during the year(163) (6) (176) (6)
Unrecognised deferred tax on losses utilised during the year- (225) - (225)
Deferred tax on losses not recognised during the year- 178 - -
Current tax-prior year 76 250 - -
Deferred tax – prior year 10 - - -
Others 7 (36) 4 -
Income tax expense 3,986 3,655 - - (c) Movement
Group Parent Company
2014 2013 2014 2013
(RO’000) (RO’000) (RO’000) (RO’000)
At 1 January 3,692 3,850 - -
Provided during the year 3,986 3,655 - -
Paid in current year (3,442) (3,813) - -
At 31 December 4,236 3,692 - -
(d) Status of tax assessments
The consolidated tax liability comprises the tax liability of the Parent Company and its subsidiaries Oman Arab Bank SAOC, Oman Investment Services SAOC, Salalah Resorts SAOC and Budva Beach Properties.
Oman International Development and Investment Company SAOG (Ominvest)The assessments of Ominvest have been completed by the Tax Department up to and including 2008. Ominvest has filed an objection to HE The Secretary General for Taxation against the assessment completed by the Tax Department. The objection decision is awaited.
The assessment of the tax returns filed for the tax years 2009 to 2013 respectively have not yet been finalised by the Secretariat General for Taxation at the Ministry of Finance. Management believes however that any additional taxes that may arise on the completion of the tax assessments for the open tax years will not be significant to Ominvest’s financial position as at 31 December 2014.
Oman Investment Services SAOC (OIS)The assessments of OIS have been completed by the Tax Department up to and including 2009. The assessment of the tax return filed for the years 2010 to 2013 have not yet been finalised by the Secretariat General for Taxation at the Ministry of Finance. Management believes however that any additional taxes that may arise on completion of the tax assessments for the open tax year will not be significant to OIS’ financial position at 31 December 2014.
Oman Arab Bank SAOC (OAB)OAB was exempt from tax for the period from 16 April 1994 to 31 July 2000. The assessments for the years up to and including 2008 are complete. The assessments for the years 2009 to 2013 are not yet finalised by the Tax Authorities. Management believes that no significant further liabilities will be incurred by the OAB on completion of the pending tax assessments as compared to the existing provision established.
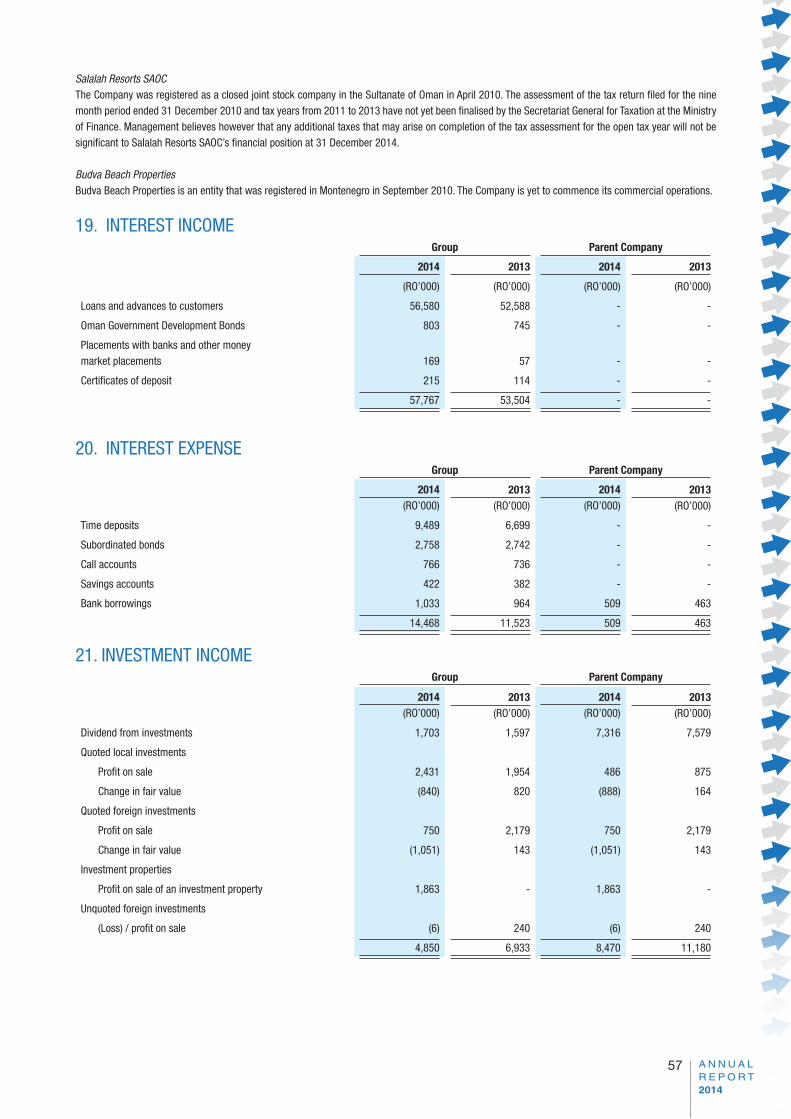
57
Salalah Resorts SAOCThe Company was registered as a closed joint stock company in the Sultanate of Oman in April 2010. The assessment of the tax return filed for the nine month period ended 31 December 2010 and tax years from 2011 to 2013 have not yet been finalised by the Secretariat General for Taxation at the Ministry of Finance. Management believes however that any additional taxes that may arise on completion of the tax assessment for the open tax year will not be significant to Salalah Resorts SAOC’s financial position at 31 December 2014.
Budva Beach PropertiesBudva Beach Properties is an entity that was registered in Montenegro in September 2010. The Company is yet to commence its commercial operations.
19. INTEREST INCOMEGroup Parent Company
2014 2013 2014 2013
(RO’000) (RO’000) (RO’000) (RO’000)
Loans and advances to customers 56,580 52,588 - -
Oman Government Development Bonds 803 745 - -
Placements with banks and other moneymarket placements 169 57 - -
Certificates of deposit 215 114 - -
57,767 53,504 - -
20. INTEREST EXPENSEGroup Parent Company
2014(RO’000)
2013(RO’000)
2014(RO’000)
2013(RO’000)
Time deposits 9,489 6,699 - -
Subordinated bonds 2,758 2,742 - -
Call accounts 766 736 - -
Savings accounts 422 382 - -
Bank borrowings 1,033 964 509 463
14,468 11,523 509 463
21. INVESTMENT INCOMEGroup Parent Company
2014(RO’000)
2013(RO’000)
2014(RO’000)
2013(RO’000)
Dividend from investments 1,703 1,597 7,316 7,579
Quoted local investments
Profit on sale 2,431 1,954 486 875
Change in fair value (840) 820 (888) 164
Quoted foreign investments
Profit on sale 750 2,179 750 2,179
Change in fair value (1,051) 143 (1,051) 143
Investment properties
Profit on sale of an investment property 1,863 - 1,863 -
Unquoted foreign investments
(Loss) / profit on sale (6) 240 (6) 240
4,850 6,933 8,470 11,180

58
22. FEE AND COMMISSION INCOME – NETGroup Parent Company
2014(RO’000)
2013 2014(RO’000)
2013(RO’000)(RO’000)
Fee and commission income 21,629 16,222 - -
Fee and commission expense (2,154) (1,805) - -
19,475 14,417 - -
23. OTHER OPERATING INCOMEGroup Parent Company
2014(RO’000)
2013(RO’000)
2014(RO’000)
2013(RO’000)
Foreign exchange (net) 4,564 4,453 - -
Income from Islamic window 869 23 - -
Other income 348 245 127 70
5,781 4,721 127 70
24. OPERATING EXPENSESGroup Parent Company
2014(RO’000)
2013(RO’000)
2014(RO’000)
2013(RO’000)
Staff costs (refer below) 24,830 21,984 2,086 1,488
Other operating expenses 11,392 10,680 400 266
Operating expenses of the Islamic window 1,190 723 - -
Depreciation 2,619 2,381 83 87
Directors’ sitting fees and remuneration:
Parent Company 200 200 200 200
Banking subsidiary 131 96 - -
40,362 36,064 2,769 2,041
Staff costs:
Salaries 20,404 18,281 1,770 1,101
End of service benefits 448 433 56 68
Social security costs 1,368 974 47 29
Other costs 2,610 2,296 213 290
24,830 21,984 2,086 1,488
25. CASH AND CASH EQUIVALENTSCash and cash equivalents included in statements of cash flows comprise the following:
Group Parent Company
2014 2013 2014 2013
(RO’000) (RO’000) (RO’000) (RO’000)
Balances with banks and money at call 115,302 134,338 3,549 2,078
Deposits with banks (note 7) 95,758 34,650 - -
Certificates of deposit (note 6) 200,000 100,000 - -
Due to banks – current accounts (note 15) (5,891) (3,862) - -
405,169 265,126 3,549 2,078

59
26. END OF SERVICE BENEFITSIn accordance with the Labour Law of Oman, the Group and Parent Company accrues for employees’ end of service benefits for its non-Omani employees.Movements in the liability recognised in the financial statements are as follows:
Group Parent Company
2014 2013 2014 2013
(RO’000) (RO’000) (RO’000) (RO’000)
At 1 January 2,568 2,907 251 210
Charge for the year 448 433 56 68
Paid during the year (406) (772) (26) (27)
At 31 December 2,610 2,568 281 251
The above balance is recorded under other liabilities in the statement of financial position.
27. SEGMENTAL INFORMATIONThe Group is organised into two main business segments:• Banking Segment - incorporating corporate, retail, treasury and investment banking activities carried out by the Group’s banking subsidiary; and• Investment Segment - incorporating investment activities with both short-term and long-term objectives.
Transactions between the business segments are on normal commercial terms and conditions and are entered into between the banking subsidiary and the rest of the Group. Such transactions are eliminated on consolidation.
Banking Sector
InvestmentsRetail
bankingCorporate
bankingInvestment
banking
Support and unallocated
function Al-Yusr Adjustments Total
2014 RO’000 RO’000 RO’000 RO’000 RO’000 RO’000 RO’000 RO’000
Interest income - 29,535 27,188 - 1,187 - (143) 57,767
Interest expenses (544) (1,614) (9,063) - (3,390) - 143 (14,468)
(544) 27,921 18,125 - (2,203) - - 43,299
Other operating income 8,817 11,967 5,216 5,256 4,669 869 (6,688) 30,106
Share of profit from associates 1,687 - - - - - - 1,687
Total operating income 9,960 39,888 23,341 5,256 2,466 869 (6,688) 75,092
Allowance for loan impairment - 16,132 20,503 - - 355 - 36,990
Provision for impairment on investments
306 - - - - - - 306
Assets 116,367 497,922 741,089 50,922 503,004 23,154 (68,220) 1,864,238
Liabilities 49,380 383,228 1,072,596 49,134 85,105 13,169 (25,366) 1,627,246
2013 RO’000 RO’000 RO’000 RO’000 RO’000 RO’000 RO’000 RO’000
Interest income - 28,146 24,541 - 916 - (106) 53,497
Interest expenses (471) (1,494) (6,323) - (3,341) - 106 (11,523)
(471) 26,652 18,218 - (2,425) - - 41,974
Other operating income 9,837 7,716 4,443 4,607 4,587 23 (5,135) 26,078
Share of profit from associates 1,519 - - - - - - 1,519
Total operating income 10,885 34,368 22,661 4,607 2,162 23 (5,135) 69,571
Allowance for loan impairment - 14,350 19,919 - - 46 - 34,315
Provision for impairment on investments
730 - - - - - - 730
Assets 91,408 413,243 659,388 35,273 338,992 9,459 (52,236) 1,495,527
Liabilities 27,494 356,713 792,384 35,273 71,466 1,767 (10,156) 1,274,941
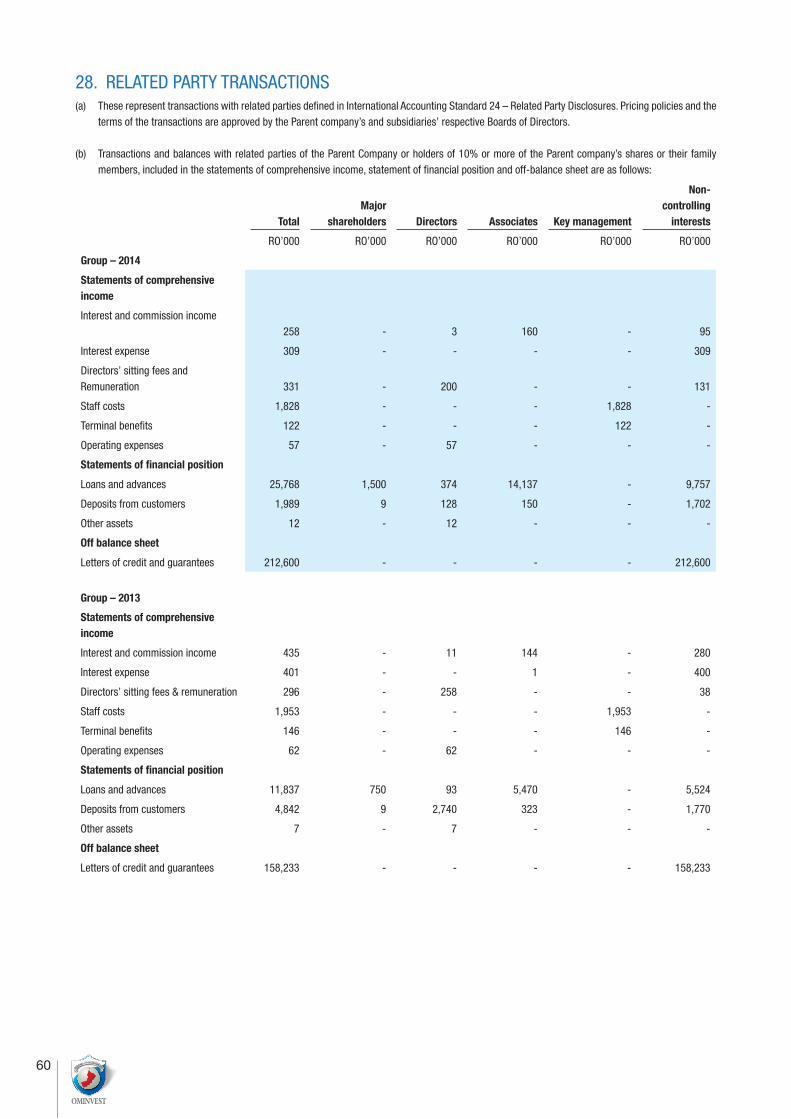
60
28. RELATED PARTY TRANSACTIONS(a) These represent transactions with related parties defined in International Accounting Standard 24 – Related Party Disclosures. Pricing policies and the
terms of the transactions are approved by the Parent company’s and subsidiaries’ respective Boards of Directors.
(b) Transactions and balances with related parties of the Parent Company or holders of 10% or more of the Parent company’s shares or their family members, included in the statements of comprehensive income, statement of financial position and off-balance sheet are as follows:
TotalMajor
shareholders Directors Associates Key management
Non-controlling
interests
RO’000 RO’000 RO’000 RO’000 RO’000 RO’000
Group – 2014
Statements of comprehensive income
Interest and commission income 258 - 3 160 - 95
Interest expense 309 - - - - 309
Directors’ sitting fees and Remuneration 331 - 200 - - 131
Staff costs 1,828 - - - 1,828 -
Terminal benefits 122 - - - 122 -
Operating expenses 57 - 57 - - -
Statements of financial position
Loans and advances 25,768 1,500 374 14,137 - 9,757
Deposits from customers 1,989 9 128 150 - 1,702
Other assets 12 - 12 - - -
Off balance sheet
Letters of credit and guarantees 212,600 - - - - 212,600
Group – 2013
Statements of comprehensive income
Interest and commission income 435 - 11 144 - 280
Interest expense 401 - - 1 - 400
Directors’ sitting fees & remuneration 296 - 258 - - 38
Staff costs 1,953 - - - 1,953 -
Terminal benefits 146 - - - 146 -
Operating expenses 62 - 62 - - -
Statements of financial position
Loans and advances 11,837 750 93 5,470 - 5,524
Deposits from customers 4,842 9 2,740 323 - 1,770
Other assets 7 - 7 - - -
Off balance sheet
Letters of credit and guarantees 158,233 - - - - 158,233

61
(c) The Banking subsidiary has a management agreement with Arab Bank plc, Jordan, which owns 49% of the Banking subsidiary’s share capital. In accordance with the terms of the management agreement, Arab Bank plc provides banking related technical assistance and other management services, including secondment of managerial staff. The annual management fee is RO 75,000 (2013 - RO 75,000).
2014 2013
ParentSubsidiary
RO’000Directors
RO’000
Keymanagement
RO’000Subsidiary
RO’000Directors
RO’000
Keymanagement
RO’000
Statement of profit or loss and other comprehensive income
Directors’ sitting fees and remuneration- 200 - - 200 -
Staff costs - - 878 - - 563
Terminal benefits - - 41 - - 53
Operating expenses - 57 - - 62 -
Interest expenses 143 - - 106 - -
Statements of financial position
Property and equipment - 250 - - 7 -
Bank borrowings 19,500 - - 5,000 - -
Bank balances 2,157 - - 430 - -
Due from subsidiaries 2,776 4,522 - -
(d) Due from subsidiaries in the Parent Company include an amount of RO 1,483,993 (2013 - RO 3,306,242) related to the tourist resort project in Salalah. The Board of Directors believe that the project is financially viable and a specific entity Salalah Resorts SAOC has been set up for this purpose and accordingly the amount is fully recoverable on implementation of the project.
29. FIDUCIARY ACTIVITIESAs at 31 December 2014, balances stated at cost arising from fiduciary activities are as follows:
Group Parent Company
2014(RO’000)
2013(RO’000)
2014(RO’000)
2013(RO’000)
Investments syndicated by the Group and registered in its name:
Parent Company 965 1,102 965 1,102
Funds under management:
Banking subsidiary 402,329 324,163 - -
403,294 325,265 965 1,102
These investments are held beneficially for and on behalf of investors and, accordingly, are not treated as assets of the Group and the Parent Company. These are included in the Group’s and Parent company’s financial statements as off balance sheet items.
The Banking subsidiary’s fiduciary activities consist of investment management activities conducted as trustee and manager for investment funds and individuals. The aggregate amounts of funds managed are not included in the Group’s statement of financial position.

62
30. COMMITMENTSAs of the reporting date, the Group and the Parent Company had the following outstanding commitments which are expected to crystallise within one year:
Group Parent Company
RO’ 000 RO’ 000
2014
Undrawn loan commitments 642 -
Contractual interest charge to maturity 1,556 1,556
2,198 1,556
2013
Construction 3,013 1,629
Undrawn loan commitments 770 -
Contractual interest charge to maturity 42 42
3,825 1,671
Up to 1 year 1 to 5 years Over 5 years Total
(RO’000) (RO’000) (RO’000) (RO’000)
2014
Undrawn loan commitments - 642 - 642
Contractual interest charge to maturity 24 1,532 - 1,556
24 2,174 - 2,198
2013
Capital commitments 3,013 - - 3,013
Undrawn loan commitments - 770 - 770
Contractual interest charge to maturity 42 - - 42
3,055 770 - 3,825
31. CONTINGENT LIABILITIESThe outstanding contract values or the notional amounts of these instruments at 31 December were as follows:
2014 2013
RO’ 000 RO’ 000
Letters of credit 396,531 461,952
Guarantees 421,259 394,281
Financial guarantees 97,224 89,681
915,014 945,914

63
The concentration of letters of credit, guarantees and financial guarantees by industry sector is as follows:
Group Parent Company
2014 2013 2014 2013
(RO’000) (RO’000) (RO’000) (RO’000)
Export trade 331,549 399,213 - -
Construction 270,152 264,317 - -
Government 74,500 94,033 - -
Transportation 20,660 49,323
Import trade 64,982 62,740 - -
Utilities 131,834 46,941 - -
Services 10,745 11,406 - -
Wholesale and retail trade 5,173 10,764 - -
Manufacturing 5,419 7,177 - -
915,014 945,914 - -
Group’s letters of credit and guarantees amounting to RO 644,109,000` (2013 - RO 696,813,000) were counter guaranteed by other banks.Letter of credit and guarantees include RO 165,000 (2013 – RO 392,000) relating to non-performing loans.
Legal claimsLitigation is a common occurrence in the banking industry due to the nature of the business. The Group has an established protocol for dealing with such legal claims. Once professional advice has been obtained and the amount of damages reasonably estimated, the Group makes adjustments to account for any adverse effects which the claims may have on its financial standing. At year end, the Group had certain unresolved legal claims which are not expected to have any significant implication on the Group’s financial statements.
32. DERIVATIVESA derivative financial instrument is a financial contract between two parties when payments are dependent upon movement in price in one or more underlying financial instrument, reference rate or index.
GroupAt the reporting date, there were outstanding forward foreign exchange contracts held by the Banking subsidiary, all maturing within one year, entered into on behalf of customers for the sale and purchase of foreign currencies. These financial instruments have been recognised at prices in active markets for identical assets or liabilities. These fair values and the notional contracted amounts are summarised below:
Notional amounts by term to maturity
Positive fair value
Negative fair value
Notional amount Within 3 months 3 – 12 months 1-5 years
RO’000 RO’000 RO’000 RO’000 RO’000 RO’000
31 December 2014
Purchase contracts 220 - 23,501 19,800 3,701 -
Sale contracts - (202) (23,483) (19,786) (3,697) -
220 (202) 18 14 4 -
31 December 2013
Purchase contracts 251 - 60,041 54,421 5,620 -
Sale contracts - (240) (60,030) (54,412) (5,618) -
251 (240) 11 9 2 -

64
33. GEOGRAPHICAL CONCENTRATION OF ASSETS AND LIABILITIESSultanate of
OmanRO’000
North AmericaRO’000
UK and EuropeRO’000
Other CountriesRO’000
TotalRO’000
Group - 2014
Assets
Balances with banks and money at call 113,896 - 36 1,370 115,302
Certificates of deposit 200,000 - - - 200,000
Deposits with banks 44,086 8,028 8,007 36,137 96,258
Investment securities 103,549 137 563 9,408 113,657
Investments in associates 13,908 - - - 13,908
Investment properties 2,980 - - - 2,980
Loans and advances to customers 1,240,336 - - - 1,240,336
Other assets 43,337 - 13 - 43,350
Projects work in progress 2,601 - 6,177 - 8,778
Property and equipment 29,669 - - - 29,669
Total assets 1,794,362 8,165 14,796 46,915 1,864,238
Liabilities
Due to banks 24,562 262 1,216 4,351 30,391
Deposits from customers 1,465,206 - - - 1,465,206
Other liabilities 74,776 - 27 - 74,803
Subordinated bonds 50,000 - - - 50,000
End of service benefits 2,610 - - - 2,610
Taxation 4,236 - - - 4,236
Total liabilities 1,621,390 262 1,243 4,351 1,627,246
Group - 2013
Assets
Balances with banks and money at call132,698 - 28 1,612 134,338
Certificates of deposit 100,000 4,346 - - 100,000
Deposits with banks 18,915 159 6,427 5,462 35,150
Investment securities 60,303 - 1,817 6,197 68,476
Investments in associates 12,372 - - - 12,372
Loans and advances to customers 1,071,291 - - - 1,071,291
Other assets 32,839 - 11 - 32,850
Projects work in progress 2,536 - 6,181 - 8,717
Property and equipment 32,333 - - - 32,333
Total assets 1,463,287 4,505 14,464 13,271 1,495,527
Liabilities
Due to banks 16,449 33 481 3,099 20,062
Deposits from customers 1,148,504 - - - 1,148,504
Other liabilities 50,100 - 15 - 50,115
Subordinated bonds 50,000 - - - 50,000
End of service benefits 2,568 - - - 2,568
Taxation 3,692 - - - 3,692
Total liabilities 1,271,313 33 496 3,099 1,274,941

65
Parent Company - 2014
Sultanate of Oman
RO’000North America
RO’000UK and Europe
RO’000Other Countries
RO’000Total
RO’000
Assets
Balances with banks and money at call 2,152 - 26 1,371 3,549
Investment securities 36,329 137 169 3,098 39,733
Investments in associates 6,249 - - - 6,249
Investment in subsidiaries 45,205 - 5,231 - 50,436
Investments in property 2,980 - - - 2,980
Other assets 367 - - - 367
Due from subsidiaries 1,499 - 1,277 - 2,776
Property and equipment 346 - - - 346
Total assets 95,127 137 6,703 4,469 106,436
Liabilities
Due to banks 44,000 - - - 44,000
Other liabilities 2,248 - - - 2,248
End of service benefits 281 - - - 281
Taxation - - - - -
Total liabilities 46,529 - - - 46,529
Parent Company - 2013
Assets
Balances with banks and money at call 446 - 20 1,612 2,078
Investment securities 9,934 160 1,420 3,503 15,017
Investments in associates 5,627 - - - 5,627
Investments in subsidiaries 43,205 - 5,231 - 48,436
Due from subsidiaries 3,321 - 1,201 - 4,522
Other assets 193 - - - 193
Property and equipment 5,522 - - - 5,522
Total assets 68,248 160 7,872 5,115 81,395
Liabilities
Due to banks 21,200 - - - 21,200
Other liabilities 1,411 - - - 1,411
End of service benefits 251 - - - 251
Total liabilities 22,862 - - - 22,862

66
34. INTEREST RATE SENSITIVITY ANALYSISThe Group’s and the Parent company’s interest rate sensitivity position, based on the contractual re-pricing or maturity dates, whichever dates are earlier, are as follows:
Average effective
interest rateWithin 6 months
6 to 12months
Over 1 year
Not exposed to interest rate risk Total
% RO’000 RO’000 RO’000 RO’000 RO’000
Group - 2014
Assets
Balances with banks and money at call NIL - - - 115,302 115,302
Certificates of deposit 0.13% 200,000 - - - 200,000
Deposits with banks 0.34% 66,772 - 500 28,986 96,258
Investment securities:
- Govt. Development Bonds 2.54% - - 50,402 - 50,402
- Investments NIL - - - 63,255 63,255
Investments in associates NIL - - - 13,908 13,908
Investment properties NIL - - - 2,980 2,980
Loans and advances to customers 4.68% 247,058 246,317 739,839 7,122 1,240,336
Other assets NIL 3,999 - - 39,351 43,350
Projects work in progress NIL - - - 8,778 8,778
Property and equipment NIL - - - 29,669 29,669
Total assets 517,829 246,317 790,741 309,351 1,864,238
Liabilities
Due to banks 2.5% 24,500 - - 5,891 30,391
Deposits from customers 0.94% 386,338 262,889 204,257 611,722 1,465,206
Other liabilities NIL 50,164 379 81 24,179 74,803
End of service benefits NIL - - - 2,610 2,610
Subordinated bonds 5.50% - - 50,000 - 50,000
Taxation NIL - - - 4,236 4,236
Total liabilities 461,002 263,268 254,338 648,638 1,627,246
Group - 2013
Assets
Balances with banks and money at call - - - - 134,338 134,338
Certificates of deposit 0.13% 100,000 - - - 100,000
Deposits with banks 0.11% 34,650 - 500 - 35,150
Investment securities:
- Govt. Development Bonds 2.75-5.5% - 2,400 29,673 - 32,073
- Investments NIL - - - 36,403 36,403
Investments in associates NIL - - - 12,372 12,372
Loans and advances to customers 5.06% 206,107 225,778 635,719 3,687 1,071,291
Other assets NIL 4,199 - - 28,651 32,850
Projects work in progress 2.50% - - 2,536 6,181 8,717
Property and equipment NIL - - - 32,333 32,333
Total assets 344,956 228,178 668,428 253,965 1,495,527
Liabilities
Due to banks 2.4% 16,200 - - 3,862 20,062
Deposits from customers 0.94% 397,372 180,175 57,694 513,263 1,148,504
Other liabilities NIL 25,904 379 81 23,751 50,115
End of service benefits NIL - - - 2,568 2,568
Subordinated bonds 5.50% - - 50,000 - 50,000
Taxation NIL - - - 3,692 3,692
Total liabilities 439,476 180,554 107,775 547,136 1,274,941

67
Average effective
interest rateWithin 6 months
6 to 12months
Over 1 year
Not exposed to interest rate risk Total
% RO’000 RO’000 RO’000 RO’000 RO’000
Parent - 2014
Assets
Balances with banks and money at call NIL - - - 3,549 3,549
Investment securities: NIL - - - 39,733 39,733
Investments in associates NIL - - - 6,249 6,249
Investments in subsidiaries NIL - - - 50,436 50,436
Investment properties NIL - - - 2,980 2,980
Due from subsidiaries NIL - - - 2,776 2,776
Other assets NIL - - - 367 367
Property and equipment NIL - - - 346 346
Total assets - - - 106,436 106,436
Liabilities
Bank borrowings 2.5% 15,000 - 29,000 - 44,000
Other liabilities NIL - - - 2,248 2,248
End of service benefits NIL - - - 281 281
Total liabilities 15,000 - 29,000 2,529 46,529
Parent - 2013
Assets
Balances with banks and money at call NIL - - - 2,078 2,078
Investment securities: NIL - - - 15,017 15,017
Investments in associates NIL - - - 5,627 5,627
Investments in subsidiaries NIL - - - 48,436 48,436
Due from subsidiaries NIL - - - 4,522 4,522
Other assets NIL - - - 193 193
Property and equipment NIL - - 5,522 5,522
Total assets - - - 81,395 81,395
Liabilities
Bank borrowings 2.5% 21,200 - - - 21,200
Other liabilities NIL - - - 1,411 1,411
End of service benefits NIL - - - 251 251
Total liabilities 21,200 - - 1,662 22,862

68
35. ASSETS AND LIABILITIES MATURITY PROFILEWithin 3 months 3 to 12 months 1 to 5 years Over 5 years Total
RO’000 RO’000 RO’000 RO’000 RO’000
Group - 2014
Assets
Balances with banks and money at call 75,625 16,994 14,115 8,568 115,302
Certificates of deposit 200,000 - - - 200,000
Deposits with banks 96,258 - - - 96,258
Investment securities 29,636 - 62,021 22,000 113,657
Investments in associates - - - 13,908 13,908
Investment properties - - - 2,980 2,980
Loans and advances to customers 234,212 148,369 318,882 538,873 1,240,336
Other assets 37,247 5,563 533 7 43,350
Projects work in progress - - - 8,778 8,778
Property and equipment - - - 29,669 29,669
Total assets 672,978 170,926 395,551 624,783 1,864,238
Equity
Capital and reserves attributable to the shareholders of the Parent Company - - - 132,669 132,669
Non-controlling interests - - - 104,323 104,323
Total equity - - - 236,992 236,992
Liabilities
Due to banks 16,391 - 14,000 - 30,391
Deposits from customers 418,642 290,732 488,988 266,844 1,465,206
Other liabilities 67,007 2,674 5,003 119 74,803
Subordinated bonds - - 50,000 - 50,000
End of service benefits - - 2,610 - 2,610
Taxation 3,917 319 - - 4,236
Total liabilities 505,957 293,725 560,601 266,963 1,627,246
Total equity and liabilities 505,957 293,725 560,601 503,955 1,864,238

69
Within 3 months 3 to 12 months 1 to 5 years Over 5 years Total
RO’000 RO’000 RO’000 RO’000 RO’000
Group - 2013
Assets
Balances with banks and money at call 75,369 26,682 15,542 16,745 134,338
Certificates of deposit 100,000 - - - 100,000
Deposits with banks 34,650 - - 500 35,150
Investment securities 28,250 2,400 35,826 2,000 68,476
Investments in associates - - - 12,372 12,372
Loans and advances to customers 186,251 175,348 273,231 436,461 1,071,291
Other assets 27,557 4,061 577 655 32,850
Projects work in progress - - - 8,717 8,717
Property and equipment - - - 32,333 32,333
Total assets 452,077 208,491 325,176 509,783 1,495,527
Equity
Capital and reserves attributable to the shareholders of the Parent Company - - - 123,176 123,176
Non-controlling interests - - - 97,410 97,410
Total equity - - - 220,586 220,586
Liabilities
Due to banks 20,062 - - - 20,062
Deposits from customers 419,749 250,980 272,703 205,072 1,148,504
Other liabilities 44,634 1,358 4,123 - 50,115
Subordinated bonds - - 50,000 - 50,000
End of service benefits - - 2,568 - 2,568
Taxation 3,419 273 - - 3,692
Total liabilities 487,864 252,611 329,394 205,072 1,274,941
Total equity and liabilities 487,864 252,611 329,394 425,658 1,495,527

70
Within 3 months 3 to 12 months 1 to 5 years Over 5 years Total
Parent Company - 2014 RO’000 RO’000 RO’000 RO’000 RO’000
Assets
Balances with banks and money at call 3,549 - - - 3,549
Investment securities 6,619 - 33,114 - 39,733
Investments in associates - - - 6,249 6,249
Investments in subsidiaries - - - 50,436 50,436
Investment properties - - - 2,980 2,980
Due from subsidiaries - - 2,776 - 2,776
Other assets 367 - - - 367
Property and equipment - - - 346 346
Total assets 10,535 - 35,890 60,011 106,436
Equity
Capital and reserves
Total equity - - - 59,907 59,907
Liabilities
Due to banks 7,500 7,500 29,000 - 44,000
Other liabilities 2,248 - - - 2,248
End of service benefits - - 281 - 281
Total equity and liabilities 9,748 7,500 29,281 59,907 106,436
Parent Company - 2013
Assets
Balances with banks and money at call 2,078 - - - 2,078
Investment securities 6,872 - 8,145 - 15,017
Investments in associates - - - 5,627 5,627
Investments in subsidiaries - - - 48,436 48,436
Due from subsidiaries - - 4,522 - 4,522
Other assets 193 - - - 193
Property and equipment - - - 5,522 5,522
Total assets 9,143 - 12,667 59,585 81,395
Equity
Capital and reserves - - - 58,533 58,533
Total assets - - - 58,533 58,533
Liabilities
Due to banks 21,200 - - - 21,200
Other liabilities 1,411 - - - 1,411
End of service benefits - - 251 - 251
Total equity and liabilities 22,611 - 251 58,533 81,395

71
36. FAIR VALUE OF FINANCIAL INSTRUMENTSFair value is the price that would be received to sell an asset or paid to transfer a liability in an orderly transaction between market participants at the measurement date. Consequently, differences can arise between carrying values and fair value estimates.
GroupThe fair values of on balance sheet financial instruments, except for the following, are not significantly different from the carrying values included in the Group financial statements. The carrying value and estimated fair value of the following financial instruments are set out below:
Carrying value(RO’000)
Fair value(RO’000)
Difference(RO’000)
Investments in associates (note 8(d))
2014 13,908 13,555 (353)
2013 12,372 13,455 1,083
The fair value of the investments in associates is based on the closing bid prices on the Muscat Securities Market at the reporting date. Certain available-for-sale investments amounting to RO 373,720 (2013: 949,520) are stated at cost in the absence of fair value information. Parent CompanyThe fair values of on balance sheet financial instruments, except for investments in subsidiaries and associates, are not significantly different from the carrying values included in the financial statements. The fair value of investments in associates based on the closing bid prices on the Muscat Securities Market at the reporting date is set out below:
Carrying value(RO’000)
Fair value(RO’000)
Difference(RO’000)
Investments in associates (note 8(d))
2014 6,249 13,425 7,176
2013 5,627 13,359 7,732
Investments in subsidiaries amounting to RO 50.4 (2013 – RO 48.4) million are stated at cost. The fair value of Parent company’s investments in subsidiaries could vary depending on the valuation technique (IAS 39) that may be applied.
Fair value hierarchy The Group uses the following hierarchy for determining and disclosing the fair value of financial investments by valuation technique:Level 1: quoted (unadjusted) prices in active markets for identical assets or liabilitiesLevel 2: other techniques for which all inputs which have a significant effect on the recorded fair value are observable, either directly or indirectlyLevel 3: techniques which use inputs which have a significant effect on the recorded fair value that are not based on observable market data.
Transfers between levelsDuring the reporting period ended 31 December 2014, there were no transfers between Level 1 and Level 2 fair value measurements, and no transfers into and out of Level 3 fair value measurements.
The following table shows an analysis of financial instruments recorded at fair value by level of the fair value hierarchy:
As at 31 December 2014
Level 1 Level 2 Level 3 Total
Group (RO’000) (RO’000) (RO’000) (RO’000)
Financial assets at fair value through profit or loss 7,101 317 7,418
Financial assets held for trading 330 - - 330
Available-for-sale investments 47,590 7,057 860 55,506
Derivative financial instruments
Purchase contracts - 220 - 220
Sale contracts - (202) - (202)
Parent Company
Financial assets at fair value through profit or loss 6,619 - - 6,619
Available-for-sale investments 26,057 7,057 - 33,114

72
As at 31 December 2013
Level 1 Level 2 Level 3 Total
Group (RO’000) (RO’000) (RO’000) (RO’000)
Financial assets at fair value through profit or loss 8,043 - 286 8,329
Financial assets held for trading 1,042 - - 1,042
Available-for-sale investments 18,686 8,345 - 27,031
Derivative financial instruments
Purchase contracts - 251 - 251
Sale contracts - (240) - (240)
Parent Company
Financial assets at fair value through profit or loss 6,871 - - 6,871
Available-for-sale investments - 8,145 - 8,145
37. BASIC EARNINGS PER SHAREBasic earnings per share is calculated by dividing the profit for the year by the number of shares outstanding during the year.
Group Parent Company
2014 2013 2014 2013
(RO’000) (RO’000) (RO’000) (RO’000)
Profit for the year attributable
to shareholders of the parent (RO’000) 14,505 14,177 5,013 8,016
Weighted average number of shares outstanding during the year 336,743,000 336,743,000 336,743,000 336,743,000
Basic earnings per share (RO) 0.043 0.042 0.015 0.024
During the year, the Parent Company issued stock dividend of 30,613,000 shares (2013 – 27,783,000) without consideration. According to IAS 33 - Earnings per share, the weighted average number of ordinary shares outstanding during the period and for all periods presented shall be adjusted. In the present financial statement, the issue has been treated as if it had occurred at the beginning of 2013 and the basic earnings per share was recalculated accordingly. As there was no dilutive potential shares, the diluted earnings per share is identical to the basic earnings per share.
38. NET ASSETS PER SHAREThe calculation of net assets per share is as follows:
Group Parent Company
2014 2013 2014 2013
(RO’000) (RO’000) (RO’000) (RO’000)
Equity attributable
to shareholders of the parent (RO’000) 132,669 123,176 59,907 58,533
Number of shares outstanding during the year 336,743,000 336,743,000 336,743,000 336,743,000
Net assets per share (RO) 0.394 0.366 0.178 0.174

