differentiation of fractionated components of lard from ... a.n. nina naquiah.… ·...
TRANSCRIPT
Sains Malaysiana 46(2)(2017): 209–216 http://dx.doi.org/10.17576/jsm-2017-4602-04
Differentiation of Fractionated Components of Lard from Other Animal Fats Using Different Analytical Techniques
(Perbezaan Komponen Berperingkat Lemak Babi daripada Lemak Haiwan Lain Menggunakan Teknik Analitik Berbeza)
A.N. NINA NAQUIAH, J.M.N. MARIKKAR*, M.E.S. MIRGHANI, A.F. NURRULHIDAYAH & N.A.M. YANTY
ABSTRACT
A study was conducted to differentiate fractionated components of lard namely lard olein (LO) and lard stearin (LS) from other common animal fats. Lard fractions and animal fats were analyzed using differential scanning calorimetry (DSC), elemental analyzer–isotope ratio mass spectrometry (EA-IRMS), gas chromatography mass spectrometry (GC-MS) and Fourier transform infrared spectroscopy (FTIR). Overlay of FTIR spectra did not help to pinpoint any characteristic feature to distinguish either LO or LS from other animal fats, but overlay of DSC cooling curves helped a successful discrimination. The determination of δ13C from EA-IRMS showed that the values corresponding to the fractionated components of lard were significantly (p<0.05) different from those of the other common animal fats. GC-MS analysis showed that direct comparison of overall fatty acid data was not able to discriminate LO and LS from other animal fats, but the application of principal component analysis (PCA) to fatty acid data helped a successful discrimination.
Keywords: EA-IRMS; FTIR; GC-MS; halal; lard; lard olein; lard stearin
ABSTRAK
Satu kajian telah dijalankan untuk membezakan komponen berperingkat lemak babi iaitu lemak babi olein (LO) dan lemak babi stearin (LS) daripada lemak haiwan biasa yang lain. Pecahan lemak babi dan lemak haiwan dianalisis menggunakan kalori pengimbasan kebezaan (DSC), unsur penganalisis-isotop nisbah jisim spektrometri (EA-IRMS), kromatografi gas spektrometri jisim (GC-MS) dan spektroskopi transformasi Fourier inframerah (FTIR). Lengkung FTIR spektrum tidak membantu untuk menentukan apa-apa ciri-ciri untuk membezakan sama ada LO atau LS daripada lemak haiwan lain, tetapi lapisan lengkung penyejukan DSC telah Berjaya membantu diskriminasi. Penentuan δ13C daripada EA-IRMS menunjukkan bahawa nilai yang sepadan dengan komponen berperingkat lemak babi secara ketara (p<0.05) berbeza daripada lemak haiwan biasa lain. GC-MS menunjukkan bahawa perbandingan langsung asid lemak keseluruhan data adalah tidak dapat membezakan LO dan LS dari lemak haiwan yang lain, tetapi penggunaan analisis komponen utama (PCA) kepada data asid lemak membantu diskriminasi yang berjaya.
Kata kunci: EA-IRMS; FTIR; GC-MS; halal; lemak babi; lemak babi olein; lemak babi stearin
INTRODUCTION
Determining the authenticity of foods is an ever increasing challenge to food analysts. As adulteration practices are becoming more subtle and complicated, the possibility for detection becomes extremely difficult. Despite this, the efforts taken on food authentication are still helpful to some extent to reduce false description/incorrect labeling, substitution of cheaper ingredients and other modes of adulteration. As speculative reports of food adulterations are on the rise in the social media, consumers around the world have become increasingly cautious about the quality of the food they purchase. Food manufactures are at times compelled to confirm the authenticity of their finished products or ascertain the source of origin of the ingredients used in formulations. This increased demand for authenticity also comes amid various legislative and
regulatory pushes that increase the level of regulation imposed on the food supply worldwide. Occurrence of fat extracted from swine in food is an important concern for followers of certain religious faiths. Halal and kosher food regulations implemented in a number of countries prohibit the use of either lard or its fractionated products such as LS and LO in any food system (Regenstein et al. 2003). Hence, several studies have been undertaken previously to evaluate the use of different analytical approaches to discriminate lard from other animal fats. Marikkar et al. (2001) demonstrated the use of DSC analysis to distinguish lard from chicken fat, beef fat and mutton fat. Later on, Che Man et al. (2011) used FTIR spectroscopy to investigate the possibility of discriminating admixtures of animal fats containing lard. Subsequently, Chin et al. (2009) followed by Dias
210
et al. (2010) employed GC×GC-Time of Flight (ToF) MS to differentiate lard from other animal fats using branched fatty acids containing carbon atoms of more than 18. In this regard, chemometric methods such as principal component analysis were also employed to solve problems related to discrimination of identity (Christy & Egeberg 2006). In any of these studies, discriminating the fractionated lard components namely, LO and LS from other animal fats was not investigated. However, lard as an edible fat could be utilized in diversified forms in food systems. LS has been used either as shortening or fat component to improve the firmness of lard, while LO was suitable as a frying medium or bread pan lubricating agent. Since the use of LS and LO are also prohibitive under Halal and kosher food regulations, there is a need to develop methods based on various analytical techniques to discriminate them from other permissible food items. Hence, the objective of this study was to evaluate gas chromatography mass spectrometry (GC-MS), elemental analyzer-Isotope ratio mass spectrometry (EA-IRMS), differential scanning calorimetry (DSC) and Fourier transform infrared spectroscopy (FTIR) techniques for discrimination of LO and LS from other animal fats such as chicken fat, beef fat and mutton fat.
MATERIALS AND METHODS
MATERIALS
The samples of animal fats namely lard, beef fat (BF), mutton fat (MF) and chicken fat (CF) were extracted from adipose tissues of animals collected from local slaughter houses located at three different places in Sri Serdang, Malaysia. Adipose tissues were rendered at an oven temperature of 100ºC for 6 h and animal fats were filtered seperately through double-folded muslin cloth to remove impurities. After adding the samples with small proportions of anhydrous sodium sulphate to remove residual moisture, they were filtered through Whatman No. 2 filter paper and stored at 4°C (Marikkar et al. 2001). All the reagents and chemicals used in this study were either analytical or HPLC grade unless otherwise specified (acetone, hexane, sodium hydroxide). A standard mixture containing 37 fatty acid methyl esters (FAME) was purchased from Sigma-Aldrich (St. Louise, MO, USA).
FRACTIONAL CRYSTALLIZTION OF LARD
Fractional crystallization was carried out using acetone as solvent medium. Lard was melted at 60°C and mixed with acetone in 1:2 (w/v) ratios. The solution was boiled at 60°C until it became uniformly dissolved and left at 5±1°C for 24 h to crystallize. The precipitated fat was filtered off to give a high melting fat fraction known as lard stearin (LS). After removing the precipitate, the mother-liquor was evaporated under reduced pressure to yield a liquid called lard olein (LO) (Yanty et al. 2013).
FATTY ACID ANALYSIS
FAMEs were prepared by dissolving 50 mg portion of oil in 0.8 mL of hexane and adding 0.2 mL portion of 1 M solution of sodium methoxide (PORIM 1995). The clear supernatant of the solution was transferred into a 2 mL auto-sampler vial. The top hexane layer FAME solution (1 μL) was injected on an Agilent 6890N GC (Agilent Technologies, Singapore) equipped with a polar capillary column DB-23 (0.15 mm internal diameter, 60 m length and 0.25 μm film thickness; Agilent Technologies, Singapore) and an Agilent 5973 MS. Split injection was conducted with a split ratio of 100:1, using helium as a carrier gas at a flow rate of 1.00 mL/min. The temperature of the column was 50°C (for 1 min) and programmed to increase to 175°C at the rate of 25°C/min. Then, it was increased at the rate of 4°C/min to 230°C for 5 min. The temperatures of the injector and detector were maintained at 250°C. The identification of individual peak of FAMEs was done by comparing their retention time with those of 37 FAME standards (Supelco Bellefonte, PA). The percentage of individual fatty acid of samples was calculated as the ratio of the partial area to the total area (Yanty et al. 2013).
FTIR MESUREMENTS
FTIR spectra of all fat samples (lard, CF, BF, MF, LO and LS) were recorded using an FTIR Nicolet 6700 spectrometer (Thermo Nicolet, Madison, WI) equipped with deuterated triglycine sulphate (DTGS) detector and KBr beam splitter. The samples were placed in contact with the horizontal attenuated total reflectance (HATR) element (ZnSe crystal) at controlled ambient temperature (25°C) using a Pasteur pipette. FTIR spectra were collected in the mid-infrared region of 4000-650 cm-1 by co-adding 32 scans and at a resolution of 4 cm-1. All spectra were ratioed against a background of air spectrum. After each scan, a new reference air background spectrum was taken. Spectra were recorded as absorbance values at each data point in triplicate. The manufacturer’s software (OMNIC operating system, version 7.0 Thermo Nicolet) program was used to analyze spectral data (Che Man et al. 2011).
THERMAL ANALYSIS
Thermal analysis was carried out on a Mettler Toledo differential scanning calorimeter (DSC 823 Model) equipped with a thermal analysis data station (STARe software, Version 9.0×, Schwezbeanch, Switzerland). Nitrogen (99.999% purity) was used as the purge gas at a rate of ~20 mL/min. Approximately, 4-8 mg of melted sample was placed in a standard DSC aluminium pan and sealed hermetically. An empty, hermetically sealed DSC aluminium pan was used as the reference. The oil samples were subjected to the following temperature program: 70°C isotherm for 1 min, cooled at 5°C/min to -70°C (Yanty et al. 2013).
211
DETERMINATION OF δ13C VALUES
About 0.2 μg of each animal fat was weighed and loaded into a clean tin capsule to determine their δ13C values. The capsules containing samples were placed in auto-sampler system of elemental analyzer (Europa Scientific, UK) to be burnt in an O2 atmosphere of the combustion CuO tube with its temperature set at 960°C. Combustion gases were eluted through a reduction column by a stream of He gas and passed into the gas chromatograph where CO2, still in the He stream, was separated from the other gases. The gas stream was then entered into the IRMS system (Sercon Ltd., Crewe, U.K.) where the CO2 gas was analyzed by comparison with NBS-22 reference material (with a δ13C value of -30.03‰). During every batch of analyses, an empty tin capsule was analyzed as the blank to check the background (Liu et al. 2007). The results were referenced to Vienna Pee Dee Belemnite (V-PDB). The isotopic values were calculated against the international isotope reference standards: NBS-22 (International Atomic Energy Agency, Vienna, Austria) for 13C/12C measurements (Osorio et al. 2011).
STATISTICAL ANALYSIS
Data were statistically analyzed by one-way analysis of variance (ANOVA) using MINITAB (version 14) statistical package at 0.05 probability level. For grouping and classification models, PCA was carried out using Unscrambler 9.7 (Camo, USA) software.
RESULTS AND DISCUSSION
FATTY ACID COMPOSITION OF FARS
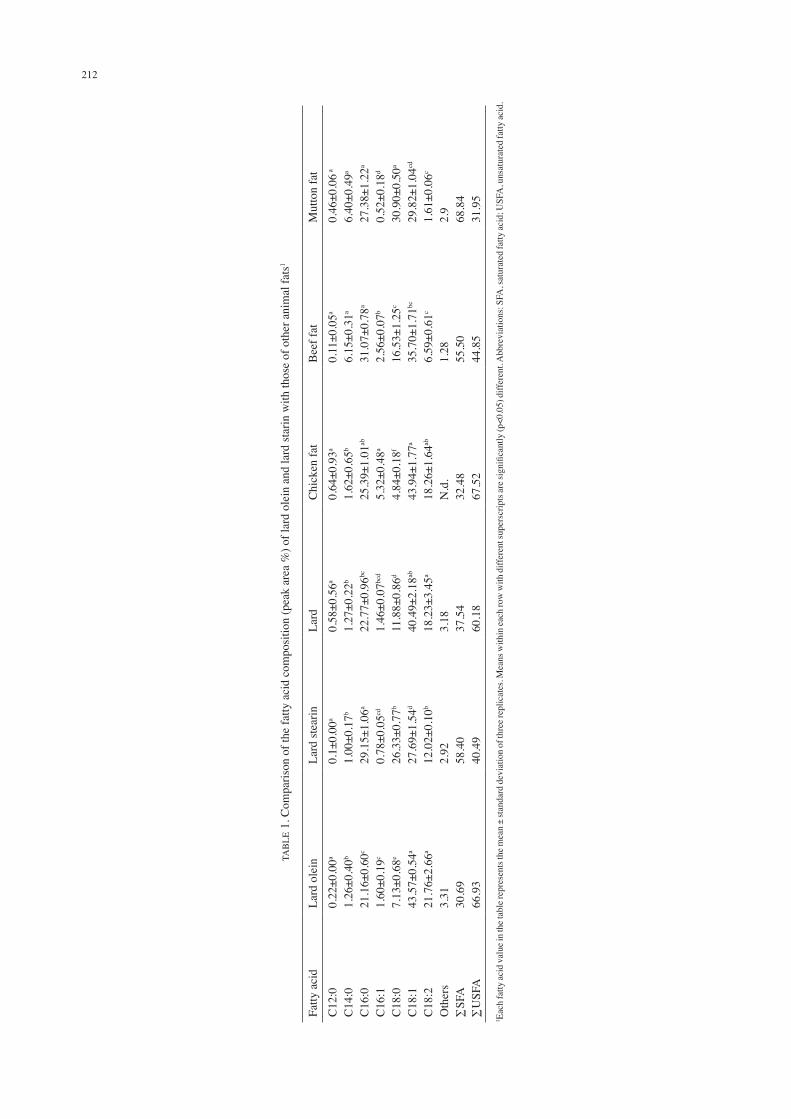
The data presented in Table 1 compares the fatty acid distribution of LS and LO with those of lard, CF, BF and MF. Some of the data on fatty acid compositions of animal fats obtained in this study were in accordance with the findings reported previously (Marikkar 2015; Rohman & Che Man 2010). As a common feature, LO, CF and lard were found to possess higher percentage of unsaturated fatty acids than saturated fatty acids. Similar to CF and lard, oleic (C18:1) was the major fatty acid of LO followed by linoleic (C18:1) and palmitic (C16:0) acids. However, LO and lard showed differences with respect to stearic acid (C18:0). This was mainly due to the fact that a portion of stearic acid (C18:0) would have migrated in to the solid phase during crystallization of lard. According to statistical analysis, there were no significant (p>0.05) differences between LO and CF with respect to oleic (C18:1), myristic (C14:0) and lauric acids (C12:0), but significant (p<0.05) differences were noted with regard to the rest of the fatty acids. On the other hand, LO differed significantly (p<0.05) from BF and MF with respect to all fatty acids except lauric (C12:0). This was due to the fact that both BF and MF had higher percentage of saturated fatty acids than unsaturated fatty acids when compared to LO.
LS being the higher melting fraction of lard displayed a fatty acid composition which was markedly different from that of either lard or LO. Similar to BF and MF, LS was also found to possess higher percentage of saturated fatty acids than unsaturated fatty acids. The major fatty acids of LS were palmitic (C16:0) followed by oleic (C18:1) and stearic (C18:0), comprising about 83% of the total FA distribution. These fatty acids were also the most abundant in BF and MF as reported in this study as well as previous reports (Marikkar et al. 2005). Although no significant (p>0.05) differences were noticed among LS, BF and MF with respect to lauric (C12:0), myristic (C14:0) and palmitic (C16:0) acids, there were significant (p<0.05) differences among them with regard to stearic (C18:0) and linoleic (C18:2) acids.
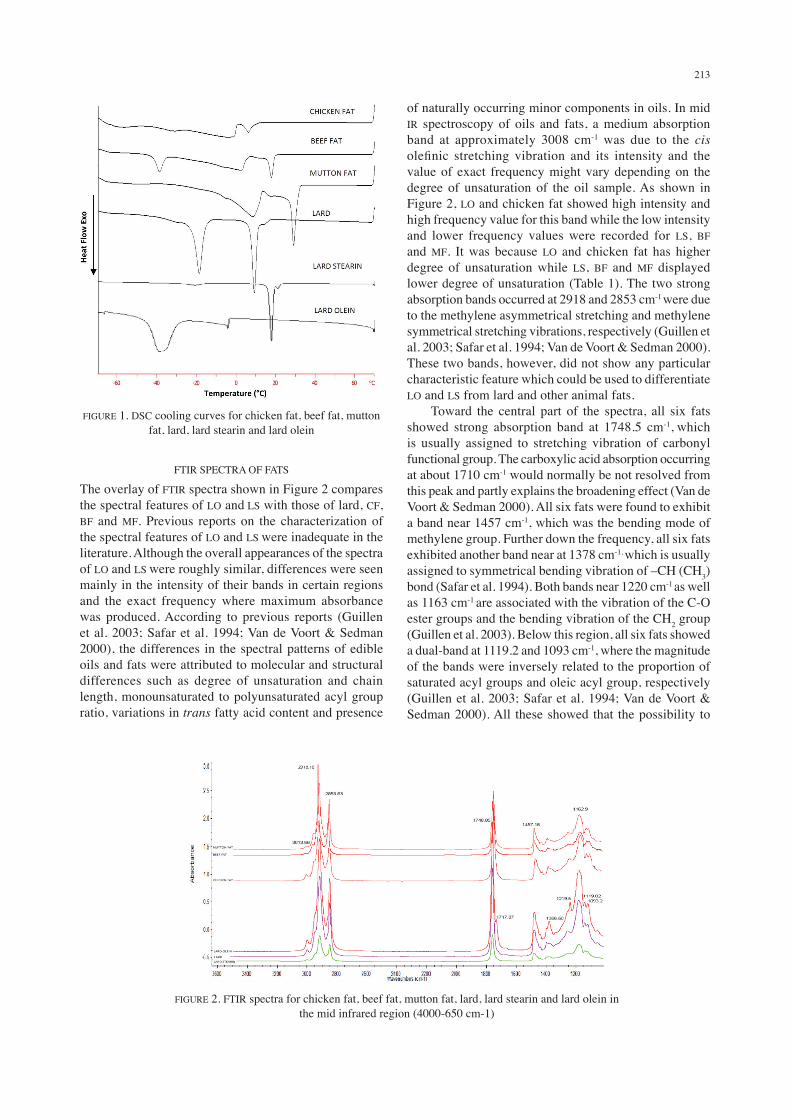
DSC COOLING CURVES OF FATS
The DSC cooling curves of LS and LO are compared to those of BF, CF and MF as shown in Figure 1. When compared to lard and other animal fats, both LS and LO displayed significant differences on the cooling curves that can easily distinguish them from the rest of the samples. For instance, the cooling curve of LO as shown in Figure 1 displayed its major exothermic transition at -36.1°C and the minor peaks at -2.5°C. In comparison to either lard or any other animal fat, it did not display any high-melting thermal transition in the temperature region above 0°C. On the other hand, other animal fats displayed cooling profiles that were more complex in nature involving multiple thermal transitions both in the high-and low-melting regions. Unlike LO, both BF and MF showed sharp thermal transitions at 18.2 and 29.0ºC, respectively. As discussed previously in other reports (Marikkar 2015; Rohman & Che Man 2010), this difference could be due to the dominance of low-melting TAG molecules largely esterified with highly-unsaturated fatty acids in LO. The high melting fraction, LS, displayed major and minor transitions at 18.4°C and 21.8°C, respectively, but no significant thermal transition was seen in the temperature range below 15.0°C. On the other hand, other animal fats displayed broad thermal transitions below 15.0°C. For instance, other animal fats namely BF, MF and CF displayed their low-melting transitions in the negative temperature region. The reason for these thermal property differences shown by LS and other animal fats could be most probably related to their TAG compositional differences. After fractionation from lard, LS has lost larger proportion of the unsaturated TAG molecules from its compositions. As more and more saturated TAG molecules get accumulated in LS during fractional crystallization, it was found to become enriched with more saturated fatty acids (Table 1). These extreme changes in the molecular composition would have strong impact on the thermal profiles displayed by lipids as discussed in several previous studies (Marikkar 2015). As a consequence, the thermal transition corresponding to the unsaturated TAG molecules in the negative temperature region was seemed to disappear in LS.
212
TAB
LE 1
. Com
paris
on o
f the
fatty
aci
d co
mpo
sitio
n (p
eak
area
%) o
f lar
d ol
ein
and
lard
star
in w
ith th
ose
of o
ther
ani
mal
fats1
Fatty
aci
dLa
rd o
lein
Lard
stea
rinLa
rdC
hick
en fa
tB
eef f
atM
utto
n fa
tC
12:0
C14
:0C
16:0
C16
:1C
18:0
C18
:1C
18:2
Oth
ers
∑SF
A∑
USF
A
0.22
±0.0
0a
1.26
±0.4
0b
21.1
6±0.
60c
1.60
±0.1
9c
7.13
±0.6
8e
43.5
7±0.
54a
21.7
6±2.
66a
3.31
30.6
966
.93
0.1±
0.00
a
1.00
±0.1
7b
29.1
5±1.
06a
0.78
±0.0
5cd
26.3
3±0.
77b
27.6
9±1.
54d
12.0
2±0.
10b
2.92
58.4
040
.49
0.58
±0.5
6a
1.27
±0.2
2b
22.7
7±0.
96bc
1.46
±0.0
7bcd
11.8
8±0.
86d
40.4
9±2.
18ab
18.2
3±3.
45a
3.18
37.5
460
.18
0.64
±0.9
3a
1.62
±0.6
5b
25.3
9±1.
01ab
5.32
±0.4
8a
4.84
±0.1
8f
43.9
4±1.
77a
18.2
6±1.
64ab
N.d
.32
.48
67.5
2
0.11
±0.0
5a
6.15
±0.3
1a
31.0
7±0.
78a
2.56
±0.0
7b
16.5
3±1.
25c
35.7
0±1.
71bc
6.59
±0.6
1c
1.28
55.5
044
.85
0.46
±0.0
6 a
6.40
±0.4
9a
27.3
8±1.
22a
0.52
±0.1
8d
30.9
0±0.
50a
29.8
2±1.
04cd
1.61
±0.0
6c
2.9
68.8
431
.95
1 Eac
h fa
tty ac
id v
alue
in th
e tab
le re
pres
ents
the m
ean
± st
anda
rd d
evia
tion
of th
ree r
eplic
ates
. Mea
ns w
ithin
each
row
with
diff
eren
t sup
ersc
ripts
are s
igni
fican
tly (p
<0.0
5) d
iffer
ent.
Abb
revi
atio
ns: S
FA, s
atur
ated
fatty
acid
; USF
A, u
nsat
urat
ed fa
tty ac
id.
213
FTIR SPECTRA OF FATS
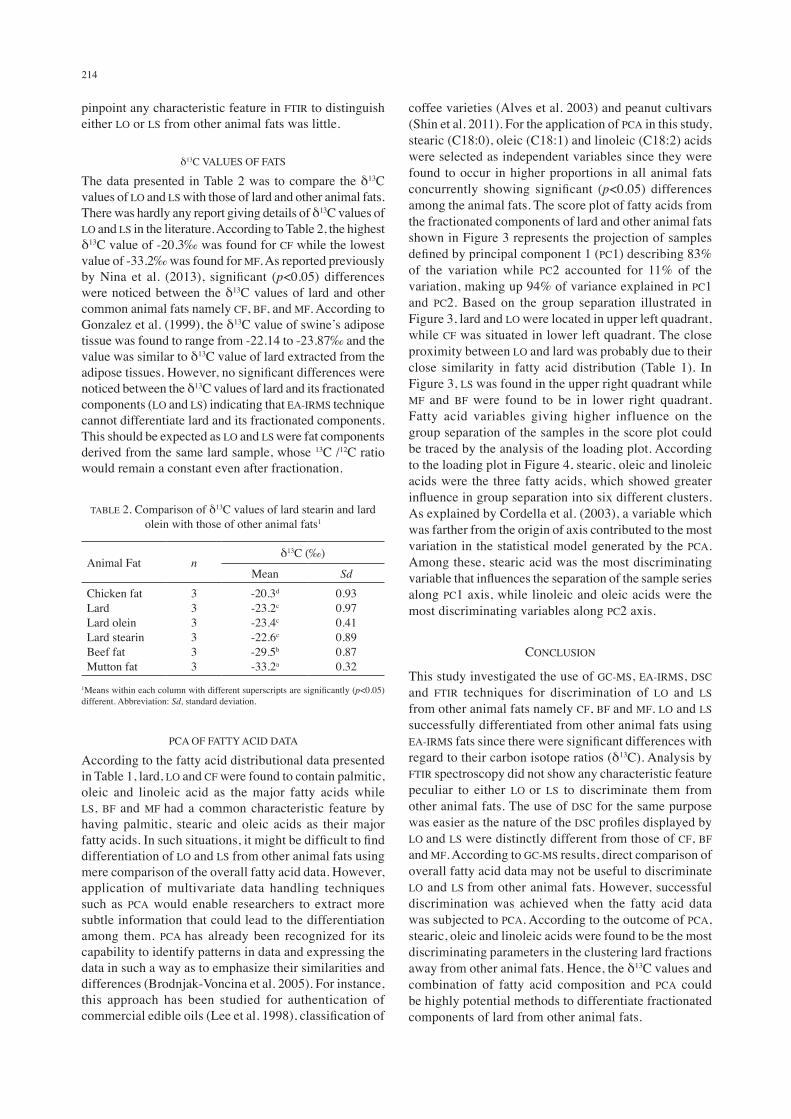
The overlay of FTIR spectra shown in Figure 2 compares the spectral features of LO and LS with those of lard, CF, BF and MF. Previous reports on the characterization of the spectral features of LO and LS were inadequate in the literature. Although the overall appearances of the spectra of LO and LS were roughly similar, differences were seen mainly in the intensity of their bands in certain regions and the exact frequency where maximum absorbance was produced. According to previous reports (Guillen et al. 2003; Safar et al. 1994; Van de Voort & Sedman 2000), the differences in the spectral patterns of edible oils and fats were attributed to molecular and structural differences such as degree of unsaturation and chain length, monounsaturated to polyunsaturated acyl group ratio, variations in trans fatty acid content and presence
of naturally occurring minor components in oils. In mid IR spectroscopy of oils and fats, a medium absorption band at approximately 3008 cm-1 was due to the cis olefinic stretching vibration and its intensity and the value of exact frequency might vary depending on the degree of unsaturation of the oil sample. As shown in Figure 2, LO and chicken fat showed high intensity and high frequency value for this band while the low intensity and lower frequency values were recorded for LS, BF and MF. It was because LO and chicken fat has higher degree of unsaturation while LS, BF and MF displayed lower degree of unsaturation (Table 1). The two strong absorption bands occurred at 2918 and 2853 cm-1 were due
to the methylene asymmetrical stretching and methylene symmetrical stretching vibrations, respectively (Guillen et al. 2003; Safar et al. 1994; Van de Voort & Sedman 2000). These two bands, however, did not show any particular characteristic feature which could be used to differentiate LO and LS from lard and other animal fats. Toward the central part of the spectra, all six fats showed strong absorption band at 1748.5 cm-1, which is usually assigned to stretching vibration of carbonyl functional group. The carboxylic acid absorption occurring at about 1710 cm-1 would normally be not resolved from this peak and partly explains the broadening effect (Van de Voort & Sedman 2000). All six fats were found to exhibit a band near 1457 cm-1, which was the bending mode of methylene group. Further down the frequency, all six fats exhibited another band near at 1378 cm-1, which is usually assigned to symmetrical bending vibration of –CH (CH3) bond (Safar et al. 1994). Both bands near 1220 cm-1 as well as 1163 cm-1 are associated with the vibration of the C-O ester groups and the bending vibration of the CH2 group (Guillen et al. 2003). Below this region, all six fats showed a dual-band at 1119.2 and 1093 cm-1, where the magnitude of the bands were inversely related to the proportion of saturated acyl groups and oleic acyl group, respectively (Guillen et al. 2003; Safar et al. 1994; Van de Voort & Sedman 2000). All these showed that the possibility to
FIGURE 1. DSC cooling curves for chicken fat, beef fat, mutton fat, lard, lard stearin and lard olein
FIGURE 2. FTIR spectra for chicken fat, beef fat, mutton fat, lard, lard stearin and lard olein in the mid infrared region (4000-650 cm-1)
214
pinpoint any characteristic feature in FTIR to distinguish either LO or LS from other animal fats was little.
δ13C VALUES OF FATS
The data presented in Table 2 was to compare the δ13C values of LO and LS with those of lard and other animal fats. There was hardly any report giving details of δ13C values of LO and LS in the literature. According to Table 2, the highest δ13C value of -20.3‰ was found for CF while the lowest value of -33.2‰ was found for MF. As reported previously by Nina et al. (2013), significant (p<0.05) differences were noticed between the δ13C values of lard and other common animal fats namely CF, BF, and MF. According to Gonzalez et al. (1999), the δ13C value of swine’s adipose tissue was found to range from -22.14 to -23.87‰ and the value was similar to δ13C value of lard extracted from the adipose tissues. However, no significant differences were noticed between the δ13C values of lard and its fractionated components (LO and LS) indicating that EA-IRMS technique cannot differentiate lard and its fractionated components. This should be expected as LO and LS were fat components derived from the same lard sample, whose 13C /12C ratio would remain a constant even after fractionation.
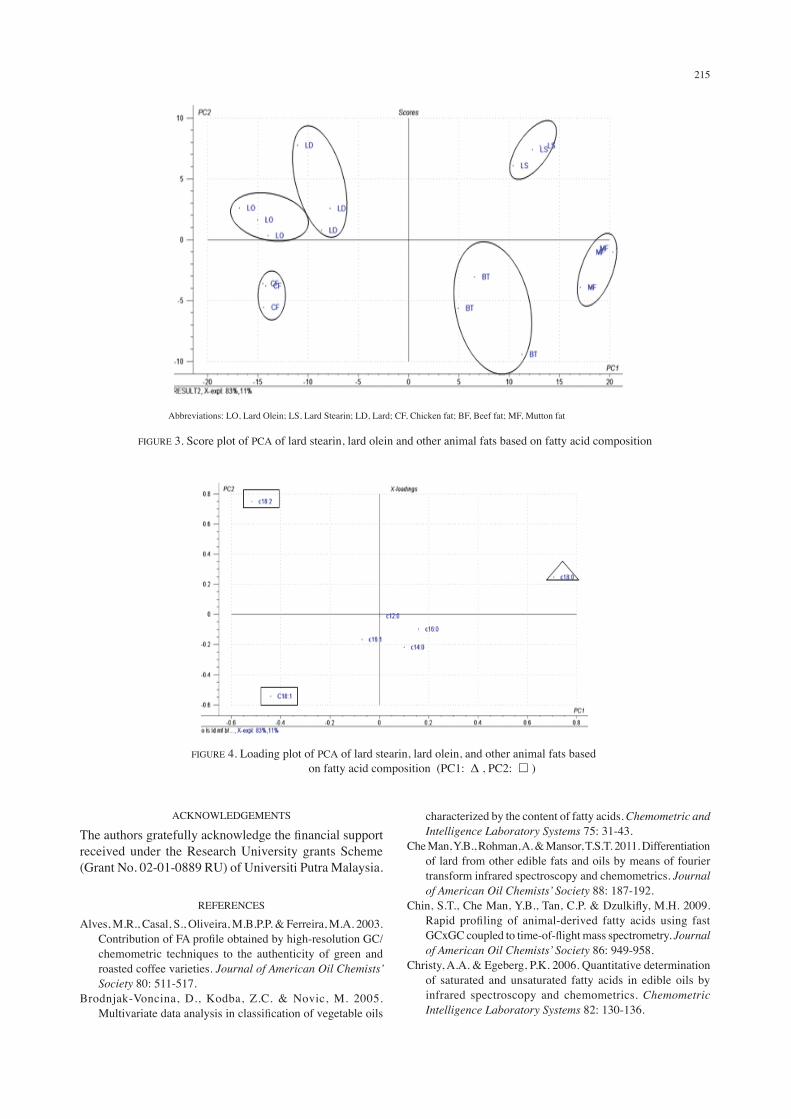
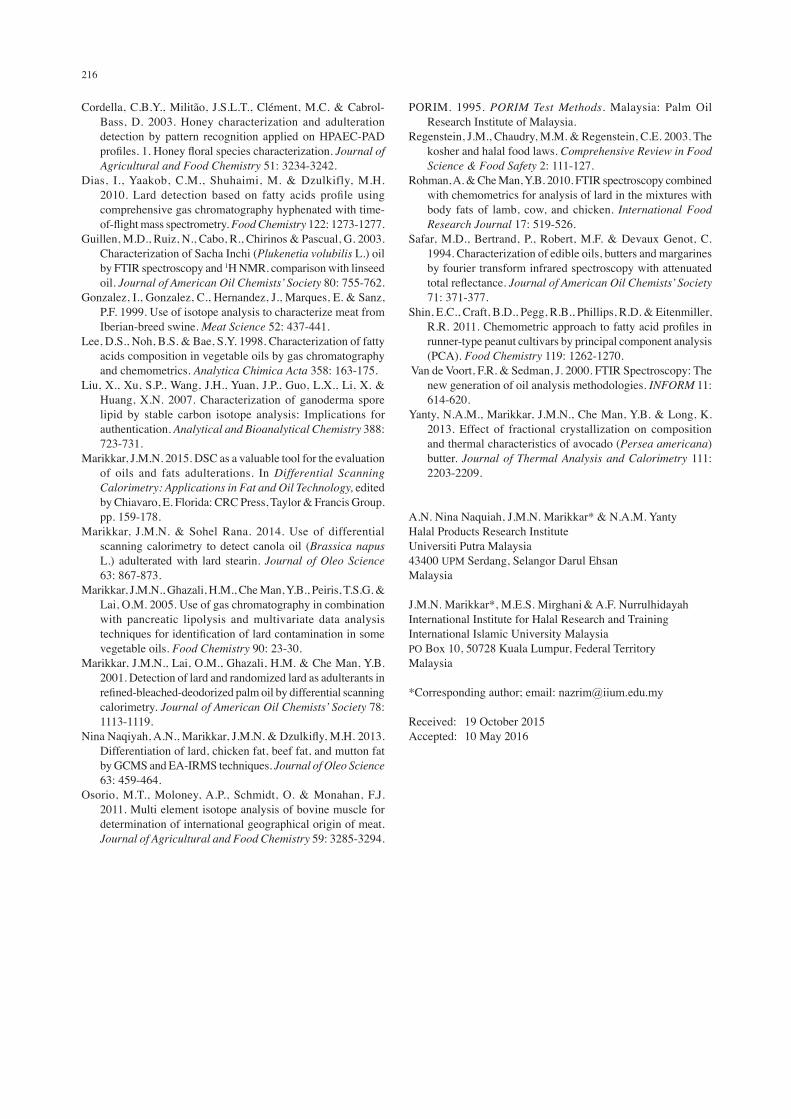
coffee varieties (Alves et al. 2003) and peanut cultivars (Shin et al. 2011). For the application of PCA in this study, stearic (C18:0), oleic (C18:1) and linoleic (C18:2) acids were selected as independent variables since they were found to occur in higher proportions in all animal fats concurrently showing significant (p<0.05) differences among the animal fats. The score plot of fatty acids from the fractionated components of lard and other animal fats shown in Figure 3 represents the projection of samples defined by principal component 1 (PC1) describing 83% of the variation while PC2 accounted for 11% of the variation, making up 94% of variance explained in PC1 and PC2. Based on the group separation illustrated in Figure 3, lard and LO were located in upper left quadrant, while CF was situated in lower left quadrant. The close proximity between LO and lard was probably due to their close similarity in fatty acid distribution (Table 1). In Figure 3, LS was found in the upper right quadrant while MF and BF were found to be in lower right quadrant. Fatty acid variables giving higher influence on the group separation of the samples in the score plot could be traced by the analysis of the loading plot. According to the loading plot in Figure 4, stearic, oleic and linoleic acids were the three fatty acids, which showed greater influence in group separation into six different clusters. As explained by Cordella et al. (2003), a variable which was farther from the origin of axis contributed to the most variation in the statistical model generated by the PCA. Among these, stearic acid was the most discriminating variable that influences the separation of the sample series along PC1 axis, while linoleic and oleic acids were the most discriminating variables along PC2 axis.
CONCLUSION
This study investigated the use of GC-MS, EA-IRMS, DSC and FTIR techniques for discrimination of LO and LS from other animal fats namely CF, BF and MF. LO and LS successfully differentiated from other animal fats using EA-IRMS fats since there were significant differences with regard to their carbon isotope ratios (δ13C). Analysis by FTIR spectroscopy did not show any characteristic feature peculiar to either LO or LS to discriminate them from other animal fats. The use of DSC for the same purpose was easier as the nature of the DSC profiles displayed by LO and LS were distinctly different from those of CF, BF and MF. According to GC-MS results, direct comparison of overall fatty acid data may not be useful to discriminate LO and LS from other animal fats. However, successful discrimination was achieved when the fatty acid data was subjected to PCA. According to the outcome of PCA, stearic, oleic and linoleic acids were found to be the most discriminating parameters in the clustering lard fractions away from other animal fats. Hence, the δ13C values and combination of fatty acid composition and PCA could be highly potential methods to differentiate fractionated components of lard from other animal fats.
TABLE 2. Comparison of δ13C values of lard stearin and lard olein with those of other animal fats1
Animal Fat nδ13C (‰)
Mean Sd
Chicken fatLardLard oleinLard stearinBeef fatMutton fat
333333
-20.3d
-23.2c
-23.4c
-22.6c
-29.5b
-33.2a
0.930.970.410.890.870.32
1Means within each column with different superscripts are significantly (p<0.05) different. Abbreviation: Sd, standard deviation.
PCA OF FATTY ACID DATA
According to the fatty acid distributional data presented in Table 1, lard, LO and CF were found to contain palmitic, oleic and linoleic acid as the major fatty acids while LS, BF and MF had a common characteristic feature by having palmitic, stearic and oleic acids as their major fatty acids. In such situations, it might be difficult to find differentiation of LO and LS from other animal fats using mere comparison of the overall fatty acid data. However, application of multivariate data handling techniques such as PCA would enable researchers to extract more subtle information that could lead to the differentiation among them. PCA has already been recognized for its capability to identify patterns in data and expressing the data in such a way as to emphasize their similarities and differences (Brodnjak-Voncina et al. 2005). For instance, this approach has been studied for authentication of commercial edible oils (Lee et al. 1998), classification of
215
ACKNOWLEDGEMENTS
The authors gratefully acknowledge the financial support received under the Research University grants Scheme (Grant No. 02-01-0889 RU) of Universiti Putra Malaysia.
REFERENCES
Alves, M.R., Casal, S., Oliveira, M.B.P.P. & Ferreira, M.A. 2003. Contribution of FA profile obtained by high-resolution GC/chemometric techniques to the authenticity of green and roasted coffee varieties. Journal of American Oil Chemists’ Society 80: 511-517.
Brodnjak-Voncina, D., Kodba, Z.C. & Novic, M. 2005. Multivariate data analysis in classification of vegetable oils
characterized by the content of fatty acids. Chemometric and Intelligence Laboratory Systems 75: 31-43.
Che Man, Y.B., Rohman, A. & Mansor, T.S.T. 2011. Differentiation of lard from other edible fats and oils by means of fourier transform infrared spectroscopy and chemometrics. Journal of American Oil Chemists’ Society 88: 187-192.
Chin, S.T., Che Man, Y.B., Tan, C.P. & Dzulkifly, M.H. 2009. Rapid profiling of animal-derived fatty acids using fast GCxGC coupled to time-of-flight mass spectrometry. Journal of American Oil Chemists’ Society 86: 949-958.
Christy, A.A. & Egeberg, P.K. 2006. Quantitative determination of saturated and unsaturated fatty acids in edible oils by infrared spectroscopy and chemometrics. Chemometric Intelligence Laboratory Systems 82: 130-136.
Abbreviations: LO, Lard Olein; LS, Lard Stearin; LD, Lard; CF, Chicken fat; BF, Beef fat; MF, Mutton fat
FIGURE 3. Score plot of PCA of lard stearin, lard olein and other animal fats based on fatty acid composition
FIGURE 4. Loading plot of PCA of lard stearin, lard olein, and other animal fats based on fatty acid composition (PC1: Δ , PC2: £ )
216
Cordella, C.B.Y., Militão, J.S.L.T., Clément, M.C. & Cabrol-Bass, D. 2003. Honey characterization and adulteration detection by pattern recognition applied on HPAEC-PAD profiles. 1. Honey floral species characterization. Journal of Agricultural and Food Chemistry 51: 3234-3242.
Dias, I., Yaakob, C.M., Shuhaimi, M. & Dzulkifly, M.H. 2010. Lard detection based on fatty acids profile using comprehensive gas chromatography hyphenated with time-of-flight mass spectrometry. Food Chemistry 122: 1273-1277.
Guillen, M.D., Ruiz, N., Cabo, R., Chirinos & Pascual, G. 2003. Characterization of Sacha Inchi (Plukenetia volubilis L.) oil by FTIR spectroscopy and 1H NMR. comparison with linseed oil. Journal of American Oil Chemists’ Society 80: 755-762.
Gonzalez, I., Gonzalez, C., Hernandez, J., Marques, E. & Sanz, P.F. 1999. Use of isotope analysis to characterize meat from Iberian-breed swine. Meat Science 52: 437-441.
Lee, D.S., Noh, B.S. & Bae, S.Y. 1998. Characterization of fatty acids composition in vegetable oils by gas chromatography and chemometrics. Analytica Chimica Acta 358: 163-175.
Liu, X., Xu, S.P., Wang, J.H., Yuan, J.P., Guo, L.X., Li, X. & Huang, X.N. 2007. Characterization of ganoderma spore lipid by stable carbon isotope analysis: Implications for authentication. Analytical and Bioanalytical Chemistry 388: 723-731.
Marikkar, J.M.N. 2015. DSC as a valuable tool for the evaluation of oils and fats adulterations. In Differential Scanning Calorimetry: Applications in Fat and Oil Technology, edited by Chiavaro, E. Florida: CRC Press, Taylor & Francis Group. pp. 159-178.
Marikkar, J.M.N. & Sohel Rana. 2014. Use of differential scanning calorimetry to detect canola oil (Brassica napus L.) adulterated with lard stearin. Journal of Oleo Science 63: 867-873.
Marikkar, J.M.N., Ghazali, H.M., Che Man, Y.B., Peiris, T.S.G. & Lai, O.M. 2005. Use of gas chromatography in combination with pancreatic lipolysis and multivariate data analysis techniques for identification of lard contamination in some vegetable oils. Food Chemistry 90: 23-30.
Marikkar, J.M.N., Lai, O.M., Ghazali, H.M. & Che Man, Y.B. 2001. Detection of lard and randomized lard as adulterants in refined-bleached-deodorized palm oil by differential scanning calorimetry. Journal of American Oil Chemists’ Society 78: 1113-1119.
Nina Naqiyah, A.N., Marikkar, J.M.N. & Dzulkifly, M.H. 2013. Differentiation of lard, chicken fat, beef fat, and mutton fat by GCMS and EA-IRMS techniques. Journal of Oleo Science 63: 459-464.
Osorio, M.T., Moloney, A.P., Schmidt, O. & Monahan, F.J. 2011. Multi element isotope analysis of bovine muscle for determination of international geographical origin of meat. Journal of Agricultural and Food Chemistry 59: 3285-3294.
PORIM. 1995. PORIM Test Methods. Malaysia: Palm Oil Research Institute of Malaysia.
Regenstein, J.M., Chaudry, M.M. & Regenstein, C.E. 2003. The kosher and halal food laws. Comprehensive Review in Food Science & Food Safety 2: 111-127.
Rohman, A. & Che Man, Y.B. 2010. FTIR spectroscopy combined with chemometrics for analysis of lard in the mixtures with body fats of lamb, cow, and chicken. International Food Research Journal 17: 519-526.
Safar, M.D., Bertrand, P., Robert, M.F. & Devaux Genot, C. 1994. Characterization of edible oils, butters and margarines by fourier transform infrared spectroscopy with attenuated total reflectance. Journal of American Oil Chemists’ Society 71: 371-377.
Shin, E.C., Craft, B.D., Pegg, R.B., Phillips, R.D. & Eitenmiller, R.R. 2011. Chemometric approach to fatty acid profiles in runner-type peanut cultivars by principal component analysis (PCA). Food Chemistry 119: 1262-1270.
Van de Voort, F.R. & Sedman, J. 2000. FTIR Spectroscopy: The new generation of oil analysis methodologies. INFORM 11: 614-620.
Yanty, N.A.M., Marikkar, J.M.N., Che Man, Y.B. & Long, K. 2013. Effect of fractional crystallization on composition and thermal characteristics of avocado (Persea americana) butter. Journal of Thermal Analysis and Calorimetry 111: 2203-2209.
A.N. Nina Naquiah, J.M.N. Marikkar* & N.A.M. YantyHalal Products Research Institute Universiti Putra Malaysia 43400 UPM Serdang, Selangor Darul Ehsan Malaysia
J.M.N. Marikkar*, M.E.S. Mirghani & A.F. Nurrulhidayah International Institute for Halal Research and TrainingInternational Islamic University MalaysiaPO Box 10, 50728 Kuala Lumpur, Federal TerritoryMalaysia
*Corresponding author; email: [email protected]
Received: 19 October 2015Accepted: 10 May 2016