characterization of paraffinic composition in crude oils
TRANSCRIPT
1
Characterization of Paraffinic Composition in Crude Oils
Hussain H. Al-Kayiem1, Wong Ning
2, and Nassir D. Mokhlif
3
1, 3 Mech. Eng Dept., Universiti Teknologi PETRONAS, 31750 Tronoh, Perak, Malaysia
2 Drilling Division, PETRONAS Carigali Sdn. Bhd. (PCSB), Level 22, PTT1, 50088 Kuala
Lumpur, Malaysia.
ABSTRACT
One of the significant risks in flow assurance management would be the deposition and gelation
of paraffin waxy in crude oils transportation. This is highly influenced by the structure of
hydrocarbons in the produced composition from the well. In this paper, investigations on the
behaviour of waxy crudes, especially in Malaysian oil basins, were carried out. The study focuses
on the carbon number distribution, wax appearance temperature (WAT) and wax content of four
crude oil samples from different field locations (named as sample-1, …, sample-4). Results show
that crude oil samples with higher mol. percentage of carbon distribution, from C₂₀ to C₄₀,
(paraffinic composition) contains higher wt% wax content, and subsequently resulting in higher
wax appearance temperature. Further similar investigations on other field locations will assist in
characterising the paraffinic composition in Malaysian oil basins.
Keywords- Carbon number distribution, Crude oil, DSC, Gas chromatography, Mass
spectrometry, Paraffinic distribution, Wax appearance temperature, Wax content.

2
INTRODUCTION
The economic viability of all offshore projects has always been the main concern of all
parties and it is highly dependable on realistic estimations of flow problems as well as associated
remedial and preventive techniques. In Malaysia, one of the identified problems concerning the
flow assurance studies would be the wax deposition in the crude oil pipeline systems. Wax
deposition occurs as crude oil generally has n-paraffins as constituents; when the wellbore
temperature falls below the wax appearance temperature (WAT), wax crystallization forms and
contributes to increase in pressure drop, reduction in productivity and subsequently choking the
production lines, causing emergency shutdown.
Crude oils in Malaysia have been found to contain significant quantities of wax where
those with high paraffin and pour point are generally classified as waxy crude. In subsea
completion (where flowlines on the ocean floor ranges about 1.5°C to 5°C), each wax
component becomes less soluble until the higher molecular weight components solidify. The
onset crystallization is known as the cloud point or WAT. As the waxy crudes continue to cool
to the temperature below WAT, the crude’s flow properties change from a simple Newtonian
fluid to a two-phase dispersion non-Newtonian fluid. This results in gelation of crudes and loss
in flow-ability.
Currently, a few preventive and curative methods have been developed to handle flow
assurance risks imposed by waxy crudes, which fall under three major categories: thermal,
mechanical and chemical. However, all the methods have certain disadvantages and tend to
increase the operating expenses (Ewkeribe, 2008). Furthermore, the production problems and
developed solutions vary from reservoir to reservoir due to difference in paraffinic
characteristics and contents.
3
As methods that are proven to be effective in certain system do not guarantee success in
problem solving of other reservoirs or even in various wells within the same reservoir, it is
essential to study and characterize the paraffin in crudes, specifically, in order to counter the wax
deposition in wells. Therefore, this paper aims to study and characterize the behaviour of some
Malaysian crudes, through experimental measurement to further determine and analyze the
carbon number distribution, WAT and wax content. Due to the confidentiality restrictions as needed
by the client, the samples will be denoted as sample1, sample2, sample3, and sample4. The study is
carried out in two major phases: experimental measurement as well as analytical prediction.
ANALYSIS OF WAXY CRUDES
Despite the compositional complexity, most crude oils behave as simple Newtonian liquids
at high temperature, typically above 40°C. At this point, crude oils have certain viscosity at the
given temperature. The viscosity of the crude oils can also be predicted accurately through
corresponding states models or correlations in measurable physical properties such as density
(Pedersen and Ronningsen, 1999). However, as the temperature reaches the WAT, wax
precipitation occurs, causing an increase in viscosity and pressure drop in pipelines. When the
concentration of wax particles is sufficiently high, the flow properties of the crude oil will
gradually change from Newtonian to non-Newtonian behaviour. According to Lee (2003), the
transition takes place at the temperature about 10°C to 15°C below the WAT and corresponds
with a solid wax fraction of 1 to 2 wt%. As the temperature approaches the pour point, the crude
oils exhibit a gel-like form which is of highly non-Newtonian behaviour. The weight percent of
solid wax reaches about 4 to 5% at this point. The properties of crude oils are unpredictable in
the state of non-Newtonian behaviour.

4
Carbon number distribution
Generally, crude oils contain mixture of light and heavy hydrocarbons that can be classified
as paraffins, napthenes and aromatics. The lighter parts of the crude oils keep the heavier parts
(wax and asphaltene) in solution. The presence of light ends increases the solubility of wax in
crude oils, besides depending on pressure, temperature and composition of crude oils.
The paraffin in crude oil is of those normal hydrocarbons with high carbon number.
Normal hydrocarbons that composed of more than 16 carbons are called “wax”, (Biao and
Lijian, 1995). The wax in crude oils is a mixture of normal hydrocarbons with different carbon
number distributions. Describing the hydrocarbon composition of the wax in crude, Kok and
Saracoglu, 2000 stated that there are two types of wax which are commonly found in crude oils;
macrocrystalline wax (from C₁₈ to C₃₆) and microcrystalline wax (from C₃₀ to C₆₀) which both
are made up of aligned paraffinic and napthenic molecules,. Paraffin waxes are also known as
macrocrystalline waxes which composed of mainly straight-chain paraffins (n-alkanes) with
varying chain length; whereas, microcrystalline or amorphous waxes contains high portion of
isoparaffins (cycloalkanes) and napthenes, (Elsharkawy et al. 1999). The presence of these solid
particles causes the change of flow behaviour from Newtonian to non-Newtonian, especially
paraffin waxes which respond easily to changes in temperature due to its straight-chain structure.
To design pipelines and to handle the facilities for waxy crude oils, it is important to know
the amount of wax that will precipitate when the crude oil is exposed to the lowest temperature.
By having carbon number distributions and sub-classifications of wax at different temperature
plus Differential Scanning Calorimetry (DSC) data, solid fluid phase behaviour can be modelled
and correlated using various methods, including specifically-modified versions of Hildebrand’s
5
Regular Solution Theory (Carnahan 2007). Analyses for the precipitated wax also reveal a quasi-
rectilinear correlation between log mass percentage wax and carbon number, Peters et al, 1988.
Modern calculations method which based on principles of thermodynamics of solutions also can
accurately describe the solution behaviour of waxes in crude oils.
Thermal analysis
Data obtained from DSC illustrate the exothermic process (cooling) and the endothermic
process (heating), the onset crystallization temperature (also known as WAT) and the dissolution
temperature. The plot also would reveal two characteristic peaks: liquid-solid transition and
solid-solid crystalline. From the DSC thermal analysis data, the wax content can be identified
through analysis method developed by Chen et al. 2003. The wax content of the crude oil is
proposed and proved to be the Q (total thermal effect of wax precipitation) ratio of crude oil and
its corresponding wax obtained by using standard acetone method, i.e. . The proposed
method is proved to be in good agreement with those determined by standard acetone method,
with an absolute average deviation of 0.82 wt% (Chen et al., 2003).
To determine the wax content by using DSC, base-line computation and the knowledge of
experimental equation are required. The base-line for crude oil is generally
assumed to be: (1) a line between the end of the exothermal effect after the glass transition
temperature and the end of the dissolution of wax, or (2) a straight line computed by least-squares
fitting with the values of calorimetric signal included the temperature range from wax appearance
temperature range from WAT to 10K above (Ewkeribe 2008).
According to the method proposed by Chen et al. 2003, wax content of crude oil can be
determined by using total thermal effect Q ratio of the crude oil and the corresponding wax

6
sample obtained by standard acetone method. The total thermal effect Q of wax precipitation can
be computed by integrating the area between DSC calorimetric signal curve and the line
connecting the two temperature signals. Empirical correlations also have been established, where:
The linear relation between the Qoil and the corresponding wax contents determined by
method can be expressed with a correlation coefficient of
(1)
The linear relationship between the and the corresponding wax contents determined
by the standard acetone method can be expressed with a correlation coefficient of
(2)
The established correlations provide a new method to improve the accuracy of computing the
amount of precipitated wax in crude oils at different temperature.
EXPERIMENTAL METHODOLOGY
Successful experimental tests of crudes, using standard equipment requires proper sample
preparation. Accordingly, the preparation procedure is detailed in this paper. Descriptions of the
used equipment and measurement procedures are also included in the paper
Preparation of samples
A total of four crude oil samples have been received from different production fields in
Malaysia, named as sample1 to sample4.
As the samples come in bulk volume (around 4L to 5L), the samples were firstly heated to
80°C for 8 hours in water bath to eliminate the thermal history as well as to avoid separation of
heavy crudes and light crudes, as recommended by Wikipedia – Gas Chromatography Mass
Spectrometry. (Retrieved on March 10, 2012).

7
Throughout the heating process, the samples were stirred from time to time to ensure
complete dissolution and homogeneity. The samples were then transferred to small-sized
containers while the temperature is still relatively high. The preparation work done helps to
shorten the heating process prior to future experimental measurements as smaller volume is
involved. Only an average of 1 hour to 2 hours was required for pre-heating before the
commencement of future experimental measurements.
Gas Chromatography Mass Spectrometry (GCMS)
In this project, GCMS is used as it combines the features of gas-liquid chromatography and
mass spectrometry to identify different substance within a test sample which is the carbon number
distribution in the crude oil samples. By using GCMS, a much finer degree of substance
identification is allowed than when either unit is used separately. This is because the mass
spectrometry process requires very pure samples while gas chromatography uses traditional
detector. Combining the two processes reduces the possibility of error as it is extremely unlikely
for two different molecules to behave in the same way in two different processes.
Fig. 1: Schematic Diagram of A GCMS [Wikipedia]
8
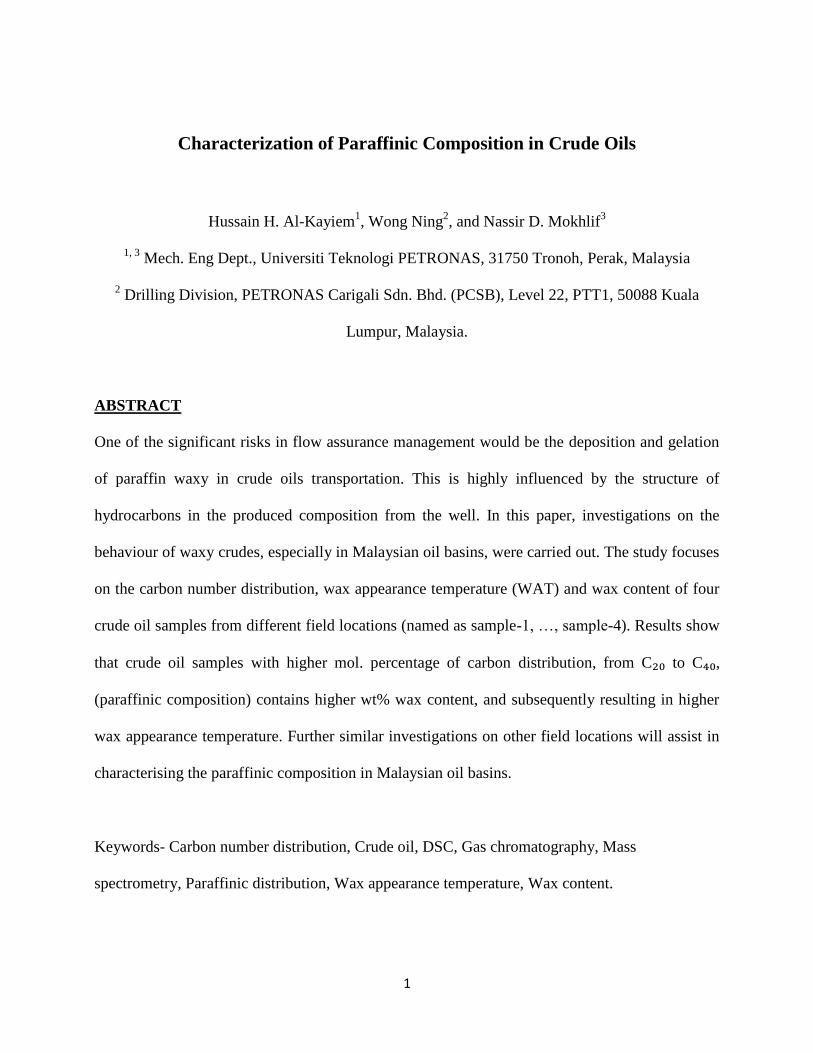
Fig. 2: Shimadzu 5050 GC Coupled with Shidmadzu 5973 with Mass Selective Detector
GCMS used for the experimental measurement is Shimadzu 5050 GC coupled with
Shimadzu 5973 with mass selective detector. The chosen column for the experiment is DB-5
capillary column with length of 30 meters, inner diameter of 0.32 millimetres and phase thickness
of 0.25 millimetres. The procedure of the experiment was commenced by setting the temperature
to be 120°C hold for 3 minutes until it reached maximum temperature of 270°C and hold for 40
minutes. Temperature increasing rate was set to be 10°C/min. At the temperature of 300°C,
splitless injection was carried out with constant flow rate of 2cm³/min. The Mass Spectrometry
(MS) transfer line was set at 300°C and the ion source was kept at 230°C. The same procedure
was applied for the four samples of crudes.
Differential Scanning Calorimetry (DSC)
When heated and cooled at specific cooling rate, DSC measures the difference in absorbed
or released heat between two samples, which are the reference and the test sample. The reference
material used has identified properties and was thermally inert over the specified temperature
range. Due to the release of the crystallization heat, the test sample at WAT cools slower than the
reference. Changes are captured by the analyzer in order to compute the difference in required

9
heat input to maintain the temperature of both reference and test sample equally. If a sample’s
enthalpy of fusion is known, the weight fraction of crystallized wax also can be calculated. Solid
weight as a function of temperature defines the solubility curve for the past sample.
Fig. 3.a: Differential Scanning Calorimetry
Prior to thermal analysis using DSC, Thermal Gravimetric Analyzer (TGA) was carried out
to investigate the changes in weight in relation to temperature change. A derivative weight loss
curve can identify the point where weight loss is the most apparent. The boiling point can also be
determined as TGA is acting of heat which is high enough to temperature for the components to
decompose into the gas, where it is dissociates into air. Hence, the maximum heating temperature
of DSC should be set lower than the boiling point to prevent vaporization of the crude oil
samples. Simultaneous TGA-DSC helps to measure heat flow and weight changes in a sample as
a function of temperature. The complementary information obtained allows differentiation
between endothermic and exothermic events with no associated weight loss, such as melting and
crystallization.

10
Fig. 3.b Thermal Gravimetric Analyzer (TGA)
RESULT AND DISCUSSION
Carbon number distribution
From the GCMS, the experimental measurements are shown in the form of chromatogram
where the peaks represent the types of component present in the compound of the crude, as shown
in Fig. 4, for sample-1.
11
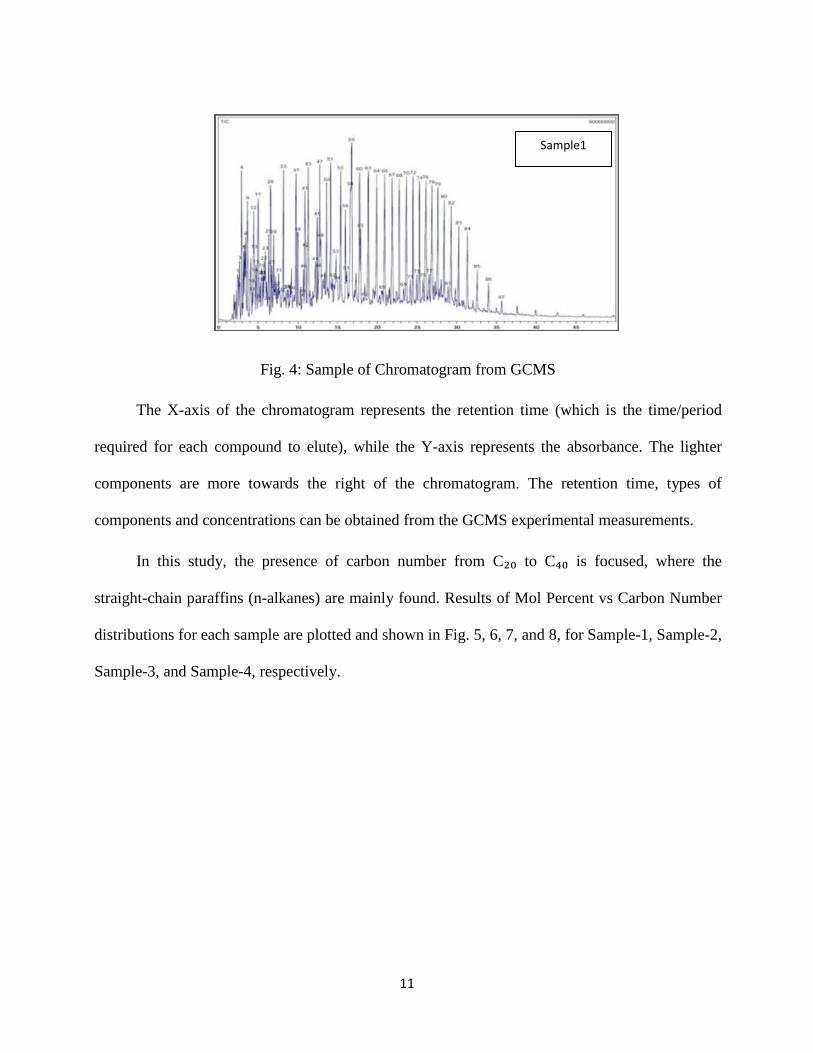
Fig. 4: Sample of Chromatogram from GCMS
The X-axis of the chromatogram represents the retention time (which is the time/period
required for each compound to elute), while the Y-axis represents the absorbance. The lighter
components are more towards the right of the chromatogram. The retention time, types of
components and concentrations can be obtained from the GCMS experimental measurements.
In this study, the presence of carbon number from C₂₀ to C₄₀ is focused, where the
straight-chain paraffins (n-alkanes) are mainly found. Results of Mol Percent vs Carbon Number
distributions for each sample are plotted and shown in Fig. 5, 6, 7, and 8, for Sample-1, Sample-2,
Sample-3, and Sample-4, respectively.
Sample1

12
Fig. 5: Measured Mol Percent vs Carbon Number of crude sample-1
Fig. 6: Measured Mol Percent Vs Carbon Number of crude Sample-2
0.00
1.00
2.00
3.00
4.00
5.00
6.00
C₁
C₆
C₁₁
C₁₆
C₂₁
C₂₆
C₃₁
C₃₆
C₄₁
C₄₆
C₅₁
C₅₆
C₆₁
C₆₆
C₇₁
C₇₆
C₈₁
C₈₆
Mo
l Per
cen
t
Carbon Number
Sample-1
0.00
1.00
2.00
3.00
4.00
5.00
6.00
C₁
C₆
C₁₁
C₁₆
C₂₁
C₂₆
C₃₁
C₃₆
C₄₁
C₄₆
C₅₁
C₅₆
C₆₁
C₆₆
C₇₁
C₇₆
C₈₁
C₈₆
C₉₁
C₉₆
Mo
l Per
cen
t
Carbon Number
Sample-2
13
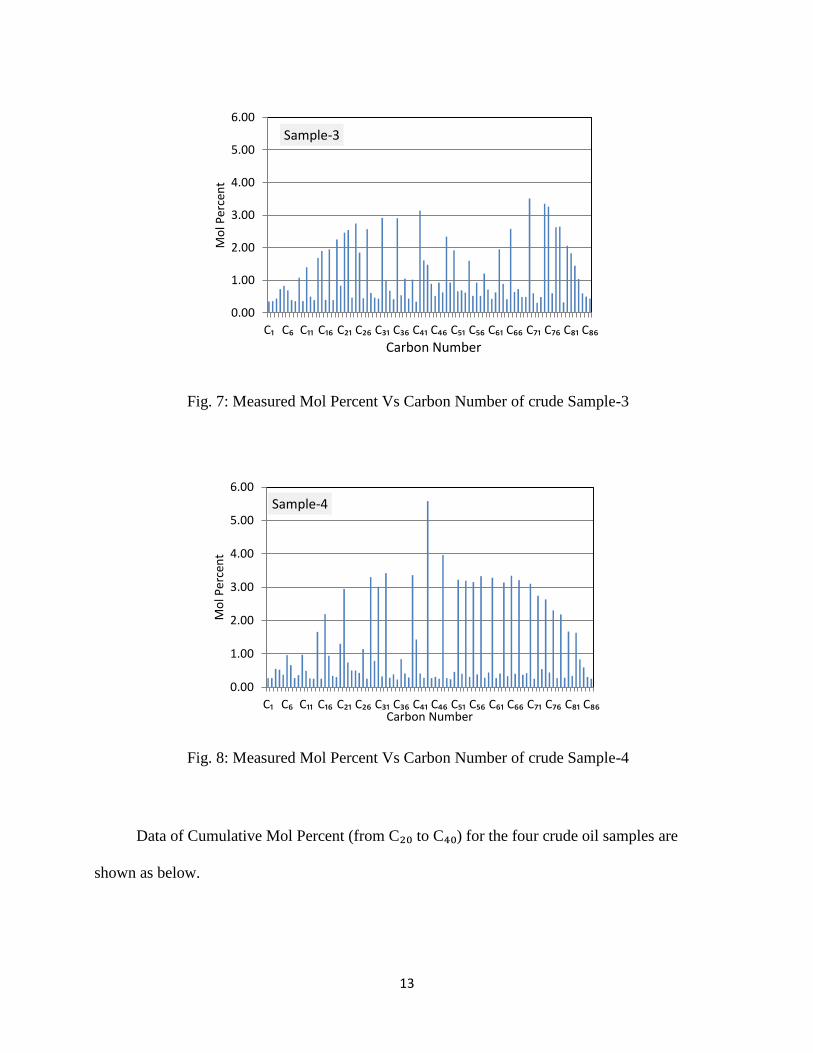
Fig. 7: Measured Mol Percent Vs Carbon Number of crude Sample-3
Fig. 8: Measured Mol Percent Vs Carbon Number of crude Sample-4
Data of Cumulative Mol Percent (from C₂₀ to C₄₀) for the four crude oil samples are
shown as below.
0.00
1.00
2.00
3.00
4.00
5.00
6.00
C₁ C₆ C₁₁ C₁₆ C₂₁ C₂₆ C₃₁ C₃₆ C₄₁ C₄₆ C₅₁ C₅₆ C₆₁ C₆₆ C₇₁ C₇₆ C₈₁ C₈₆
Mo
l Per
cen
t
Carbon Number
Sample-3
0.00
1.00
2.00
3.00
4.00
5.00
6.00
C₁ C₆ C₁₁ C₁₆ C₂₁ C₂₆ C₃₁ C₃₆ C₄₁ C₄₆ C₅₁ C₅₆ C₆₁ C₆₆ C₇₁ C₇₆ C₈₁ C₈₆
Mo
l Per
cen
t
Carbon Number
Sample-4
14
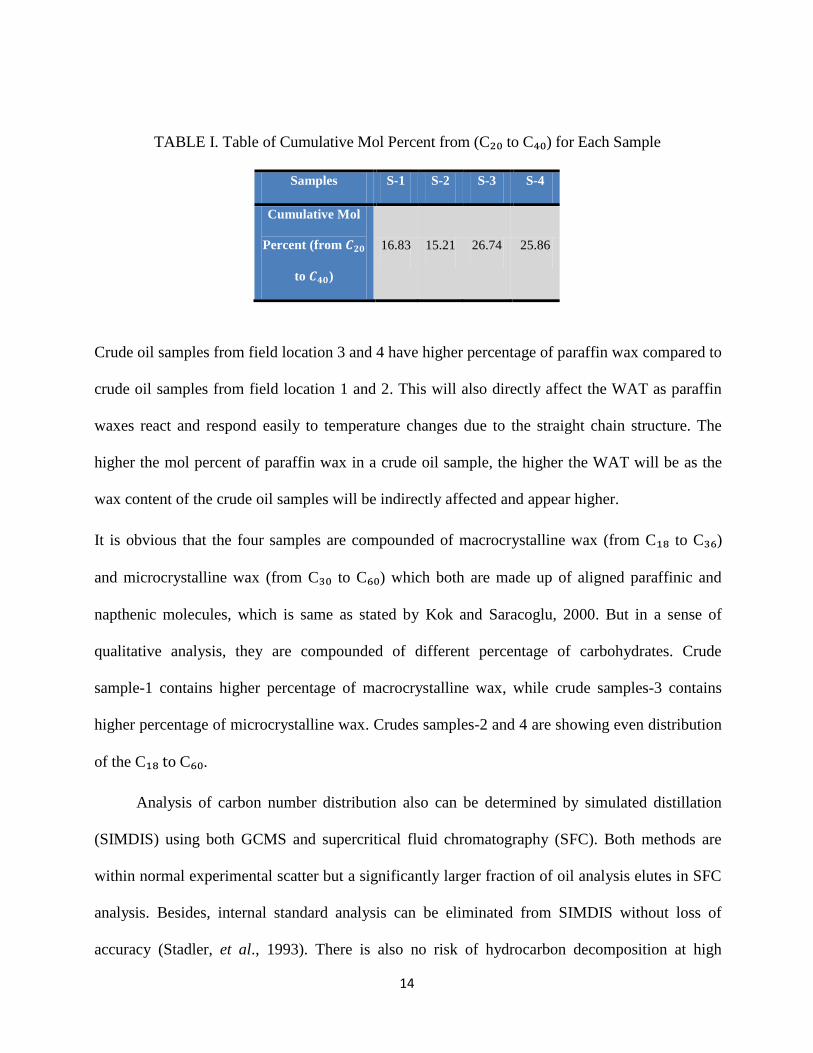
TABLE I. Table of Cumulative Mol Percent from (C₂₀ to C₄₀) for Each Sample
Samples S-1 S-2 S-3 S-4
Cumulative Mol
Percent (from
to )
16.83 15.21 26.74 25.86
Crude oil samples from field location 3 and 4 have higher percentage of paraffin wax compared to
crude oil samples from field location 1 and 2. This will also directly affect the WAT as paraffin
waxes react and respond easily to temperature changes due to the straight chain structure. The
higher the mol percent of paraffin wax in a crude oil sample, the higher the WAT will be as the
wax content of the crude oil samples will be indirectly affected and appear higher.
It is obvious that the four samples are compounded of macrocrystalline wax (from C₁₈ to C₃₆)
and microcrystalline wax (from C₃₀ to C₆₀) which both are made up of aligned paraffinic and
napthenic molecules, which is same as stated by Kok and Saracoglu, 2000. But in a sense of
qualitative analysis, they are compounded of different percentage of carbohydrates. Crude
sample-1 contains higher percentage of macrocrystalline wax, while crude samples-3 contains
higher percentage of microcrystalline wax. Crudes samples-2 and 4 are showing even distribution
of the C₁₈ to C₆₀.
Analysis of carbon number distribution also can be determined by simulated distillation
(SIMDIS) using both GCMS and supercritical fluid chromatography (SFC). Both methods are
within normal experimental scatter but a significantly larger fraction of oil analysis elutes in SFC
analysis. Besides, internal standard analysis can be eliminated from SIMDIS without loss of
accuracy (Stadler, et al., 1993). There is also no risk of hydrocarbon decomposition at high

15
temperature.
Wax appearance temperature (WAT) and wax content
From the DSC experimental measurement, WAT and wax content of the crude oil samples
can be identified. The results are shown as below:
Fig. 9: Heat Flow Vs Temperature measured by the DSC for sample-1.
Fig. 10: Heat Flow Vs Temperature measured by the DSC for sample-2.
16
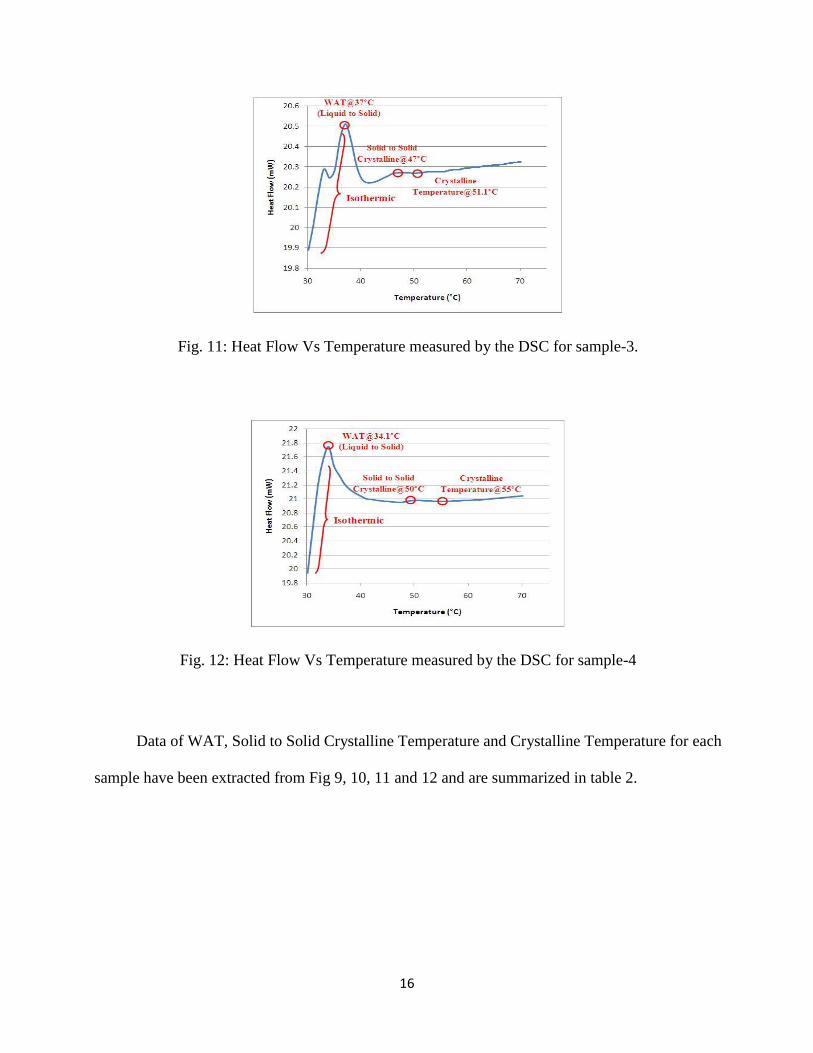
Fig. 11: Heat Flow Vs Temperature measured by the DSC for sample-3.
Fig. 12: Heat Flow Vs Temperature measured by the DSC for sample-4
Data of WAT, Solid to Solid Crystalline Temperature and Crystalline Temperature for each
sample have been extracted from Fig 9, 10, 11 and 12 and are summarized in table 2.
17
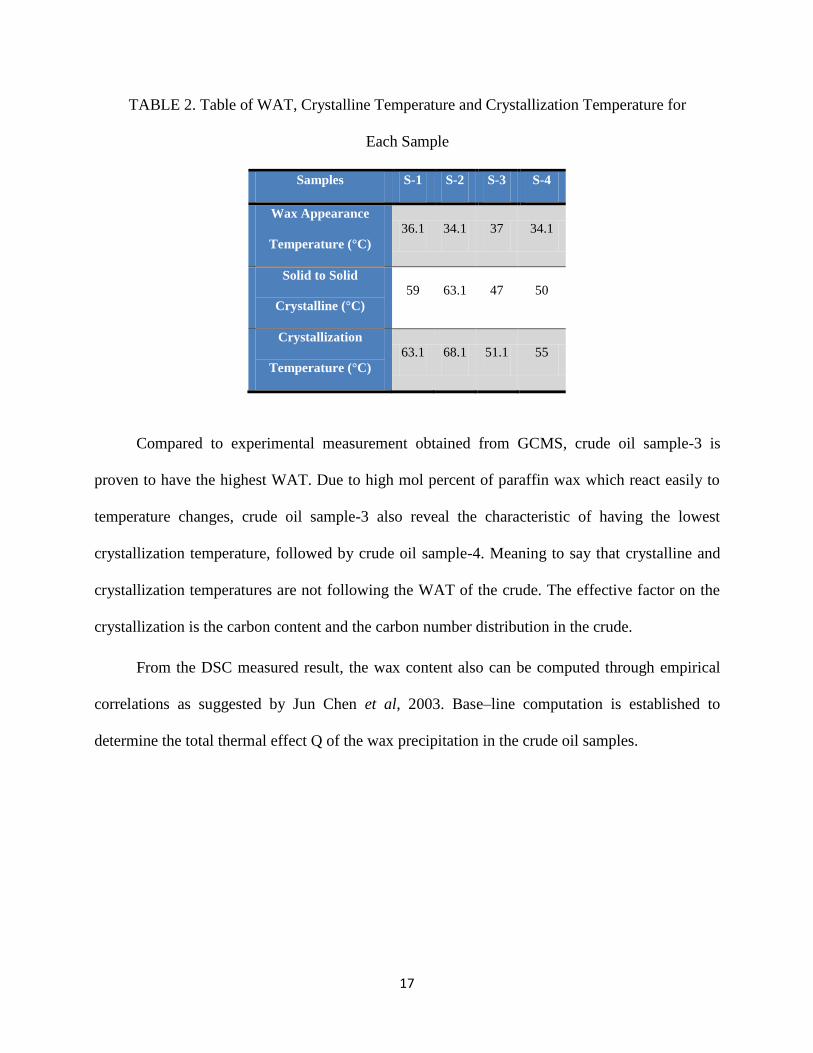
TABLE 2. Table of WAT, Crystalline Temperature and Crystallization Temperature for
Each Sample
Samples S-1 S-2 S-3 S-4
Wax Appearance
Temperature (°C)
36.1 34.1 37 34.1
Solid to Solid
Crystalline (°C)
59 63.1 47 50
Crystallization
Temperature (°C)
63.1 68.1 51.1 55
Compared to experimental measurement obtained from GCMS, crude oil sample-3 is
proven to have the highest WAT. Due to high mol percent of paraffin wax which react easily to
temperature changes, crude oil sample-3 also reveal the characteristic of having the lowest
crystallization temperature, followed by crude oil sample-4. Meaning to say that crystalline and
crystallization temperatures are not following the WAT of the crude. The effective factor on the
crystallization is the carbon content and the carbon number distribution in the crude.
From the DSC measured result, the wax content also can be computed through empirical
correlations as suggested by Jun Chen et al, 2003. Base–line computation is established to
determine the total thermal effect Q of the wax precipitation in the crude oil samples.

18
Fig. 13: A Sample of DSC Base-line Computation.
By using the suggested empirical formula, which establishes the relationship between the
heat released and the wax content, the prediction of the wax content from the measure of the total
heat is allowed. The result of the wax content (wt%) for each sample is shown as below:
TABLE 3. Table of Wax Content for Each Sample
Samples S-1 S-2 S-3 S-4
Wax
Content
(wt%)
28.90 25.83 33.65 27.35
In order to achieve higher accuracy, more approaches can be utilized for data comparison. For
example, to determine the WAT, Cross Polar Microscopy (CPM) and viscometer can be used for
data comparison with those generated from DSC (Kelechukwu and Yassin, 2008).
CONCLUSION
From the determined research methodology, data and result from the experimental
19
measurement will be able to indicate the key parameters for the characterization of waxy crudes
in Malaysia. The carbon number distributions can be obtained by using GCMS; while, WAT and
wax-temperature profile can be obtained from thermal analysis using DSC. Through the DSC
base-line computation and empirical correlation suggested by the literature, the wax content of
each sample can be calculated.
The characterization of the paraffinic composition in crude oil samples from different four
oil fields in Malaysia have been investigated and established in order to assist the prediction of
wax precipitation in respective field locations.
The work also can be further expanded and developed to investigate more waxy crude
samples from other different field locations in Malaysia to assist in deeper understanding of the
crudes’ behaviour and subsequently establish the most economical and effective solutions to
counter the wax deposition in wells.
ACKNOWLEDGEMENT
The authors acknowledge the strong support received from Universiti Teknologi
PETRONAS, who have provided funding and facilities throughout the research study.
REFERENCE
Ewkeribe, C.K., 2008. Quiescent Gelation of Waxy Crudes and Restart of Shut-in Subsea
Pipelines, University of Oklahoma, Norman, Oklahoma.
Pedersen, K.S., and Hans P. Ronningsen, 1999. Effect of Precipitated Wax on Viscosity-A Model
for Predicting Non-Newtonian Viscosity of Crude Oils,” STATOIL, Stavanger, Norway, Report
20
Number 43-51.
Lee, H., 2003. A Generalized Model for Predicting non-Newtonian Viscosity of Waxy Crudes as a
Function of Temperature. Report Number Fuel 82, 1387-1397, University of Petroleum, Beijing.
Biao, W. and Dong Lijian, 1995. Paraffinic Characteristics of Waxy Crude Oils in China and the
Methods of Paraffin Removal and Inhibition, Research Inst. of Petrol. R&D of CNPC, China,
SPE 29954.
Kok, M.V. and Onder Saracoglu, 2000. Mathematical Modeling of Wax Deposition in Crude Oil
Pipeline Systems, Middle East Technical University, Ankara-Turkey, SPE 64514.
Elsharkawy, A.M., Taher A. Al-Sahhaf, Mohamed A. Fahim, and Wafaa Al-Zabbai, 1999.
Determination and Prediction of Wax Deposition from Kuwaiti Crude Oils, Kuwait University,
Safat, Kuwait, SPE 54006.
Carnahan, F.N., 2007. Wax Properties and Behaviour in Offshore Production and Transportation
Systems, Carnahan Corp., Houston, Texas, USA, OTC 18997.
Peters, C.J., de Swaan Arons, J., Levent Sengers, J.M.H., and Gallagher, J.S., 1988. Global Phase
Behaviour of Mixtures of Short and Long n-Alkanas”, AICHE, Vol.34, No.5, pp834-839.
21
Chen, J., Zhang, J.J. and Li, H., 2003. Determining the Wax Content of Crude Oils by Using
Differential Scanning Calorimetry, University of Petroleum, Beijing, PR China, Report Number
23-26.
Wikipedia, Schematic Diagram of a Gas Chromatography Mass Spectrometry, Retrieved in
March 2012 from http://en.wikipedia.org/wiki/Gas_chromatography-mass_spectrometry.
Stadler, M.P., M.D. Deo and F.M. Orr Jr., 1993. Crude Oil Characterization Using Gas
Chromatography and Supercritical Fluid Chromatography, University of Stanford, SPE 25191.
Kelechukwu, E.M. and Abu Azam Md Yassin, 2008. Potential Risk of Paraffin-Wax-Related
Problems in Malaysian Oil Fields, Universiti Teknologi Malaysia, Skudai, Johor Bahru,
Malaysia, Jurnal Teknologi, 49(F) Dis. 2008: 1-7.