nutrient composition of selected cooked and processed snack...
TRANSCRIPT
Pertanika 12(1), 15-25 (1989)
Nutrient Composition ofSelected Cooked and Processed Snack Foods
E.S. TEE, S. SITI MIZURA, A. ANUAR,l R. KULADEVAN,S.1. YOUNG, S.c. KHOR, and S.K. CHIN.
Division of Human NutritionInstitute for Medical Research, 50588 Kuala Lumpur, Malaysia
ABSTRAKKandungan wt di dalam 27 makanan ringan yang dimasak dan 19 yang diproses telah dikaji. Kebanyakanmakanan yang dimasak itu berasaskan bijirin, dibuat daripada tepung gandum, beras dan tepung beras,dan hampir kesemuanya adalah kuih atau masakan tradisional Malaysia. Makanan ringan yang diprosesterdiri dari hasil-hasil coklat, bijirin, ikan dan udang. Kandungan 19 wt dalam setiap 1DOg bahagian yangboleh dimakan telah dibentangkan. Kandungan wt yang terpilih dalam setiap hidangan atau bungkusanmakananjuga dibentangkan. Laporan ini bermaksud untuk membantu menambahkan pengetahuan mengenaidata komposisi makanan ringan tempatan. Bilangan makanan yang telah dikaji hanyalah sebahagian kecildaripada jumlah yang sedia ada. Memandangkan data seperti ini amat berkurangan, lebih banyak kajianperlu dijalankan dalam bidang ini untuk memenuhi permintaan data yang kian meningkat.
ABSTRACTNutrient composition of 27 cooked snack foods and 19 processed snacks was determined. The cooked foods weremostly cereal based, made from wheat flour, rice or rice flour, and almost all of them were traditional Malaysiankuih or dishes. The processed snacks studied were chocolate, cereal, tuber, fish and prawn products. The levelsof 19 nutrients were tabulated, expressed as per 100 g edible portion. Selected nutrients in each serving orpacket of the foods were also presented. The paper is intended as a contribution to the knowledge on nutrientcomposition of local snack foods, for which information is still greatly lacking. The number offoods studiedis only a fraction of the total number available. More work in this area will have to be carried out, to meetthe increasing demand for such data.
INTRODUCTIONThe role of snack foods in the nutntIOn ofchildren in Malaysia has recently been givenconsiderable attention. Tee (1979) had emphasized the importance of selling nutritious snackfoods in school canteens. Zanariah (1986) dealtwith some aspects of the controversy surrounding the nutritive value of snack foods. Aminahet at. (1987) reported the consumption of snackfoods by rural primary school. children in Kedah.Various newspapers and magazines have alsohighlighted the issue from time to time.
Data on the nutritive value of snack foodsis lacking. The food composition table for usein Malaysia (Tee, 1985) also does not providefigures for these foods. Of late, there has
been more studies on these foods. In fact,there has been greater emphasis on studying the nutrient composition of cooked foodsin general, to meet the increasing demandfor such data (Tee et at. 1986). The worksof Tee et al. (1979) and Mohamad Nordin(1983) provide some data on Malaysiancooked foods, whereas more recently, Zanariah(1986) and Aminah et al. (1987) reportedthe level of some nutrients in selectedsnack foods.
This report is aimed at contributing tothe knowledge on food composition data oflocal foods. The composition of 19 nutrients ofover 40 types of commonly consumed snackfoods is reported.
1Food Quality Control Unit, Ministry of Health Malaysia, Kuala Lumpur.
E.S. TEE, S. SITI MIZ RA., A. AN CAR, R. K LADEVAN, 5.1. YO NC, S.c. KHORAND S.K. CHIN.
RESULTS AND DISCUSSION
saponification mixture and then chromatographed on a column of alumina. The provitamin and vitamin A thus separated were readseparately in a spectrophotometer. Total vitaminA activity in the food was calculated from thesum of retinol concentration and 1/6 the concentration of carotene ("VHO 1967), and expressed as llg retinol equivalent (RE). Thiaminewas determined using the thiochrome procedure, whilst riboflavin was estimated in afluorometer. Niacin concentration was calorimetrically determined after reaction withcyanogen bromide and sulphanilic acid. Theindophenol dye titration method was used forthe estimation of ascorbic acid content ofthe foods.
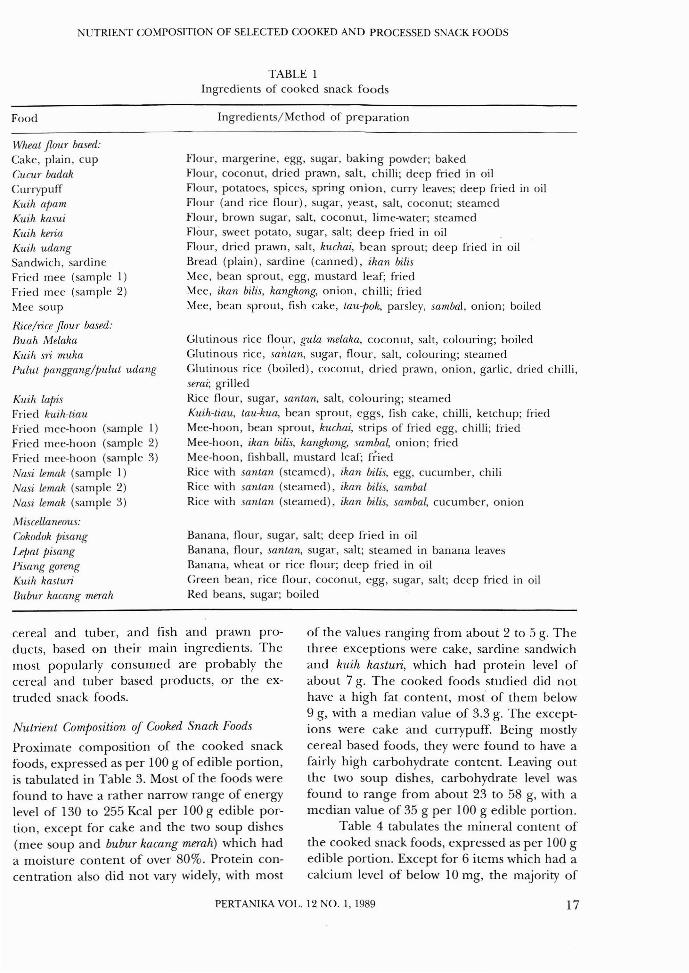
Types oj Snack Foods and IngredientsThe 27 cooked snack foods analysed are listedin Table 1. Ingredients of the foods studied arealso given in the table. Where appropriate, themethod of preparation of the food is alsoindicated. The word 'snack' is used in a broadsense, and the list includes 5 types of foodswhich may be considered as meals in somecontext. These include various preparations ofmee, mee-Iwon, kuih-tiau and nasi lemak. Differentsamples of the same cooked meal wereseparately listed since the ingredients used weredifferent. Based on the main ingredient, thefoods studied were divided into three groups.The first group consisted of eleven wheat flourbased snacks, and the second group was madeup of another eleven foods using rice or riceflour as the main ingredient. Three items basedon banana, and two on legumes were placed inthe third group. Even in this miscellaneousgroup, wheat or rice flour was an importantingredient in four out of the five foods studied.Coconut or santan was another commonly usedingredient, featured in at least 12 of all thefoods studied. Almost all the cooked snack foodsexamined in this study were traditionalMalaysian kuih or foods based on local recipes.Hence, their local names are used in this paper.
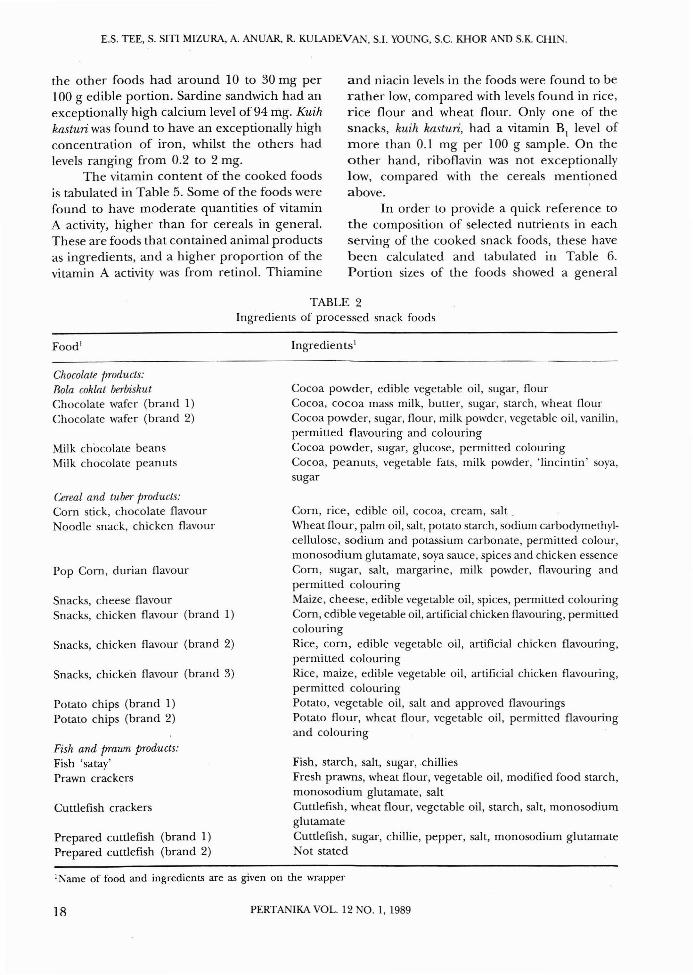
Table 2 lists the 19 processed snacksanalysed. The names of the snacks and theingredients listed are as given on the wrapper.They have been loosely grouped as chocolate,
PERTANIKA VOL. I~ '10. I, I'JH916
MATERIALS AND METHODS
A total of27 samples of cooked snack foods and19 processed snacks were studied. Most of thefoods were obtained from several schoolcanteens in Selangor Darul Ehsan. One sampleof each of the cooked foods was taken foranalysis, except for cooked meals with differentingredients. For the latter, at least two sampleswere taken from different canteens and analysedseparately. All cooked foods were collected andbrought to the laboratory the same morning.For the processed snacks, where appropriate,several brands of the foods were collected. Theweight of the edible portion of each serving, orpiece, or packet, as the case may be, was recorded. The ingredients of the cooked foodswere noted, or enquired from the vendor. Forthe processed snacks, the ingredients were takenfrom the packaging. A portion of each food wasblended for immediate determination of ascorbic acid. The remainder was blended andaliquots weighed out for the various analyses,carried out in duplicate.
All analyses were performed according tothe methods given in the laboratory manualcompiled by the Institute for Medical Research(Tee et al. 1987). Moisture was determined bythe air-oven method; protein by the semi-microKjeldahl method; fat was extracted using theSoxhlet apparatus; crude fibre by the acid-alkalidigestion method, and ash content was determined after incinerating the food in a muffle.Carbohydrate content was then determined bysubtracting from 100 the content of moisture,protein, fat, crude fibre and ash. Energy content of the food was calculated by multiplyingthe protein, carbohydrate and fat values withthe Atwater factors of 4,4 and 9 respectively.
Five minerals were determined on the ashsolution prepared from the food. Calcium wasdetermined by titration against potassiumpermanganate. Phosphorus was determinedcolorimetrically after reaction with vanadatemolybdate reagent, and iron content wassimilarly estimated colorimetrically through itsreaction with o-phenanthroline. Sodium andpotassium were determined using atomicabsorption spectrometry.
Vitamin A and carotene were first extracted from the unsaponifiable fraction of the
NUTRIENT COMPOSITION OF SELECTED COOKED AND PROCESSED SNACK FOODS
TABLE 1Ingredients of cooked snack foods
Food
Wheat flour based:Cake, plain, cupCucur badakCurrypuffKuih atmmKuih kasuiKuih keriaKuih udangSandwich, sardineFried mee (sample I)Fried mee (sample 2)Mee soup
Rice/rice flour based:Buah MelakaKuih sri mukaPulut pangfiang/tJUlut udang
Kuih lapisFried kuih-tiauFried mee-hoon (sample I)Fried mee-hoon (sample 2)Fried mee-hoon (sample 3)Nasi lemak (sample I)Nasi lemak (sample 2)Nasi lemak (sample 3)
Miscellaneous:Cokodok tJisangJ4Jat pisangPisang gorengKuih kasturiBubur kacang merah
Ingredients/Method of preparation
Flour, margerine, egg, sugar, baking powder; bakedFlour, coconut, dried prawn, salt, chilli; deep fried in oilFlour, potatoes, spices, spring onion, curry leaves; deep fried in oilFlour (and rice flour), sugar, yeast, salt, coconut; steamedFlour, brown sugar, salt, coconut, lime-water; steamedFlour, sweet potato, sugar, salt; deep fried in oilFlour, dried prawn, salt, kuchai, bean sprout; deep fried in oilBread (plain), sardine (canned), ikan bilisMee, bean sprout, egg, mustard leaf; friedMee, ikan bilis, kangkong, onion, chilli; friedMee, bean sprout, fish cake, tau-pok, parsley, sambal, onion; boiled
Glutinous rice flour, gula melaka, coconut, salt, colouring; boiledGlutinous rice, sa~tan, sugar, flour, salt, colouring; steamedGlutinous rice (boiled), coconut, dried prawn, onion, garlic, dried chilli,semi; grilledRice flour, sugar, santan, salt, colouring; steamedKuih-tiau, tau-kua, bean sprout, eggs, fish cake, chilli, ketchup; friedMee-hoon, bean sprout, kuchai, strips of fried egg, chilli; friedMee-hoon, ikan bilis, kangkong, sambal, onion; friedMee-hoon, fish ball, mustard leaf; friedRice with santan (steamed), ikan bilis, egg, cucumber, chiliRice with santan (steamed), ikan bilis, sambalRice with santan (steamed), ikan bilis, sambal, cucumber, onion
Banana, flour, sugar, salt; deep fried in oilBanana, flour, santan, sugar, salt; steamed in banana leavesBanana, wheat or rice flour; deep fried in oilGreen bean, rice flour, coconut, egg, sugar, salt; deep fried in oilRed beans, sugar; boiled
cereal and tuber, and fish and prawn products, based on their main ingredients. Themost popularly consumed are probably thecereal and tuber based products, or the extruded snack foods.
Nutrient Composition of Cooked Snack Foods
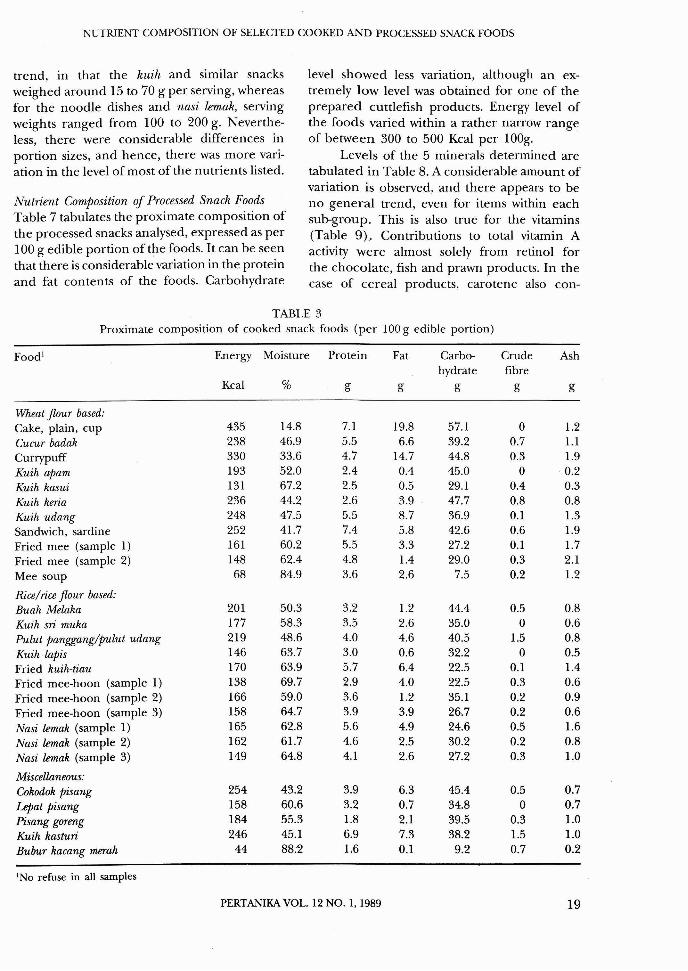
Proximate composition of the cooked snackfoods, expressed as per 100 g of edible portion,is tabulated in Table 3. Most of the foods werefound to have a rather narrow range of energylevel of 130 to 255 Kcal per 100 g edible portion, except for cake and the two soup dishes(mee soup and bubur kacang merah) which hada moisture content of over 80%. Protein concentration also did not vary widely, with most
of the values ranging from about 2 to 5 g. Thethree exceptions were cake, sardine sandwichand kuih kasturi, which had protein level ofabout 7 g. The cooked foods studied did nothave a high fat content, most of them below9 g, with a median value of 3.3 g. The exceptions were cake and currypuff. Being mostlycereal based foods, they were found to have afairly high carbohydrate content. Leaving outthe two soup dishes, carbohydrate level wasfound to range from about 23 to 58 g, with amedian value of 35 g per 100 g edible portion.
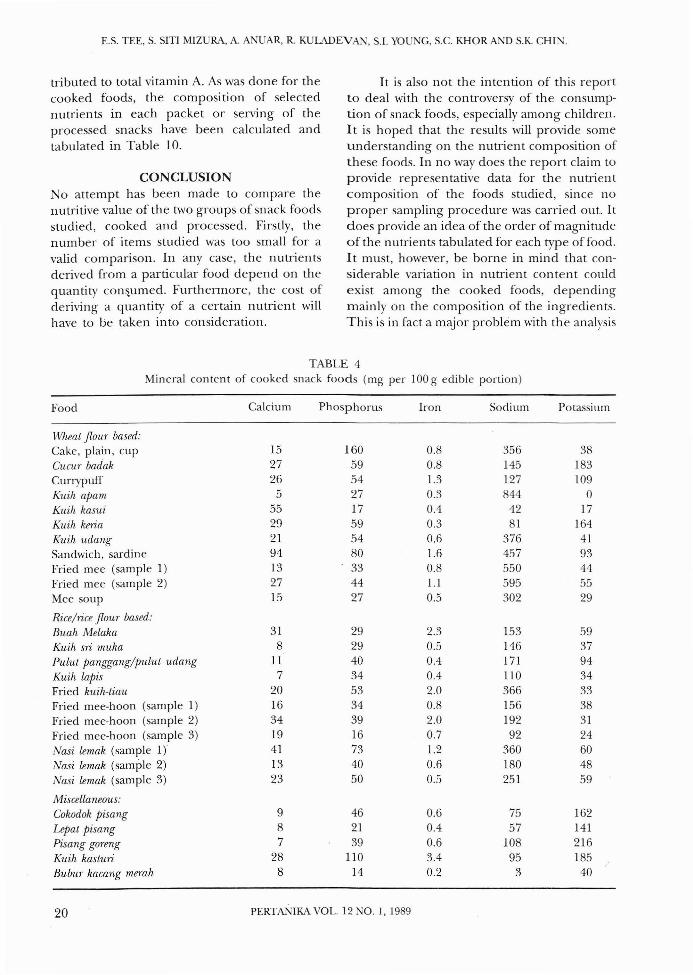
Table 4 tabulates the mineral content ofthe cooked snack foods, expressed as per 100 gedible portion. Except for 6 items which had acalcium level of below 10 mg, the majority of
PERTANlKA VOL. 12 NO.1, 1989 17
E.S. TEE, S. SITI MIZURA, A. ANUAR, R. KUI.ADEVAN, 5.1. YOUNG, S.C. KHORAND S.K. CHIN.
the other foods had around IOta 30 mg per100 g edible portion. Sardine sandwich had anexceptionally high calcium level of94 mg. Kuihkasturi was found to have an exceptionally highconcentration of iron, whilst the others had
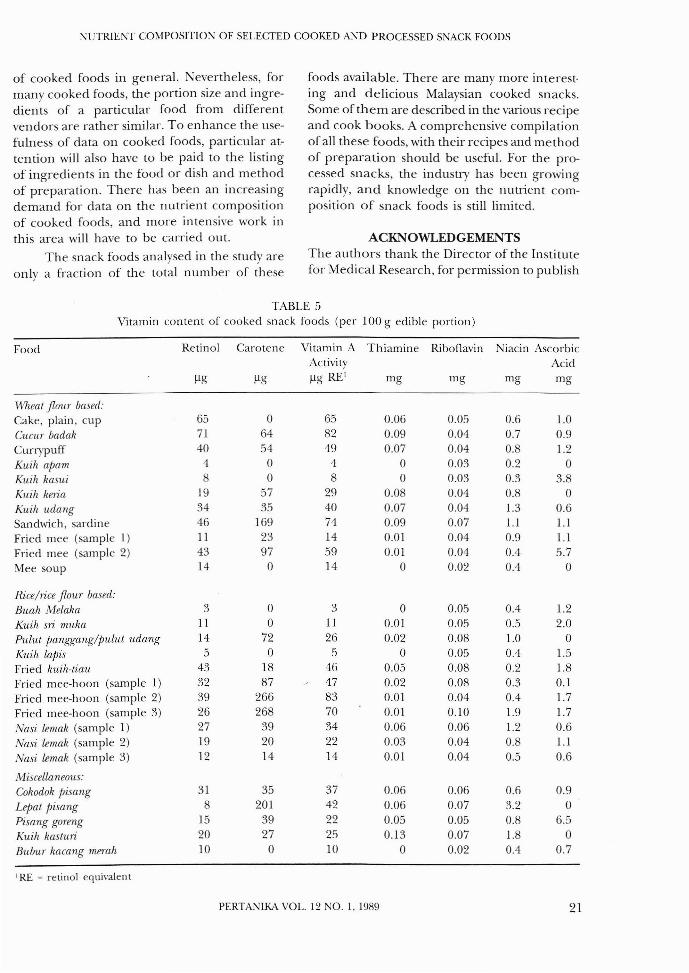
levels ranging from 0.2 to 2 mg.The vitamin content of the cooked foods
is tabulated in Table 5. Some of the foods werefound to have moderate quantities of vitaminA activity, higher than for cereals in general.These are foods that contained animal productsas ingredients, and a higher proportion of thevitamin A activity was from retinol. Thiamine
and niacin levels in the foods were found to berather low, compared with levels found in rice,rice flour and wheat flour. Only one of thesnacks, kuih kasturi, had a vitamin B
1level of
more than 0.1 mg per 100 g sample. On theother hand, riboflavin was not exceptionallylow, compared with the cereals mentionedabove. '
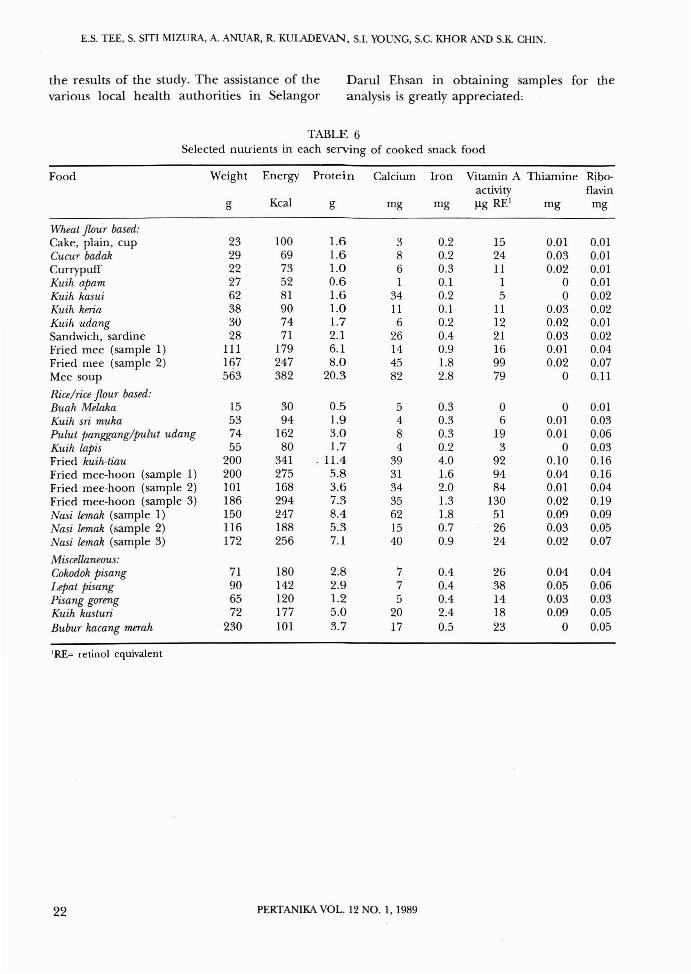
In order to provide a quick reference tothe composition of selected nutrients in eachserving of the cooked snack foods, these havebeen calculated and tabulated in Table 6.Portion sizes of the foods showed a general
TABLE 2Ingredients of processed snack foods
Ingredien ts I
Chocolate products:Bola coklat berbiskutChocolate wafer (brand 1)Chocolate wafer (brand 2)
Milk chocolate beansMilk chocolate peanuts
Cereal and tuber products:Corn stick, chocolate flavourNoodle snack, chicken flavour
Pop Corn, durian flavour
Snacks, cheese flavourSnacks, chicken flavour (brand 1)
Snacks, chicken flavour (brand 2)
Snacks, chicken flavour (brand 3)
Potato chips (brand 1)Potato chips (brand 2)
Fish and prawn products:Fish 'satay'Prawn crackers
Cuttlefish crackers
Prepared cuttlefish (brand 1)Prepared cuttlefish (brand 2)
Cocoa powder, edible vegetable oil, sugar, flourCocoa, cocoa mass milk, butter, sugar, starch, wheat flourCocoa powder, sugar, flour, milk powder, vegetable oil, vanilin,permitted flavouring and colouringCocoa powder, sugar, glucose, permitted colouringCocoa, peanuts, vegetable fats, milk powder, 'Iincintin' soya,sugar
Corn, rice, edible oil, cocoa, cream, salt .Wheat flour, palm oil, salt, potato starch, sodium carbodymethylcellulose, sodium and potassium carbonate, permitted colour,monosodium glutamate, soya sauce, spices and chicken essenceCorn, sugar, salt, margarine, milk powder, flavouring andpermitted colouringMaize, cheese, edible vegetable oil, spices, permitted colouringCorn, edible vegetable oil, artificial chicken flavouring, permittedcolouringRice, corn, edible vegetable oil, artificial chicken flavouring,permitted colouringRice, maize, edible vegetable oil, artificial chicken flavouring,permitted colouringPotato, vegetable oil, salt and approved flavouringsPotato flour, wheat flour, vegetable oil, permitted flavouringand colouring
Fish, starch, salt, sugar,chilliesFresh prawns, wheat flour, vegetable oil, modified food starch,monosodium glutamate, saltCuttlefish, wheat flour, vegetable oil, starch, salt, monosodiumglutamateCuttlefish, sugar, chillie, pepper, salt, monosodium glutamateNot stated
I Name of food and ingredients are as given on the wrapper
18 PERTANIKA VOL. 12 NO.1, 1989
NUTRIENT COMPOSITION OF SELECTED COOKED AND PROCESSED SNACK FOODS
trend, III that the kuih and similar snacksweighed around 15 to 70 g per serving, whereasfor the noodle dishes and nasi lemak, servingweights ranged from 100 to 200 g. Nevertheless, there were considerable differences inportion sizes, and hence, there was more variation in the level of most of the nutrients listed.
Nutrient Composition of Processed Snack FoodsTable 7 tabulates the proximate composition ofthe processed snacks analysed, expressed as per100 g edible portion of the foods. It can be seenthat there is considerable variation in the proteinand fat contents of the foods. Carbohydrate
level showed less vanatIOn, although an extremely low level was obtained for one of theprepared cuttlefish products. Energy level ofthe foods varied within a rather narrow rangeof between 300 to 500 Kcal per 100g.
Levels of the 5 minerals determined aretabulated in Table 8. A considerable amount ofvariation is observed, and there appears to beno general trend, even for items within eachsub-group. This is also true for the vitamins(Table 9). Contributions to total vitamin Aactivity were almost solely from retinol forthe chocolate, fish and prawn products. In thecase of cereal products, carotene also con-
TABLE 3Proximate composition of cooked snack foods (per 100 g edible portion)
Wheat flour based:Cake, plain, cupCucur badakCurrypuffKuih apamKuih kasuiKuih keriaKuih udangSandwich, sardineFried mee (sample 1)Fried mee (sample 2)Mee soup
Rice/rice flour based:Buah MelakaKuih sri mukaPulut panggang/pulut udangKuih.lapisFried kuih-tiauFried mee-hoon (sample 1)Fried mee-hoon (sample 2)Fried mee-hoon (sample 3)Nasi lemak (sample 1)Nasi lemak (sample 2)Nasi lemak (sample 3)
Miscellaneous:Cokodok pisangLepat pisangPisang gorengKuih kasturiBubur kacang merah
INo refuse in all samples
Energy Moisture Protein
Kcal % g
435 14.8 7.1238 46.9 5.5330 33.6 4.7193 52.0 2.4131 67.2 2.5236 44.2 2.6248 47.5 5.5252 41.7 7.4161 60.2 5.5148 62.4 4.8
68 84.9 3.6
201 50.3 3.2177 58.3 3.5219 48.6 4.0146 63.7 3.0170 63.9 5.7138 69.7 2.9166 59.0 3.6158 64.7 3.9165 62.8 5.6162 61.7 4.6149 64.8 4.1
254 43.2 3.9158 60.6 3.2184 55.3 1.8246 45.1 6.9
44 88:2 1.6
PERTANlKA VOL. 12 NO.1, 1989
Fat
g
19.86.6
14.70.40.53.98.75.83.31.42.6
1.22.64.60.66.44.01.23.94.92.52.6
6.30.72.17.30.1
Carbohydrate
g
57.139.244.845.029.147.736.942.627.229.0
7.5
44.435.040.532.222.522.535.126,724.630.227.2
45.434.839.538.2
9.2
Crudefibre
g
o0.70.3
o0.40.80.10.60.10.30.2
0.5o
1.5o
0.10.30.20.20.50.20.3
0.5o
0.31.50.7
Ash
g
1.21.11.90.20.30.81.31.91.72.11.2
0.80.60.80.51.40.60.90.61.60.81.0
0.70.71.01.00.2
19
E.S. TEE, S. SITI MIZURA, A. ANUAR, R. KULADEVAN, S.l. YO NC, S.c. KHOR AND S.K. CHIN.
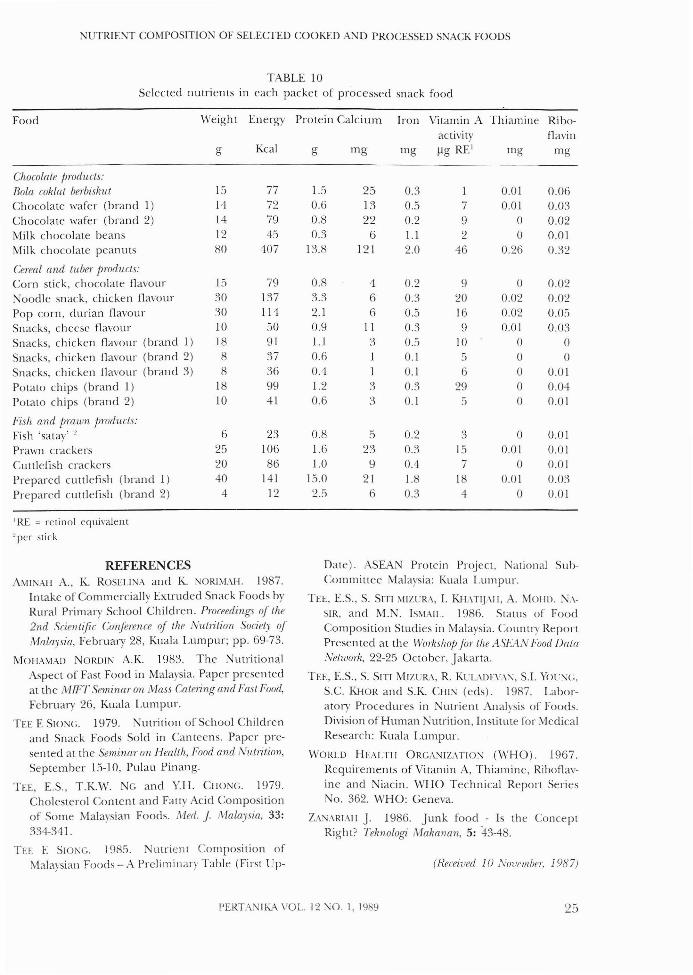
tributed to total vitamin A. As was done for thecooked foods, the composition of selectednutrients in each packet or serving of theprocessed snacks have been calculated andtabulated in Table 10.
CONCLUSIONNo attempt has been made to compare thenutritive value of the two groups of snack foodsstudied, cooked and processed. Firstly, thenumber of items studied was too small for avalid comparison. In any case, the nutrientsderived from a particular food depend on thequantity con~umed. Furthermore, the cost ofderiving a quantity of a certain nutrient willhave to be taken into consideration.
It is also not the intention of this reportto deal with the controversy of the consumption of snack foods, especially among children.I t is hoped that the results will provide someunderstanding on the nutrient composition ofthese foods. In no way does the report claim to
provide representative data for the nutrientcomposition of the foods studied, since noproper sampling procedure was carried out. Itdoes provide an idea of the order of magnitudeof the nutrients tabulated for each type offood.It must, however, be borne in mind that considerable variation in nutrient content couldexist among the cooked foods, dependingmainly on the composition of the ingredients.This is in fact a major problem with the analysis
TABLE 4Mineral content of cooked snack foods (mg per 100 g edible portion)
Food Calcium Phosphorus 1ron Sodium Potassium
Wheat flour based:Cake, plain, cup 15 160 0.8 356 38Cucur badak 27 59 0.8 145 183Currypuff 26 54 1.3 127 109Kuih apam 5 27 0.3 844 0Kuih kasui 55 17 0.4 42 17Kuih keria 29 59 0.3 81 164Kuih udang 21 54 0.6 376 41Sandwich, sardine 94 80 1.6 457 93Fried mee (sample 1) 13 33 0.8 550 44Fried mee (sample 2) 27 44 l.l 595 55Mee soup 15 27 0.5 302 29
Rice/rice flour based:Buah Melaka 31 29 2.3 153 59Kuih sri muka 8 29 0.5 146 37Pulut panggang/pulut udang 11 40 0.4 171 94Kuih lapis 7 34 0.4 110 34Fried kuih-tiau 20 53 2.0 366 33Fried mee-hoon (sample 1) 16 34 0.8 156 38Fried mee-hoon (sample 2) 34 39 2.0 192 31Fried mee-hoon (sample 3) 19 16 0.7 92 24Nasi lemak (sample 1) 41 73 1.2 360 60Nasi lemak (sample 2) 13 40 0.6 180 48Nasi lemak (sample 3) 23 50 0.5 251 59
Miscellaneous:Cokodok pisang 9 46 0.6 75 162Lepat pisang 8 21 0.4 57 141Pisang goreng 7 39 0.6 108 216Kuih kasturi 28 110 3.4 95 185Bubur kacang metah 8 14 0.2 3 40
20 PERTANIKA VOL. 12 NO.1, 1989
NUTRIENT COMPOSITION OF SELECTED COOKED AI'\D PROCESSED SNACK FOODS
of cooked foods in general. Nevertheless, formany cooked foods, the portion size and ingredients of a particular food from differentvendors are rather similar. To enhance the usefulness of data on cooked foods, particular attention will also have to be paid to the listingof ingredients in the food or dish and methodof preparation. There has been an increasingdemand for data on the nutrient compositionof cooked foods, and more intensive work inthis area will have to be carried out.
The snack foods analysed in the study areonly a fraction of the total number of these
foods available. There are many more interest·ing and delicious Malaysian cooked snacks.Some ofthem are described in the various recipeand cook books. A comprehensive compilationofall these foods, with their recipes and methodof preparation should be useful. For the processed snacks, the industry has been growingrapidly, and knowledge on the nutrient composition of snack foods is still limited.
ACKNO~EDGEMENTS
The authors thank the Director of the Institutefor Medical Research, for permission to publish
TABLE 5Vitamin content of cooked snack foods (per 100 g edible portion)
Food Retinol Carotene Vitamin A Thiamine RiboflavinActivityIlg REI mg mg
Niacin AscorbicAcid
mg mg
Wheat JlOUT based:Cake, plain, cupCUCUT badakCurrypuffKuih apamKuih kasuiKuih kaiaKuih udangSandwich, sardineFried mee (sample I)Fried mee (sample 2)Mee soup
Rice/rice JlOUT based:Buah MelakaKuih s1i mukaPulut panggang/pulut udangKuih lapisFried kuih-tiauFried mee-hoon (sample I)Fried mee-hoon (sample 2)Fried mee-hoon (sample 3)Nasi lemak (sample I)Nasi lemak (sample 2)Nasi lemak (sample 3)
Miscellaneous:Cokodok pisangLepat pisangPisang gOTengKuih kastwiBubuT kacang memh
IRE = retinol equivalent
657140
48
193446114314
311145
43323926271912
318
152010
o6454oo
5735
1692397o
oo
72o
1887
266268
392014
35201
3927o
658249
48
294074145914
3II26
546478370342214
3742222510
0.060.090.07
oo
0.080.070.090.010.01
o
o0.010.02
o0.050.020.010.010.060.030.01
0.060.060.050.13
o
0.050.040.040.030.030.040.040.070.040.040.02
0.050.050.080.050.080.080.040.100.060.040.04
0.060.070.050.070.02
0.60.70.80.20.30.81.31.10.90.40.4
0.40.51.00.40.20.30.41.91.20.80.5
0.63.20.81.80.4
1.00.91.2o
3.8o
0.61.11.15.7
o
1.22.0
o1.51.80.11.71.70.6l.l0.6
0.9o
6.5o
0.7
PERTANIKA VOL. 12 NO. I, 1989 21
E.S. TEE, S. SITI MIZURA, A. ANUAR, R. KUlADEVAN, S.1. YOUNG, S.C. KHOR AND S.K. CHIN.
the results of the study. The assistance of the Daml Ehsan in obtaining samples for thevarious local health authorities in Selangor analysis is greatly appreciated:
TABLE 6Selected nutrients in each serving of cooked snack food
Food Weight Energy Protein Calcium Iron Vitamin A Thiamine Riba-activity flavin
g Kcal g mg mg Ilg REI mg mg
Wheat flour based:Cake, plain, cup 23 100 1.6 3 0.2 15 0.01 0.01CUCUT badak 29 69 1.6 8 0.2 24 0.03 0.01Currypuff 22 73 1.0 6 0.3 11 0.02 0.01Kuih apam 27 52 0.6 1 0.1 1 0 0.01Kuih kasui 62 81 1.6 34 0.2 5 0 0.02Kuih keria 38 90 1.0 11 0.1 11 0.03 0.02Kuih udang 30 74 1.7 6 0.2 12 0.02 0.01Sandwich, sardine 28 71 2.1 26 0.4 21 0.03 0.02Fried mee (sample 1) III 179 6.1 14 0.9 16 0.01 0.04Fried mee (sample 2) 167 247 8.0 45 1.8 99 0.02 0.07Mee soup 563 382 20.3 82 2.8 79 0 0.11
Rice/rice flour based:Buah Melaka 15 30 0.5 5 0.3 0 0 0.01Kuih sri muka 53 94 1.9 4 0.3 6 0.01 0.03Pulut panggang/pulut udang 74 162 3.0 8 0.3 19 0.01 0.06Kuih lapis 55 80 1.7 4 0.2 3 0 0.03Fried kuih-tiau 200 341 . 11.4 39 4.0 92 0.10 0.16Fried mee-hoon (sample 1) 200 275 5.8 31 1.6 94 0.04 0.16Fried mee-hoon (sample 2) 101 168 3.6 34 2.0 84 0.01 0.04Fried mee-hoon (sample 3) 186 294 7.3 35 1.3 130 0.02 0.19Nasi lemak (sample 1) 150 247 8.4 62 1.8 51 0.09 0.09Nasi lemak (sample 2) 116 188 5.3 15 0.7 26 0.03 0.05Nasi lemak (sample 3) 172 256 7.1 40 0.9 24 0.02 0.07
Miscellaneous:Cokodok pisang 71 180 2.8 7 0.4 26 0.04 0.04Lepat pisang 90 142 2.9 7 0.4 38 0.05 0.06Pisang goreng 65 120 1.2 5 0.4 14 0.03 0.03Kuih kasturi 72 177 5.0 20 2.4 18 0.09 0.05Bubur kacang merah 230 101 3.7 17 0.5 23 0 0.05
1RE= retinol equivalent
22 PERTANlKA VOL. 12 NO.1, 1989

NUTRIENT COMPOSITION OF SELECTED COOKED AND PROCESSED SNACK FOODS
TABLE 7Proximate composition of processed snack foods (per IOOg edible portion)
Food l Energy Moisture Protein Fat Carbo- Crude Ashhydrate fibre
Kcal % g g g g g
Chocolate products:Bola coklat berbiskut 517 2.6 10.1 26.6 59.2 0 1.5Chocalate wafer (brand 1) 515 1.7 4.6 25.1 67.6 0 1.0Chocolate wafer (brand 2) 565 2.3 5.5 35.7 55.4 0 1.1Milk chocolate beans 377 2.5 2.2 2.6 86.2 0 6.5Milk chocolate peanuts 509 6.8 17.2 30.9 40.5 2.6 2.0
Cereal and tuber products:Corn stick, chocolate flavour 526 .3.9 5.2 28.8 61.5 0 0.6Noodle snack, chicken flavour 456 3.5 11.0 15.6 67.9 0 2.0Pop corn, durian flavour 380 4.8 6.9 0.8 86.4 0 1.1Snacks, cheese flavour 499 3.1 9.3 24.0 61.4 0 2.2Snacks, chicken flavour (brand 1) 504 3.7 6.2 25.6 62.1 0 2.4Snacks, chicken flavour (brand 2) 458 6.2 8.0 18.4 65.2 0 2.2Snacks, chicken flavour (brand 3) 456 6.4 4.8 17.9 68.8 0 2.1Potato chips (brand 1) 552 5.6 6.4 39.0 43.9 1.7 3.4Potato chips (brand 2) 407 7.0 6.3 10.5 71.9 0 4.3
Fish and prawn products:Fish 'satay' 380 15.2 13.9 12.2 53.7 0.8 4.2Prawn crackers 424 3.3 6.2 9.8 77.7 0 3.0Cuttlefish crackers 429 4.1 5.2 10.7 77.9 0 2.1Prepared cuttlefish (brand 1) 353 9.0 37.5 0.8 49.0 0.2 3.5Prepared cuttlefish (brand 2) 296 20.9 62.1 3.1 4.9 0.2 8.8
'No refuse in all samples
TABLE 8Mineral content of processed snack foods (mg per 100 g edible portion)
Food Calcium Phosphorus Iron Sodium Potassium
Chocolate products:Bola coklat berbiskut 166 189 2.2 86 309Chocolate wafer (brand 1) 89 98 3.8 87 175Chocolate wafer (brand 2) 157 97 1.5 98 95Milk chocolate beans 54 38 9.0 36 117Milk chocolate peanuts 152 245 2.5 83 295
Cereal and tuber products:Corn stick, chocolate flavour 29 71 1.4 18 83Noodle snack, chicken flavour 20 135 1.1 613 88Pop Corn, durian flavour 18 71 1.5 282 85Snacks, cheese flavour III 114 3.3 483 55Snacks, chicken flavour (brand 1) 14 51 2.6 703 46Snacks, chicken flavour (brand 2) 8 61 0.8 465 53Snacks, chicken flavour (brand 3) 6 64 0.8 546 15Potato chips (brand 1) 17 104 1.4 272 771Potato chips (brand 2) 34 156 1.0 1152 41.
Fish and prawn products:Fish 'satay' 81 175 4.1 841 358Prawn crackers 94 98 1.1 750 116Cuttlefish crackers 46 81 1.8 527 110Prepared cuttlefish (brand 1) 51 364 4.6 923 271Prepared cuttlefish (brand 2) 143 717 6.5 1352 585
PERTANIKA VOL. 12 NO.1, 1989 23

E.S. TEE, S. SITI NIIZURA, A. ANUAR, R. KULADEVAN, S.l. YOUNG, S.C. KHOR AND S.K. CHIN.
TABLE 9Vitamin content of processed snack foods (per 100 g edible portion)
Food Retinol Carotene Vitamin A Thiamine Riboflavin Niacin AscorbicActivity Acid
llg llg llg REI mg mg mg mg
Chocolate pmducts:Bola coklat berbiskut 8 0 8 0.06 0.39 1.4 3.8Chocolate wafer (brand 1) 48 0 48 0.Q6 0.23 l.l 8.8Chocolate wafer (brand 2) 66 0 66 0.03 0.15 3.6 4.6Milk chocolate beans 15 0 15 0 0.09 l.l 4.7Milk chocolate peanuts 57 0 57 0.33 0.40 6.4 1.2
Cereal and tuber products:Corn stick, chocolate flavour 54 32 59 0.01 0.10 1.4 3.5Noodle snack, chicken flavour 66 4 67 0.07 0.05 0.8 16.8Pop Corn, durian flavour 30 146 54 0.05 0.17 0.7 2.9Snacks, cheese flavour 74 117 94 0.06 0.25 0 3.9Snacks, chicken flavour (brand 1) 49 50 57 0 0 0.5 1.7Snacks, chicken flavour (brand 2) 54 43 61 0 0 0.9 2.3Snacks, chicken flavour (brand 3) 76 32 81 0 0.13 1.9 0.8Potato chips (brand I) 160 0 160 0 0.20 4.2 8.5Potato chips (brand 2) 48 0 48 0 0.06 3.0 15.2
Fish and prawn products:Fish 'satay 42 0 42 0.02 0.10 2.0 1.2Prawn crackers 58 0 58 0.03 0.05 1.0 7.0Cuttlefish crackers 34 0 34 0.01 0.05 0.8 8.7Prepared cuttlefish (brand 1) 44 9 46 0.03 0.08 2.9 1.2Prepared cuttlefish (brand 2) 107 0 107 0.02 0.29 7.0 1.2
IRE = retinol equivalent
24 PERTANIKA VOL. 12 NO. I, 1989
lUTRIENT COMPOSITION OF SELECTED COOKED AND PROCESSED SNACK FOODS
TABLE 10Selected nutrients in each packet of processed snack food
Food Weight Energy Protein Calcium Iron Vitamin A Thiamine Ribo-activity flavin
g Kcal g mg mg ~g REI mg mg
Chocolate products:
Bola coklat berbiskut IS 77 1.5 25 0.3 1 0.01 0.06Chocolate wafer (brand 1) 14 72 0.6 13 0.5 7 0.01 0.03Chocolate wafer (brand 2) 14 79 0.8 22 0.2 9 0 0.02Milk chocolate beans 12 45 0.3 6 l.l 2 0 0.01Milk chocolate peanuts 80 407 13.8 121 2.0 46 0.26 0.32
Cereal and tuber products:Corn stick, chocolate flavour 15 79 0.8 4 0.2 9 0 0.02Noodle snack, chicken flavour 30 137 3.3 6 0.3 20 0.02 0.02Pop corn, durian flavour ~o Il4 2.1 6 0.5 16 0.02 0.0:')
Snacks, cheese flavour 10 .50 0.9 II 0.3 9 0.01 O.O~
Snacks, chicken flavour (brand 1) 18 91 l.l ~ 0.5 10 0 0Snacks, chicken flavour (brand 2) 8 37 0.6 1 0.1 5 a 0Snacks, chicken flavour (brand 3) 8 36 U.4 1 0.1 6 0 0.01Potato chips (brand 1) 18 99 1.2 3 0.3 29 0 0.04Potato chips (brand 2) to 41 0.6 3 0.1 5 0 0.01
Fish and prawn jJroducts:
Fish 'satay, " 6 23 0.8 5 0.2 3 0 0.01Prawn crackers 25 106 1.6 23 03 15 0.01 0.01Cuttlefish crackers 20 86 1.U 9 0.4 7 0 0.01Prepared cuttlefish (brand 1) 40 141 15.0 21 1.8 18 0.01 0.03
Prepared cuttlefish (brand 2) 4 12 2.5 6 0.3 4 0 O.Ol
1 RE ; retinol cqui"alel1l'per st.ick
REFERENCESA\'IINAH A., K. ROS[l.lNA and K. :-.IORIMAH. 1987.
Intake of Commercially Extruded Snack Foods byRural Primary School Children. Proceedings oj the
2nd SrientiJir. Con(erenre oj the Nutrition Society of
Malaysia, February 28, Kuala Lumpur; pp. 69-73.
MOHAMAD NORDIi': A.K. 1983. The NutritionalAspect of Fast Food in Malaysia. Paper presentedat the MWT Seminar on Mass Catering and Fast Food,
February 26, Kuala Lumpur.
TEE E SIO:-.lC. 1979. Nutrition of School Childrenand Snack Foods Sold in Canteens. Paper presented at the Seminar on Health, Food and Nutrition,
September 15-10, Pulau Pinang.
TEE, E.S., T.K.w. NG and YH. CHONG. 1979.Cholesterol Content and Fatty Acid Compositionof Some Malaysian Foods. Merl. J. Malaysia, 33:
334-341.
TEE E SIOI\G. 1985. Nutrient Composition ofMalaysian Foods - A Preliminary Table (First Up-
Date). ASEAN Protein Project, National Su bCommittee Malaysia: Kuala LUlllpur.
TEE, E.S., S. SITI \IIZt:RA, 1. KHATII ..\H, A. MOHIJ. NASIR, and M.N. IS\'IAIL. 1986. Status of FoodComposition Studies in Malaysia. Country ReportPresented at the WorkshojJjiJr the AS/:AN Food /)([tll
Network, 22-25 October, Jakarta.
TEE, E.S., S. SITI MIZUR..l., R. KUL-\DEVA:-.I, S.l. YOLNC,S.c. KHOR and S.K. CHI:\ (cds). 1987. Laboratory Procedures in Nutriel1l Analysis of Foods.Division of Human Nutrition, Institute for MedicalResearch: Kuala LUlllpur.
WORLD HEALTH ORGANIZATION (WHO). 1967.Requirements of Vitamin A, Thiamine, Riboflavine and Niacin. WHO Technical Report SeriesNo. 362. "\THO: Geneva.
ZA-'iARTAH J. 1986. Junk food - Is the ConceptRight? Telmologi Makanan, 5: 43-48.
(Received 10 November. 1987)
l'ERTA:'-JIKA VOL. 12 )iO. 1, 19B9