wao annual statisiics 2oo4wao.org.my/file/file/small_annual_statistics_2004.pdf · 2003 2004 57 r29...
TRANSCRIPT
WAO ANNUAL STATISIICS 2OO4
Refuge ServicesFace to Face CounselingTelephone Counseling
Prepared by:
Nazlina bt Abd Ghani
Assisted by:
Shoba Aiyar, Jessie Ang, Chong See Mun, Saralah Devi, Ir{ormah Mohd Nor
& Thillai Navaki
Women's Aid Organisation (WAO)
P.O.Box 493, Jalan Sultan,
46050 Petaling Jaya,
Selangor Darul Ehsan, Malaysia
Tel: 603-79570636/5636
Fax: 603-79563237
E-mail : [email protected]
Website : www.weo.org.my
No part ofthis document should be copied, reproduced, adapted, stored in retrieval system or Iransmi!ted in anyformwithout the prior permissionfrom WAO.
IttAO Statistics 2004
OUR $ERVICES THROUGH THE YEARS
SHELTER / REFUGE
GENERAL INFORMATION
1 Reasons for seeking shelter
2 Number of chi ldren
3 Number of visits
4 Sources of awareness5 Length of stay6 Residence
7 Age
B Nationality
I Marital status10 Level ofeducation
11 Orcupation
12 Income
B. I N FORMATION ON DOMES TI C VI OLEN CE
a) INFORMATTON ON THE ABUSE't Types of abuse
2 Types ofphysical abuse
3 Length of time in abusive situation
4 Frequency of the abuse
5 Number of times women tried to leave the abusive situationb) INFoRMATION ON THE PERPETRATORS
6 Relationship to the residents7 Ana
B National i ty
9 Level of Education
10 Occupation
11 Income
12 Triggering factors
13 Criminal record'14 Interim Protection Order (lpO)
OUTCOMES
15 Status of the women at the end of 200416 Reasons cited for going back to abusive situation'17 Types of accomodation
1B Occupation
tx
.,,,.,. 3
3
4
4
5
5
o
7
I
8
a
10
10
10
11
11
12
12
1?
1?
n)
14
1A
15
15
l l 'AO Statrstics 2004
C. MIGRANT DOMESTICWORKER ABUSE
a) INFORMATION ON THE ABUSE
1 Types of abuse
2 Frequency ofthe abuse
b) INFORMATION ON THE PERPETRATORS
3 Age
4 Ethnicity
c) OUTCOMES
6 Status of the MDW at the end oI 2OO4
7 Statusof thecasesof MDWswhoaresti l l atWAO
FACE TO FACE COUNSELING
A. GENERALINFORMATION
1 Problems faced
2 Other problems faced
3 Needs of the clients
4 Ex-residents
5 Age
6 Residence
7 Nationality
TELEPHONE COUNSELING
A. GENERAL INFORMATIAN
1 Reasons for the call
2 Who are the cal lers
3 Residence
4 National i ty
5 Age
6 Occupation
7 Needs of the caller
, lto
to
17
17
17
18
18
19
19
20
20
20
21
21
22
23
23
24
24
25
25
l ltAO Statistics 2004
WAO STATISTICS 2OO4
OUR SERVICES THROUGH THE YEARS
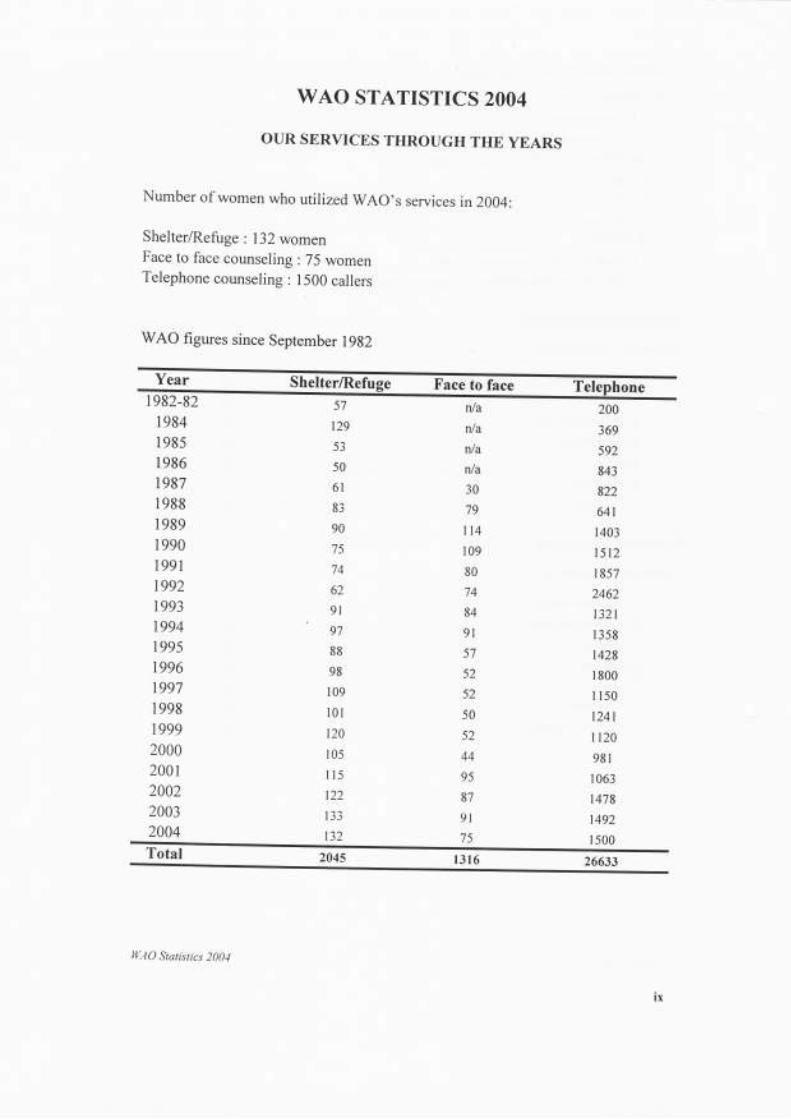
Number of women who utilized WAO's services in2004:
Shelter/Refu ge : 132 womenFace to face counseling : 75 womenTelephone counseling : 1500 callers
WAO figures since September l9g2
Year Shelter/Refuge Face to facer982-82
1984I 98s19861987l 988198919901991t992r993r9941995r9961997l 998r99920002001200220032004
57
r29
53
50
6l
83
90
75
-At1
62
9I
97
88
98
109
l0l
120
r05
I 15
t22
r33
t32
ila
rua
nla
nla
30
79
l14
r0980
74
84
91
5l
52
52
50
52
44
95
87
9l
75
200
369
592
843
822
64r1403t5 l2
r 857
2462
t32l
I 358
1428
r 800
I 150
t24rlt20981
I 063
t478
1492
l 500Total r3l6 26633
tx
H/.4O Statistics 2004
WAO STATISTTCS 2OO4
*r i l r 'k******************** SHELTER/REFUGE *rr ! r*************************
A. GENERAL INFORMATION
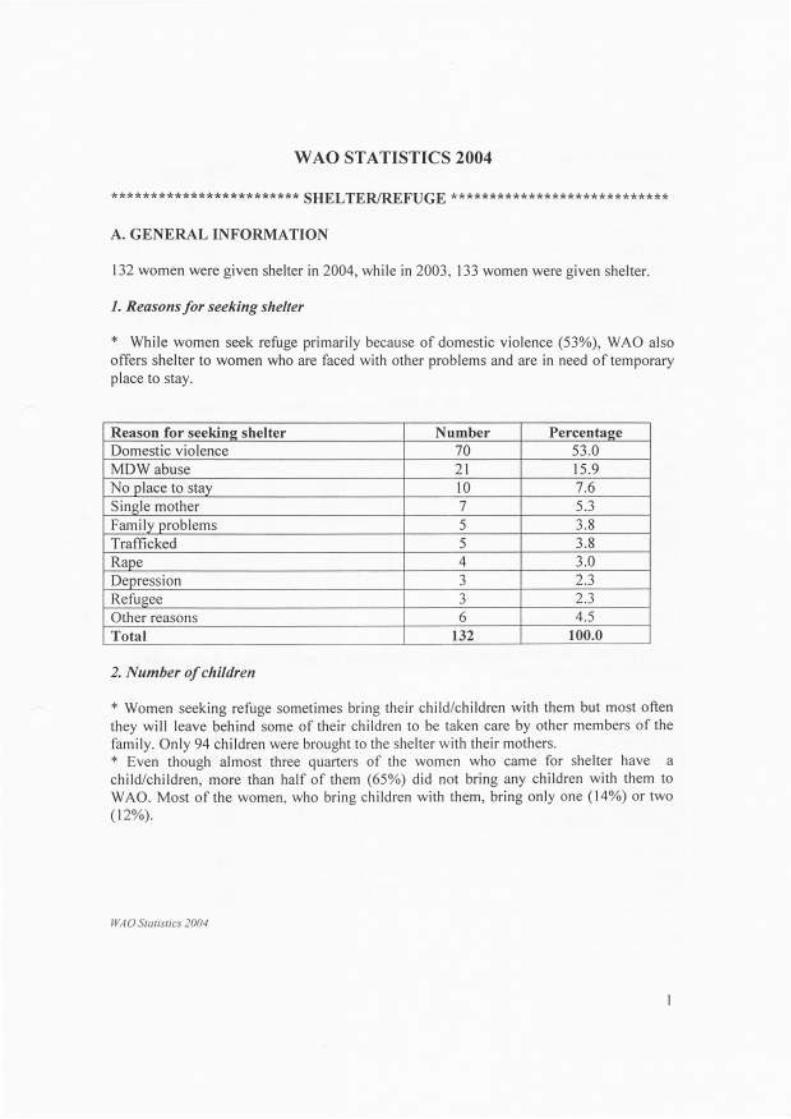
132 women were given shelter in2004,while in 2003, 133 women were given shelter.
I. Reasons for seeking shelter
* While women seek refuge primarily because of domestic violence (53o ), WAO alsooffers shelter to women who are faced with other problems and are in need of temporaryplace to stay.
Reason for seekins shelter Number PercentageDomestic violence 70 53.0MDW abuse 2l 15.9No nlace to stav l0 7.6Sinsle mother 5.3Familv nroblems 5 3.8Trafficked ) 3.8Rape 4 3.0Depression J 2.3Refusee J z.)
Other reasons 6 4.5Total r32 100.0
2. Number of children
* Women seeking refuge sometimes bring their child/children with them but most oftenthey will leave behind some of their children to be taken care by other members of thefamily. Only 94 children were brought to the shelter with their mothers.* Even though almost three quarters of the women who came for shelter have achild/children, more than half of them (65%) did not bring any children with them toWAO. Most of the women, who bring children with them, bring only one (14o/o) or two(12%).
WAO Statist ics 2004

Children at WAO Number
2 children3 chi ldren4 children5 children6 children
in 2004 were new clients (82%) while l7 womenyears. Seven of the residents sought WAO shelterresidents came more than once in the same year.
Number of visits to WAO Number PercentageFirst r08 8l .8Second t7 t2.9Third 6 4.5Fifth 0.8Total 132 100.0
Source of awareness Number PercentagePolice 40 30.3Self (ex-resident) 22 16.7Friends 20 15.2lueota t4 t0.6NGOs l3 9.8Hospitals/Otie-stop center l0 7.6Rela ves 4 3.0Embassy 0.8Other* 7 5.3Total r32 100.0x Including public education by lyAO
3. Number of visits
* The vast majority of the residents(13%) had been residenrs in previousfor the third or fifth time. Some of the
4. Sources of awareness
*As in previous years, the major sources of awareness are police, women themselves (ex-residents), media and friends.
I l 'AO Sratist ics 200J
5. Length of stay
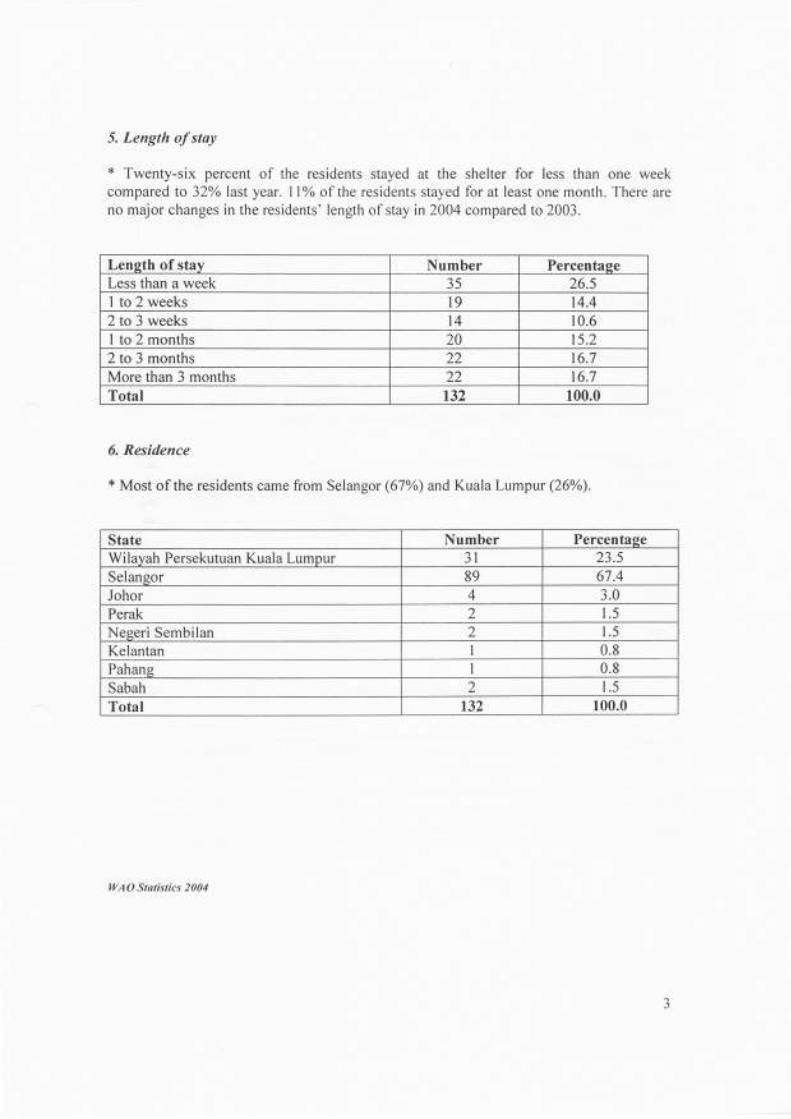
* Twenty-six percent of the residents stayed at the shelter for less than one weekcompared to 32%o last year. 11% of the residents stayed for at least one month. There areno major changes in the residents' length of stay in2004 compared to 2003.
Leneth of stav Number PercentaseLess than a week 35 26.5I to 2 weeks l9 4.42 to 3 weeks t4 0.6I to 2 months 2A 5.22to 3 months 22 6.7More than 3 months 22 6.7Total r32 100.0
6. Residence
* Most of the residents came from Selangor (67%) and Kuala Lumpur (26%).
llAO Sratistics 2004
State Number PercentageWilavah Persekutuan Kuala Lumour 3l 23.5Selansor 89 67.4Johor 4 3.0Perak 2 1.5Neseri Sembilan 2 1.5Kelantan I 0.8Pahans I 0.8Sabah 2 1.5Total r32 100.0
7. Age
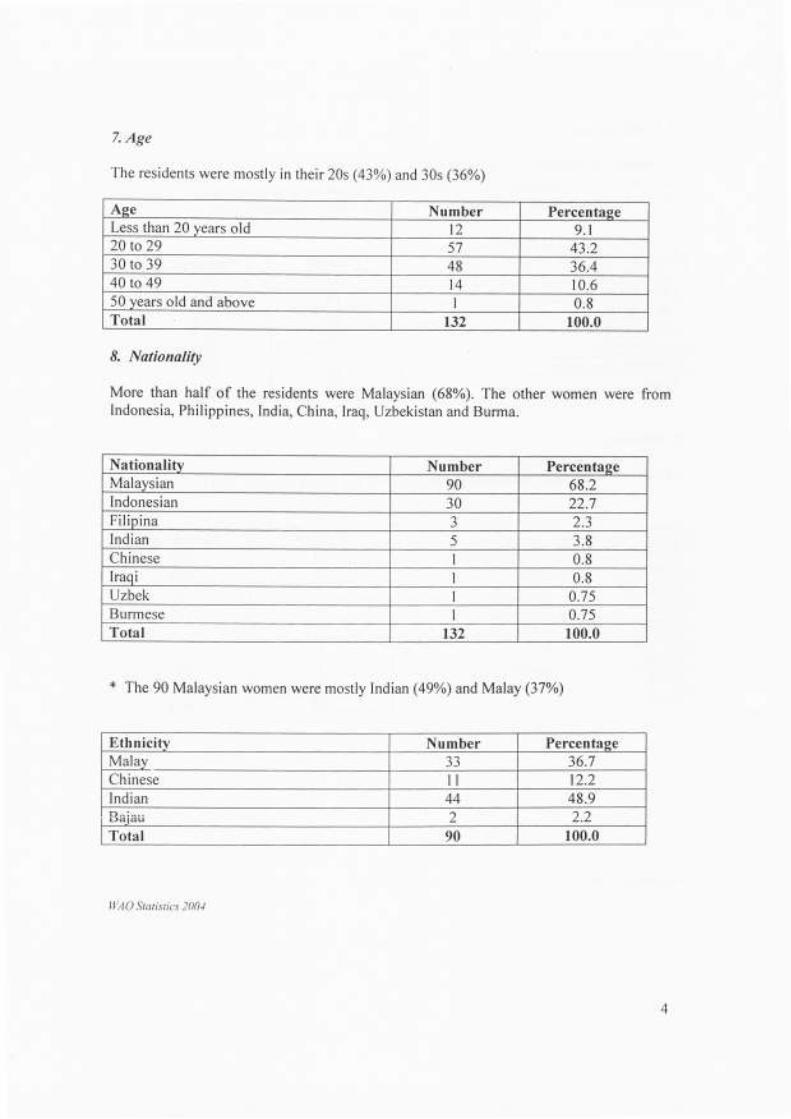
The residents were mostly in their 20s (43%) and 30s (36%\
Age Number PercentaseLess than 20 years old t2 9.120 to29 57 43.230 to 39 48 36.440 to 49 t4 r 0.650 years old and above I 0.8Total 132 r00.0
8. Nationality
More than half of the residents were Malaysian (68%). The other women were fromIndonesia, Philippines, India, China, Iraq, Uzbekistan and Burma.
Nationalitv Number PercentageMalaysian 90 68.2Indonesian 30 22.7Fi l ip ina 5 2.3Indian 5 3.8Chinese I 0.8Iraqi I 0.8Uzbek 0.75Burmese 0.7sTotal 132 100.0
* The 90 Malaysian women were mostly Indian (49%) and Malay (37%)
Ethnicitv Number PercentageMalay 33 36.7Chinese il t2.2Indian 44 48.9E ^:^, ,Datatt 2 2.2Total 90 100.0
It/AO Statistics 2001
9. Marital status
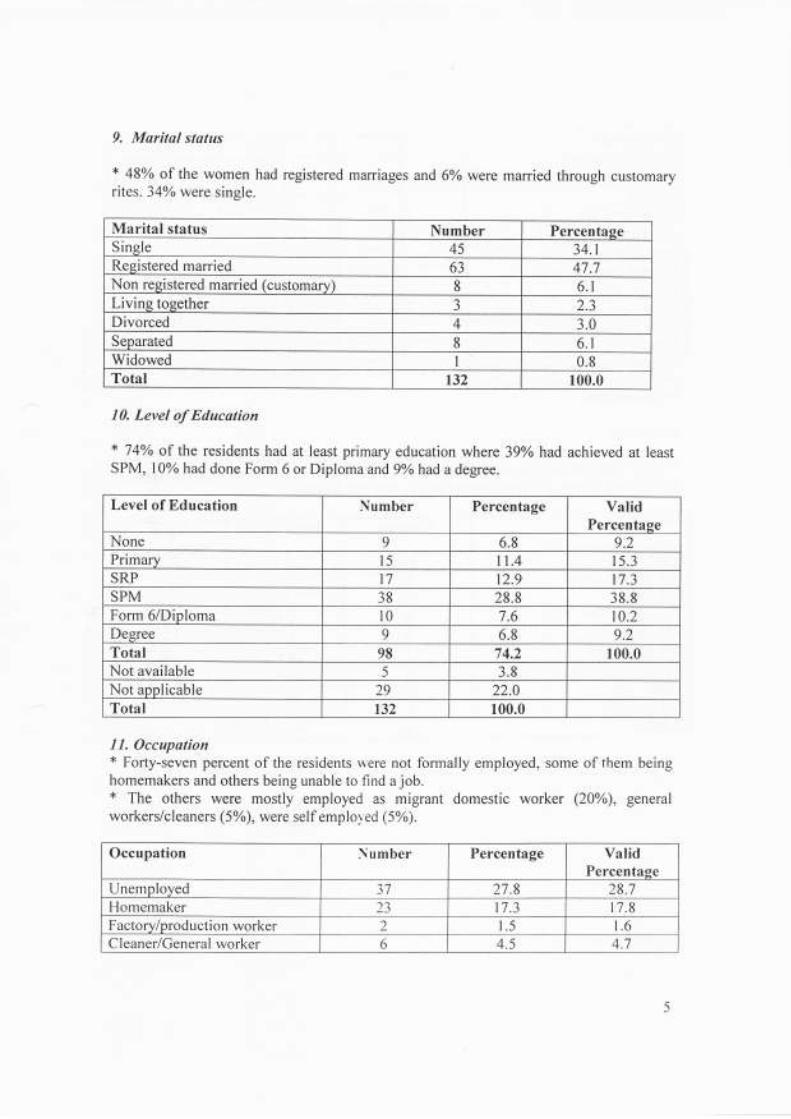
* 48oh of the women had registered marriages and 60/o were married through customaryrites. 34%o were single.
Marital status Number PercentageSingle 45 34.1Resistered married 63 47.7Non registered married (customary) 8 6.1Living together a
J 2.3Divorced 4 3.0Separated 8 6.1Widowed I 0.8Total 132 r00.0
10. Level of Education
* 74yo of the residents had at least primary education where 39%had achieved at leastSPM, l}Yo had done Form 6 or Diplom a and 9%o had a degree.
I I. Occupation* Forty-seven percent of the residents n'ere not formally employed, some of them beinghomemakers and others being unable to find a job.* The others were mostly employed as migrant domestic worker (20yo), generalworkers/cleaners (5%), were self emplol ed (5%).
Level of Education Number Percentage ValidPercentase
None 9 6.8 9.2Primary t5 I1.4 15.3SRP t7 12.9 l7.3SPM 38 28.8 38.8Form 6/Diploma l0 7.6 t0.2Degree 9 6.8 9.2Total 98 74.2 100.0Not available 5 3.8Not applicable 29 22.0Total 132 100.0
Occupation Number Percentage Val idPercentase
Unemployed 37 27.8 28.7Homemaker /J 17.3 17.8Factory/production worker 2 1.5 1.6C I eaner/General worker o 4.5 4.7
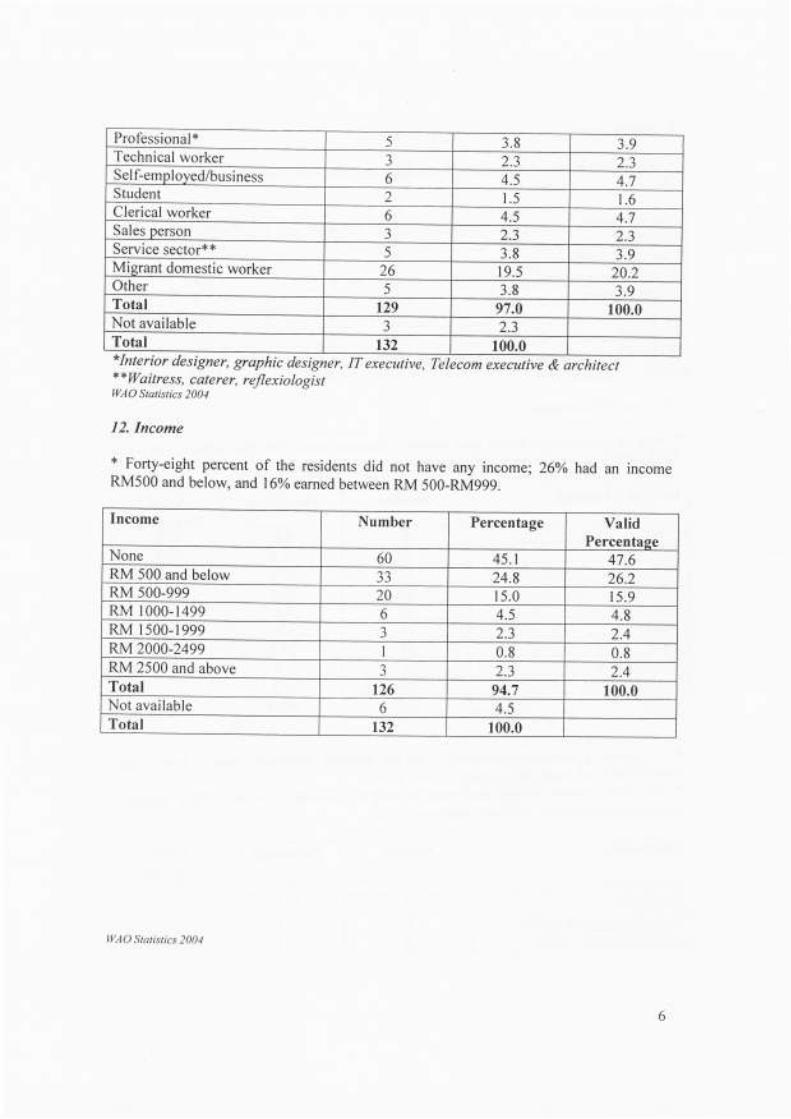
Professional* 5 3.8 3.9Technical worker J 2.3 2.3
Sel f-employed/business 6 4.5 4.7Student 2 1.5 1.6Clerical worker 6 4.5 4.7Sales person J 2.3 2.3Service sector** 5 3.8 3.9Migrant domestic worker 26 19.5 20.2Other 5 3.8 3.9Total 129 97.0 100.0Not available a
J 2.3Total r32 100.0*Interior designer, graphic designer, IT executive, iete*m executive a ;rchitect* *Waitre s s, c aterer, refl exiolo gi s tWAO Statistics 2004
12. Income
* Forty-eight percent of the residents did not have any income; 26Yo had an incomeRM500 and below, and 160/o earned between RM 500-RM999.
lncome Number Percentage ValidPercentase
None 60 45.1 47.6RM 500 and below 33 24.8 26.2RM s00-999 20 15.0 15.9RM 1000-1499 6 4.5 4.8RM 1500-1999 3 2.3 2.4RM 2000-2499 I
l 0.8 0.8RM 2500 and above a
1 z.) 2.4Total 126 94.7 100.0Not available 6 4.5Total 132 100.0
IIIAO Snristics 2004
B) INFORMATION ON DOMESTIC VIOLENCE
a) INFORMATION ON THE ABUSE
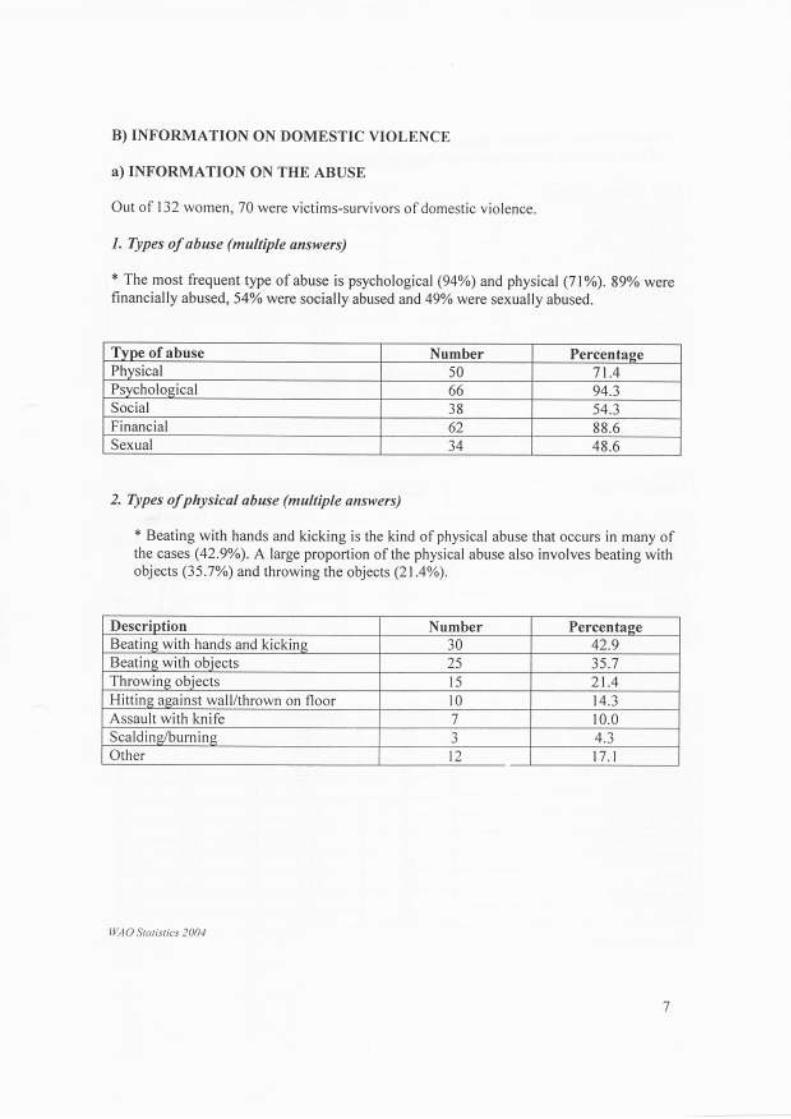
Out of 132 women, 70 were victims-survivors of domestic violence.
I. Types of abuse (multiple answers)
* The most frequent type of abuse is psycholo gical (94%) and physical (7l%). 89Yo werefinancially abused, 54o/o were socially abused and 49o/o were sexually abused.
2. Types of physical abuse (multiple answers)
t Beating with hands and kicking is the kind of physical abuse that occurs in many ofthe cases (42.9%). A large proportion of the physical abuse also involves beating withobjects (35.7%) and throwing the objects (21.4%).
Type of abuse Number PercentasePhysical 50 7 t .4Psychological 66 94.3Social 38 54.3Financial 62 88.6Sexual 34 48.6
Description Number PercentaseBeatins with hands and kickins 30 42.9Beating with obiects 25 35.7Throwing obiects 21.4Hitting against wall/thrown on floor l0 14.3Assault with knife 7 10.0Scalding/burnine J
i1+.J
Other t2 t7. l
I I /AO Statist ics 2004
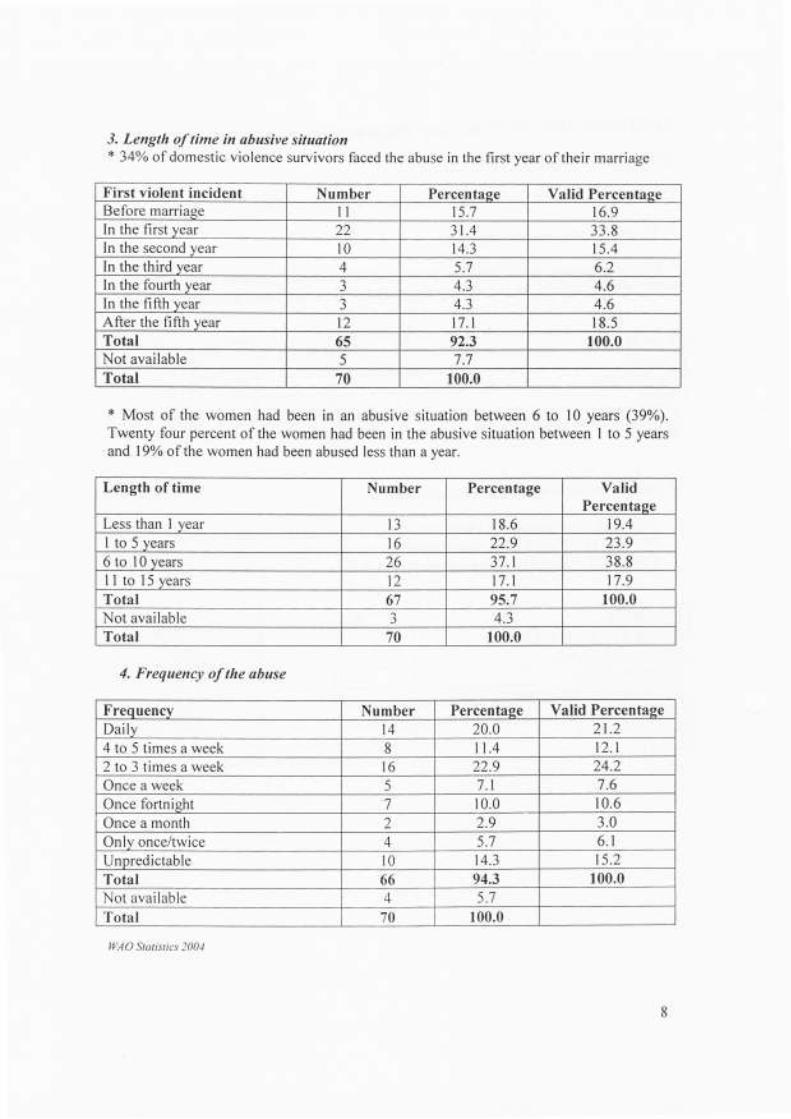
First violent incident Number Percentase Valid PercentapeBefore marriase l l t5.7 16.9In the first vear 22 3t.4 33.8In the second year l0 14.3 15.4In the third vear 4 5.7 6.2In the fourth year 3 4.3 4.6In the fifth year a
J 4.3 4.6After the fifth vear I2 t7. l 18.5Total 65 92.3 100.0Not available 5 7.7Total 70 100.0
3. Length of time in abusive situation* 34yo of domestic violence survivors faced the abuse in the first year of their marriase
* Most of the women had been in an abusive situation between 6 to l0 years (39%).Twenty four percent of the women had been in the abusive situation between I to 5 yearsand l9Yo of the women had been abused less than a vear.
4. Frequency of the obuse
Length of t ime Number Percentage Val idPercentase
Less than 1 year r3 18.6 19.4I to 5 years t6 22.9 23.96 to l0 vears 26 37. l 38.8l l to15vears 12 t7. l t7.9Total 67 95.7 100.0Not available a
J 4.3Total 70 100.0
Frequency Number Percentage Valid PercentaseDai ly t4 20.0 21.24 to 5 times a week 8 11.4 t2. l2 to 3 times a week l6 22.9 24.2Once a week 5 7.1 7.6Once fortnisht 1 10.0 t0.6Once a month 2 2.9 3.0Onlv once/twice A
a 5.7 6.tUnpredictable t0 t4.3 t5.2Total 66 94.3 100.0Not available A
T 5.7Total 70 r00.0
l (AO Statist ics 2004
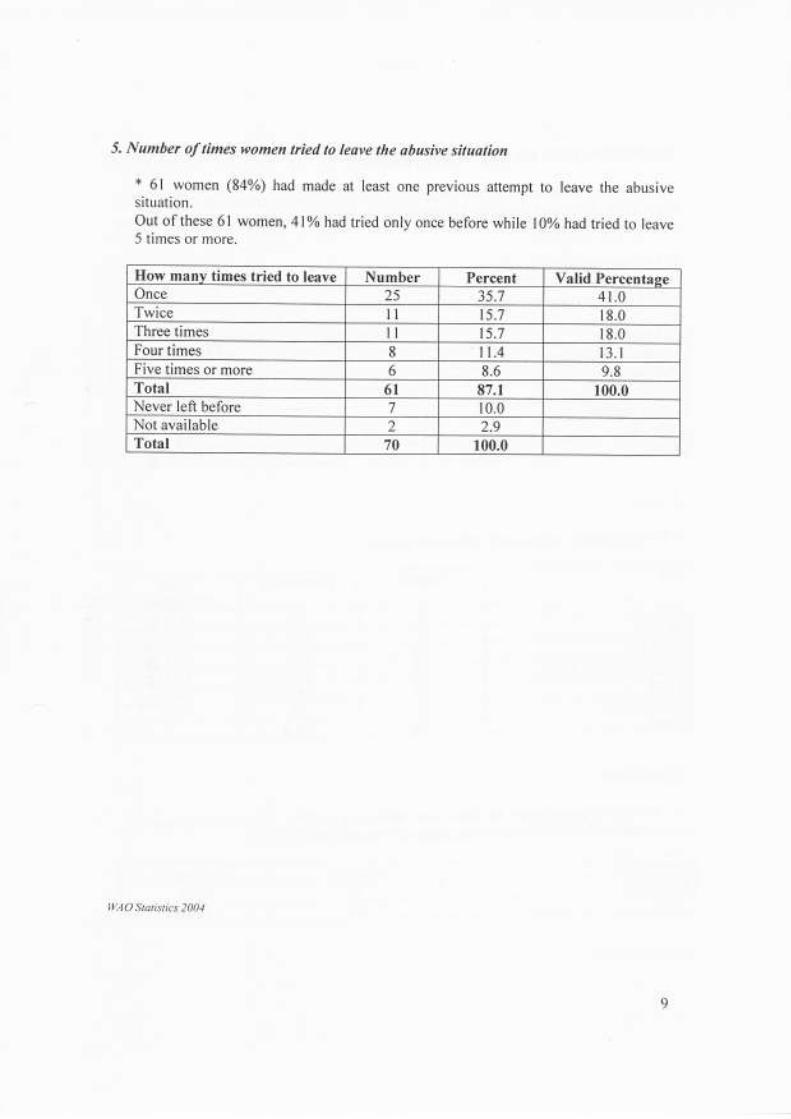
5. Number of times women tried to leave the abusive situation
* 6l women (84%) had made at least one previous attempt to leave the abusivesituation.Out of these 6l women,4lo/o had tried only once before while l0% had tried to leave5 times or more.
How many times tried to leave Number Percent Valid PercentaseOnce 25 35.7 4l.0Twice l l 15.7 18.0Three times l l t5.7 18.0Four times 8 n.4 13.1Five times or more 6 8.6 9.8Total 61 87.1 100.0Never left before 7 r0.0Not available 2 2.9Total 70 100.0
9
IttAO Statistics 2004
b) INFORMATION ON THE PERPETRATORS
The following information on the perpetrators reinforces the understanding that battererscome from all classes, races and professions. Furthermore, more women are reportingabuse by boyfriends.
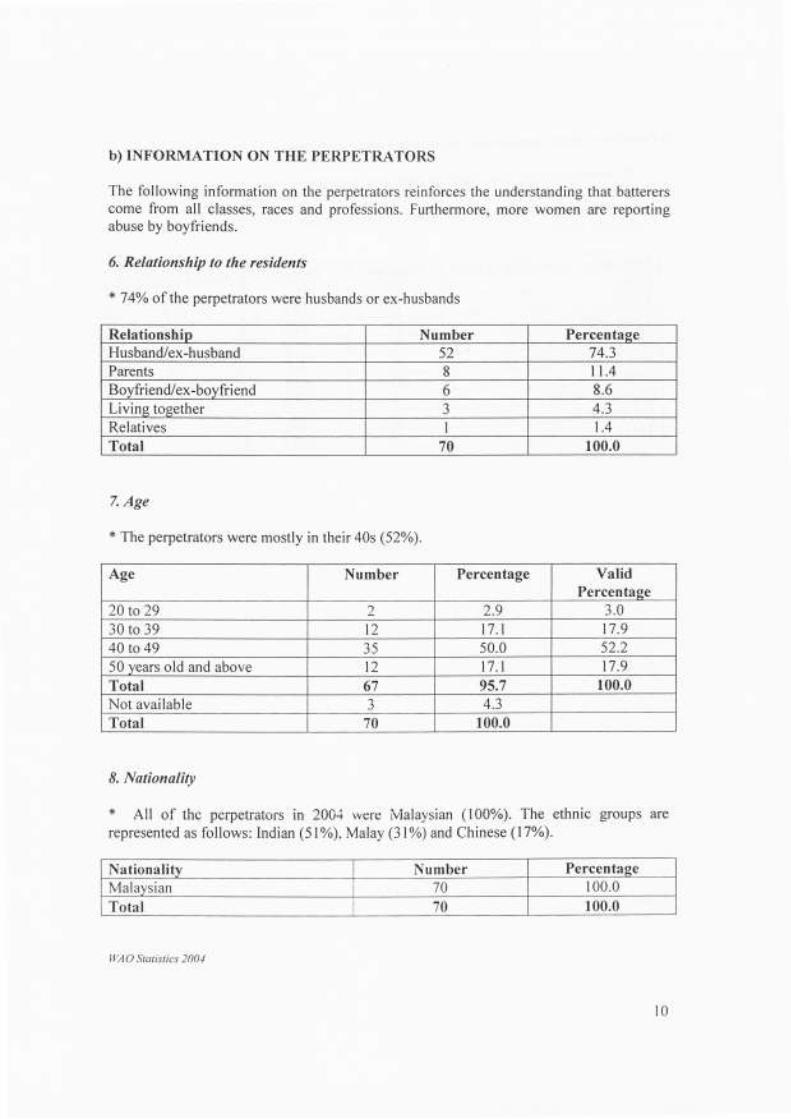
6. Relationship to the residents
* 740 of the perpetrators were husbands or ex-husbands
7. Age
+ The perpetrators were mostly in their a}s Q2%).
8. Nationality
* All of thc perpetrators in 2004 were ivialaysian (100%). The ethnic groups arerepresented as follows: Indian (51%), Malay (31%) and Chinese (17%).
Relationshin Number PercentaseHusband/ex-husband 52 74.3Parents 8 t t .4Bovfriend/ex-bovfri end 6 8.6Living together J 4.3Relatives I 1.4Total 70 r00.0
Age Number Percentage ValidPercentage
20 to 29 z 2.9 3.030 to 39 t2 17 . l t7.940 to 49 35 s0.0 52.250 vears old and above t2 17.1 17.9Total 67 95.7 100.0Not available a
J 4.3Total 70 100.0
Nationalifv Number PercentageMalavsian 1n r00.0Total 70 100.0
IItAO Statistics 2004
l0
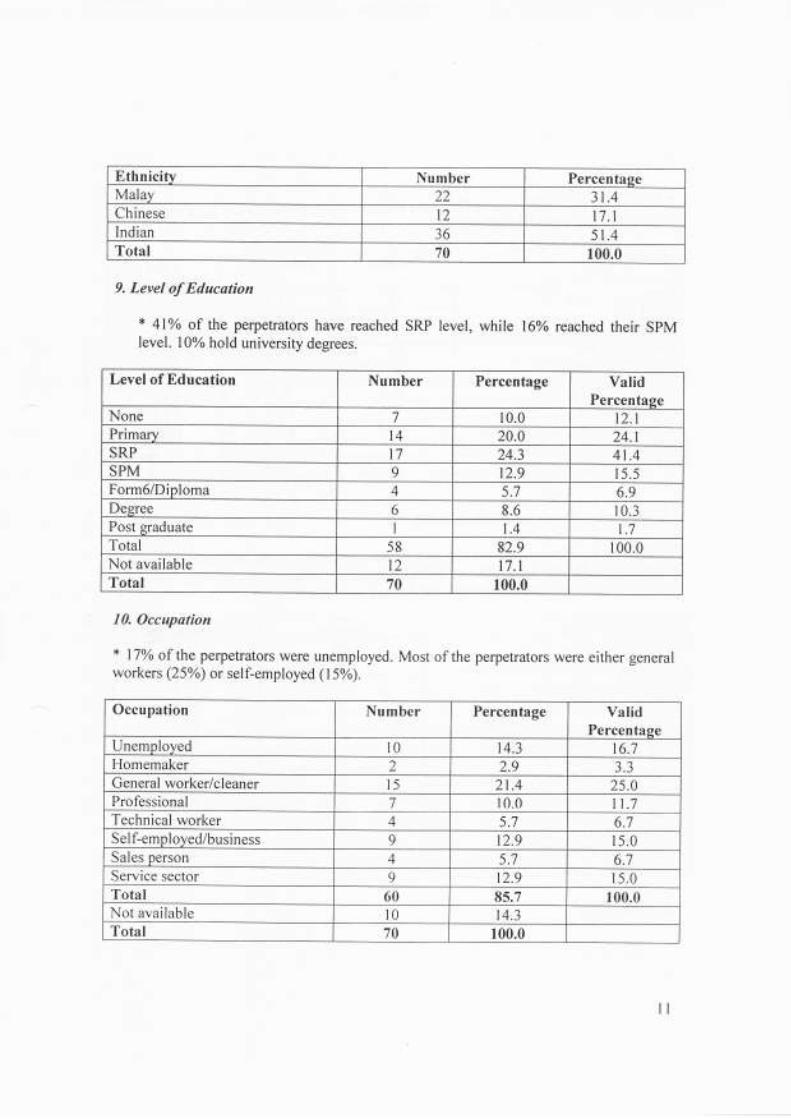
Ethnicitv Number PercentageMalay 22 3t.4Chinese 12 t7. llndian 36 51.4Total 70 r00.0
9. Level of Education
* 4106 of the perpetrators have reached SRP level, while 160/o reached their SPMIevel. l0% hold university degrees.
10. Occupation
+ lToA of the perpetrators were unemployed. Most of the perpetrators were either generalworkers (25%) or self-employed (15%).
l l
Level of Education Number Percentage ValidPercentage
None 7 10.0 t2. lPrimary l4 20.0 24.1SRP 17 24.3 4t.4SPM 9 12.9 r5.5Form6/Diploma t 5.7 6.9Degree 6 8.6 t0.3Post sraduate t .4 t . l
Total 58 82.9 100.0Not available t2 t7. lTotal 70 100.0
Occupation Number Percentage ValidPercentage
Unemployed t0 14.3 16.7Homemaker 2 2.9 3.3General worker/cleaner l5 21.4 25.0Professional 7 t0.0 11.7Technical worker A 5.7 6.7Sel f-employed/business 9 12.9 15.0Sales person { 5.7 6.7Service sector o 12.9 r 5.0Total 60 85.7 100.0Not avai lable l0 14.3Total 70 100.0
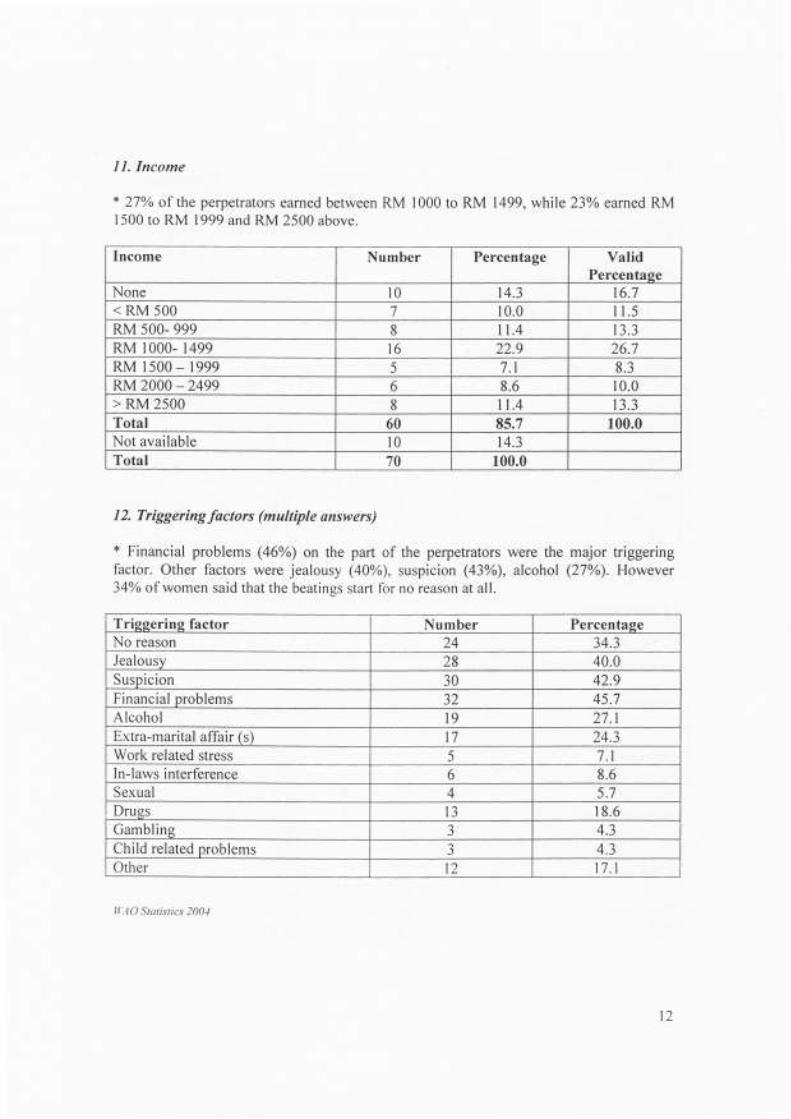
Income Number Percentage ValidPercentape
None l0 14.3 t6.7< RM 500 7 10.0 I 1.5RM s00- 999 8 I 1.4 13.3RM 1000- 1499 16 22.9 26.7RM 1500 -1999 5 7.1 8.3RM 2000 -2499 6 8.6 10.0> RM 2500 8 I1.4 13.3Total 60 85.7 100.0Not available l0 14.3Total 70 r00.0
11. Income
+ 27yo of the perpetrators earned between RM 1000 to RM 1499, while 23% earned RM1500 to RM 1999 and RM 2500 above.
I 2. Triggering factors (mulliple answers)
+ Financial problems (46%) on the part of the perpetrators were the major triggeringfactor. Other factors were jealousy (40%), suspicion (43%), alcohol (27%). However34%o of women said that the beatinss start for no reason at all.
Triggering factor Number PercentaseNo reason 24 34.3Jealousy 28 40.0Suspicion 30 42.9Financial problems JZ 45.7Alcohol l9 27.1Extra-marital affair (s) t7 24.3Work related stress 5 7.1In-laws interference 6 8.6Sexual A
t ) . t
Dru taIJ 18.6
Gambling -) 4.3Child related problems J 4.3Other t2 l7. l
l l ' .1O Statist ics 2004
l2
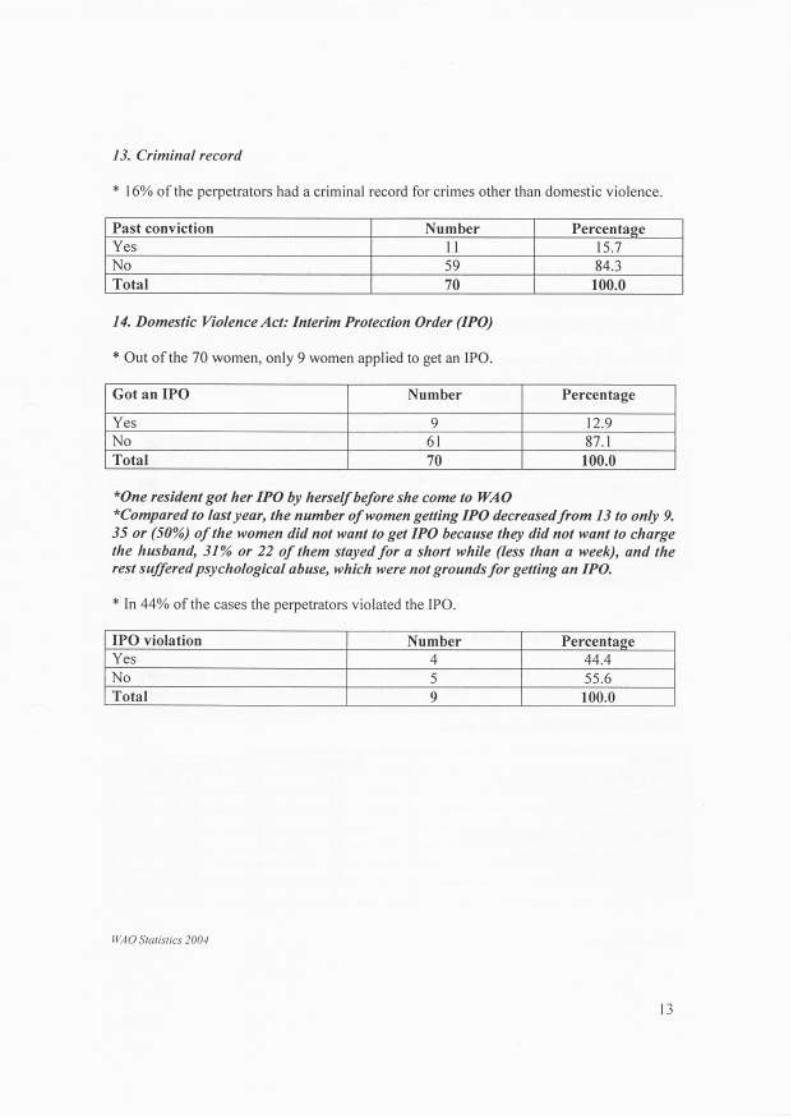
Past conviction Number PercentageYes l l 15.7No s9 84.3Total 70 100.0
13. Criminal record
* l6yo of the perpetrators had a criminal record for crimes other than domestic violence.
14. Domestic Violence Act: Interim Protection Order (IPO)
* Out of the 70 women, only 9 women applied to get an IPO.
*One resident got her IPO by herself before she come to WAO*Compared to last year, the number of women getting IPO decreosedfrom 13 to only 9.35 or (50%) of the women did not want to get IPO because they did not want to chargethe husband, 3I% or 22 of them stayed for o short while (less than a week), and therest suffered psychological abuse, which were not grounds for getting an IPO,
* In 44o/o of the cases the perpetrators violated the IPO.
Got an IPO Number Percentage
Yes 9 12.9No 6l 87.1Total 70 100.0
IPO violation Number PercentageYes + 44.4No 5 55.6Total 9 100.0
IVAO Statist ics 2004
l3
c) OUTCOMES
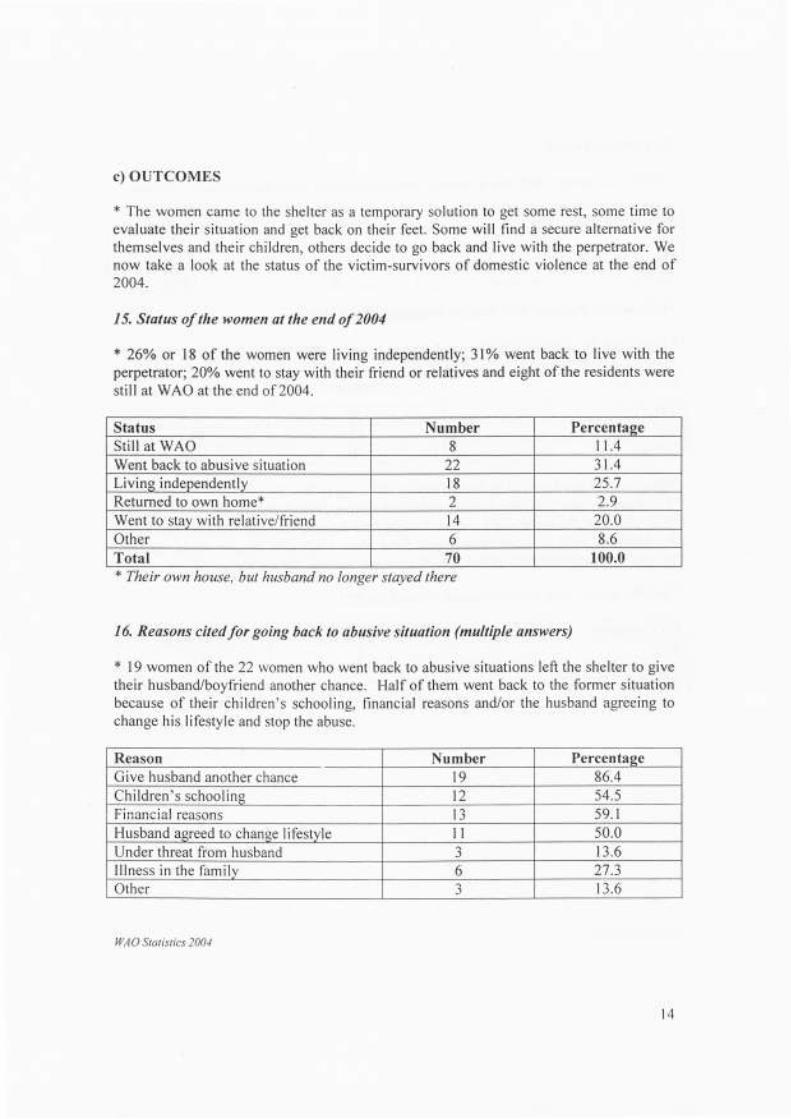
* The women came to the shelter as a temporary solution to get some rest, some time toevaluate their situation and get back on their feet. Some will find a secure alternative forthemselves and their children, others decide to go back and live with the perpetrator. Wenow take a look at the status of the victim-survivors of domestic violence at the end of2004.
15. Status of the women at the end of 2004
* 26yo or 18 of the women were living independently;3lo/o went back to live with theperpetrator; 20%o went to stay with their friend or relatives and eight of the residents werestill at WAO at the end of 2004.
* Their own house, but husband no longer stayed there
16. Reasons cited for going back to abusive situation (multiple answers)
* l9 women of the 22 r.vomen who went back to abusive situations left the shelter to givetheir husbandiboyfriend another chance. Half of them went back to the former situationbecause of their children's schooling, financial reasons and/or the husband agreeing tochange his lifestyle and stop the abuse.
Status Number PercentageStill at wAo 8 n.4Went back to abusive situation 22 3t.4Livins independentlv 18 25.7Returned to own home* 2 2.9Went to stay with relative/friend 14 20.0Other 6 8.6Total 70 100.0
Reason Number PercentageGive husband another chance 9 86.4Chi ldren's school ins 2 54.5Financial reasons 59. lHusband asreed to chanse lifestvle I 50.0Under threat from husband a
J 13.6Il lness in the familv 6 27.3Other J 13.6
l lAO Statist ics 2004
l4
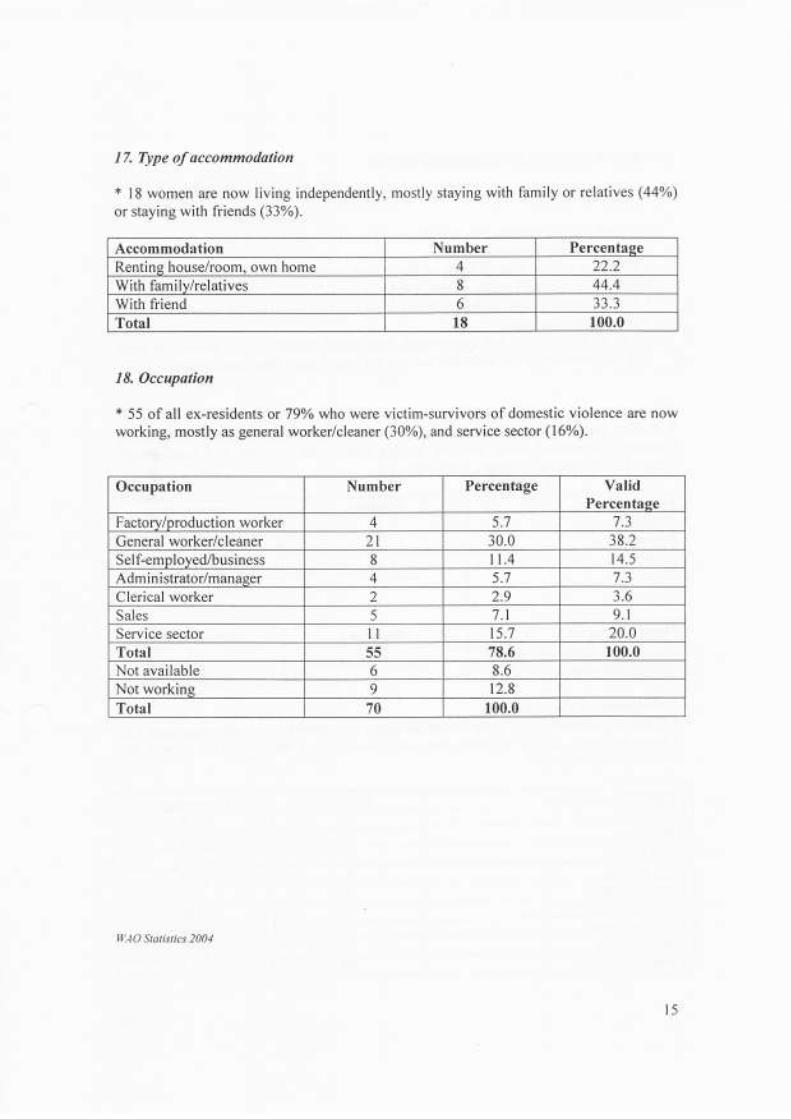
Accommodation Number PercentapeRentins house/room. own home 4 22.2w th familv/relatives 8 44.4w th friend 6 33.3Total 18 100.0
17. Type of accommodation
* l8 women are now living independently, mostly staying with family or relatives (44%)or staying with friends (33%).
18. Occupation
* 55 of all ex-residents or 79o/o who were victim-survivors of domestic violence are nowworking, mostly as general worker/cleaner (30%), and service sector (16%).
Occupation Number Percentage ValidPercentase
Factorv/oroduction worker 4 5.7 nat.)
General worker/cleaner 2l 30.0 38.2S el f-emp I oyed/b us ine s s 8 t t .4 14.5Adm i nistrator/manaser A
T 5.7 na
Clerical worker 2 2.9 3.6Sales 5 7.1 9.1Service sector l1 15.7 20.0Total f,f, 78.6 100.0Not available 6 8.6Not workins 9 12.8Total 70 100.0
WAO Statistics 2004
l5
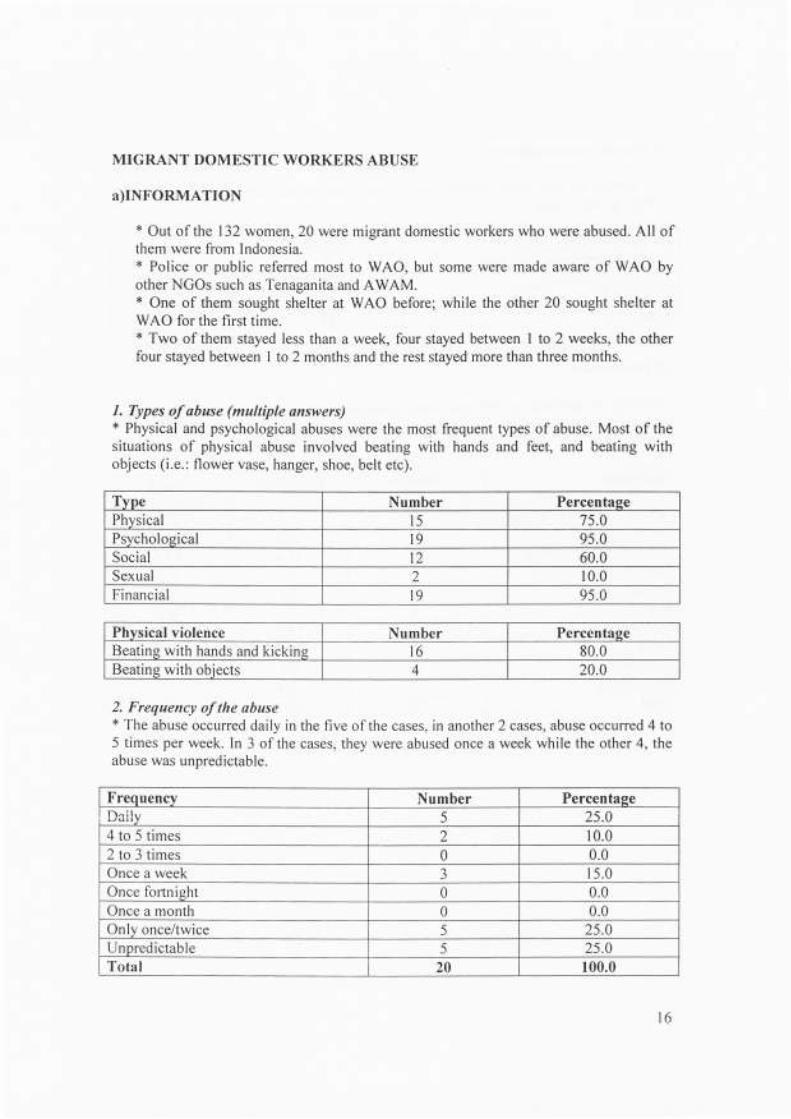
MIGRANT DOMESTIC WORKERS ABUSE
a)INFORMATION
* Out of the 132 women,20 were migrant domestic workers who were abused. All ofthem were from Indonesia.* Police or public referred most to WAO, but some were made aware of WAO byother NGOs such as Tenaganita and AWAM.+ One of them sought shelter at WAO before; while the other 20 sought shelter atWAO for the first time.t Two of them stayed less than a week, four stayed between I to 2 weeks, the otherfour stayed between I to 2 months and the rest stayed more than three months.
I. Types of abuse (multiple answers)* Physical and psychological abuses were the most frequent types of abuse. Most of thesituations of physical abuse involved beating with hands and feet, and beating withobjects (i.e.: flower vase, hanger, shoe, belt etc).
2. Frequency of the obuse* The abuse occurred daily in the five ofthe cases, in another 2 cases, abuse occurred 4 to5 times per week. In 3 of the cases, they were abused once a week while the other 4, theabuse was unpredictable.
Type Number PercentasePhysical 15 7s.0Psychological 19 9s.0Social t2 60.0Sexual 2 10.0Financial l9 95.0
Physical violence Number PercentageBea ngw th hands and kickins 16 80.0Bea ngw th obiects 4 20.0
Frequency Number Percentapen^; l 5 25.0A-' to 5 times 2 10.02 to 3 t imes 0 0.0Once a week { r 5.0Once fortnisht 0 0.0Once a month 0 0.0Only once/twice 5 25.0Unpredictable 5 25.0Total 20 100.0
t6
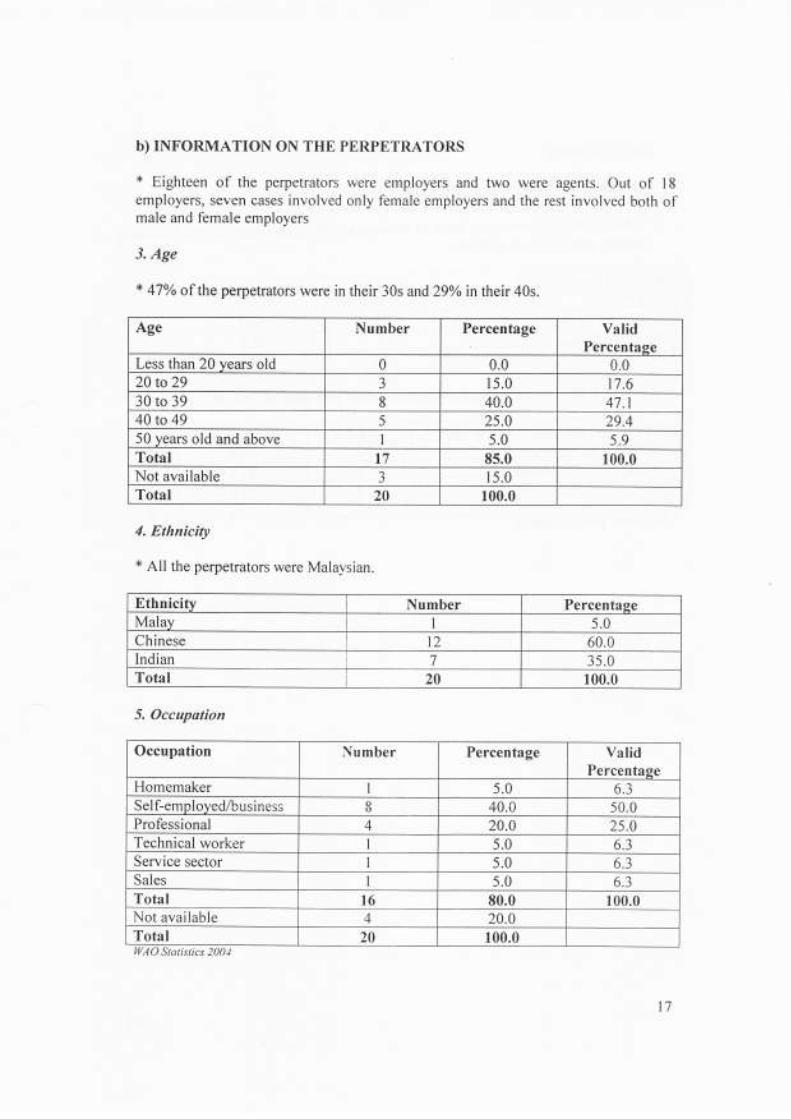
b) INFORMATION ON THE PERPETRATORS
* Eighteen of the perpetrators were employers and two were agents. Out of l8employers, seven cases involved only female employers and the rest involved both ofmale and female employers
3. Age
* 47yo of the perpetrators were in their 30s and 29% in their 40s.
4. Ethnicity
* All the perpetrators were Malaysian.
5. Occupation
Age Number Percentage ValidPercentage
Less than 20 years old 0 0.0 0.020 to 29 a
J 15.0 t7.630 to 39 8 40.0 47.140 to 49 5 25.0 29.450 years old and above 5.0 5.9Total t7 85.0 100.0Not available J 15.0Total 20 100.0
Ethnicitv Number PercentaseMalay I 5.0Chinese ta
IL 60.0Indian - 3s.0Total 20 100.0
Occupation Number Percentage ValidPercentage
Homemaker 5.0 6.3S e I f-em p I oyed,ibu s in e s s o 40.0 50.0Professional 4 20.0 25.0Technical worker I 5.0 6.3Service sector I 5.0 6.3Sales I 5.0 6.3Total t6 80.0 100.0Not avai lable 4 20.0Total 20 100.0WAO Statistics 2001
17
C) OUTCOMES
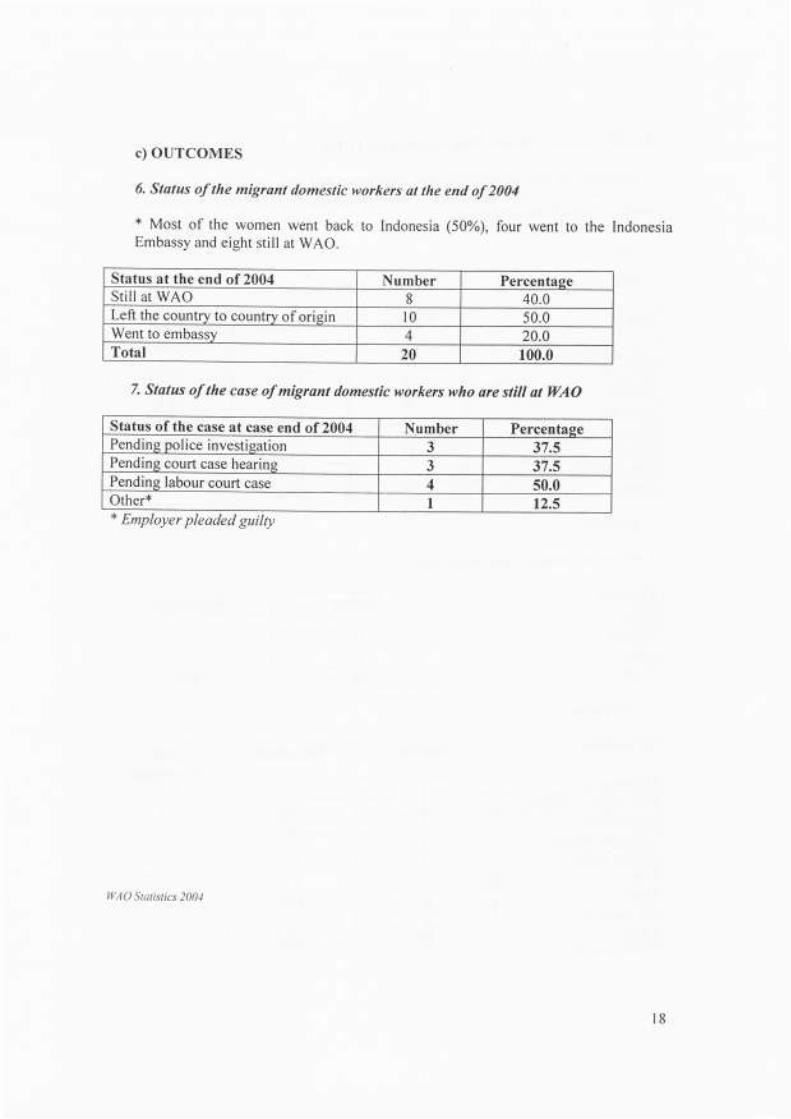
6. Status of the migrant domestic workers at the end of 2004
* Most of the women went back to Indonesia (50o/o), four went to the IndonesiaEmbassy and eight still at WAO.
Status at the end of2004 Number PercentaseSti l l at WAO 8 40.0Left the country to country of orisin l0 50.0Went to embassv 4 20.0Total 20 100.0
7. Status of the case of migrant domestic workers who are still at WAO
Status ofthe case at case end of2004 Number PercentasePendng police investigation 3 37.5Pendng court case hearing 3 37.sPendng labour court case 4 50.0Other* I 12.5* Employer pleaded guilty
lltAO Statistics 2004
l8
WAO STATISTICS 2OO4
***'k**)k*** FACE TO FACE COUNSELING FOR 2004 *****'k:k*r.**
A. GENERAL INFORMATION
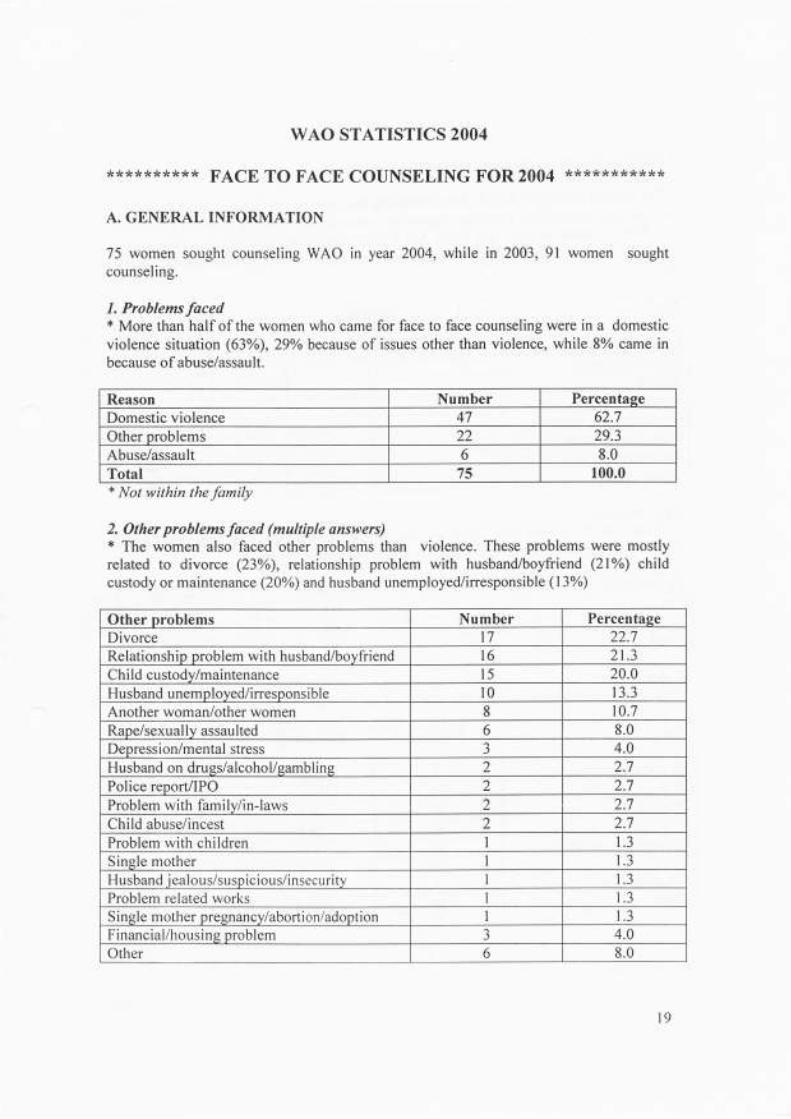
75 women sought counseling WAO in year 2004, while in 2003,91 women soughtcounseling.
L Problemsfaced* More than half of the women who came for face to face counseling were in a domesticviolence situation (63%), 29o/o because of issues other than violence, while 804 came inbecause of abuse/assault.
* Not within the family
2. Other problems faced (multiple answers)* The women also faced other problems than violence. These problems were mostlyrelated to divorce (23oA), relationship problem with husband/boyfriend (21%) childcustody or mainten ance (20o/o) and husband unemployed/irresponsible ( I 3%)
Reason Number PercentaseDomestic violence 47 62.7Other problems 22 29.3Abuse/assault 6 8.0Total /5 100.0
Other oroblems Number PercentaseDivorce 7 22.7Relationship problem with husband/bovfriend 6 21.3Chi ld custody/maintenance 5 20.0Husband unemploved/irresoonsible 0 13.3Another woman/other women 8 10.7Raoe/sexual ly assau lted 6 8.0Depression/mental stress 3 4.0Husband on druss/alcohol/samblins 2 2.7Police report/lPo 2 2.7Problem with fami lv/in-laws 2 2.7Child abuse/incest 2 2.1Problem with children 1.3Sinele mother 1.3Husband iealous/suspicious/insecuritv 1.3Problem related works l .J
S ngle mother pre gnancv/aborti on/adoption 1.3F nancial ihousins nroblem a
J 4.0Other 6 8.0
r9
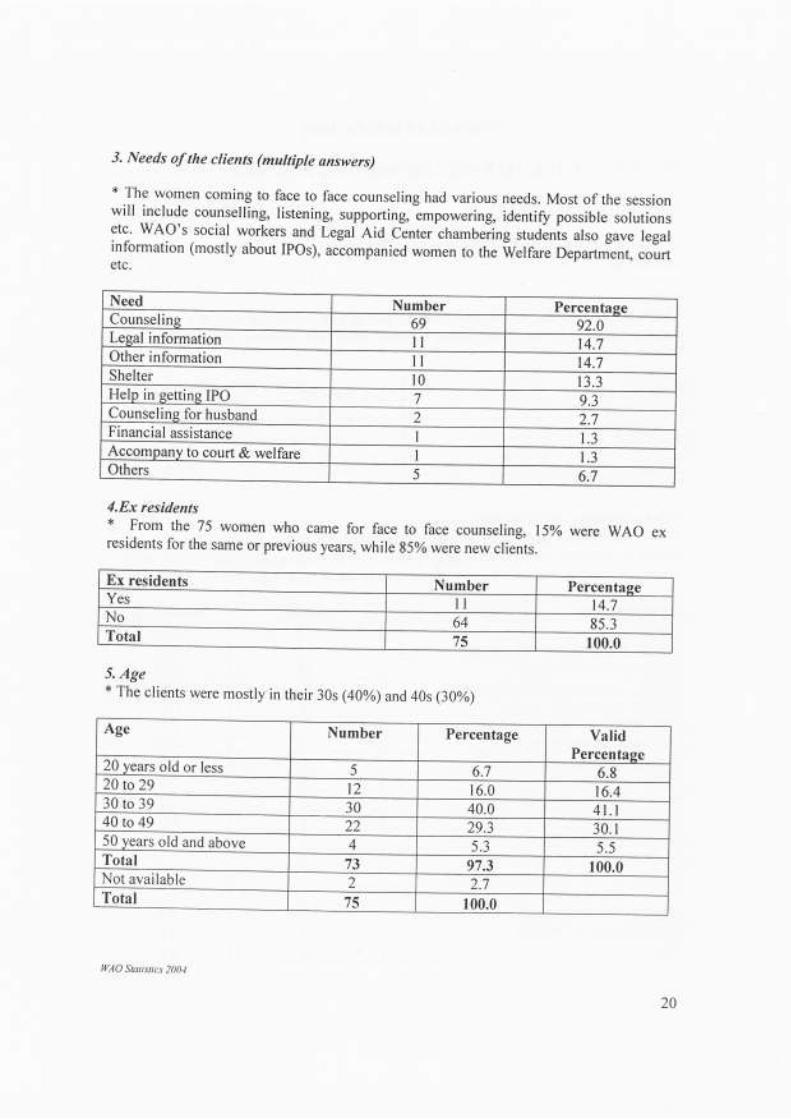
3. Needs of the clients (multiple answers)
* The women coming to face to face counseling had various needs. Most of the sessionwill include counselling, listening, supporting, irpo*ering, identif possible solutionsetc' WAO's social workers and Legal Aid Cinter-chambeiing studenis also gave legalinformation (mostly about IPOs), accompanied women to the Welfare Departm-ent, courtetc.
Need Number PercentageCounseling 69 92.0Legal information l l t4.7Other information l l t4.7Shelter l0 r3.3Help in ggtting IPO 7 9.3Counseling fgr husband 2 2.7Financial assistance 1.3Accompany to court & welfare I 1.3Others ) 6.7
4.Ex residents* From the 75 women who came for face to face counseling, l5olo were WAO exresidents for the same or previous years, while g5% were new clients.
5. Age* The clients were mostly in their 30s (40%) and 40s (30%)
Ex residents Number PercentaseYes l l t4.7No 64 85.3Total
/ f , 100.0
Age Number Percentage ValidPercentage
20 years old or less 5 6.7 6.820 to29 12 16.0 r6.430 to 39 30 40.0 4t. l40 to 49 22 29.3 30. I50 years old and above 4 5.3 5.5Total 73 97.3 100.0Not available 2 2.7Total / f , 100.0
IIIAO Staristics 2001
20
State Number Percentage ValidPercentase
Wilayah Persekutuan KualaLumpur
21 28.0 30.0
Selangor 40 53.3 57.1Johor 2 2.7 2.9Neeeri Sembilan 2 2.7 2.9Kedah 1.3 1.4Pulau Pinans 2 2.7 2.9Melaka 2 2.7 2.9Total 70 93.3 100.0Not available 5 6.7Total / f , 100.0
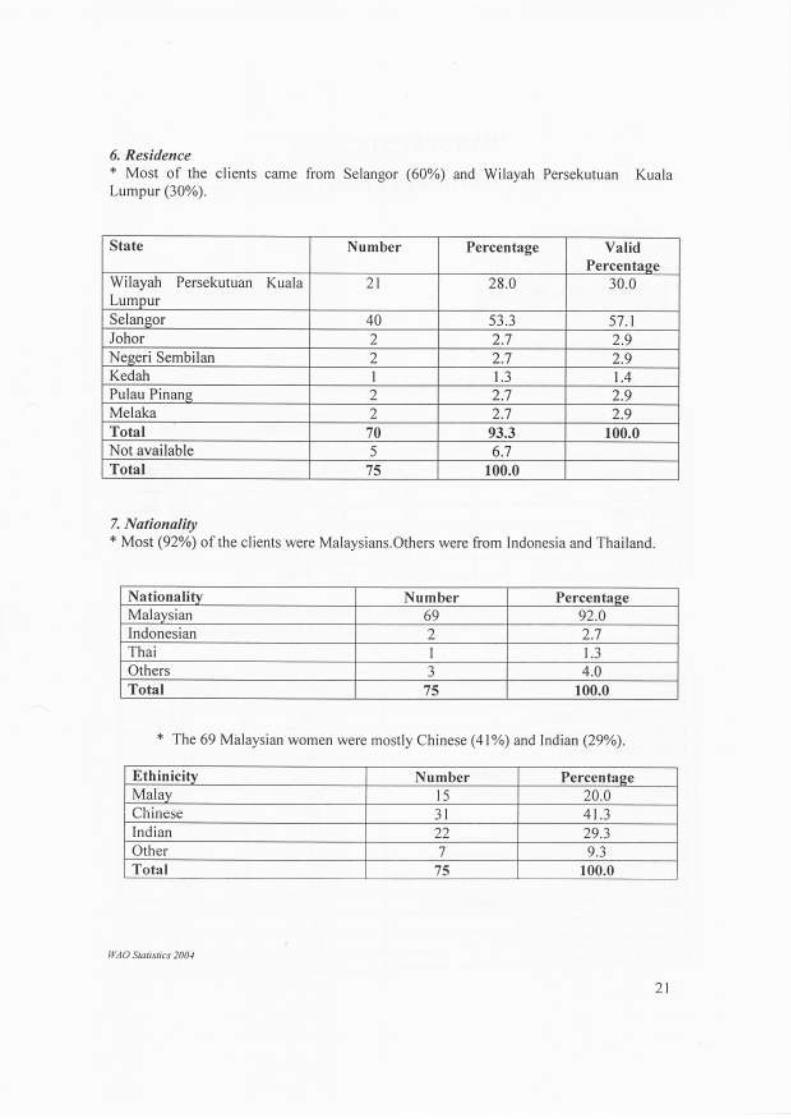
6. Residence* Most of the clients came from Selangor (60%) and Wilayah Persekutuan KualaLumpur (30%).
7. Nationalityt Most (92%) of the clients were Malaysians.Others were from Indonesia and Thailand.
* The 69 Mirlaysian women were mostly Chinese (41%) and Indian (29%).
Nationalitv Number PercentageMalaysian 69 92.0Indonesian 2 2.7Thai I 1.3Others a
J 4.0Total /5 100.0
Ethinicitv Number PercentaseMalay l5 20.0nt^: , - - - -\-I ltf l9sc 3l 41.3lndian 22 29.3Other 1 9.3Total /3 100.0
WAO Statistics 2001
21
WAO STATISTICS 2OO4
t r*******)k:k:kt( :k?k*:k* TELEPHONE COUNSELING t( :ktr t r?k:k*t()k?k?k*)k 'k*
A. GENERAL INFORMATION
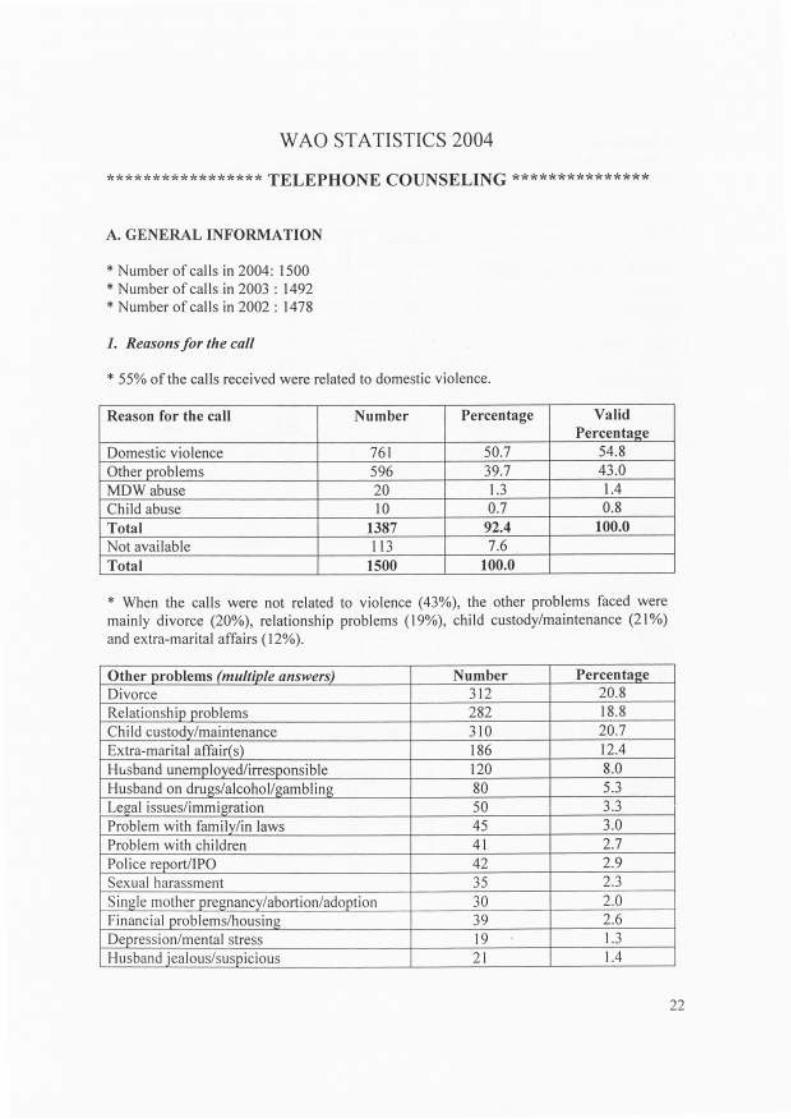
* Number of calls in 2004: 1500* Number of cal ls in 2003 :1492* Number of cal ls in2002: 1478
I. Reasons for the call
* 55o of the calls received were related to domestic violence.
* When the calls were not related to violence (43%), the other problems faced weremainly divorce (20%), relationship problems (19%), child custody/maintenance (ZlYo)and extra-marital affairs (12%).
Reason for the call Number Percentage ValidPercentase
Domestic violence 761 50.7 54.8Other problems 596 39.7 43.0MDW abuse 20 1.3 t .4Child abuse 10 0.7 0.8Total 1387 92.4 100.0Not available l13 7.6Total 1500 100.0
Other problems (multiple answers) Number PercentaseDivorce 312 20.8Relationship problems 282 18.8Chi ld custodv/maintenance 310 20.7Extra-marital affair(s) 186 t2.4Husband unemDloved/inesponsible r20 8.0Husband on druss/alcohol/eambl ins 80 5.3Leeal issues/immi lon 50 aa
J.J
Problem w th familv/in laws 45 3.0Problem w th children 4l 2.7Police report/lPO 42 2.9Sexual harassment 35 2.3S ingle mother pregnancy/abortion/adoption 30 2.0Financial problems/housins 39 2.6Depressi on/mental stress 19 1.3Husband iealous/suspicious 2l t .4
zz
Single motherChild abuse/incest
sexual assaultMigrant domestic rvorkerWork related p.oblemsHusband mentalD unrtabFstressOther problem-
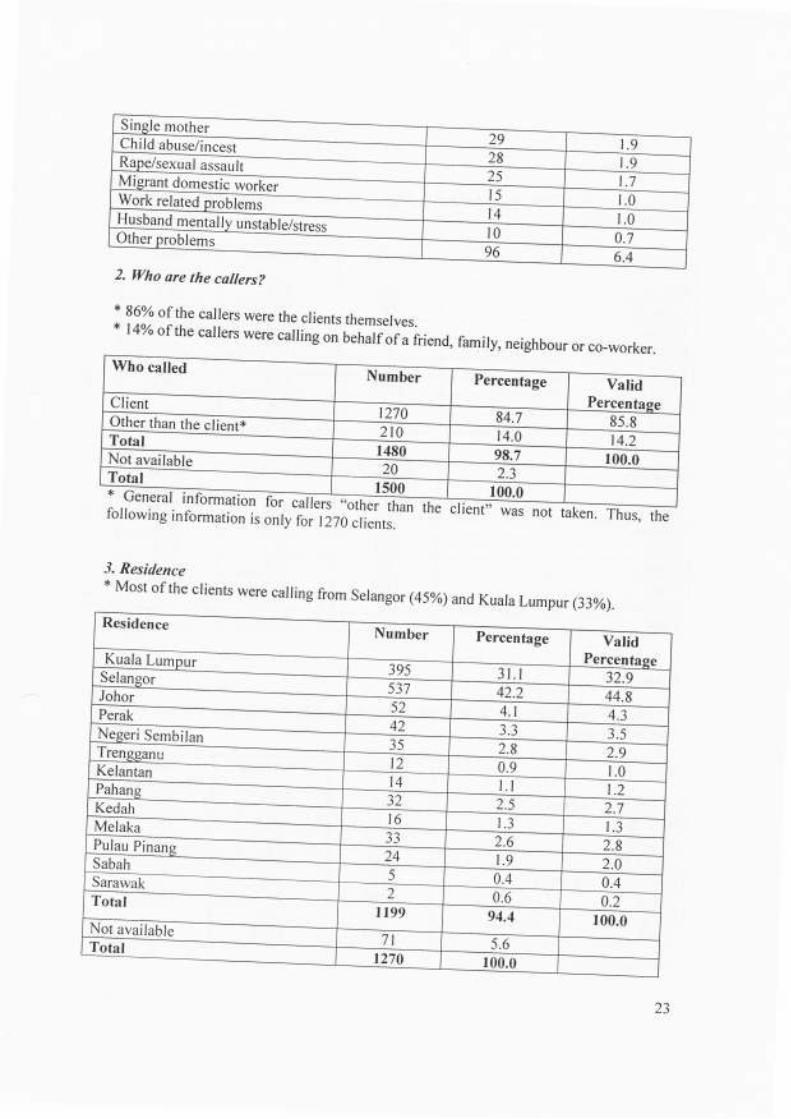
2. |Yho are the callers?
* 86yo of the callers were the clients themselves.* l4yo of the callers were calling on U.fruf f of a friend,
following information is onlv forers "other than the client was
family, neighbour or co_worker.
taken. Thus, the
Kuala Lumpur (33%).
notI270 cl ients.
3. Residence* Most of the clients were calling from Selangor (45%) and
Who called
-utrent
F-trJot available
-
Number Percentage ValidPercentage
1270 84.7 85.814.2210 14.0
r480 98.7 100.020 2.3
1s00 100.0Uengfal infnrmorin- €
Resido--o
Kuala LumourSelangor
-JohorreraK
-Negen SembilanI rengganr!
Number Percentage VatidPercentage
39s 3l. t 32.9537 42.2 44.852 4.1 4.3A''+z { \J) 2.8 2.9
\ I
tz 0.9 1.0t4 I . l 1.2)z 2.s 2.7l6 r .3 r .3
aaJJ 2.6 2.81ALA 1.9 2.05 0.4 0.42 0.6 0.2
7199 94.4 r00.0r rvr avClt ld,ul€
-Total 7l 5.6r270 r00.0
^az)
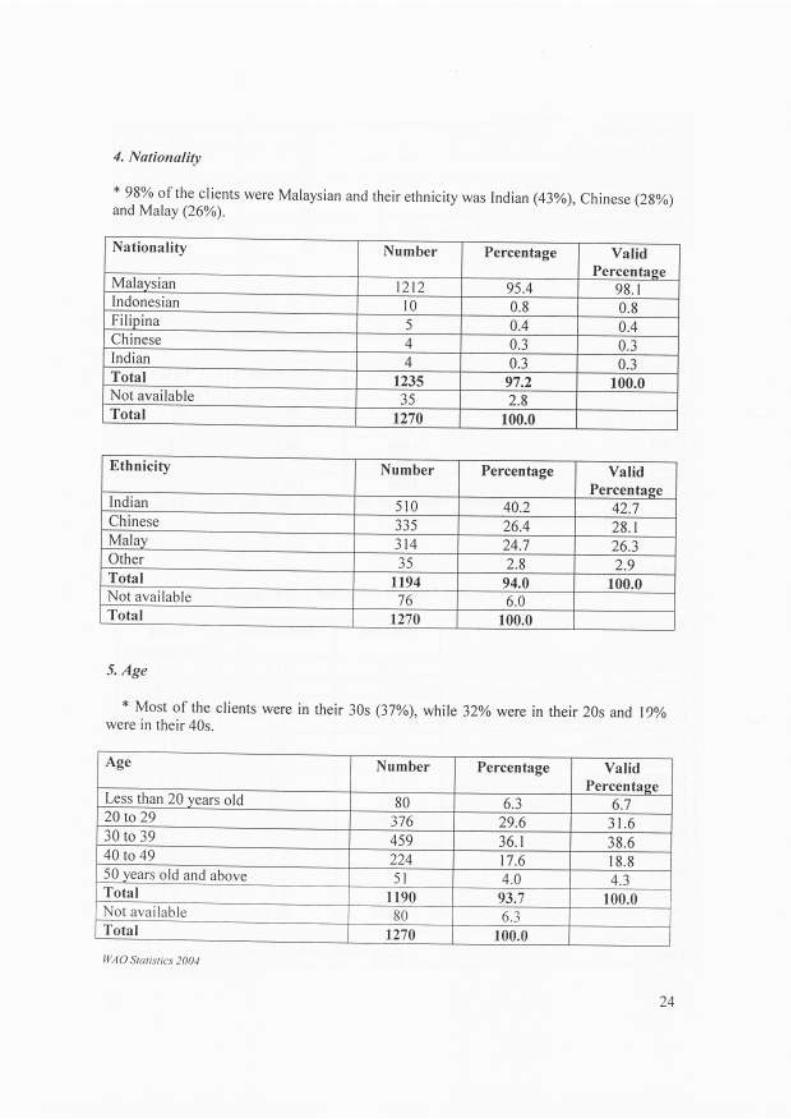
4. Nationality
+ 98yo of the clients were Malaysian and their ethnicity was Indian (43%),Chinese (2g%)and Malay (26%).
5. Age
* Most of the clients were in their 30s (37%), while 32%o were in their 20s and lgyowere in their 40s.
Nationality Number Percentage ValidPercentase
Malaysian t2t2 95.4 98. IIndonesian l0 0.8 0.8Fi plna ) 0.4 0.4Ch nese A+ 0.3 0.3Indian 4 0.3 0.3Total 1235 97.2 100.0Not available 35 2.8Total 1270 100.0
Ethnicity Number Percentage ValidPercentase
lndian 510 40.2 42.7Chinese 335 26.4 28.1Malay 314 24.7 26.3Other 35 2.8 2.9Total tt94 94.0 100.0Not available 76 6.0Total 1270 r00.0
Age Number Percentage ValidPercentaee
Less than 20 years old 80 6.3 6.720 to29 376 29.6 31.630 to 39 459 36.1 38.640 to 49 224 17.6 18.850 years old and above 5l 4.0 Aa
+-JTotal I 190 93.7 100.0Not avai lable 80 6.3Total t270 100.0WAO Statist ics 2004
1A
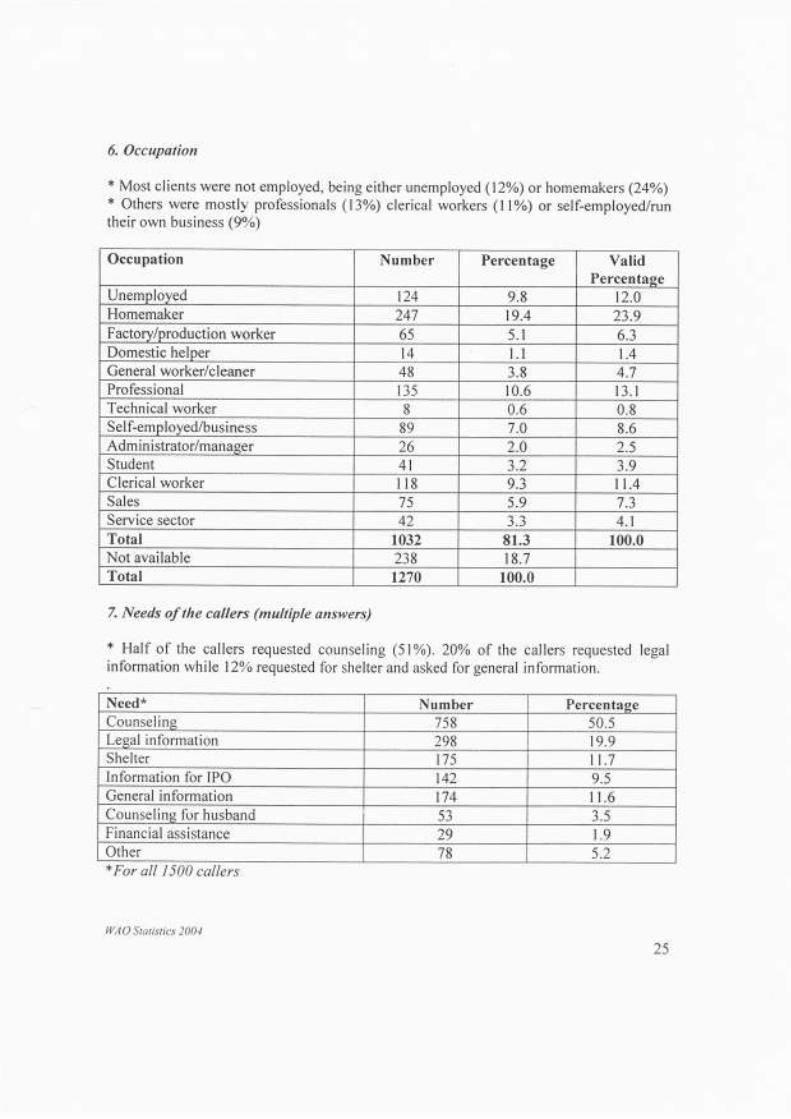
6. Occupation
* Most clients were not employed, being either unemployed (12%) or homemakers (24%o)* Others were mostly professionals (13%o) clerical workers (ll%) or self-employed/runtheir own business (9olo)
7. Needs of the callerc (multiple onswers)
* Half of the callers requested counseling (51%). 20% of the callers requested legalinformation while 129'o requested for shelter and asked for general information.
+For all 1500 callers
Occupation Number Percentage ValidPercentage
Unemployed t24 9.8 12.0Homemaker 247 19.4 23.9Factory/production worker 65 5.1 6.3Domestic helper t4 l . l t .4General worker/cleaner 48 3.8 4.7Professional 135 10.6 l3. lTechnical worker 8 0.6 0.8Sel f-emp loyed/business 89 7.0 8.6Adm in istrator/manager 26 2.0 2.5Student 4l 3.2 3.9Clerical worker I t8 9.3 n.4Sales 75 5.9 7.3Service sector 42 J.J 4.1Total 1032 81.3 100.0Not available 238 18.7Total 1270 100.0
Need* Number PercentageCounselins 758 )u.)Lesal information 298 19.9Shelter 175 lt .7Information for IPO t42 9.5General information t74 I 1.6Counselins for husband 53 3.5Financial assistance 29 1.9Other 78 5.2
Ll'AO Statistics 2004
25