universiti putra malaysia water quality studies in … · 2016-08-04 · penumpuan aktiviti guna...
TRANSCRIPT
UNIVERSITI PUTRA MALAYSIA
WATER QUALITY STUDIES IN MALACCA RIVER BASIN USING GEOGRAPHIC INFORMATION SYSTEMS (GIS)
MARRYANNA LION
FSAS 2003 37

DEDICATION
To my beloved families, father and mother; Lion Bayuhan and Tineh Tokius,
Mr. Dominic Borumbun and Mdm.Lily Gabil, Peter Dominic, Sisters; Esther, Paulina
Marny, Marcella Maslainie, Brother; Hillary Mark.
I dedicate this work with great love and appreciation for their kindness, encouragement,
and effort.
WATER QUALITY STUDIES IN MALACCA RIVER BASIN USING GEOGRAPHIC INFORMATION SYSTEMS (GIS)
By
MARRY ANNA LION
Thesis Submitted to the School of Gra"uate Studies, Universiti Putra Malaysia, in Fulfilment of the Requirements for the Degree of Master of Science
July 2003
Abstract of the thesis presented to the Senate of Universiti Putra Malaysia in fulfilment of the requirements for the Degree of Master of Science
A STUDY ON WATER QUALITY VARIATION IN MALACCA RIVER BASIN USING GEOGRAPHICAL INFORMATION SYSTEMS (GIS)
By
MARRY ANNA LION
July 2003
Chairman: Professor Mohd. Ibrahim Hj. Mohamed, Ph.D.
Faculty: Science and Environrpental Studies
Malacca Straits is recognized worldwide due to its importance as the busiest
waterway in the world. The environmental profile of the Malacca Straits points to
certain stresses in the ecosystem due to pollution load. Pollutants from land-based
sources are probably the most pressing environmental problem. Wastes from
agricultural, industrial, and domestic source discharge directly into the Straits or
indirectly via rivers, which flow into the Straits. As far as land based pollution is
concerned, study on river basin is important. The Malacca River basin is of the rivers
flowing into the Straits of Malacca.
iii
Geographic lnfonnation System (GIS) was used to map the water pol lution scenario
due to its abi lity to analyze spatial and temporal data. Beside that, correlation
coefficient method was used to determine the relationship and variation between
rainfa l l and water quality parameters . Six parameters selected for this study. namely.
Biochemical Oxygen Demand (BOD), Chemical Oxygen Demand (COD),
Ammoniacal Nitrogen. pH, Suspended Solid (SS), and Dissolved Oxygen (�O). The
output of this study consists of water qual ity database. maps, and graphs on the water
quality variations. The important of th i s study is the application of GIS technolog� in
monitoring water qual ity. Technology plays an important role for effective
environmental management .
Previously. the environmental data that stored manual ly requires a lot of space. This
method is not efficient in handl ing large amount of data because it i s also consume a
lot of time to retrieve. The GIS was created as a spatial tool, which make the
environmental monitoring easier thus changes in envi ronment are mon itored and
managed properly. With the advent of GIS system. monitoring of water qual ity can
be done more efficiently. This is because, a database could be used to interpolate and
produce different result according to its purposes. The GIS function such as a data
storage. query and analysis, and presentation are useful to shows the changes pattern
of water. quality in Malacca River basin from year to year. Based on the previous
iv
research done in Malaysia and other countries, it was proved that GIS has the abi l ity
as a tool in water qual i ty monitoring.
The study in Malacca River basin found that the quality of water is better at the
upstream compared with the downstream. This was due to the accumulation of land
use activ ities at the m iddle stream, which increased the pollution burden of the river.
Even though it was expected that there is a relat ionship between water qual ity
parameters and the amount of water received by this basin but the result shows that
there is no strong l inear correlation between these variables. The observation also
shows that a good correlat ion value was only found i n DO. The other parameters did
not show the acceptable level of correlation. If we look at the d istribution of each
parameter, it was found that SS has the h igher d istribution compared to the others.
Ammoniacal Nitrogen was observed h igher at the beginning of the observation
however its distribution became more consistent for the rest of the observation
period. As an overalL the relationships between these variables are i nconsistent.
v
Abstrak tesis yang dikemukakan kepada Senat Universiti Putra Malaysia sebagai memenuhi keperluan untuk ijazah Master Sains
KAJIAN MEN GENAl V ARIASI KUALITI AIR DI LEMBANGAN SUNGAI MELAKA DENGAN MENGGUNAKAN SISTEM MAKLUMAT GEOGRAFI
Oleh
MARRY ANNA LION
Julai 2003
Pengerusi: Profesor Mohd. Ibrahim Hj. Mohamed, Ph.D.
Fakulti: Sains dan Pengajian Alam Sekitar
Selat Melaka terkenal dengan kepentingannya sebagai laluan air yang paling sibuk di
dunia. Profail alam sekitar di Selat Melaka menunjukkan bahawa terdapat desakan
ekosistem tertentu yang disebabkan oleh luahan pencemaran. Bahan-bahan
pencemar daripada daratan adalah berkemungkinan sebagai pendesak utama kepada
masalah alam sekitar. Sisa buangan daripada aktiviti pertanian, industri dan
domestik dibuang secara langsung ke dalam perairan atau secara tidak langsung
melalui sungai-sungai yang mengalir ke perairan Setat Melaka. Memandangkan ini
melibatkan punca pencemaran daratan maka kajian ke atas keadaan pencemaran di
lembangan sungai adalah penting. Lembangan Sungai Melaka merupakan salah satu
sungai yang mengalir ke Selat Melaka.
vi
mengenalpasti perhubungan di antara variabel -variabel yang terlibat. Untuk tujuan
tersebut, enam parameter telah dipilih termasuklah permintaan oksigen biokimia
(BOD), permintaan oksigen kimia (COD), nitrogen ammonia (AN), pH, bahan
terampai (SS), dan oksigen terlarut (DO). Hasil yang dijangkakan daripada kajian ini
dipersembahkan dalam pelbagai bentuk termasuklah pengkalan data untuk kualiti air,
peta-peta, dan juga graf-graf yang menunjukkan variasi kualiti air sungai.
Kepentingan kajian ini adalah dari segi aplikasi teknologi GIS ke atas pemantauan
kualiti air sungai kerana teknologi memainkan peranan yang sangat penting terhadap
pengurusan alam sekitar yang lebih efektif.
Sebelum ini, kebanyakan data-data alam sekitar disimpan secara manual yang mana
memerlukan ruangan yang banyak. Kaedah ini tidak begitu efisien kerana selain
daripada memerlukan ruang menyimpan yang banyak, ianya juga memerlukan masa
yang panjang untuk mengeluarkan kembali data yang diperlukan untuk tujuan
perancangan dan pengurusan. Dengan adanya teknologi GIS ini yang direka khas
untuk menguruskan data-data ruangan, maka kerja-kerja perancangan dan
pengurusan menjadi lebih mudah dan cepat. Perubahan-perubahan geografi yang
terdapat dalam ruangan dapat dikendalikan dengan lebih tepat dan mudah. Dengan
adanya sistem GIS ini juga, kerja-kerja pemantauan kualiti air sungai menjadi lebih
mudah. Ini kerana satu pengkalan data bole� digunakan untuk menghasilkan
keputusan-keputusan yang dikehendaki. Fungsi-fungsi yang terdapat pada perisian
GIS seperti penyimpanan data, penganalisisan data, serta persembahan data sangat
berguna untuk menunjukkan corak perubahan kualiti air sungai dari setahun ke
setahun. Berdasarkan kajian-kajian yang telah dilakukan di Malaysia dan Negara
Vll
lain, telah terbukti bahawa GIS sangat berfaedah sebagai alat dalam membantu
pemantauan kualiti air sungai.
Kajian di lembangan Sungai Melaka mendapati bahawa kualiti air lebih baik di
kawasan hulu berbanding dengan kawasan hilir. Ini adalah disebabkan oleh
penumpuan aktiviti guna tanah yang lebih banyak di bahagian tengah lembangan
Sungai Melaka. Ini secara tidak langsung telah menambahkan beban pencemaran
sungai. Walaupun diramalkan bahawa terdapat perhubungan di antara parameter
parameter yang terlibat dengan jumlah hujan yang diterima tetapi melalui analisis
korelasi, didapati bahawa tidak terdapat perhubungan langsung yang kuat di antara
kedua-dua variabel ini. Berdasarkan pemerhatian juga, didapati bahawa korelasi yang
baik hanya ditunjukkan oleh DO sahaja. Manakala parameter yang lain tidak
menunjukkan tahap korelasi yang boleh diterima pakai. Jika dilihat pada taburan
setiap parameter, didapati bahawa SS mempunyai nilai taburan yang lebih tinggi
berbanding dengan parameter yang lain. Nitrogen Ammonia (AN) didapati tinggi
pada awal pemerhatian tetapi pad a tahun-tahun seterusnya taburan adalah lebih
konsisten. Secara keseluruhannya, perhubungan di antara variable-variabel tersebut
adalah tidak konsisten.
viii
ACKNOWLEDGEMENTS
First and foremost, I would like to single out the contribution of Professor Dr. Mohd.
Ibrahim Hj. Mohamed, Director of Malacca Straits Research and Development
Centre (MASDEC) and chairman of my supervisory committee, for his persistent
inspiration, constant guidance, wise counsel, encouragement, kindness and various
logistic support throughout the stages of my study. I highly appreciated him for
giving the first hand knowledge about GIS approach in environmental feature which
stimulated my desire to explore more about this interesting area of environmental
engineering. His command on the subject matter together with his research
experiences has been greatly valuable to my study. In spite of his busy schedule, he
made enough time available for me to discuss and provide necessary direction in
order to progress my study. His enthusiasm and patience has left a feeling of
indebtedness, which cannot be fully expressed. I also thank him for the project
financial support during my study.
My deep appreciation and sincere gratitude is also extended to Associate Professor
Dr. Mohd. Kamil Mohd. Yusoff, Director of Professional Environmental Services
and member of the supervisory committee, for his kindly co-operation and thoughtful
suggestion to improve my study. I would like to acknowledge his sincere and
articulate lectures on theories of water quality and water science that enriches my
horizon of knowledge in environmental sciences.
IX
l owe a great deal gratitude and appreciation to Associate Professor Dr. Abdul
Rashid Mohd. Shariff, a member or supervisory committee and Head of Department
in Department of Agriculture Engineering, Faculty of Engineering, UPM for his
supervision and helpful comments to improve my study. I would like to
acknowledge his sincere and articulates lecture on GIS.
This research was made possible through the financial support of the Ministry of
Science, Technology and Environment, Malaysia (IRP A grant), which is highly
appreciated. I would like to acknowledge support from Department of Environment
(DOE), Department of Irrigation, and Drainage (DID), Malaysian Meteorological
Service Department (MMS), Malaysian Center of Remote Sensing (MACRES),
Malacca Local Authority, for various aspects of the project to make it successful.
My special thanks to the Dean, Deputy Deans, and all members of the Faculty of
Science and Environmental Studies for their kind assistance during my study. My
sincere gratitude is also extended to Associate Professor Dr. Khamis Awang, Former
Deputy Dean of the Graduate School for his continuous encouragement. My special
thanks are extended to friends and member of Earth Observation Laboratory
especially to Dr. Takaya Namba, Dr. Mohd. Shahab Uddin, Mr. Musse Gabobe
Hassan, Mr. Jefri Mat Saad, Mr. Najib Ramli, Capt. Hj. Sutarji Hj. Kasmin, Mr. Tan
Chun Knee, Mr. Yip Kit Meng, Mr. Kok Fook Seng, Miss Lee Yoke Lee, Miss
Rohayu Zainuddin, and not forgetting Miss Norzaharah for their constructive
comments and suggestion, kind assistance and co-operation during my study. I am
also thankful to my colleagues at MACRES for their sincere assistance on GIS work.
They are Miss Nomisha Ishak, Norafidah Hamzah, Madam Sheriza Mohd. Razali,
x

and Mr. Abdul Basit Ismail. Also to Mr. Jessel Gabil and Mr. ling Lukman for their
sincere comments and advise on statistical work.
I am enormously indebted to Mr. Peter Dominic for not only being my fiancee but
his true friendship, persistent assistance and support that made my study a reality.
His strong support and fast response whenever I needed his help. He has been
sacrifice most of his time to help me come out with my study.
Last but not least, my heartfelt thankfulness to my families, my father Mr. Lion
Bayuhan, my mother Madam Tineh Tokius, my father and mother in-law, Mr.
Dominic Borumbun and Madam Lily Gabil, Aunties, Uncles, my sibling, Esther,
Mamy, Maslainie, and Hilary Mark for their sacrifices, devotion and understanding
which have always been a source of inspiration and strength throughout my life up to
moment.
Most of all, praise be to almighty God. Had not been merciful, I would not have been
able to retain my patience and continue until the completion of this study. Thanks be
to GOD.
XI
I certify that an Examination Committee met on 23 July 2003 to conduct the final examination of Marryanna Lion on her Master Degree thesis entitled "Water Quality Studies in Malacca River Basin Using Geographic Information Systems (GIS)" in accordance with Universiti Pertanian Malaysia (Higher Degree) Act 1980 and Universiti Pertanian Malaysia (Higher Degree) Regulation 1980. The Committee recommends that the candidate be awarded the relevant degree. Members of the Examination Committee are as folJows:
WAN NOR AZMIN SULAIMAN, Ph. D. Associate Professor Faculty of Science and Environmental Studies Universiti Putra Malaysia (Chairman)
MOHD. mRAIUM HJ. MOIJAMED, Ph.D. Professor Faculty of Science and Environmental Studies Universiti Putra Malaysia (Member)
MOHD. KAMIL MOHD. YUSOF, Ph.D. Associate Professor Faculty of Science and Environmental Studies Universiti Putra Malaysia (Member)
ABDUL RASHID MOHAMED SHARIFF, Ph.D. Associate Professor Faculty of Engineering Universiti Putra Malaysia (Member)
GULAMRUS ProfessorlDepu School of Graduate dies Universiti Putra Malaysia
Date: 04 DEC 2003
xii
This thesis submitted to the Senate of Universiti Putra Malaysia and has been accepted as fulfilment of the requirements for the degree of Master Science. The members of the Supervisory Committee are as follows:
MOHO. IBRAHIM W. MOHAMED, Ph.D. Professor Faculty of Science and Environmental Studies Universiti Putra Malaysia (Chairman)
MOHO. KAMIL MOHO. YUSOF, Ph.D. Associate Professor Faculty of Science and Environmental Studies Universiti Putra Malaysia (Member)
ABDUL RASHID MOHAMED SHARIFF, Ph.D. Associate Professor Faculty of Engineering Universiti Putra Malaysia (Member)
xiii
� �. i:. -# AINI IDERIS, Ph.D. ProfessorlDean School of Graduate Studies Universiti Putra Malaysia
DECLARATION
1 hereby declare that the thesis is based on my original work except for quotations and citations, which have been duly acknowledged. I also declare that it has not been previously or concurrently submitted for any other degree at UPM or other institutions.
Date: 3/\?-/200 3
xiv
TABLE OF CONTENTS
Page
DEDI('AnON ABSTRACT
11 111 VI IX
xn XIV
ABSTRAK
ACKNOWLEDGEMENTS
APPROVAL
DECI,ARATION
LIST OF TABLES X V 111 XIX xxi
LIST OF FIGURES
LIST OF ABBREVIA nONS
CHAPTER
I INTRODUCTION
II
1.1 Background I 2 Problem Statement 1.3 Significance of Study 1 .4 Objectives
LITERATITRE REVIEW
1
3 6 7
8
2.1 Watcr Quality 8
2.2 Surfacc Water Quality 9 2.3 The GIS Model for Water Quality Studies 11
2.4 Geographic Resources Analysis Support 11
System (GRASS) Model 2.5 Earth Resources Data Analysis System 12
(ERDAS) Model 2.6 Arclnfo and IDRISI Model 12
2.7 Water Quality Criteria and Standards J 3 2.8 Water Quality Index and River Classification 14 2.9 Water Quality Criteria and Standard in J 6
Other Countries 2.10 Water Quality Parameters J 7
2. t O. J Dissolved Oxygen (DO) 18
2. t 0.2 Chemical Oxygen Demand (COD) J 8 2. to.3 pH 19
2.10.4 Biochemical Oxygen Demand (BOD) 19
2.10.5 Ammonia Nitrogen (AN ) 20
2.10.6 Suspended Solid (SS) 20
2.11 Water Quality as a Global Concern 21
2.12 Water Quality Scenario in Malaysia 22
2.13 Current Water Quality Situation in Malacca 26
2.14 Rainfall and Water Quality Linkage 27
xv
III
IV
2.15 Climatic Effect on the Variation of Water Quality 29 2.16 Geograph ic Information Systems (GlS) 30 2.17 The Components of GIS 33 2.18 Data Model in GIS 34 2.19 The Development of GIS 35 2.20 Water Quality Monitoring through GIS 36 2.21 Application of GIS in River Basin 38
Information Management and Water Quality Studies
2.22 GIS Buffer Zone Approach to Studying 42
Land Use Impact on River Water Quality
METHODOLOGY
3.1 Research Approach 3.2 Description of the Study Area 3.3 Datasets 3.4 Conversion or Spatial Data and Attribute Input 3.5 Database Design 3.6 Rainfall Contour Interpolation 3.7 Spatial Analysis 3.8 Buffering of Water Quality Stations and River 3.9 Rainfall and Pollution Risk Analysis 3.10 Statistical Analysis 3.11 Material and Equipment
RESUl_T AND DISClJSSJONS
4.1 Water Quality Database for MaJacca River Basin 4.2 Pollution Mapping for Malacca River Basin 4.3 Water Quality Classification Map
Based on Water Quality Stations 4.4 Buffering of Water Quality Sampling Stations 4.5 River Buffering 4.6 Pollution Risk-River Classification Map 4.7 Rainfall Risk-River Classification Map 4.8 Rainfall Contour 4.9 Spatial Distribution of the Water Quality
Parameter 4.10 Distribution of Water Pollution in Malacca
River basin 4.10.1 Variations in Water Quality Parameters 4.10.2 Variations in Water Quality Index 4.10.3 Seasonal Pattern of Water Quality
Parameters
XVl
44 44 47 50 53 56 58 59 59 60 64 65
66 66 72 75
83 86 87 96
103 107
113
113 136 140

v CONCLlTSION ANn RECOMMENDATION 5.1 Conclusion 5.2 Recommendations
REFERENCES
BIODA TA or AUTHOR
xvii
143 143 145
147
152
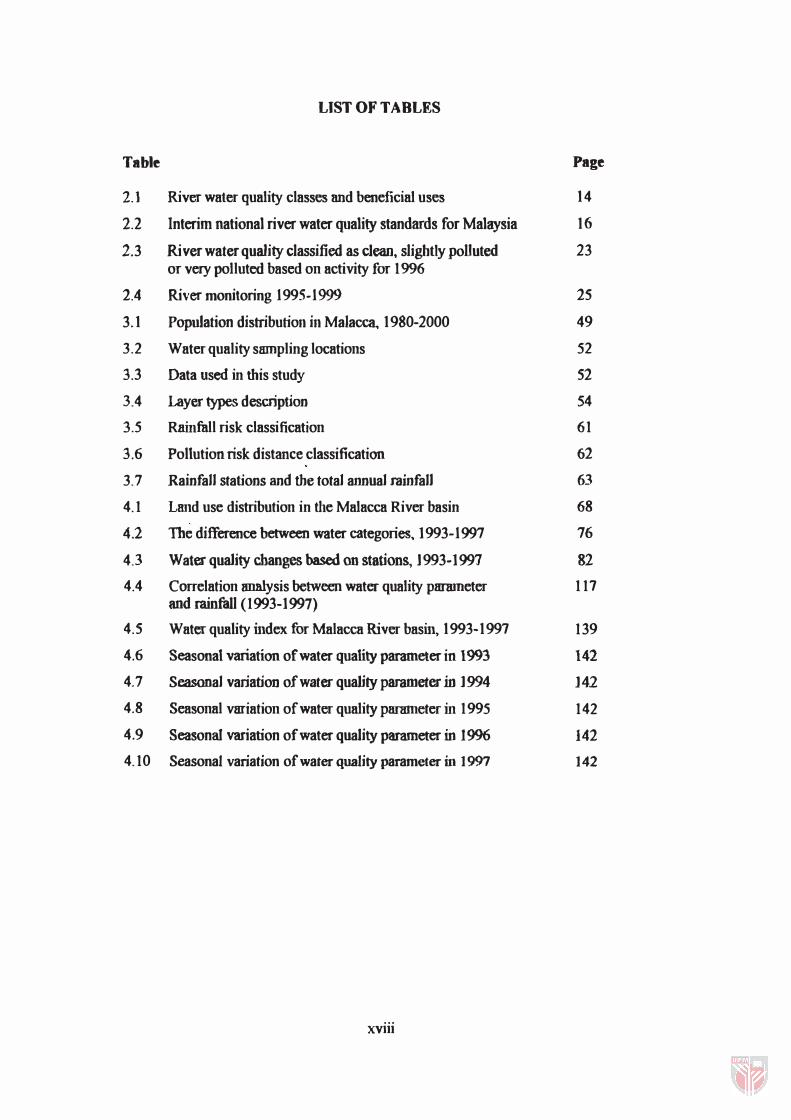
LIST OF TABLES
Table Page
2.1 River water quality classes and beneficial uses 14
2.2 Interim national river water quality standards for Malaysia 16
2.3 River water quality classified as clean, slightly pol1uted 23 or very polluted based on activity for 1996
2.4 River monitoring J 995-J 999 25
3.1 Population distribution in Malacca. 1980-2000 49
3.2 Water quality sampling locations 52
3.3 Data used in this study 52
3.4 Layer � descriprion 54
3.5 Rainfall risk classification 61
3.6 Pollution risk distance classification 62
3.7 Rainfall stations and the total annual rainfall 63
4.1 Land use distribution in the Malacca River basin 68
4.2 The difference between water categories. 1993-J 997 76
4.3 Water quality changes based on storions, J 993-1997 82
4.4 Correlation mmlysis between water quality parameter 117 and rainfall (1993-1997)
4.5 Water quality index for Malacca River basin, 1993-1997 139
4.6 Seasonal variation of water quality parameter in 1993 142
4.7 Seasonal variation of water quality parameter .in ] 994 142
4.8 Seasonal variation of water quality parnmeter in 1995 142
4.9 Seasonal variation of water quality parameter in 1996 142
4.10 Seasonal variation of water quality parameter in 1997 142
xviii
LIST OF FIGURES
Figure Page
2.1 Logical flow chart of the analytical operations within 34 a GIS framework
3.1 The outline of the methodology 46
3.2 The study area 48
3.3 Location of water quality stations in Malacca River basin 51
3.4 Land use map of Malacca River basin 55
3.5 The organization of relational database in this study 58
3.6 The process of buffering in ArcView 3.1 60
3.7 The flow chart of Thiesen analysis in ArcGIS 62
4.1 Database for river in the Malacca River basin 67
4.2 Database of water quality sampling stations in 68
The Malacca River basin
4.3 Database of land use types in the Malacca River basin 69
4.4 Database of pollution point in the Malacca River basin 70
4.5 Database of rainfall for the Malacca River basin 71
4.6 GIS based pollution mapping of the Malacca River basin 73
4.7 Land use activities within the Malacca River basin 73
4.8 Proximity of pollutant sources from the river 74
4.9 Water quality based on station classification map for 1993 77
4.10 Water quality based on station classification map for 1994 78
4.11 Water quality based on station classification map for 1995 79
4.12 Water quality based on station classification map for 1996 80
4.13 Water quality based on station classification' map for 1997 81
4.14 Buffering of water quality stations at a 2km radius 84
4.15 Buffering of water quality stations at a 3km radius 84
4.16 Buffering of water quality stations at a 5km radius 85
4.17 Buffering of the river side 87
4.18a Pollution-River usage risk map 90
4.18b Proximity of the river from pollution point 91
4.19 Pollution-class 1993 risk map 92
4.20 Pollution-class 1994 risk map 93
4.21 Pollution-class 1995 risk map 94
XIX
4.22 Pollution-class 1996 risk map 9S
4.23 Pollution-class 1997 risk map 96
4.24 Rainfall-class 1993 risk map 98
4.25 Rainfall-class 1994 risk map 99
4.26 Rainfall-class 1995 risk map 100
4.27 Rainfall-class 1996 risk map 101
4.28 Rainfall-class 1997 risk map 102
4.29 Rainfall contour for 1993 (mm/year) 104
4.30 Rainfall contour for 1994 (mm/year) 104
4.31 Rainfall contour for 1995 (mm/year) 105
4.32 Rainfall contour for 1996 (mm/year) 105
4.33 Rainfall contour for 1997 (mm/year) 106
4.34 Distribution of water quality parameters in 1993 108
4.35 Distribution of water quality parameters in 1994 109
4.36 Distribution of water quality parameters in 1995 110
4.37 Distribution of water quality parameters in 1996 111
4.38 Distribution of water quality parameters in 1997 112
4.39 Rainfall distribution for 20 month (1993-1 997) 116
4.40 The correlation of determination between BOD and rainfall 118
4.41 BOD versus rainfall in 1993 119
4.42 BOD versus rainfall in 1995 120
4.43 BOD versus rainfall in 1997 120
4.44 The correlation of determination between COD and rainfall 122
4.45 COD versus rainfall in 1993 123
4.46 COD versus rainfall in 1995 123
4.47 COD versus rainfall in 1997 124
4.48 The correlation of determination between DO and rainfall 125
4.49 DO versus rainfall in 1993 126
4.50 DO versus rainfall in 1995 126
4.51 DO versus rainfall in 1997 127
4.52 The correlation of determination between AN and rainfall 128
4.53 AN versus rainfall in 1993 129
4.54 AN versus rainfall in 1995 129
4.55 AN versus rainfall in 1997 130
4.56 The correlation of determination between SS and rainfall 131
xx
4.57 SS versus rainfall in 1993 132
4.58 SS versus rainfall in 1995 1 32
4.59 SS versus rainfall in 1997 133
4.60 The correlation of determination between pH and rainfall 134
4.6] pH versus rainfall in 1993 134
4.62 pH versus rainfall in 1995 135
4.63 pH versus rainfall in 1 997 135
4.64 Water quality index for the Malacca river basin, 1993-1997 138
XXI
AGNPS AN ASMA BOD CHRIS COD DANCED OEM DID DO DOE EMC EPA EPIC ERDAS ESRI GIS GPS GRASS INWQS IRIS LDC's MACRES MMS NE NPS NSF NTU PDI PH PM PPM RSO SOM SS sw TSS WQ WQI
LIST OF ABBREVIATIONS
Agricultural Non-Point Source Pollution Ammoniacal Nitrogen Alam Sekitar Malaysia Sdn. Bhd. Biochemical Oxygen Demand Chemical Hydrologic Resource Information System Chemical Oxygen Demand Danish Cooperation for Environmental and Development Digital Elevation Model Department of Irrigation and Drainage Dissolved Oxygen Department of Environmental Estimated Mean Concentration Environmental Protection Agency Erosion Productivity Impact Calculator Earth Resources Data Analysis System Environmental System Research Institute Geographical Information Systems Global Positioning System Geographic Resources Analysis Support System Interim National Water Quality Standards Integrated River Information System Less Developed Country Malaysian Centre of Remote Sensing Malaysian Meteorological Services North East Non Point Source National Sanitary Foundation Nephelometric Turbidity Unit Prevalence Number of Miles of Stream in the River Being Considered Percentage of Hydrogen Demand Peninsular Malaysia Particulate Per Meter Rectified Skew Orthomorphic Straits of Malacca Suspended Solid South West Total Suspended Solid Water Quality Water Quality Index
xxi
1.1 Background
CHAPTERl
INTRODUCTION
Water. is a vital and precious resource and arguably Malaysia's most
important renewable resources. Plants, anima1s, and fish depend on water of
adequate quantity and quality for their survival. Good water is vital for urban
supply, agriculture. industry, and reaeation. Devdopmeot bas bad an impact on
our national water resources, changing both quantity and quality. These changes
affect the long-tenn viability of the resource and the aquatic ecosystems. Future
generations of Malaysians will rely on these same water resources for their
existence. As a developing counby, Malaysia is striving towards industrial
development especiaDy in the oil and chemical-based industries. This may cause
large amounts of oil and chemical compounds discharge into rivers, estuaries and
finally into our coastal water.
This research will be carried out as a response to the environmental
problems in Malaysia The Malacca River bad been labeled as one of the less
productive rivers in Malaysia due to its pollution concent:mtion, which originated
from the nearest land use activities (Maheswaran, et. 01. 1980). This bas shown us
that our environment bas experienced deterioration. Mitigations action must be
taken up due to the importance of the enviromnent for not only hwnans but also
other living things.
1
Aidah ( 1 99 1 ) mentioned that in Malacca, water demand is high. It is
known that the population in the Malacca state is the second highest in Malaysia
after Penang with the highest concentration in Malacca city which has a high level
of water consumption. Basically, water supplies in Malacca is managed by the
Malacca Water Board (Lembaga Air Melaka), which was establish in 1 97 1 . The
Malacca River is the most important river as it supplies 80 % of the raw water
resources to the state of Malacca (DID Malacca, 2002). According to the report
from the Department of Irrigation and Drainage, Malacca, rapid development has
resulted in the degradation of water quality. It was found that the water contained
bacteria, chemical constituents, heavy metals, and etc. The study conducted by
the Department of Environment in co-operation with the Danish Cooperation for
Environmental and Development (DANCED) found that the Malacca River had to
be categorized as a polluted river. The Federal government had gazetted about
RM6. 5 billion for the Malacca River Rehabilitation project through the
Department of Irrigation and Drainage Malaysia. The government of Denmark
had also supported by providing a technology transfer as well as the equipment,
which cost about RM 4.0 billion.
According to Pauziah ( 1 983), changes in water quality always associated
with land use patterns. Various land uses such as residential, and industrialization
contribute several pollutants to surface and ground water via different pathway.
In urban areas, industrials and domestic waste has known to contribute to the
major rise in Biochemical Oxygen Demand (BOD) and Chemical Oxygen
Demand (COD) concentrations. The local authorities of Malacca have been
identifying the major pollutant sources which includes of industrial effluents,
2